 Huseyin Gedik1*
 Tan Hoang Nguyen2
 Roseann E. Peterson3,4
 Christos Chatzinakos5,6
 Vladimir I. Vladimirov7
 Brien P. Riley2
 Silviu-Alin Bacanu2
- 1Integrative Life Sciences, Virginia Institute of Psychiatric and Behavioral Genetics, Virginia Commonwealth University, Richmond, VA, United States
- 2Department of Psychiatry, Virginia Institute for Psychiatric and Behavioral Genetics, Virginia Commonwealth University, Richmond, VA, United States
- 3Institute for Genomics in Health, SUNY Downstate Health Sciences University, Brooklyn, NY, United States
- 4Department of Psychiatry and Behavioral Sciences, SUNY Downstate Health Sciences University, Brooklyn, NY, United States
- 5Stanley Center for Psychiatric Research, Broad Institute of MIT and Harvard, Cambridge, MA, United States
- 6Department of Psychiatry, McLean Hospital and Harvard Medical School, Belmont, MA, United States
- 7Department of Psychiatry, College of Medicine, University of Arizona Phoenix, Phoenix, AZ, United States
Neuropsychiatric and substance use disorders (NPSUDs) have a complex etiology that includes environmental and polygenic risk factors with significant cross-trait genetic correlations. Genome-wide association studies (GWAS) of NPSUDs yield numerous association signals. However, for most of these regions, we do not yet have a firm understanding of either the specific risk variants or the effects of these variants. Post-GWAS methods allow researchers to use GWAS summary statistics and molecular mediators (transcript, protein, and methylation abundances) infer the effect of these mediators on risk for disorders. One group of post-GWAS approaches is commonly referred to as transcriptome/proteome/methylome-wide association studies, which are abbreviated as T/P/MWAS (or collectively as XWAS). Since these approaches use biological mediators, the multiple testing burden is reduced to the number of genes (∼20,000) instead of millions of GWAS SNPs, which leads to increased signal detection. In this work, our aim is to uncover likely risk genes for NPSUDs by performing XWAS analyses in two tissues—blood and brain. First, to identify putative causal risk genes, we performed an XWAS using the Summary-data-based Mendelian randomization, which uses GWAS summary statistics, reference xQTL data, and a reference LD panel. Second, given the large comorbidities among NPSUDs and the shared cis-xQTLs between blood and the brain, we improved XWAS signal detection for underpowered analyses by performing joint concordance analyses between XWAS results i) across the two tissues and ii) across NPSUDs. All XWAS signals i) were adjusted for heterogeneity in dependent instruments (HEIDI) (non-causality) p-values and ii) used to test for pathway enrichment. The results suggest that there were widely shared gene/protein signals within the major histocompatibility complex region on chromosome 6 (BTN3A2 and C4A) and elsewhere in the genome (FURIN, NEK4, RERE, and ZDHHC5). The identification of putative molecular genes and pathways underlying risk may offer new targets for therapeutic development. Our study revealed an enrichment of XWAS signals in vitamin D and omega-3 gene sets. So, including vitamin D and omega-3 in treatment plans may have a modest but beneficial effect on patients with bipolar disorder.
1 Introduction
Genome-wide association studies (GWAS) have identified numerous loci associated with neuropsychiatric and substance use disorders (NPSUDs). Furthermore, the risk loci of NPSUDs have not been fully discovered (Owen and Williams, 2021). For instance, the largest GWAS for schizophrenia (SCZ) found 287 independent loci and estimates that the common variants explain only 24% of the phenotypic variance (Trubetskoy et al., 2022). Similarly, other NPSUD GWAS yield large numbers of genome-wide significant signals (Howard et al., 2019; Nievergelt et al., 2019; Sanchez-Roige et al., 2019; Mullins et al., 2021) that capture a statistically significant but small proportion of the phenotypic variance. Since most genome-wide significant signals reside in non-protein coding genomic regions (Edwards et al., 2013), the interpretation of these GWAS findings are not straightforward. Performing post-GWAS analyses that infer associations between genes or molecular pathways and traits could significantly advance our understanding of these GWAS signals.
Associated variants are thought to influence risk through altered gene regulation, e.g., via changes in the RNA levels, protein abundance, or epigenetic markers. This assumption is supported by empirical studies of quantitative locus mapping, which found that expression quantitative trait loci (eQTL) (Ongen et al., 2017), protein QTL (pQTL) (Robins et al., 2021), and methylation QTL (mQTL) (Hannon et al., 2016) colocalize with disease-associated loci. However, while there are many well-powered GWAS scans of NPSUDs (Pardiñas et al., 2018; Demontis et al., 2019; Grove et al., 2019; Howard et al., 2019; Nievergelt et al., 2019; Watson et al., 2019; Johnson et al., 2020; Polimanti et al., 2020; Mullins et al., 2021; Trubetskoy et al., 2022), none of these studies directly assayed the transcriptome, proteome, or methylome for their cohorts.
However, researchers found ways around this assessment limitation in GWAS cohorts. They assembled large blood and brain reference molecular e/p/mQTL (henceforth denoted as xQTL) datasets that are publicly available (Sun et al., 2018; van der Wijst et al., 2020; Yang C. et al., 2021; Ferkingstad et al., 2021; Võsa et al., 2021; Zhang et al., 2021). Researchers have developed methods to integrate these molecular xQTL data and GWAS summary statistics to impute the association between phenotypes and molecular mediators (transcriptome, proteome, and methylome). Such analyses are widely referred to as transcriptome-wide association studies (TWAS), proteome-wide association studies (PWAS), and methylome-wide association studies (MWAS) (Gamazon et al., 2015; Gusev et al., 2016; Zhu et al., 2016; Barbeira et al., 2018; Barbeira et al., 2019; Hu et al., 2019; Nagpal et al., 2019; Bae et al., 2021)—henceforth collectively referred to as XWAS. Moreover, since they directly model relevant biological mediators, these approaches could identify putatively causal genes (Wainberg et al., 2019). Until recently, XWAS analyses of NPSUDs were mostly TWAS (Zhu et al., 2016; Niu et al., 2019; Hammerschlag et al., 2020; Kapoor et al., 2021). However, PWAS analyses are also increasing in number with the expanding pQTL reference data in the brain (Wingo et al., 2021; Wingo et al., 2022). In addition to the transcriptome and proteome, the methylome has also been investigated as a mediator (Perzel Mandell et al., 2021; Shen et al., 2022). Recently, MWAS yielded significant genes for NPSUDs (Sugawara et al., 2018; Aberg et al., 2020; Howard et al., 2022).
Changes in gross anatomical and cell type-specific phenotypes have been observed for NPSUDs and associated risk alleles via in vitro and post-mortem studies (Brennand et al., 2012; Schrode et al., 2019; Zhang et al., 2020). Functional genomic profiles differ by cell type (Marstrand and Storey, 2014; Buenrostro et al., 2015), and cell type composition differs across brain regions (Wang et al., 2018). In addition, different neuronal cell types have different functional profiles and different distributions across regions (Kelley et al., 2018). Genetic variants contributing to the heritability of certain NPSUDs were enriched in cis-regulatory elements that are specific to GABAergic and glutamatergic neurons (Sanchez-Priego et al., 2022). Thus, integrating cell type-specific xQTL with GWAS findings is very promising. However, due to expense and other factors, sample sizes for functional profiles in specific cell types across brain regions are still small (Spaethling et al., 2017; Bryois et al., 2022) and limited in detection power. Consequently, most functional genomics data available to support xQTL mapping studies come from bulk brain tissue (GTEx Consortium, 2020) rather than a single cell (Bryois et al., 2022) or sorted cell types (Aygün et al., 2021), and despite their limited cellular resolution, the use of bulk tissue and meta-analysis across tissues is currently still more powerful.
To conduct an XWAS, two common approaches, TWAS (Gusev et al., 2016) and PrediXcan (Gamazon et al., 2015), have been used, with both requiring pre-computing of SNP weights from xQTL datasets. To avoid LD confounding, these XWAS tools also require a subsequent fine-mapping step—e.g., TWAS-FOCUS (Mancuso et al., 2019). In contrast, Mendelian randomization (MR)-based methods (Zhu et al., 2016; Yuan et al., 2020; Zhou et al., 2020) do not require the pre-computation of SNP weights and test for inference in a two-step regression framework. Among MR-based XWAS methods, summary-data-based Mendelian randomization (SMR) is among the most commonly used methods (Zhu et al., 2016). It has the advantage of providing users with a heterogeneity in dependent instruments (HEIDI) test to filter out non-causal loci that may be just in linkage with causal signals.
There is widespread comorbidity among NPSUDs (Plana-Ripoll et al., 2019). This is in part due to shared genetic risk factors (Lee et al., 2019), e.g., as detected by the genetic correlation (rG) in cross-trait analyses (Brainstorm Consortium et al., 2018). Consequently, it is possible that there could be many shared XWAS signals among NPSUDs. This supports the joint analysis of NPSUDs to potentially increase detection power, especially for underpowered disorders (Turley et al., 2018; Gleason et al., 2020; Taraszka et al., 2022). Additionally, there is significant concordance of cis-eQTL and cis-mQTL effects between blood and the brain (Qi et al., 2018), and more than 70% of cis-pQTL are shared between blood and the brain (Yang C. et al., 2021). Moreover, the direction of effects across most tissues for shared eQTLs is the same (GTEx Consortium, 2015). Consequently, given the high comorbidities between traits and xQTL concordance between tissues, a joint analysis of the XWAS results from all traits and tissues would likely help uncover novel signals, especially for relatively underpowered NPSUDs and tissues (e.g., brain).
In this study, we used SMR to perform blood and brain XWAS of NPSUDs to identify potential molecular mediators for these disorders. To increase signal detection in underpowered disorders and tissue (brain), we leveraged comorbidities between NPSUD and cis-xQTL cross-tissue agreement in a joint trait/tissue concordance analysis. Subsequent analyses of XWAS signals were used to uncover putative risk loci and pathways, shedding light on the etiology of NPSUDs.
2 Materials and methods
2.1 Statistical method
We performed univariate XWAS analyses for nine NPSUDs [attention-deficit and hyperactivity disorder (ADHD), autism spectrum disorder (ASD), alcohol use disorder (AUD), bipolar disorder (BIP), cannabis use disorder (CUD), major depressive disorder (MDD), opioid use/dependence disorder (OD), post-traumatic stress disorder (PTSD), and schizophrenia (SCZ)] (Table 1) for three XWAS paradigms (TWAS, PWAS, and MWAS) and two tissues (blood and brain). For this purpose, we used SMR (v.1.03) (Zhu et al., 2016) to infer the association between the transcriptome/proteome/methylome and NPSUDs. We performed SMR analysis for GWAS of NPSUDs (Table 1) using external xQTL reference datasets (Table 2). To prioritize genes and perform pathway analyses, we adjusted the probe (RNA/protein/CpG) SMR p-value (
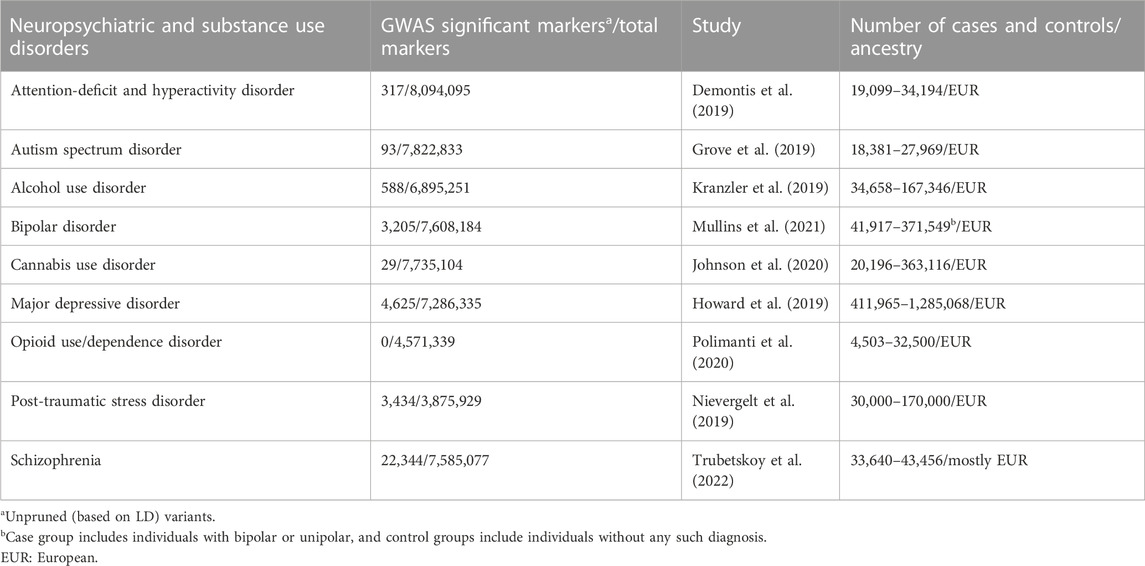
TABLE 1. Summary statistics of eight major PGC GWAS and MVP AUD GWAS.
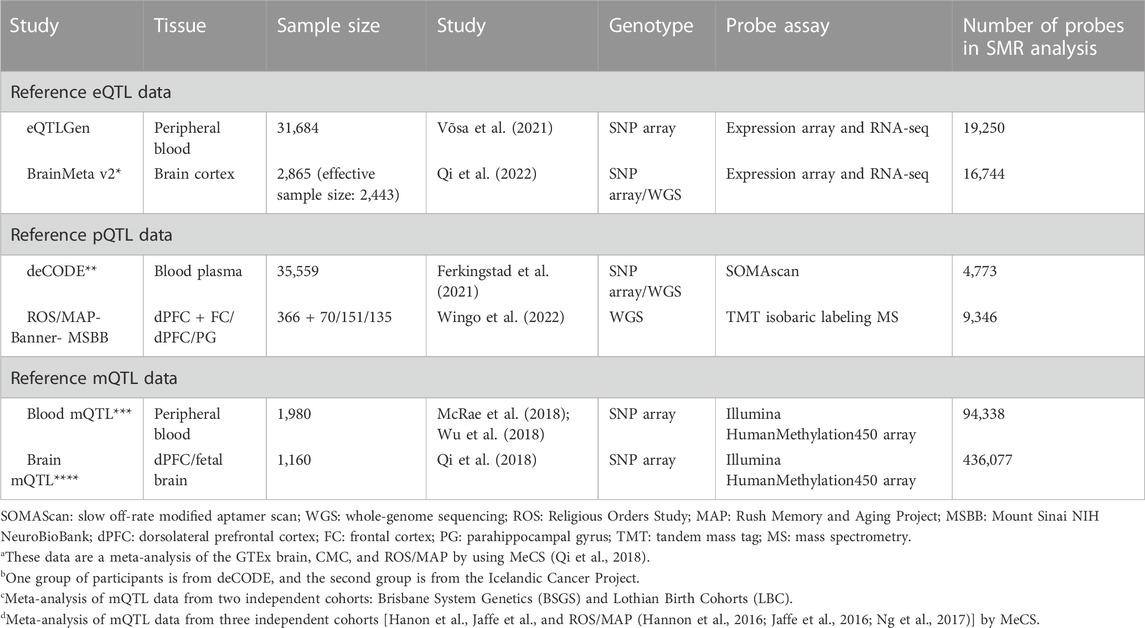
TABLE 2. Reference xQTL molecular datasets used for XWAS studies.
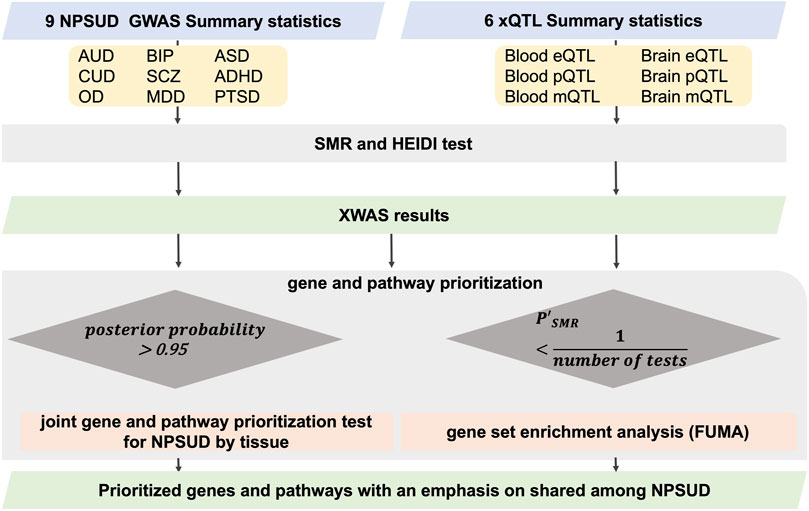
FIGURE 1. Flowchart of SMR XWAS analyses paired in both blood and brain tissues. To penalize for heterogeneity (non-causality), we employed an adjusted probe p-value [
2.2 Parameters for SMR-based XWAS analyses
SMR analyses were performed only for cis-xQTLs (SNPs with p-value < 5 × 10⁻⁸ within 2 Mbp of the probe). We also used the default maximum (20) and minimum (3) number of xQTLs selected for the HEIDI test. We set the significance threshold as < 1.57 × 10⁻³ for the HEIDI test p-values and the mismatch of minimum allele frequency among input files as < 15%. For the HEIDI test, SNPs with LD > 0.9 and <0.05 with the top associated xQTL SNPs were pruned. In case-control studies, we log-transformed the odds ratio as suggested by the SMR analysis guidelines (https://yanglab.westlake.edu.cn/software/smr/#SMR&HEIDIanalysis, accessed on 3 August 2022).
2.3 Neuropsychiatric and substance use disorder GWAS
All summary statistics except for AUD (Table 1) were downloaded from the Psychiatric Genomics Consortium (PGC; web portal (https://www.med.unc.edu/pgc/download-results/, accessed on 15 December 2022). For the AUD GWAS summary statistics, we had access to the data granted through NIH from the Million Veteran Program (MVP) (dbGaP Study Accession: phs001672. v6. p1). For SMR analysis, GWAS summary statistics were processed into the SMR-ready file format. The positions for all variants and genes in the input files (LD reference panel, GWAS summary statistics, and xQTL summary statistics files) for the SMR analysis were based on the GRCh37/hg19 reference genome.
2.4 Molecular xQTL reference datasets
For our analyses, to obtain the highest signal detection, we selected the largest publicly available blood and brain xQTL datasets (Table 2). When pQTL summary statistics from the reference data were not available (blood and brain pQTL) in the SMR-required input binary file format (i.e., .besd), we processed them into this . besd format. In the following sections, we provide some of the most relevant details for these datasets (a list of URLs for each dataset is given in Supplementary Table S1, and more details are given in Supplementary Material).
2.4.1 eQTL reference datasets
For TWAS, we obtained the blood eQTL data from eQTLGen (Võsa et al., 2021) and brain eQTL from BrainMeta v2 (Qi et al., 2022) (Table 2). The eQTLGen consortium meta-analyzed 31,684 samples from 37 different study cohorts. Genotyping and gene expression levels were assayed mainly from whole blood (34 out of 37) and part peripheral blood mononuclear cells (3 out of 37). Most cohorts (25 out of 37) were population based. The following eQTLGen studies included individuals of non-European ancestry (e.g., the Singapore Systems Immunology cohort—n = 115; Morocco—n = 175; Bangladeshi Vitamin E and Selenium Trial—n = 1,404). eQTLGen inferred cis-eQTL effects for 16,987 expression genes (eGenes). BrainMeta (version 2) provided a meta-analysis of brain eQTL mapping studies from seven independent cohorts (Qi et al., 2022). The study consisted of 2,443 unrelated individuals of European ancestry. BrainMeta v2 detected 1,962,114 eQTL SNPs for 16,744 eGenes.
2.4.2 pQTL reference datasets
For the PWAS, we used the blood pQTL data from deCODE (Ferkingstad et al., 2021) and brain pQTL from Wingo et al. (2022) (Table 2). The deCODE proteome study consisted of 35,559 individuals from Iceland. Blood plasma samples were assayed for 4,907 probes [slow off-rate modified aptamer scan (SOMAScan) (Gold et al., 2010; 2012) assay version 4 aptamers], which correspond to 4,719 unique proteins.
The brain pQTL study sampled three regions of the brain, prefrontal cortex, dorsolateral prefrontal cortex, and parahippocampal gyrus (Wingo et al., 2022), in 722 samples. It used the isobaric tandem mass tag method to assay proteins, and 9,363 of them met the quality control criteria. Although the sample size of the brain pQTL reference data was relatively small, it was still the largest publicly available such study at the time of completion for the analyses.
2.4.3 mQTL reference datasets
For MWAS analyses, we used the blood (McRae et al., 2018; Wu et al., 2018) and brain mQTL datasets (Qi et al., 2018) (Table 2), which were publicly available for downloading from the SMR web portal (https://yanglab.westlake.edu.cn/software/smr/#DataResource, accessed on 28 January 2023). The mQTL data for the brain are a meta-analysis of the mQTL mapping results from three major studies (Hannon et al., 2016; Jaffe et al., 2016; Ng et al., 2017). The methylation assay used in these studies was the Illumina Infinium HumanMethylation450 K array. We used the annotation file provided by the manufacturer to map the CpG probe ids (with “cg” prefix) to the HUGO Gene Nomenclature Committee (HGNC) gene symbol.
2.5 Gene set enrichment analysis
Our aim was to uncover pathways that were associated with NPSUDs. For this purpose, we tested for pathway enrichment in XWAS signals. We performed two separate functional mapping and annotation (FUMA) (v1.41) (Watanabe et al., 2017) gene set enrichment using genes with suggestive signals from the i) TWAS and PWAS combined and ii) MWAS only. We included genes with suggestive adjusted p-values (
2.6 Joint NPSUD concordance analysis of TWAS and MWAS gene signals
To increase the statistical power for the prioritization of genes in underpowered NPSUDs and tissues (such as brain), we used a multitrait and multitissue approach. Therefore, we conducted a joint trait concordance analysis using Primo (R package for integrative multi-omics association analysis) (Gleason et al., 2020) within the more powerful XWAS paradigms (TWAS and MWAS). We did not jointly analyze the PWAS because the brain results were too sparse. We used Primo because it was designed to jointly analyze summary statistics from multiple studies while adjusting for the correlation between datasets (e.g., due to sample overlapping). Gene-level-adjusted p-values from SMR analyses were used as input for the joint trait and tissue concordance analyses. If a gene had multiple p-values, then the Cauchy method (Liu et al., 2019) was used to combine these p-values into one p-value for the gene. Because Primo requires the estimated proportion of statistics (alt_props) coming from the alternative distribution, we exhaustively tested different values for this parameter. We also estimated it directly from the data using a mixture of two distributions. This parameter was critical because more significant results were identified when larger values of alt_probs were used. We finally decided to set alt_probs = 10–3, which was also suggested in the Primo paper (Gleason et al., 2020). For prioritization purposes, we considered genes with posterior probabilities (PP) > 0.95 as significant.
In addition to increasing signal detection in the brain, the joint analysis might open avenues for further investigations. For instance, blood and brain concordant signals might be further studied to be used as proxies for the brain pathology of NPSUDs. It is possible that such blood markers might also have an impact on the diagnosis/prognosis of NPSUDs; i.e., such concordant XWAS signals might have translational implications.
3 Results
In this section, we provided a selection of the common and shared XWAS results. Because the strong signals in the MHC region made the visualization of other findings difficult, we omitted this region from the plots of results from univariate TWAS and PWAS analyses (Figure 1 and Figure 2). Details on the MHC signals for these two paradigms are provided in Supplementary Figures S1, S2. All univariate XWAS results collated by paradigm are available (please see the data availability statement for all results).
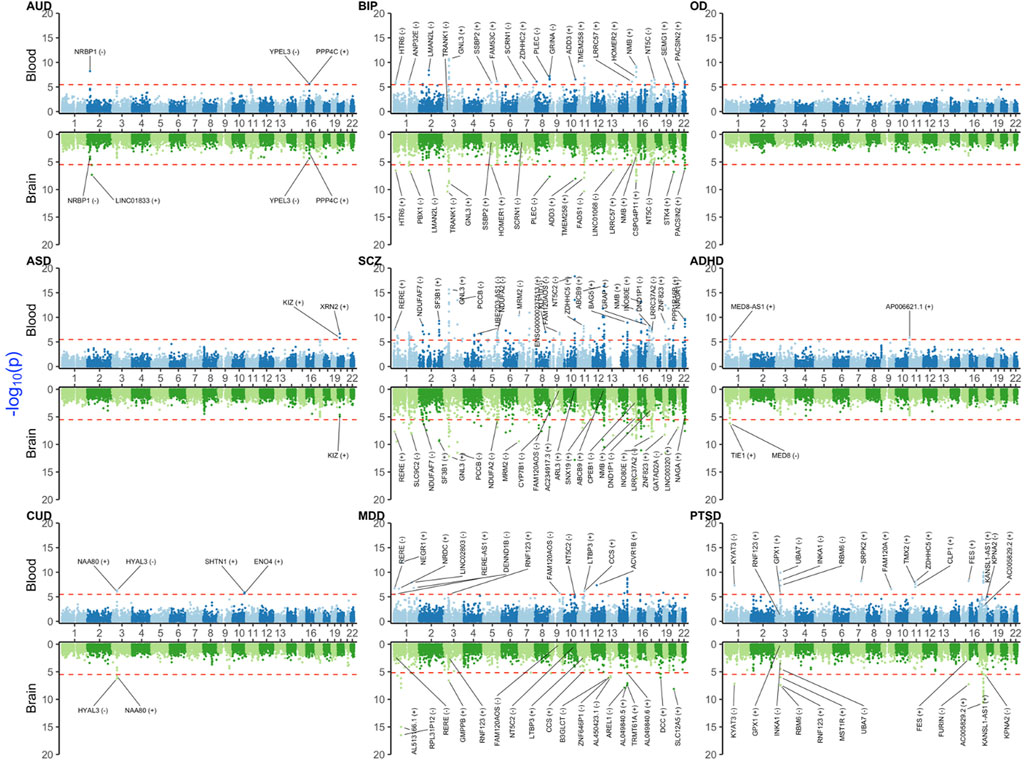
FIGURE 2. Miami plot [Manhattan blood (above)–brain (below) bi-plot] of TWAS-adjusted p-values (
3.1 TWAS results
Blood and brain TWAS for BIP, SCZ, and MDD yielded the highest number of significant TWAS signals (Figure 2 and Supplementary Figure S1). These disorders share many common signals, especially in the major histocompatibility complex (MHC) region on chromosome 6 (25–35 Mbps), e.g., BTN3A2 and C4A, which were concordant (i.e., significant and with the same sign for effect size) between blood and the brain. Other shared signals between three disorders were ATF6B, C4A, FLOT1, IER3, LINC00243, TRIM10, TUBB, TNXA, ZNF602P, and ZSCAN12P1, in blood, and, OR2B8P, ZKSCAN8P1, and ZSCAN16-AS1, in brain.
Among substance use disorders (SUDs), AUD showed significant signals in blood (NRBP1, PPP4C, and YPEL3) and brain (LINC01833). For CUD, HYAL3 and NAA80 on chromosome 3 were significant signals and with a concordant direction of effect between blood and brain. CUD also had significant blood-only signals on chromosome 10 for ENO4 and SHTN1. Probably due to the low sample size, no robust signal was detected for OD.
For ADHD, there were three significant signals from blood (AL139289.1, AP006621.1, and MED8-AS1) and two from brain (MED8 and TIE1). For ASD, there were two significant signals on chromosome 22 (KIZ and XRN2), with KIZ also being suggestive in the brain. For PTSD, there is a cluster of signals on chromosome 17, some of which had a concordant direction of effect between blood and brain (e.g., AC005829.23 and KANSL1-AS1). PTSD also yielded a blood–brain concordant signal for KYAT3.
3.2 PWAS results
The number of PWAS significant signals was lower than that of TWAS signals (Figure 3 and Supplementary Figure S2). This was expected because PWAS had a lower number of probes tested and lower sample size for reference panels, especially for brain tissue. For instance, we did not identify any significant blood or brain PWAS signals for OD, ASD, or CUD. Similar to TWAS, BIP, SCZ, and MDD yielded common signals in the MHC region for blood (BTN3A3, BTN3A1, and MICB—see also Supplementary Figure S2 for more details). NEK4 was a brain-only signal shared between SCZ and BIP.
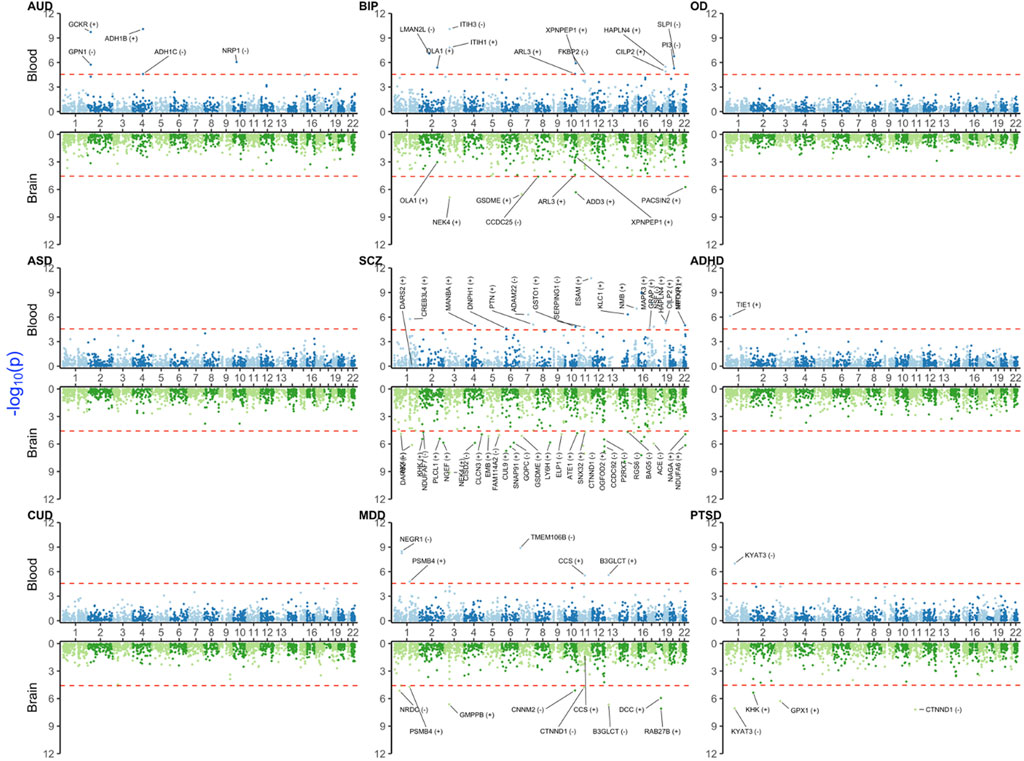
FIGURE 3. Miami plot [Manhattan blood (above)–brain (below) bi-plot] of PWAS-adjusted p-values (
For PTSD, significant brain signals were in KYAT3 (also detected in TWAS), CTNND1, GPX1, KHK, and MICB (that was also a common signal with SCZ and MDD). Among these, only KYAT3 was blood–brain concordant for the direction of effect. Some notable disease-specific signals were for ADH1C and ADH1B in AUD blood and TIE1 in ADHD blood PWAS (which was also significant in brain TWAS).
3.3 MWAS results
Notably, MWAS detected biologically significant signals, e.g., ADH1C for AUD in blood. Similar to TWAS and PWAS, we found that BIP, SCZ, and MDD had more significant signals than the remaining disorders (Figure 4 and Supplementary Material). Again, the largest blood–brain concordant signals that were shared between BIP, SCZ, and MDD were in the MHC region, such as BTN3A2, H2AC13, ZNF389, and ZSCAN12L1 for the brain and BTN3A2, DDR1, DPCR1, GTF2H4, H2AC13, HCG9, HIST1H4D, HLA-B, MSH5, PBX2, SFTA2, TRIM15, TRIM26, TRIM27, TRIM31, TRIM40, TUBB, and VARS2 for blood.
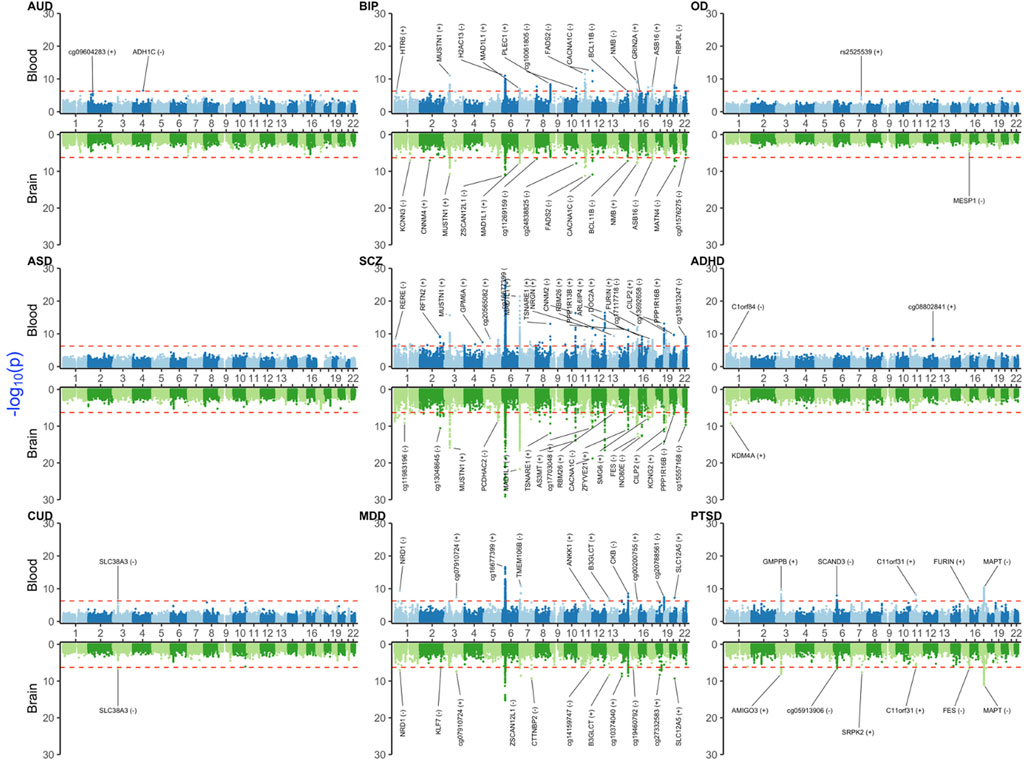
FIGURE 4. Miami plot [Manhattan blood (above)–brain (below) bi-plot] of MWAS-adjusted p-values (
As for PWAS, there were no significant signals for OD or ASD. For CUD, SLC38A3 was a blood–brain concordant signal. ADHD yielded two significant signals on chromosome 1 (C1orf84 in blood and KDM4A in the brain). For PTSD, there were significant blood signals for C11orf31, FURIN, GMPPB, MAPT, and SCAND3. Among these, MAPT and C11orf31 were also concordant between blood and the brain. Other strong PTSD brain signals were AMIGO3, cg05913906, and FES.
3.4 Gene set enrichment analysis results
In this section, we highlighted some selected significant signals from FUMA gene set enrichment. More detailed results are provided in Supplementary Figures S2–S33 and Supplementary Tables S2–S5. Consistent with most other XWAS results, there were no significant findings for OD and CUD. As expected, i) SCZ yielded the highest number of signals (due to its larger sample size in GWAS) and ii) alcohol metabolism pathways showed significant enrichments for AUD.
In the combined TWAS and PWAS signal analysis, BIP-prioritized genes were significantly enriched in non-genomic actions of the 1,25 dihydroxyvitamin D3 gene set (PLCB3, PRKCB, PRKCA, and CD40) (q-value = 3.81 × 10⁻²) (Supplementary Figure S10). Another BIP signal was GWAS catalog gene enrichment for plasma omega-3 polyunsaturated fatty acid levels (alpha-linolenic acid) in brain (MYRF, TMEM258, and FADS1) (q-value = 1.00 × 10⁻³) (Supplementary Figure S12). For the same disorder, GO_HYALURONAN_METABOLIC_PROCESS (ITIH1, ITIH3, and ITIH4) (q-value = 5.67 × 10⁻³) was the most significant Gene Ontology (GO) term in the Biological Process category (Supplementary Figure S13) (more details are given in Supplementary Tables S2, S3.) Peptidase-related GO terms were shared signals between BIP and SCZ (Supplementary Figures S34, S35). Also, neuron-related pathways (GO_SYNAPSE_PART, GO_PRESYNAPSE, and GO_POST_SYNANSE) were significantly enriched for MDD (Supplementary Figures S34, S35).
In the MWAS analysis, SCZ again yielded the most signals. Metabolism of alpha-linolenic acid (omega-3) was one of the significant gene sets for BIP blood MWAS (FADS2, FADS1, and MIR 1908) (q-value = 3.24 × 10⁻⁴) (Supplementary Figure S33). BIP and SCZ shared a signal for cation ion transport-related gene sets (GO_CATION_TRANSPORT and GO_DIVALENT_INORGANIC_CATION_TRANSPORT) (Supplementary Figure S37). Details are given in Supplementary Tables S4, S5.
3.5 Joint analysis for all NPSUD cross-tissues (blood and brain)
TWAS/MWAS results were jointly analyzed for seven NPSUDs (Figure 5), excluding the underpowered OD and CUD due to poor distributions of XWAS p-values vs. Primo PPs. We observed gene signals (PP > 0.95) that were shared between many NPSUDs and between blood and the brain (Figure 5). ZDHHC5 was the most shared signal between blood and the brain for five NPSUDs (ADHD, AUD, MDD, PTSD, and SCZ). There was a cluster of genes that was also shared only between ASD, PTSD, and SCZ, e.g., AC005829.1, KANSL1-AS1, LRRC37A2, MAPK8IP1P1, and MAPK8IP1P2. BIP and SCZ also shared a number of signals (AC006252.1, GLYCTK, GNL3, GOLGA2P7, NMB, and NEK4). However, there were also disease-specific signals, e.g., i) AP006621.3 and PIDD1 for ADHD; ii) ADD3, LMAN2L, and PLEC for BIP; iii) KYAT3 and PLEKHM1 for PTSD; iv) PCCB and GATAD2A for SCZ; and v) LINC02803 for MDD (details are given in Supplementary Table S6).
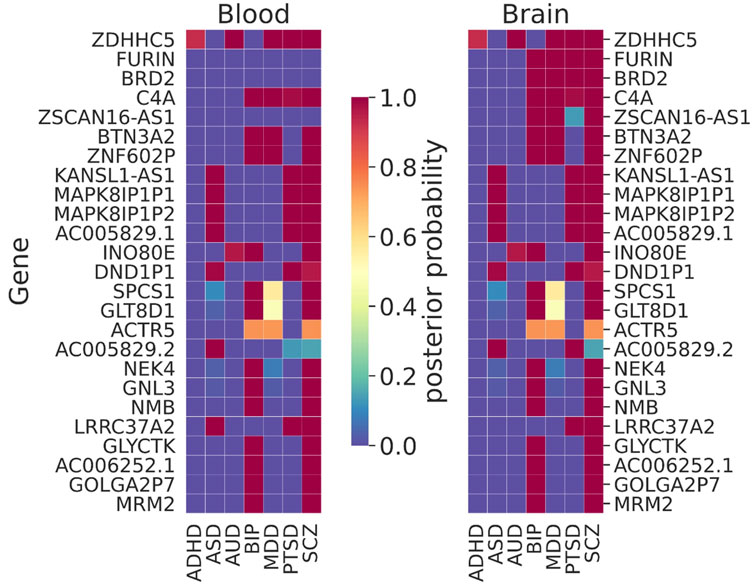
FIGURE 5. Results of the joint trait concordance analysis for TWAS. The top 25 genes are shown as ranked by the sum of the posterior probabilities (PPs) within brain tissue for disorders: ADHD: attention-deficit and hyperactivity disorder; ASD: autism spectrum disorder; AUD: alcohol use disorder; BIP: bipolar disorder; MDD: major depressive disorder; PTSD: post-traumatic stress disorder; and SCZ: schizophrenia.
While often there were very similar patterns of shared TWAS signals between blood and the brain, there were also brain-specific signals. For instance, BRD2, FURIN, and ZSCAN16-AS1 were such brain-only signals that were shared among many disorders [note that FURIN was successfully tested via the CRISPR/Cas9 experiment on isogenic human-induced pluripotent cells for the allelic effect on its gene expression of the SNP with the largest SCZ signal in the region (Schrode et al., 2019)]. There were also both disease- and brain-specific signals, e.g., FTCDNL1 for SCZ observed only in the brain. More disease/tissue-specific signals are given in Supplementary Table S6.
For MWAS, we often observed the same pattern of shared signals between blood and the brain. Among the largest signals (ranked by the sum of PP in the brain) were C11orf31, FURIN, and MED19 that were shared among ADHD, AUD, BIP, MDD, PTSD, and SCZ (Figure 6). GATAD2A stood out as a shared brain-specific signal that was shared by ADHD, ASD, BIP, PTSD, and SCZ. RERE was shared among AUD, MDD, PTSD, and SCZ, which was one of the eGenes for a cis-eQTL associated with SCZ that showed an allele-specific effect via the chromatin interaction (Zhang et al., 2020). More details about the results are given in Supplementary Table S7.
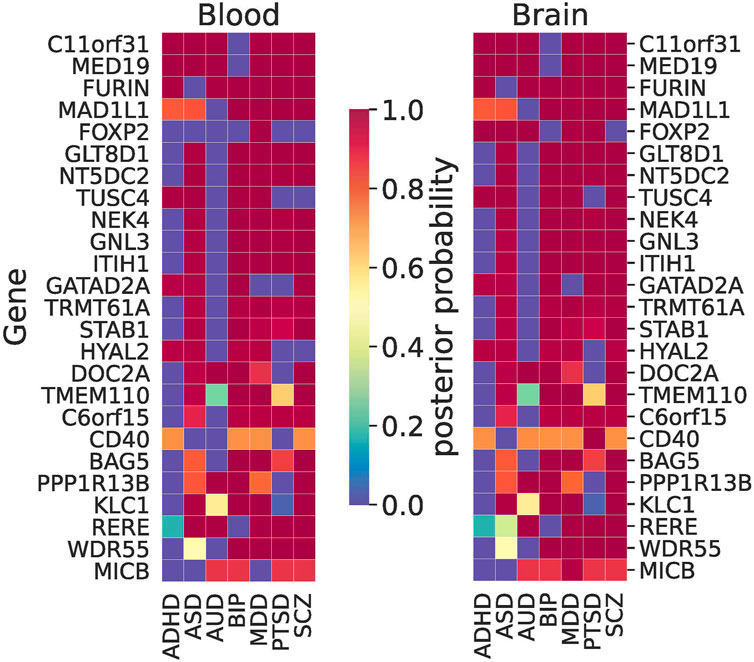
FIGURE 6. Results of joint trait concordance analysis for MWAS. The top 25 genes (excluding probes not mapped to a gene name as per Illumina annotation) are shown and ranked by the sum of brain PPs for all disorders.
3.6 Sensitivity analysis for XWAS findings
To assess the sensitivity of XWAS results to xQTL reference data changes, we performed replication XWAS where such a reference change was possible, i.e., for blood eQTL, blood pQTL, and brain eQTL (Supplementary Table S8). The replication results showed that the majority of signals highlighted in the primary analysis were also replicated for ADHD, AUD, CUD, and PTSD. Overall, the replication results showed a similar pattern to the original findings, i.e., the higher-powered PD GWAS (e.g., BIP, MDD, and SCZ) yielded more XWAS signals than others. For SCZ, between the primary and replication analyses we fully replicated 59 brain TWAS, 36 blood TWAS, and 11 blood PWAS signals. We also provided overlapping XWAS signals between the primary and replication analyses for BIP, MDD, and PTSD, which have a greater number of signals (Supplementary Table S9) (please see data availability statement for all replication results). In conclusion, xQTL replication analysis detected most of the important signals.
4 Discussion
To prioritize putative PD risk genes, we performed XWAS analyses by applying the SMR method to GWAS summary statistics of these disorders. These analyses uncovered putative risk genes by inferring the association between the transcriptome/proteome/methylome and NPSUDs. We subsequently identified molecular pathways associated with NPSUDs via gene set enrichment analyses of genes with XWAS suggestive signals. To improve signal detection power for underpowered traits and brain tissue, we also performed a joint concordance analysis of all the traits and tissues within the two adequately powered XWAS paradigms (TWAS and MWAS). The results of this work suggested possible components of the treatment regimen for certain NPSUDs, e.g., the possible implication of vitamins (B6 and D) and omega-3 pathways for some of these disorders.
Our analyses replicated biologically relevant and previous significant findings. Among the biologically relevant ones, we note that the common signal in AUD between blood PWAS and MWAS was ADH1C, which codes for the alcohol dehydrogenase enzyme that metabolizes alcohol. It was also implicated as significant loci in various GWAS of alcohol-related phenotypes (Gelernter et al., 2014; Clarke et al., 2017; Kranzler et al., 2019). We also replicated the findings of Dall’Aglio et al. (2021) regarding MDD NEGR1 as it was the second most significant gene in our MDD blood TWAS. Similar to our TWAS results, BTN3A2 and RPL31P12 were significant findings in a previous MDD brain TWAS conducted by Yang H. et al. (2021).
In our joint TWAS concordance analyses, ZDHHC5 was the shared signal between all NPSUDs except for ASD and BIP (Figure 5). This gene was previously found to be a shared blood TWAS signal between MDD and SCZ (Reay and Cairns, 2020). In the same paper, some of our other XWAS signals shared between BIP and SCZ (e.g., NEK4, GNL3, and NMB) were also reported as shared TWAS signals in blood. Another shared signal between SCZ, BIP, and AUD was INO80E, which was previously found to be one of the top 10 shared signals between SCZ and AUD (Johnson et al., 2021). A common blood–brain MWAS signal for AUD, MDD, PTSD, and SCZ from the Primo joint analyses was RERE. It was one of the eGenes for a cis-eQTL showing an allele-specific effect via the chromatin interaction (Zhang et al., 2020). The same gene was also implicated as a significant gene in SMR analysis in the recent PGC SCZ GWAS (Trubetskoy et al., 2022).
We compared our joint trait concordance analysis findings for SCZ (brain TWAS + MWAS or brain TWAS only) with PGC3 SCZ GWAS findings. There were common genes identified as significant (PP > 0.95) in our brain tissue results (TWAS + MWAS) and those found in the list of significant replication and discovery loci (Supplementary Table S10) in PGC3 SCZ GWAS, such as BTN3A2, FURIN, GATAD2A, GNL3, INO80E, KANSL1-AS1, and NEK4. However, we found significant signals for AC005829.1, BRD2, C11orf31, C6orf15, DND1P1, MAPK8IP1P1, and ZNF602P, which were not found to be significant in the aforementioned PGC3 SCZ gene list. There were also common genes between our brain TWAS results (from the joint analysis) and the list of genes in PGC SCZ that were prioritized based on the SMR analysis only. Those genes were INO80E, GATAD2A, PCCB, and FURIN. However, our brain results include significant findings that were not identified in PGC3 SCZ, such as BRD2, GNL3, KANSL1-AS1, NEK4, and ZDHHC5 (for details see Supplementary Table S10).
The MHC region is a well-known region associated with some of the NPSUDs, e.g., SCZ (Corvin and Morris, 2014). Our joint XWAS analyses strongly support this assertion for SCZ, BIP, PTSD, and MDD. For instance, BTN3A2 was the leading TWAS signal for BIP, MDD, and SCZ. Also, C4A, thought to be implicated in synaptic pruning (Sekar et al., 2016), was a shared brain TWAS signal for BIP, MDD, PTSD, and SCZ (Figure 5). Similarly, MICB was shared between AUD, BIP, MDD, PTSD, and SCZ in brain MWAS (Figure 6). Its possible involvement in NPSUDs was also supported in empirical research, which showed that MICB is part of a molecular network interacting with the differentially expressed genes in the Brodmann area 9 region of individuals with MDD (Scarr et al., 2019).
In addition to many common signals between NPSUDs, there are also some that are disease specific. For PTSD, we observed specific signals for TWAS/PWAS in a cluster of genes on chromosome 17 and KYAT3 on chromosome 1. KYAT3 was the strongest signal for PTSD brain PWAS. It was reported as a TWAS signal for reexperiencing a PTSD symptom cluster (Pathak et al., 2022). A GWAS on social anxiety also found a SNP that is downstream of KYAT3 to be significant (Stein et al., 2017).
AUD-specific TWAS signals were found on chromosome 2 for NRBP1 and SNX17. A meta-analysis of the Alcohol Use Disorders Identification Test (AUDIT) showed that the index SNP for GCKR overlaps also with the SNX17 (Sanchez-Roige et al., 2019). This same gene was also found significant (p-value = 1.18 × 10⁻⁶; brain caudate basal ganglia) in TWAS of substance use disorder (Hatoum et al., 2022). For ADHD, TIE1 (chromosome 1) is a TWAS/PWAS signal that was not found in other NPSUDs. This gene codes for tyrosine kinase, and it was found as significant in ADHD TWAS (Liao et al., 2019; Chen et al., 2022). For CUD, we also identified concordant blood–brain TWAS signals on chromosome 3, e.g., HYAL3 and NAA80. In another TWAS analysis using the same CUD GWAS (Table 1), another research group also found HYAL3 to be significant (Johnson et al., 2020). Previously, the expression of NAA80 in the brain (anterior cingulate cortex) was associated with the genome-wide significant variant rs2777888 in meta-analyzed European ancestry PTSD GWAS (Gelernter et al., 2019).
Since blood and brain cis-xQTLs were known to overlap, this was used to improve the detection power for brain XWAS analyses through the joint analysis of both tissues. The joint analyses found many candidate risk genes that were concordant in the direction of effect for both tissues. The blood XWAS of these concordant genes could be useful for future development of NPSUD multivariate blood biomarkers that might be used for diagnosis, prognosis, and possible treatment of these disorders.
Supplements such as vitamins and omega-3 have been tested (with varying success rates) as treatment for NPSUDs (Firth et al., 2019). Previous investigations in blood indicated that the deficiency (Anglin et al., 2013) and supplementation (Sarris et al., 2016) of vitamin D might increase/decrease the risk for MDD. Other studies did not find any effect of vitamin D supplementation on MDD (Marsh et al., 2017) and depression in older adults (Okereke et al., 2020). Research implicated reduced depression symptoms with taking vitamin D as a supplement for BIP patients (Cereda et al., 2021). Also, vitamin D-binding protein levels were increased in plasma from adolescents with BIP, which might be associated with the pathology of BIP (Petrov et al., 2018). Omega-3 was also found to likely lower MDD risk (Mocking et al., 2016). A most recent GWAS of polyunsaturated and monounsaturated fatty acids showed significant gene set enrichment of GWAS catalog genes in BIP-I and II (Francis et al., 2022). More recently, a randomized controlled study demonstrated that dietary modifications of increasing the intake of omega-3 fatty acids and decreasing the intake of omega-6 could have an impact on the daily fluctuations of BIP symptoms (Saunders et al., 2022). Nonetheless, it is not clear if these non-genetic/non-MR studies managed to eliminate most possible confounders. However, our analyses eliminated most confounders by using Mendelian randomization methods, such as SMR.
While we did not uncover any vitamin-associated pathway or gene signal for MDD, our analyses indicated a possible link between such supplements and BIP/PTSD. For instance, BIP TWAS and PWAS-prioritized genes showed significant enrichment in a vitamin D3 gene set (Supplementary Figure S10). For BIP, we also found significant enrichment in omega-3-associated gene sets for the combined T/PWAS (Supplementary Figure S11) and MWAS-only (Supplementary Figure S36) FUMA analyses. These gene sets included FADS1 and FADS2. These enzymes were shown to take part in the metabolism of essential fatty acids (Lattka et al., 2010). Previous findings from functional (Yamamoto et al., 2023) and genetic association studies (Ikeda et al., 2018; Zhao et al., 2018; Mullins et al., 2021) implicated FADS1 as possible risk loci in BIP. The KYAT3 signal found in PTSD T/PWAS suggests a possible etiological role of vitamin B6 (a cofactor of KYAT3) in this disease. Based on these findings, more clinical research evidence is required to test these molecules as a secondary component of the treatment regimen: i) vitamin D and omega-3 supplementation for BIP and ii) vitamin B6 (or B complex) for PTSD.
The importance of this study is five-fold. First, this was the most powerful XWAS study of NPSUDs because we integrated the largest available xQTL reference data and NPSUD GWAS. Second, we extended these most powerful gene-level XWAS inferences to the pathway level, which suggested some novel avenues for treatment. Third, we further increased the detection power for underpowered traits and tissues via multitrait multitissue joint analyses. Fourth, the joint analyses uncovered blood–brain concordant XWAS signals that, in the future, might form the basis for the development of (multivariate) blood biomarkers for diagnosis/prognosis. Fifth, these joint analyses were the first formal attempt to uncover common signals for multiple disorders and those specific to a single one.
5 Limitations of the study
1. Although we applied the HEIDI test, it is not likely that SMR completely eliminates the horizontal pleiotropy. For instance, an SNP might be xQTL for multiple genes, which violates the assumption that the SNP effect on the trait is mediated only through the tested gene. However, we believe that gene set/pathway inferences are likely to mitigate the confounding effect of this phenomenon from gene-level analysis.
2. While Primo can adjust for the correlations between multiple different studies, it does not correct for the correlation between genes (e.g., which can happen due to the LD of variants or a gene–gene co-expression network). Thus, future studies need to validate the identified genes.
3. Reference brain pQTL has lower sample sizes than the blood pQTL data. This resulted in fewer significant signals for brain PWAS.
4. Some reference xQTL data (e.g., brain proteome) are enriched in individuals with certain neurological disorders.
5. We used 1000 Genomes Project phase three as a reference LD panel that might not be an exact match for the LD patterns from the GWAS cohort. By adjusting
6. Due to extended and irregular LD patterns, findings in certain regions (e.g., MHC) should be interpreted with care.
7. Since we only included xQTL reference data obtained from bulk tissue, any cell type-specific information was not presented in our findings.
Data availability statement
The datasets presented in this study can be found in online repositories. The names of the repository/repositories and accession number(s) can be found at Supplementary Table S1 and all the XWAS results can be found at: https://figshare.com/s/be237c92b04359ebd42a.
Author contributions
HG completed the XWAS analysis and data visualization. THN conducted the joint trait analysis. CC contributed to the GWAS data. VV, BR, and S-AB supervised the study design. All authors contributed to the article and approved the submitted version.
Funding
Research in this work was funded by P50AA022537 (HG, RP, BR, and S-AB), R01MH118239 and R01DA052453 (VV and S-AB), and R01MH125938 and NARSAD grant 28632 PS Fund (RP).
Conflict of interest
The authors declare that the research was conducted in the absence of any commercial or financial relationships that could be construed as a potential conflict of interest.
Publisher’s note
All claims expressed in this article are solely those of the authors and do not necessarily represent those of their affiliated organizations, or those of the publisher, the editors, and the reviewers. Any product that may be evaluated in this article, or claim that may be made by its manufacturer, is not guaranteed or endorsed by the publisher.
Supplementary material
The Supplementary Material for this article can be found online at: https://www.frontiersin.org/articles/10.3389/fgene.2023.1191264/full#supplementary-material
References
Aberg, K. A., Dean, B., Shabalin, A. A., Chan, R. F., Han, L. K. M., Zhao, M., et al. (2020). Methylome-wide association findings for major depressive disorder overlap in blood and brain and replicate in independent brain samples. Mol. Psychiatry 25, 1344–1354. doi:10.1038/s41380-018-0247-6
Anglin, R. E. S., Samaan, Z., Walter, S. D., and McDonald, S. D. (2013). Vitamin D deficiency and depression in adults: Systematic review and meta-analysis. Br. J. Psychiatry 202, 100–107. doi:10.1192/bjp.bp.111.106666
Brainstorm Consortium Anttila, V., Bulik-Sullivan, B., Finucane, H. K., Walters, R. K., Bras, J., et al. (2018). Analysis of shared heritability in common disorders of the brain. Science 360, eaap8757. doi:10.1126/science.aap8757
Aygün, N., Elwell, A. L., Liang, D., Lafferty, M. J., Cheek, K. E., Courtney, K. P., et al. (2021). Brain-trait-associated variants impact cell-type-specific gene regulation during neurogenesis. Am. J. Hum. Genet. 108, 1647–1668. doi:10.1016/j.ajhg.2021.07.011
Bae, Y. E., Wu, L., and Wu, C. (2021). InTACT: An adaptive and powerful framework for joint-tissue transcriptome-wide association studies. Genet. Epidemiol. 2021. doi:10.1002/gepi.22425
Barbeira, A. N., Dickinson, S. P., Bonazzola, R., Zheng, J., Wheeler, H. E., Torres, J. M., et al. (2018). Exploring the phenotypic consequences of tissue specific gene expression variation inferred from GWAS summary statistics. Nat. Commun. 9, 1825. doi:10.1038/s41467-018-03621-1
Barbeira, A. N., Pividori, M., Zheng, J., Wheeler, H. E., Nicolae, D. L., and Im, H. K. (2019). Integrating predicted transcriptome from multiple tissues improves association detection. PLOS Genet. 15, e1007889. doi:10.1371/journal.pgen.1007889
Benjamini, Y., and Hochberg, Y. (1995). Controlling the False discovery rate: A practical and powerful approach to multiple testing. J. R. Stat. Soc. Ser. B Methodol. 57, 289–300. doi:10.1111/j.2517-6161.1995.tb02031.x
Brennand, K., Simone, A., Tran, N., and Gage, F. (2012). Modeling psychiatric disorders at the cellular and network levels. Mol. Psychiatry 17, 1239–1253. doi:10.1038/mp.2012.20
Bryois, J., Calini, D., Macnair, W., Foo, L., Urich, E., Ortmann, W., et al. (2022). Cell-type-specific cis-eQTLs in eight human brain cell types identify novel risk genes for psychiatric and neurological disorders. Nat. Neurosci. 25, 1104–1112. doi:10.1038/s41593-022-01128-z
Buenrostro, J. D., Wu, B., Litzenburger, U. M., Ruff, D., Gonzales, M. L., Snyder, M. P., et al. (2015). Single-cell chromatin accessibility reveals principles of regulatory variation. Nature 523, 486–490. doi:10.1038/nature14590
Cereda, G., Enrico, P., Ciappolino, V., Delvecchio, G., and Brambilla, P. (2021). The role of vitamin D in bipolar disorder: Epidemiology and influence on disease activity. J. Affect. Disord. 278, 209–217. doi:10.1016/j.jad.2020.09.039
Chen, X., Yao, T., Cai, J., Zhang, Q., Li, S., Li, H., et al. (2022). A novel cis-regulatory variant modulating TIE1 expression associated with attention deficit hyperactivity disorder in Han Chinese children. J. Affect. Disord. 300, 179–188. doi:10.1016/j.jad.2021.12.066
Clarke, T.-K., Adams, M. J., Davies, G., Howard, D. M., Hall, L. S., Padmanabhan, S., et al. (2017). Genome-wide association study of alcohol consumption and genetic overlap with other health-related traits in UK Biobank (N=112 117). Mol. Psychiatry 22, 1376–1384. doi:10.1038/mp.2017.153
Corvin, A., and Morris, D. W. (2014). Genome-wide association studies: Findings at the major histocompatibility complex locus in psychosis. Biol. Psychiatry 75, 276–283. doi:10.1016/j.biopsych.2013.09.018
Dall’Aglio, L., Lewis, C. M., and Pain, O. (2021). Delineating the genetic component of gene expression in major depression. Biol. Psychiatry 89, 627–636. doi:10.1016/j.biopsych.2020.09.010
Demontis, D., Walters, R. K., Martin, J., Mattheisen, M., Als, T. D., Agerbo, E., et al. (2019). Discovery of the first genome-wide significant risk loci for attention deficit/hyperactivity disorder. Nat. Genet. 51, 63–75. doi:10.1038/s41588-018-0269-7
Edwards, S. L., Beesley, J., French, J. D., and Dunning, A. M. (2013). Beyond GWASs: Illuminating the dark road from association to function. Am. J. Hum. Genet. 93, 779–797. doi:10.1016/j.ajhg.2013.10.012
Ferkingstad, E., Sulem, P., Atlason, B. A., Sveinbjornsson, G., Magnusson, M. I., Styrmisdottir, E. L., et al. (2021). Large-scale integration of the plasma proteome with genetics and disease. Nat. Genet. 53, 1712–1721. doi:10.1038/s41588-021-00978-w
Firth, J., Teasdale, S. B., Allott, K., Siskind, D., Marx, W., Cotter, J., et al. (2019). The efficacy and safety of nutrient supplements in the treatment of mental disorders: A meta-review of meta-analyses of randomized controlled trials. World Psychiatry 18, 308–324. doi:10.1002/wps.20672
Francis, M., Sun, Y., Xu, H., Brenna, J. T., and Ye, K. (2022). Fifty-one novel and replicated GWAS loci for polyunsaturated and monounsaturated fatty acids medRxiv. doi:10.1101/2022.05.27.22275343
Gamazon, E. R., Wheeler, H. E., Shah, K. P., Mozaffari, S. V., Aquino-Michaels, K., Carroll, R. J., et al. (2015). A gene-based association method for mapping traits using reference transcriptome data. Nat. Genet. 47, 1091–1098. doi:10.1038/ng.3367
Gelernter, J., Kranzler, H. R., Sherva, R., Almasy, L., Koesterer, R., Smith, A. H., et al. (2014). Genome-wide association study of alcohol dependence:significant findings in African- and European-Americans including novel risk loci. Mol. Psychiatry 19, 41–49. doi:10.1038/mp.2013.145
Gelernter, J., Sun, N., Polimanti, R., Pietrzak, R., Levey, D. F., Bryois, J., et al. (2019). Genome-wide association study of post-traumatic stress disorder reexperiencing symptoms in >165,000 US veterans. Nat. Neurosci. 22, 1394–1401. doi:10.1038/s41593-019-0447-7
Gleason, K. J., Yang, F., Pierce, B. L., He, X., and Chen, L. S. (2020). Primo: Integration of multiple GWAS and omics QTL summary statistics for elucidation of molecular mechanisms of trait-associated SNPs and detection of pleiotropy in complex traits. Genome Biol. 21, 1–24. doi:10.1186/s13059-020-02125-w
Gold, L., Ayers, D., Bertino, J., Bock, C., Bock, A., Brody, E. N., et al. (2010). Aptamer-based multiplexed proteomic Technology for biomarker discovery. PLOS ONE 5, e15004. doi:10.1371/journal.pone.0015004
Gold, L., Walker, J. J., Wilcox, S. K., and Williams, S. (2012). Advances in human proteomics at high scale with the SOMAscan proteomics platform. New Biotechnol. 29, 543–549. doi:10.1016/j.nbt.2011.11.016
Grove, J., Ripke, S., Als, T. D., Mattheisen, M., Walters, R. K., Won, H., et al. (2019). Identification of common genetic risk variants for autism spectrum disorder. Nat. Genet. 51, 431–444. doi:10.1038/s41588-019-0344-8
GTEx Consortium (2015). The Genotype-Tissue Expression (GTEx) pilot analysis: Multitissue gene regulation in humans. Science 348, 648–660. doi:10.1126/science.1262110
GTEx Consortium (2020). The GTEx Consortium atlas of genetic regulatory effects across human tissues. Science 369, 1318. doi:10.1126/science.aaz1776
Gusev, A., Ko, A., Shi, H., Bhatia, G., Chung, W., Penninx, B. W. J. H., et al. (2016). Integrative approaches for large-scale transcriptome-wide association studies. Nat. Genet. 48, 245–252. doi:10.1038/ng.3506
Hammerschlag, A. R., Byrne, E. M., Agbessi, M., Ahsan, H., Alves, I., Andiappan, A., et al. (2020). Refining attention-deficit/hyperactivity disorder and autism spectrum disorder genetic loci by integrating summary data from genome-wide association, gene expression, and DNA methylation studies. Biol. Psychiatry 88, 470–479. doi:10.1016/j.biopsych.2020.05.002
Hannon, E., Dempster, E., Viana, J., Burrage, J., Smith, A. R., Macdonald, R., et al. (2016). An integrated genetic-epigenetic analysis of schizophrenia: Evidence for co-localization of genetic associations and differential DNA methylation. Genome Biol. 17, 176. doi:10.1186/s13059-016-1041-x
Hatoum, A. S., Colbert, S. M. C., Johnson, E. C., Huggett, S. B., Deak, J. D., Pathak, G., et al. (2022). Multivariate genome-wide association meta-analysis of over 1 million subjects identifies loci underlying multiple substance use disorders. medRxiv. doi:10.1101/2022.01.06.22268753
Howard, D. M., Adams, M. J., Clarke, T.-K., Hafferty, J. D., Gibson, J., Shirali, M., et al. (2019). Genome-wide meta-analysis of depression identifies 102 independent variants and highlights the importance of the prefrontal brain regions. Nat. Neurosci. 22, 343–352. doi:10.1038/s41593-018-0326-7
Howard, D. M., Pain, O., Arathimos, R., Barbu, M. C., Amador, C., Walker, R. M., et al. (2022). Methylome-wide association study of early life stressors and adult mental health. Hum. Mol. Genet. 31, 651–664. doi:10.1093/hmg/ddab274
Hu, Y., Li, M., Lu, Q., Weng, H., Wang, J., Zekavat, S. M., et al. (2019). A statistical framework for cross-tissue transcriptome-wide association analysis. Nat. Genet. 51, 568–576. doi:10.1038/s41588-019-0345-7
Ikeda, M., Takahashi, A., Kamatani, Y., Okahisa, Y., Kunugi, H., Mori, N., et al. (2018). A genome-wide association study identifies two novel susceptibility loci and trans population polygenicity associated with bipolar disorder. Mol. Psychiatry 23, 639–647. doi:10.1038/mp.2016.259
Jaffe, A. E., Gao, Y., Deep-Soboslay, A., Tao, R., Hyde, T. M., Weinberger, D. R., et al. (2016). Mapping DNA methylation across development, genotype and schizophrenia in the human frontal cortex. Nat. Neurosci. 19, 40–47. doi:10.1038/nn.4181
Johnson, E. C., Demontis, D., Thorgeirsson, T. E., Walters, R. K., Polimanti, R., Hatoum, A. S., et al. (2020). A large-scale genome-wide association study meta-analysis of cannabis use disorder. Lancet Psychiatry 7, 1032–1045. doi:10.1016/S2215-0366(20)30339-4
Johnson, E. C., Kapoor, M., Hatoum, A. S., Zhou, H., Polimanti, R., Wendt, F. R., et al. (2021). Investigation of convergent and divergent genetic influences underlying schizophrenia and alcohol use disorder. Psychol. Med. 2021, 1–9. doi:10.1017/S003329172100266X
Kapoor, M., Chao, M. J., Johnson, E. C., Novikova, G., Lai, D., Meyers, J. L., et al. (2021). Multi-omics integration analysis identifies novel genes for alcoholism with potential overlap with neurodegenerative diseases. Nat. Commun. 12, 5071. doi:10.1038/s41467-021-25392-y
Kelley, K. W., Nakao-Inoue, H., Molofsky, A. V., and Oldham, M. C. (2018). Variation among intact tissue samples reveals the core transcriptional features of human CNS cell classes. Nat. Neurosci. 21, 1171–1184. doi:10.1038/s41593-018-0216-z
Kranzler, H. R., Zhou, H., Kember, R. L., Vickers Smith, R., Justice, A. C., Damrauer, S., et al. (2019). Genome-wide association study of alcohol consumption and use disorder in 274,424 individuals from multiple populations. Nat. Commun. 10, 1499. doi:10.1038/s41467-019-09480-8
Lattka, E., Illig, T., Koletzko, B., and Heinrich, J. (2010). Genetic variants of the FADS1 FADS2 gene cluster as related to essential fatty acid metabolism. Curr. Opin. Lipidol. 21, 64. doi:10.1097/MOL.0b013e3283327ca8
Lee, P. H., Anttila, V., Won, H., Feng, Y.-C. A., Rosenthal, J., Zhu, Z., et al. (2019). Genomic relationships, novel loci, and pleiotropic mechanisms across eight psychiatric disorders. Cell 179, 1469–1482.e11. doi:10.1016/j.cell.2019.11.020
Liao, C., Laporte, A. D., Spiegelman, D., Akçimen, F., Joober, R., Dion, P. A., et al. (2019). Transcriptome-wide association study of attention deficit hyperactivity disorder identifies associated genes and phenotypes. Nat. Commun. 10, 4450. doi:10.1038/s41467-019-12450-9
Liu, Y., Chen, S., Li, Z., Morrison, A. C., Boerwinkle, E., and Lin, X. (2019). Acat: A fast and powerful p value combination method for rare-variant analysis in sequencing studies. Am. J. Hum. Genet. 104, 410–421. doi:10.1016/j.ajhg.2019.01.002
Mancuso, N., Freund, M. K., Johnson, R., Shi, H., Kichaev, G., Gusev, A., et al. (2019). Probabilistic fine-mapping of transcriptome-wide association studies. Nat. Genet. 51, 675–682. doi:10.1038/s41588-019-0367-1
Marsh, W. K., Penny, J. L., and Rothschild, A. J. (2017). Vitamin D supplementation in bipolar depression: A double blind placebo controlled trial. J. Psychiatric Res. 95, 48–53. doi:10.1016/j.jpsychires.2017.07.021
Marstrand, T. T., and Storey, J. D. (2014). Identifying and mapping cell-type-specific chromatin programming of gene expression. Proc. Natl. Acad. Sci. 111, E645–E654. doi:10.1073/pnas.1312523111
McRae, A. F., Marioni, R. E., Shah, S., Yang, J., Powell, J. E., Harris, S. E., et al. (2018). Identification of 55,000 replicated DNA methylation QTL. Sci. Rep. 8, 17605. doi:10.1038/s41598-018-35871-w
Mocking, R. J. T., Harmsen, I., Assies, J., Koeter, M. W. J., Ruhé, H. G., and Schene, A. H. (2016). Meta-analysis and meta-regression of omega-3 polyunsaturated fatty acid supplementation for major depressive disorder. Transl. Psychiatry 6, e756. doi:10.1038/tp.2016.29
Mullins, N., Forstner, A. J., O’Connell, K. S., Coombes, B., Coleman, J. R. I., Qiao, Z., et al. (2021). Genome-wide association study of more than 40,000 bipolar disorder cases provides new insights into the underlying biology. Nat. Genet. 53, 817–829. doi:10.1038/s41588-021-00857-4
Nagpal, S., Meng, X., Epstein, M. P., Tsoi, L. C., Patrick, M., Gibson, G., et al. (2019). Tigar: An improved bayesian tool for transcriptomic data imputation enhances gene mapping of complex traits. Am. J. Hum. Genet. 105, 258–266. doi:10.1016/j.ajhg.2019.05.018
Ng, B., White, C. C., Klein, H.-U., Sieberts, S. K., McCabe, C., Patrick, E., et al. (2017). An xQTL map integrates the genetic architecture of the human brain’s transcriptome and epigenome. Nat. Neurosci. 20, 1418–1426. doi:10.1038/nn.4632
Nievergelt, C. M., Maihofer, A. X., Klengel, T., Atkinson, E. G., Chen, C.-Y., Choi, K. W., et al. (2019). International meta-analysis of PTSD genome-wide association studies identifies sex- and ancestry-specific genetic risk loci. Nat. Commun. 10, 4558. doi:10.1038/s41467-019-12576-w
Niu, H.-M., Yang, P., Chen, H.-H., Hao, R.-H., Dong, S.-S., Yao, S., et al. (2019). Comprehensive functional annotation of susceptibility SNPs prioritized 10 genes for schizophrenia. Transl. Psychiatry 9, 1–12. doi:10.1038/s41398-019-0398-5
Okereke, O. I., Reynolds, C. F., Mischoulon, D., Chang, G., Vyas, C. M., Cook, N. R., et al. (2020). Effect of long-term vitamin D3 supplementation vs placebo on risk of depression or clinically relevant depressive symptoms and on change in mood scores: A randomized clinical trial. JAMA 324, 471–480. doi:10.1001/jama.2020.10224
Ongen, H., Brown, A. A., Delaneau, O., Panousis, N. I., Nica, A. C., and Dermitzakis, E. T. (2017). Estimating the causal tissues for complex traits and diseases. Nat. Genet. 49, 1676–1683. doi:10.1038/ng.3981
Owen, M. J., and Williams, N. M. (2021). Explaining the missing heritability of psychiatric disorders. World Psychiatry 20, 294–295. doi:10.1002/wps.20870
Pardiñas, A. F., Holmans, P., Pocklington, A. J., Escott-Price, V., Ripke, S., Carrera, N., et al. (2018). Common schizophrenia alleles are enriched in mutation-intolerant genes and in regions under strong background selection. Nat. Genet. 50, 381–389. doi:10.1038/s41588-018-0059-2
Pathak, G. A., Singh, K., Wendt, F. R., Fleming, T. W., Overstreet, C., Koller, D., et al. (2022). Genetically regulated multi-omics study for symptom clusters of posttraumatic stress disorder highlights pleiotropy with hematologic and cardio-metabolic traits. Mol. Psychiatry 27, 1394–1404. doi:10.1038/s41380-022-01488-9
Perzel Mandell, K. A., Eagles, N. J., Wilton, R., Price, A. J., Semick, S. A., Collado-Torres, L., et al. (2021). Genome-wide sequencing-based identification of methylation quantitative trait loci and their role in schizophrenia risk. Nat. Commun. 12, 5251. doi:10.1038/s41467-021-25517-3
Petrov, B., Aldoori, A., James, C., Yang, K., Algorta, G. P., Lee, A., et al. (2018). Bipolar disorder in youth is associated with increased levels of vitamin D-binding protein. Transl. Psychiatry 8, 1–10. doi:10.1038/s41398-018-0109-7
Plana-Ripoll, O., Pedersen, C. B., Holtz, Y., Benros, M. E., Dalsgaard, S., de Jonge, P., et al. (2019). Exploring comorbidity within mental disorders among a Danish national population. JAMA Psychiatry 76, 259–270. doi:10.1001/jamapsychiatry.2018.3658
Polimanti, R., Walters, R. K., Johnson, E. C., McClintick, J. N., Adkins, A. E., Adkins, D. E., et al. (2020). Leveraging genome-wide data to investigate differences between opioid use vs. opioid dependence in 41,176 individuals from the Psychiatric Genomics Consortium. Mol. Psychiatry 25, 1673–1687. doi:10.1038/s41380-020-0677-9
Qi, T., Wu, Y., Fang, H., Zhang, F., Liu, S., Zeng, J., et al. (2022). Genetic control of RNA splicing and its distinct role in complex trait variation. Nat. Genet. 2022, 1. doi:10.1038/s41588-022-01154-4
Qi, T., Wu, Y., Zeng, J., Zhang, F., Xue, A., Jiang, L., et al. (2018). Identifying gene targets for brain-related traits using transcriptomic and methylomic data from blood. Nat. Commun. 9, 2282. doi:10.1038/s41467-018-04558-1
Reay, W. R., and Cairns, M. J. (2020). Pairwise common variant meta-analyses of schizophrenia with other psychiatric disorders reveals shared and distinct gene and gene-set associations. Transl. Psychiatry 10, 134. doi:10.1038/s41398-020-0817-7
Robins, C., Liu, Y., Fan, W., Duong, D. M., Meigs, J., Harerimana, N. V., et al. (2021). Genetic control of the human brain proteome. Am. J. Hum. Genet. 108, 400–410. doi:10.1016/j.ajhg.2021.01.012
Sanchez-Priego, C., Hu, R., Boshans, L. L., Lalli, M., Janas, J. A., Williams, S. E., et al. (2022). Mapping cis-regulatory elements in human neurons links psychiatric disease heritability and activity-regulated transcriptional programs. Cell Rep. 39, 110877. doi:10.1016/j.celrep.2022.110877
Sanchez-Roige, S., Palmer, A. A., Fontanillas, P., Elson, S. L., and Adams, M. J. (2019). Genome-wide association study meta-analysis of the alcohol use disorders identification test (AUDIT) in two population-based cohorts. Am. J. Psychiatry 176, 107–118. doi:10.1176/appi.ajp.2018.18040369
Sarris, J., Murphy, J., Mischoulon, D., Papakostas, G. I., Fava, M., Berk, M., et al. (2016). Adjunctive nutraceuticals for depression: A systematic review and meta-analyses. AJP 173, 575–587. doi:10.1176/appi.ajp.2016.15091228
Saunders, E. F. H., Mukherjee, D., Myers, T., Wasserman, E., Hameed, A., Krishnamurthy, V. B., et al. (2022). Adjunctive dietary intervention for bipolar disorder: A randomized, controlled, parallel-group, modified double-blinded trial of a high n-3 plus low n-6 diet. Bipolar Disord. 24, 171–184. doi:10.1111/bdi.13112
Scarr, E., Udawela, M., and Dean, B. (2019). Changed cortical risk gene expression in major depression and shared changes in cortical gene expression between major depression and bipolar disorders. Aust. N. Z. J. Psychiatry 53, 1189–1198. doi:10.1177/0004867419857808
Schrode, N., Ho, S.-M., Yamamuro, K., Dobbyn, A., Huckins, L., Matos, M. R., et al. (2019). Synergistic effects of common schizophrenia risk variants. Nat. Genet. 51, 1475–1485. doi:10.1038/s41588-019-0497-5
Sekar, A., Bialas, A. R., de Rivera, H., Davis, A., Hammond, T. R., Kamitaki, N., et al. (2016). Schizophrenia risk from complex variation of complement component 4. Nature 530, 177–183. doi:10.1038/nature16549
Shen, X., Caramaschi, D., Adams, M. J., Walker, R. M., Min, J. L., Kwong, A., et al. (2022). DNA methylome-wide association study of genetic risk for depression implicates antigen processing and immune responses. Genome Med. 14, 36. doi:10.1186/s13073-022-01039-5
Spaethling, J. M., Na, Y.-J., Lee, J., Ulyanova, A. V., Baltuch, G. H., Bell, T. J., et al. (2017). Primary cell culture of live neurosurgically resected aged adult human brain cells and single cell transcriptomics. Cell Rep. 18, 791–803. doi:10.1016/j.celrep.2016.12.066
Stein, M. B., Chen, C.-Y., Jain, S., Jensen, K. P., He, F., Heeringa, S. G., et al. (2017). Genetic risk variants for social anxiety. Am. J. Med. Genet. Part B Neuropsychiatric Genet. 174, 120–131. doi:10.1002/ajmg.b.32520
Sugawara, H., Murata, Y., Ikegame, T., Sawamura, R., Shimanaga, S., Takeoka, Y., et al. (2018). DNA methylation analyses of the candidate genes identified by a methylome-wide association study revealed common epigenetic alterations in schizophrenia and bipolar disorder. Psychiatry Clin. Neurosci. 72, 245–254. doi:10.1111/pcn.12645
Sun, B. B., Maranville, J. C., Peters, J. E., Stacey, D., Staley, J. R., Blackshaw, J., et al. (2018). Genomic atlas of the human plasma proteome. Nature 558, 73–79. doi:10.1038/s41586-018-0175-2
Taraszka, K., Zaitlen, N., and Eskin, E. (2022). Leveraging pleiotropy for joint analysis of genome-wide association studies with per trait interpretations. PLOS Genet. 18, e1010447. doi:10.1371/journal.pgen.1010447
Trubetskoy, V., Pardiñas, A. F., Qi, T., Panagiotaropoulou, G., Awasthi, S., Bigdeli, T. B., et al. (2022). Mapping genomic loci implicates genes and synaptic biology in schizophrenia. Nature 604, 502–508. doi:10.1038/s41586-022-04434-5
Turley, P., Walters, R. K., Maghzian, O., Okbay, A., Lee, J. J., Fontana, M. A., et al. (2018). Multi-trait analysis of genome-wide association summary statistics using MTAG. Nat. Genet. 50, 229–237. doi:10.1038/s41588-017-0009-4
van der Wijst, M., de Vries, D., Groot, H., Trynka, G., Hon, C., Bonder, M., et al. (2020). The single-cell eQTLGen consortium. eLife 9, e52155. doi:10.7554/eLife.52155
Võsa, U., Claringbould, A., Westra, H.-J., Bonder, M. J., Deelen, P., Zeng, B., et al. (2021). Large-scale cis- and trans-eQTL analyses identify thousands of genetic loci and polygenic scores that regulate blood gene expression. Nat. Genet. 53, 1300–1310. doi:10.1038/s41588-021-00913-z
Wainberg, M., Sinnott-Armstrong, N., Mancuso, N., Barbeira, A. N., Knowles, D. A., Golan, D., et al. (2019). Opportunities and challenges for transcriptome-wide association studies. Nat. Genet. 51, 592–599. doi:10.1038/s41588-019-0385-z
Wang, D., Liu, S., Warrell, J., Won, H., Shi, X., Navarro, F. C. P., et al. (2018). Comprehensive functional genomic resource and integrative model for the human brain. Science 362, eaat8464. doi:10.1126/science.aat8464
Watanabe, K., Taskesen, E., van Bochoven, A., and Posthuma, D. (2017). Functional mapping and annotation of genetic associations with FUMA. Nat. Commun. 8, 1826. doi:10.1038/s41467-017-01261-5
Watson, H. J., Yilmaz, Z., Thornton, L. M., Hübel, C., Coleman, J. R. I., Gaspar, H. A., et al. (2019). Genome-wide association study identifies eight risk loci and implicates metabo-psychiatric origins for anorexia nervosa. Nat. Genet. 51, 1207–1214. doi:10.1038/s41588-019-0439-2
Wingo, T. S., Liu, Y., Gerasimov, E. S., Gockley, J., Logsdon, B. A., Duong, D. M., et al. (2021). Brain proteome-wide association study implicates novel proteins in depression pathogenesis. Nat. Neurosci. 24, 810–817. doi:10.1038/s41593-021-00832-6
Wingo, T. S., Liu, Y., Gerasimov, E. S., Vattathil, S. M., Wynne, M. E., Liu, J., et al. (2022). Shared mechanisms across the major psychiatric and neurodegenerative diseases. Nat. Commun. 13, 4314. doi:10.1038/s41467-022-31873-5
Wu, Y., Zeng, J., Zhang, F., Zhu, Z., Qi, T., Zheng, Z., et al. (2018). Integrative analysis of omics summary data reveals putative mechanisms underlying complex traits. Nat. Commun. 9, 918. doi:10.1038/s41467-018-03371-0
Yamamoto, H., Lee-Okada, H.-C., Ikeda, M., Nakamura, T., Saito, T., Takata, A., et al. (2023). GWAS-identified bipolar disorder risk allele in the FADS1/2 gene region links mood episodes and unsaturated fatty acid metabolism in mutant mice. Mol. Psychiatry 2023, 1. doi:10.1038/s41380-023-01988-2
Yang, C., Farias, F. H. G., Ibanez, L., Suhy, A., Sadler, B., Fernandez, M. V., et al. (2021a). Genomic atlas of the proteome from brain, CSF and plasma prioritizes proteins implicated in neurological disorders. Nat. Neurosci. 24, 1302–1312. doi:10.1038/s41593-021-00886-6
Yang, H., Liu, D., Zhao, C., Feng, B., Lu, W., Yang, X., et al. (2021b). Mendelian randomization integrating GWAS and eQTL data revealed genes pleiotropically associated with major depressive disorder. Transl. Psychiatry 11, 225. doi:10.1038/s41398-021-01348-0
Yuan, Z., Zhu, H., Zeng, P., Yang, S., Sun, S., Yang, C., et al. (2020). Testing and controlling for horizontal pleiotropy with probabilistic Mendelian randomization in transcriptome-wide association studies. Nat. Commun. 11, 3861. doi:10.1038/s41467-020-17668-6
Zhang, J., Dutta, D., Köttgen, A., Tin, A., Schlosser, P., Grams, M. E., et al. (2021). Large Bi-ethnic study of plasma proteome leads to comprehensive mapping of cis-pQTL and models for proteome-wide association studies. medRixv. doi:10.1101/2021.03.15.435533
Zhang, S., Zhang, H., Zhou, Y., Qiao, M., Zhao, S., Kozlova, A., et al. (2020). Allele-specific open chromatin in human iPSC neurons elucidates functional disease variants. Science 369, 561–565. doi:10.1126/science.aay3983
Zhao, L., Chang, H., Zhou, D.-S., Cai, J., Fan, W., Tang, W., et al. (2018). Replicated associations of FADS1, MAD1L1, and a rare variant at 10q26.13 with bipolar disorder in Chinese population. Transl. Psychiatry 8, 1–12. doi:10.1038/s41398-018-0337-x
Zhou, D., Jiang, Y., Zhong, X., Cox, N. J., Liu, C., and Gamazon, E. R. (2020). A unified framework for joint-tissue transcriptome-wide association and Mendelian randomization analysis. Nat. Genet. 52, 1239–1246. doi:10.1038/s41588-020-0706-2
Keywords: eQTL, pQTL, mQTL, Mendelian randomization, alcohol use disorder, bipolar disorder, schizophrenia
Citation: Gedik H, Nguyen TH, Peterson RE, Chatzinakos C, Vladimirov VI, Riley BP and Bacanu S-A (2023) Identifying potential risk genes and pathways for neuropsychiatric and substance use disorders using intermediate molecular mediator information. Front. Genet. 14:1191264. doi: 10.3389/fgene.2023.1191264
Received: 27 March 2023; Accepted: 23 May 2023;
Published: 21 June 2023.
Edited by:
Can Yang, Hong Kong University of Science and Technology, Hong Kong SAR, ChinaReviewed by:
Xianghong Hu, Hong Kong University of Science and Technology, Hong Kong SAR, ChinaJiebiao Wang, University of Pittsburgh, United States
Copyright © 2023 Gedik, Nguyen, Peterson, Chatzinakos, Vladimirov, Riley and Bacanu. This is an open-access article distributed under the terms of the Creative Commons Attribution License (CC BY). The use, distribution or reproduction in other forums is permitted, provided the original author(s) and the copyright owner(s) are credited and that the original publication in this journal is cited, in accordance with accepted academic practice. No use, distribution or reproduction is permitted which does not comply with these terms.
*Correspondence: Huseyin Gedik, Z2VkaWtoQHZjdS5lZHU=