 Heejin Jin
 Sanghun Lee
 Sungho Won
- 1Institute of Health and Environment, Seoul National University, Seoul, Republic of Korea
- 2Department of Medical Consilience, Graduate School, Dankook University, Yongin-si, Republic of Korea
- 3Department of Public Health Science, Seoul National University and Institute of Health and Environment, Seoul National University, Seoul, Republic of Korea
Introduction: Type 2 diabetes (T2D) is associated with severe mental illnesses (SMIs), such as schizophrenia, bipolar disorder, and depression. However, causal relationships between SMIs and T2D remain unclear owing to potential bias in observational studies. We aimed to characterize the causal effect of SMI liability on T2D using two-sample Mendelian randomization (MR).
Methods: The causality between liability to SMI and T2D was investigated using the inverse-variance weighted (IVW), MREgger, MR-Egger with a simulation extrapolation, weighted median, and the MR pleiotropy residual sum and outlier method. Similarly, we performed additional MR which can detect the reverse causation effect by switching exposure and outcome for T2D liability for SMI. To further consider pleiotropic effects between SMIs, multivariable MR analysis was performed after accounting for the other traits.
Results: In the univariable IVW method, depression showed a causal effect on T2D (odds ratio [OR]: 1.128, 95% confidence interval [CI]: 1.024–1.245, p = 0.014). Multinomial MR more strongly supported these results (IVW OR: 1.197, 95% CI: 1.069, 1.340, p = 0.002; MR-Egger OR: 1.198, 95% CI: 1.062, 1.349, p = 0.003). Bidirectional MR showed absence of reversecausality between depression and T2D. However, causal relationship of bipolar and schizophrenia on T2D was not detected.
Discussion: Careful attention is needed for patients with depression regarding T2D prevention and treatment.
Background
To date, several epidemiologic studies have suggested a link between type 2 diabetes (T2D) and severe mental illnesses (SMIs), including bipolar disorder (BPD), schizophrenia (SCZ), and depression (Vancampfort et al., 2016). The prevalence of T2D among individuals with BPD and SCZ has been estimated to be 8%–17% and 16%–25%, respectively; furthermore, some studies have reported that adults with depression have a 37% increased risk of developing T2D (Dixon et al., 2000; Anderson et al., 2001; Regenold et al., 2002). The side effects of the medications used for treating SMI, unhealthy lifestyle behaviors of patients with SMI, and hypothalamic–pituitary–adrenal axis dysregulation could contribute to the association of SMI with T2D (Scott and Happell, 2011; Enger et al., 2013; Vancampfort et al., 2015).
In contrast, T2D also affects mental health. Some studies have reported that the risk of depression increases in people with T2D (Nouwen et al., 2010), while the prevalence of SCZ is higher in patients with T2D than in the general population (Huang et al., 2018). Furthermore, T2D and prediabetes may be risk factors in patients with BPD (Hajek et al., 2015), and diabetes affects mental health (Feng and Astell-Burt, 2017). Furthermore, it is also well known that many diseases have downstream effects on mental health as part of a prodromal phase. However, owing to potential biases, such as confounding and reverse causation in these studies, the true causality between liability to SMI and T2D remains unclear. Moreover, the difference between the age at onset of T2D and SMI makes it extremely challenging to infer a causal relationship between them. In general, heritability for T2D is typically between 25% and 80%, with onset at a younger age indicating a stronger genetic component, while SMI usually occurs in young adulthood (20s–30s) with high heritability (80%–85% for BPD, 80% for SCZ, and 31%–42% for depression) (Sullivan et al., 2000; Purcell et al., 2009). Accordingly, both directions warrant investigation. Two-sample Mendelian randomization (MR) studies, widely adopted using genetic variants, such as single nucleotide polymorphisms (SNPs) for instrumental variable IV) analysis, should pinpoint the causal relationship between liability to SMI and T2D (Burgess et al., 2016a). Anti-psychiatric treatments may cause bias, and some SNPs that are used as potential IVs may be strongly associated with side effects; if this is the case, genetically determined depression and anti-depressive efficacy may be responsible for the estimated causal effect of SMIs on T2D (Zhang et al., 2021a; Zhang et al., 2021b; Zhang and Baranova, 2021). Therefore, it is crucial to explicitly clarify the roles of shared genes and pleiotropy in this study, which seeks to elucidate the causal relationship between mental illnesses and T2D. For these reasons, in our MR analysis, the pleiotropic effects were considered from multiple aspects, and various sensitivity MR analyses were applied (Hou et al., 2020; Jin et al., 2020; Wang et al., 2021). Consequently, we investigated the causality between SMI (BPD, SCZ, and depression) liability and T2D using genome-wide summary statistics in a meta-analysis of a large population of European individuals through a two-sample bidirectional MR study.
Methods
Two-sample MR analysis was conducted, and Figure 1 displays a flowchart describing the overall procedure.
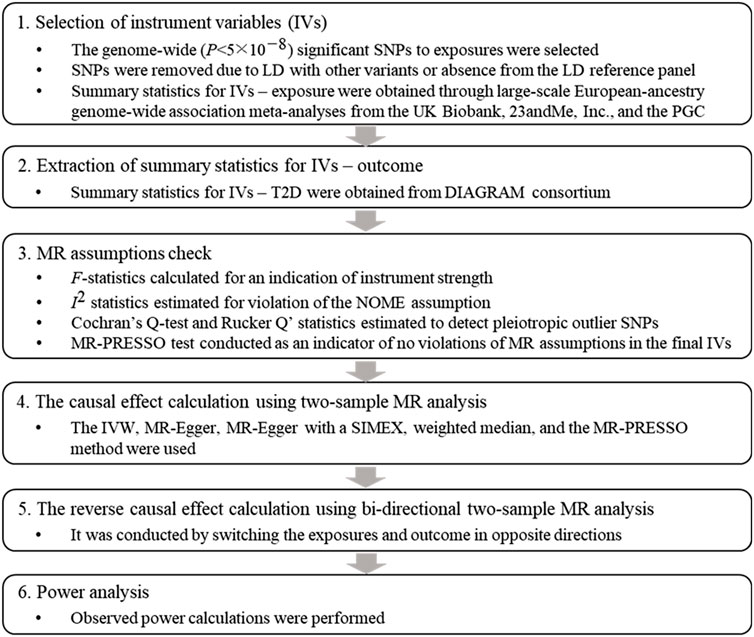
FIGURE 1. Flowchart of the Mendelian randomization study. Abbreviations: SNP: single nucleotide polymorphism, LD: linkage disequilibrium, PGC: psychiatric genomics consortium, T2D: type 2 diabetes, DIAGRAM: DIAbetes Genetics Replication And Meta-analysis, MR: Mendelian randomization, MR-PRESSO: Mendelian Randomization Pleiotropy RESidual Sum and Outlier, IVW: inverse variance weighted, SIMEX: simulation extrapolation.
Exposure datasets: summary statistics of genetic association analyses for BPD, depression, and SCZ
The first exposure dataset is the summary statistics of the genetic association analyses for BPD with 20,352 cases and 31,358 controls (Stahl et al., 2019). The characteristics of the data is shown in Table 1. Cases were required to meet international consensus criteria (Diagnostic and Statistical Manual of Mental Disorders [DSM-IV] and International Classification of Diseases, Ninth or 10th Revision [ICD-9 or ICD-10]) for a BPD lifetime diagnosis. To select an appropriate instrument, “ld_clump” function of R package “ieugwasr” was used. Among the genome-wide (p-value p) < 5
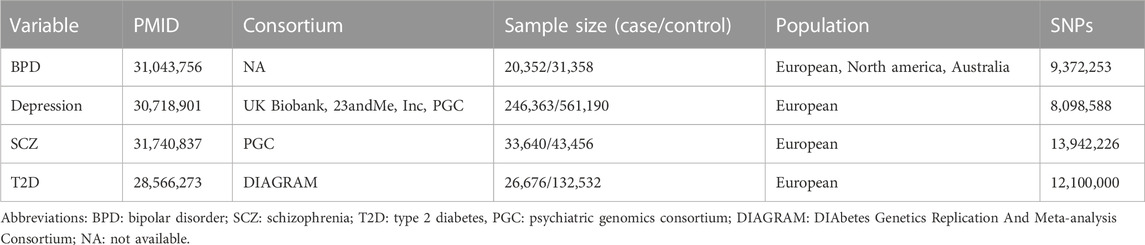
TABLE 1. Description of GWAS data for MR study.
Outcome datasets: summary statistics of genetic association analyses for T2D
To avoid inflated type-1 error rates and false-positive findings due to sample overlap in two-sample MR (Jin et al., 2020), we obtained summary statistics for the association of SNP with T2D from the DIAbetes Genetics Replication And Meta-analysis Consortium stage 1 meta-analyses with 26,676 cases and 132,532 controls (Table 1) (Scott et al., 2017). T2D diagnosis was based on diagnostic fasting glucose (≥7 mmol/L) or hemoglobin A1c levels (≥6.5%), hospital discharge diagnosis, use of oral anti-diabetic medication, or self-reports. Summary statistics of genome-wide association analyses for 12.1 million SNPs were available and were considered for our MR analyses. When T2D status is considered as an exposure in reverse MR analysis, a total of 35, 39 and 43 SNPs were finally used as instrument variables for BPD, depression and SCZ, respectively.
Genetic correlation
The genetic correlation (rg) between target traits was estimated by bivariate linkage disequilibrium score regression (LDSC) (Yengo et al., 2018). The LD reference panel for the analysis was obtained from the 1000 Genomes Project based on European ancestry information.
MR analysis
Two-sample MR requires three strong basic assumptions as follows: (ⅰ) a strong association between IVs and intermediate exposure, (ⅱ) IVs independent of confounders, and iii) IVs that do not directly affect the outcome. Additionally, sensitivity MR requires the “NO Measurement Error” (NOME) assumption and InSIDE assumption (INstrument Strength Independent of Direct Effect) (Jin et al., 2020). F-statistics provided an indication of instrument strength, and F > 10 indicated that the analysis was unlikely to suffer from weak instrument bias (Burgess et al., 2011). A degree of violation of the NOME assumption was quantified using
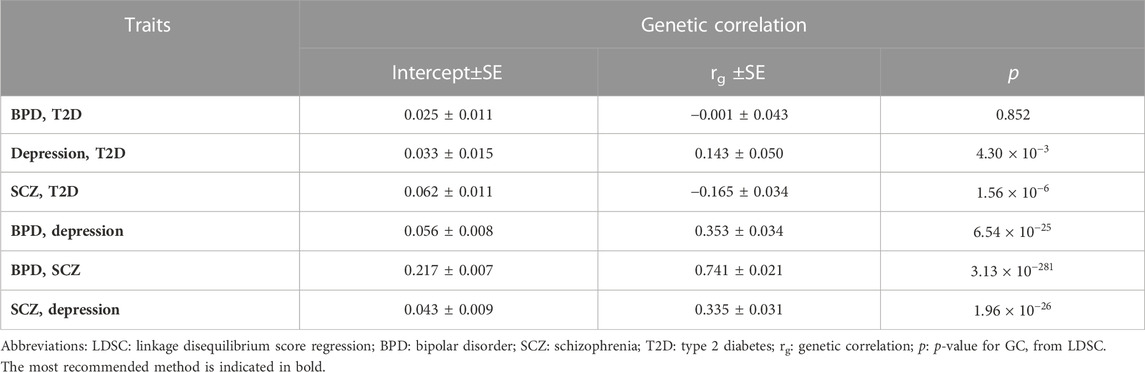
TABLE 2. Genetic correlations between target traits estimated by bivariate LDSC.

TABLE 3. Assumption test for instrumental variable sets.
To facilitate the understanding of the methods and analytical procedures, additional figures (scatter, funnel, forest, and leave-one-out sensitivity analysis plot) are shown. The associations of the variants with exposures and outcomes are shown in a scatter plot with several MR-fitted lines. The generated funnel plot shows symmetry, indicating heterogeneity due to horizontal pleiotropy. In addition, the forest plot shows individual estimate between IVs and the risk for T2D, and leave-one-out variant analysis is illustrated in the form of a forest plot. The MR results were rescaled to represent the odds of T2D per doubling of genetic liability to each exposure through multiplying the log causal estimate and 95% confidence interval (CI) by 0.693 and then exponentiating (Verbanck et al., 2018). A statistical significance threshold of Bonferroni-corrected p = 1.67
Statistical power analysis
Observed power calculations were performed using an online tool (https://sb452.shinyapps.io/power/) (Burgess et al., 2020). Proportions of variance in the exposure explained by genetic variants (
Reverse MR analysis
We conducted a bidirectional MR to investigate the presence of reverse-causality between liability to T2D and SMI risk. Among GWAS for 12.1 million SNPs for T2D liability, a total of 35, 43, and 39 SNPs genome-wide, which were significantly associated with T2D liability, had summary GWAS results for BPD, SCZ, and depression, respectively, after LD pruning. The analysis process described in Figure 1, which involved examining the assumption of the instruments and calculating power, was similarly applied to the bidirectional MR analysis.
Multivariable MR analysis
There is substantial evidence for partial overlap of genetic influences on SMIs (Cardno and Owen, 2014; Schulze et al., 2014). Therefore, the multivariable MR method would be useful to disentangle effects in situations where the three traits are highly related (Burgess and Thompson, 2015). A total of 143 SNPs associated with at least one exposure was used for multivariable MR. To assess instrument strength and heterogeneity, the conditional F-statistic and Cochrane’s Q statistic were calculated (Sanderson et al., 2019). All analysis was performed using the R package “MVMR” and “MendelianRandomization”. If Cochran’s Q test p less than 0.05, we used the random-effects multivariable IVW method. In addition, to consider potential pleiotropy, an extension of the MR-Egger method (i.e., multivariable MR-Egger) were applied to identify the causal effect of BPD, depression, SCZ on T2D (Sanderson et al., 2019). Multivariable MR-Egger intercept indicate pleiotropy (intercept p < 0.05) and it can also provide a corrected estimate when such pleiotropy exists.
Results
Genetic correlation of BPD, depression, and SCZ with T2D
As shown in Table 2, we identified shared genetics between depression and SCZ with T2D. For depression with T2D, the rg was found to be 0.143 with a p of 4.30
Effect of liability to BPD on T2D risk
Eleven SNPs associated with BPD, rather than T2D, were used as IVs. All SNP to the exposure and SNP-outcome effects are presented in Supplementary Table S2. We found no evidence of weak instrument bias (F-statistic = 32.9), heterogeneity, or outlier pleiotropy (Q-test, p = 0.718; Q′-test, p = 0.821; MR-PRESSO global test, p = 0.695) (Table 3). Additionally, the MR-Egger test indicated no directional pleiotropic bias (intercept p = 0.165) or violation of the NOME assumption (

TABLE 4. Univariable MR results for SMI liability on T2D.
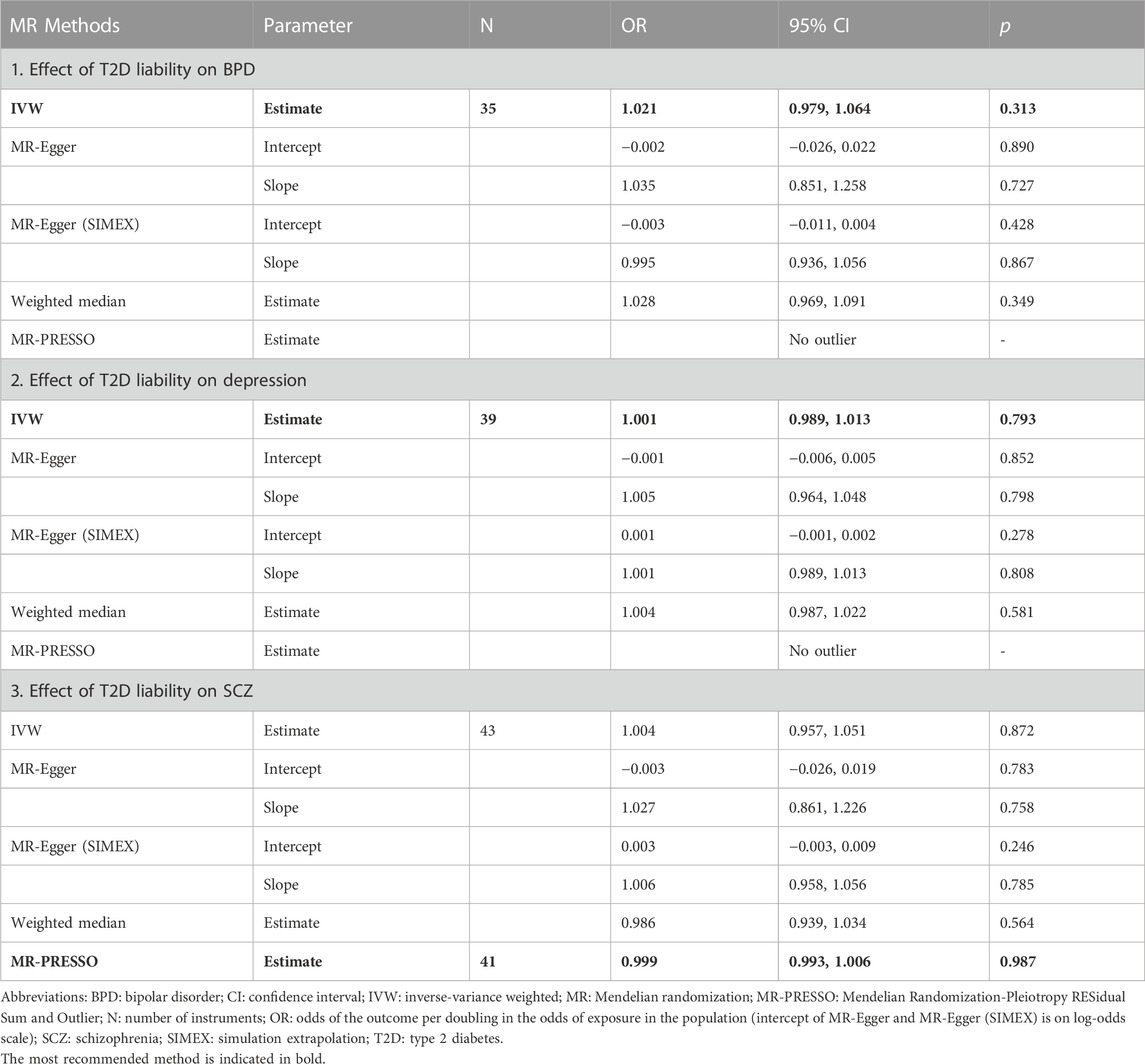
TABLE 5. Univariable reverse MR results for T2D liability on SMI.
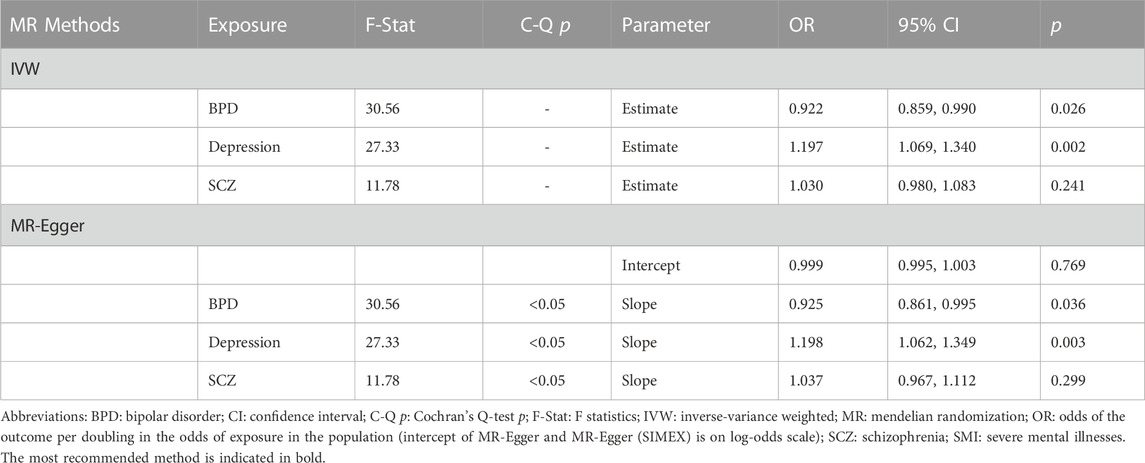
TABLE 6. Multivariable MR results for SMI liability on T2D.
Effect of liability to depression on T2D risk
Forty-two independent SNPs associated with depression liability, but not with T2D, were used as IVs. All SNP-exposure and SNP-outcome effects are presented in Supplementary Table S3. The strong instrument strength was confirmed by the F-statistic (37.9), and there was no measurement error of estimates from the MR study (
Effect of liability to SCZ on T2D risk
Seventy-two independent SNPs associated with SCZ liability, rather than T2D, were found to have strong instrument strength (F-statistic = 41.5) and no heterogeneity and outlier pleiotropy (Q-test, p = 0.319; Q′-test, p = 0.290; MR-PRESSO global test, p = 0.704) (Table 3). All SNP-exposure and SNP-outcome effects are shown in Supplementary Table S3. In addition, there was no dilution bias from violation of the NOME assumption (
Discussion
In this study, we showed genetic correlations between depression and SCZ with T2D, while no genetic association was found between BPD and T2D from LDSC regression. Two-sample univariable and multivariable MR results provided some evidence in support of the hypothesis that depression liability increases the risk of T2D, whereas there was no evidence to suggest that liability to BPD and SCZ are risk factors for T2D. Additionally, a bidirectional MR study found no reverse causality between SMI and T2D, which supports the hypothesis that depression is one of the causal factors influencing T2D. However, observational studies have provided contradictory and controversial findings. One systematic review demonstrated that depression is associated with a 60% increased risk of T2D, while the evidence is also compatible with the high prevalence rates of depression among individuals with T2D (Lustman et al., 1986). A large meta-analysis showed that T2D is associated with only a modestly increased risk of depression (Mezuk et al., 2008). Depression is difficult to detect in older adults, which may partially explain the utter modesty of this association (Gallo et al., 1994). On the other hand, a MR study based on East Asian populations demonstrated that T2D as a chronic disorder would increase the risk of depression (Xuan et al., 2018). It is important to note that the causal relationship between depression and T2D may vary depending on race or ethnicity, as indicated by the contrasting results in different populations. In addition, the difference in statistical power due to sample size could have led to the discrepancy in the results.
Our finding, which relates to the causal role of depression liability in an increased risk of T2D, could be explained by the pathophysiological mechanisms underlying the two diseases. Two major molecular mechanisms have been suggested to explain the causal pathway between them. First, the hypothalamic-pituitary-adrenal axis, a central stress response system, is commonly activated in patients with depression suffering from emotional stressors leading to a rise in the levels of glucocorticoids, primarily cortisol (Tsigos and Chrousos, 2002). High cortisol level induces and aggravates insulin resistance in a vicious cycle (Geer et al., 2014). Second, sympathetic nervous system (SNS) activity is also elevated in depression (Tabák et al., 2004). The SNS axis interacts with the hypothalamic-pituitary-adrenal axis to maintain homeostasis during stress, resulting in an increased release of cortisol and other glucocorticoids, catecholamines, growth hormone, and glucagon. Indeed, catecholamines have marked metabolic effects, particularly on glucose metabolism (Barth et al., 2007).
However, our findings are inconsistent with an observational study suggesting a causal role of liability to BPD and SCZ in the risk of T2D and that liability to T2D predicts the development of depression (Regenold et al., 2002). Such associations may have been driven by residual confounders, and several suggestive factors can act as confounders. First, a sedentary lifestyle, demonstrated to be strongly associated with SMI, may play a role as a potential confounder (Vancampfort et al., 2016). A large meta-analysis of general population studies reported that sedentary behavior is independently associated with an increased risk of T2D (Biswas et al., 2015). Additionally, the side effects of medication could be another important potential confounder. A systematic review of cross-sectional and prospective studies indicated that the use of antipsychotics, antidepressants, and mood stabilizers could contribute to an increased body mass index, which is a major risk factor for T2D (Correll et al., 2015). Furthermore, the highest prevalence of daily cigarette smoking was observed among patients with SCZ, followed by patients with BPD and those with depression, compared with the general population. The association with smoking is stronger in SCZ and BPD than in depression (Diaz et al., 2009). The evidence that nicotine addiction begins before any of these SMIs develop suggests the involvement of shared genes associated with nicotine addiction and SMI (Kendler et al., 1993). In contrast, in MR analysis, genetic variants (i.e., SNPs) used as IVs are innately random, and are assumed to be independent of confounding factors such as age, gender, and race.
MR studies on the association between SMI liability and T2D are scarce, with no studies on liability to BPD comorbid with T2D. To investigate the potential causal relationship of T2D with depression, MR analysis was performed with a large Chinese longitudinal cohort from 2011 to 2013 (Xuan et al., 2018). In their studies, effect of depression on T2D was not significant, which is inconsistent with our finding. There are multiple reasons about such inconsistency. First, there may be a racial difference between non-Hispanic whites and Chinese. Second, we considered two-stage methods and Xuan et al. considered one-sample Mendelian randomizations. Both methods require several assumptions to extend the analysis results to the causality of depression on T2D, and if they are not satisfied, causality cannot be guaranteed. For instance, some of assumptions such as horizontal pleiotropy can be violated. Furthermore, the fitted values from the first-stage regression are correlated with the outcome in finite samples even, and there can be a finite-sample bias in a one-sample setting (Gallo et al., 1994). Regarding the MR studies of SCZ and T2D, two-sample MR was performed using the IVW and MR-Egger methods in European, East Asian, and trans-ancestry groups (Burgess et al., 2016b). No evidence of a causal effect on T2D for SCZ was observed in any analyses, consistent with our findings; however, they did not perform a bidirectional analysis to investigate the causal effect of SCZ on T2D. On the other hand, a study demonstrated that SCZ can be considered as a causal factor for T2D, which contrasts with the findings of our research (Cai et al., 2022). In MR studies, the selection of instruments is crucial, as the choice of IVs (i.e., SNPs) can lead to different results. However, this study and our research not only used different GWAS summary statistics for T2D but also had only 37 common SNPs, which accounted for approximately 50% of the IVs in both studies. Therefore, the differences in the results between both studies can be attributed to disparities in the analysis samples and IVs. Unlike epidemiological studies, previous and present MR studies could not consider the multi-episode status of the disease, which may have led to the non-causal effect of SCZ and BPD. This could be because multi-episode (versus first-episode) patients with SMI were more likely to have T2D than matched controls in the meta-analysis of observational studies (Vancampfort et al., 2016).
Our study has some limitations. First, our research has a potential limitation for “winner’s curse” in a two-sample MR framework using SNPs as instruments from discovery GWASs, which can cause bias. Second, there are significant genetic correlation between SCZ with T2D but there is no evidence of causality. This indicates that the observed association could potentially be influenced by other factors such as population stratification or sample overlapping between the two GWAS. Therefore, further studies with designs that are not influenced by these factors are needed. Third, there are different clinical subtypes of depression (melancholic, psychotic, atypical, or undifferentiated), BPD (type 1 or 2), and mood states (manic, depressive, mixed, or euthymic); however, a large category of diseases was analyzed without distinction. A mixture of classifications is problematic because the effect of the subtype disease liability on T2D may differ even if they are included in the same SMI category. Especially in the case of BPD or SCZ liability, the causal effect on T2D may have been annulled depending on the diseases’ subtype. Fourth, although we conducted bidirectional MR studies, the sample size of GWASs for BPD (<100,000) was relatively small, which could lead to low analysis power (50.8%) with a true OR of less than 1.100. The reliability of the analysis result is low, and further MR studies with large sample size are required. Fifth, we only included a European population; hence, it is difficult to apply the same clinical interpretation to other populations. Finally, horizontal pleiotropy, a natural flaw of MR design, can occurs when a genetic variant affects the outcome variable without mediating the exposure variable (Chen et al., 2022).
Conclusion
This study provided evidence for depression liability having a causal effect on T2D, which is supported by previously reported biological mechanisms. Therefore, it is imperative to consider screening for diabetes and metabolic abnormalities in patients with depression or probable depression.
Data availability statement
Publicly available datasets were analyzed in this study. The datasets generated and/or analyzed during the current study are available in the DIAbetes Genetics Replication and Meta-analysis Consortium repository, https://www.diagram-consortium.org/downloads.html (SHA1:d48402f1ce501ea5b98335e6e15173bb865bb6f1, MD5:f033ebb95e01afedde7365e4fc6565a2) and Psychiatric Genomics Consortium repository, https://figshare.com/articles/dataset/bip2019/14671998 (BPD), https://datashare.ed.ac.uk/handle/10283/3203 (depression), and https://figshare.com/articles/dataset/scz2019asi/19193084 (SCZ).
Author contributions
HJ analyzed and interpreted the results and wrote the manuscript. SW and SL designed the study and equally contributed. All authors revised this paper critically for important intellectual content. SW acts as the guarantor and agrees to take responsibility for the integrity and veracity of this paper, and for the work and research it represents. SW accepts full responsibility for the work and/or the conduct of the study, had access to the data, and controlled the decision to publish. All authors contributed to the article and approved the submitted version.
Funding
Statistical analyses were supported by the national supercomputing center with supercomputing resources including technical support (KSC-2022-CRE-0319) and data was provided with bioresources from National Biobank of Korea, the Korea Disease Control and Prevention Agency, Republic of Korea (NBK-2020-101). This research was supported by a grant of the Korea Health Technology R&D Project through the Korea Health Industry Development Institute (KHIDI), funded by the Ministry of Health & Welfare, Republic of Korea (grant number: HI22C0154); and the National Research Foundation (NRF) grant (NRF-2021R1A5A1033157) funded by the Korean government (MSIT).
Acknowledgments
We would like to thank Editage (www.editage.co.kr) for English editing and reviewing.
Conflict of interest
The authors declare that the research was conducted in the absence of any commercial or financial relationships that could be construed as a potential conflict of interest.
Publisher’s note
All claims expressed in this article are solely those of the authors and do not necessarily represent those of their affiliated organizations, or those of the publisher, the editors and the reviewers. Any product that may be evaluated in this article, or claim that may be made by its manufacturer, is not guaranteed or endorsed by the publisher.
Supplementary material
The Supplementary Material for this article can be found online at: https://www.frontiersin.org/articles/10.3389/fgene.2023.1181851/full#supplementary-material
Abbreviations
BPD, bipolar disorder; CI, confidence interval; GWAS, genome-wide association study; ICD, International Classification of Diseases; IVW, inverse-variance weighted; LD, linkage disequilibrium; MR, Mendelian randomization; MR-PRESSO, Mendelian Randomization-Pleiotropy RESidual Sum and Outlier; NOME, NO Measurement Error; OR, odds ratio; SCZ, schizophrenia; SMI, severe mental illness; SIMEX, simulation extrapolation; SNP, single nucleotide polymorphism; SNS, sympathetic nervous system; T2D, type 2 diabetes.
References
Anderson, R. J., Freedland, K. E., Clouse, R. E., and Lustman, P. J. (2001). The prevalence of comorbid depression in adults with diabetes: a meta-analysis. Diabetes Care 24, 1069–1078. doi:10.2337/diacare.24.6.1069
Barth, E., Albuszies, G., Baumgart, K., Matejovic, M., Wachter, U., Vogt, J., et al. (2007). Glucose metabolism and catecholamines. Crit. Care Med. 35, S508–S518. doi:10.1097/01.ccm.0000278047.06965.20
Biswas, A., Oh, P. I., Faulkner, G. E., Bajaj, R. R., Silver, M. A., Mitchell, M. S., et al. (2015). Sedentary time and its association with risk for disease incidence, mortality, and hospitalization in adults: a systematic review and meta-analysis. Ann. Intern Med. 162, 123–132. doi:10.7326/m14-1651
Bowden, J., Del Greco M, M. F., Minelli, C., Davey Smith, G., Sheehan, N. A., and Thompson, J. R. (2016). Assessing the suitability of summary data for two-sample mendelian randomization analyses using MR-egger regression: the role of the I2 statistic. Int. J. Epidemiol. 45, 1961–1974. doi:10.1093/ije/dyw220
Bowden, J., Spiller, W., Del Greco M, M. F., Sheehan, N., Thompson, J., Minelli, C., et al. (2018). Improving the visualization, interpretation and analysis of two-sample summary data Mendelian randomization via the Radial plot and Radial regression. Int. J. Epidemiol. 47, 1264–1278. doi:10.1093/ije/dyy101
Burgess, S., and Thompson, S. G. (2015). Multivariable mendelian randomization: the use of pleiotropic genetic variants to estimate causal effects. Am. J. Epidemiol. 181, 251–260. doi:10.1093/aje/kwu283
Burgess, S., and Thompson, S. G.CRP CHD Genetics Collaboration (2011). Avoiding bias from weak instruments in Mendelian randomization studies. Int. J. Epidemiol. 40, 755–764. doi:10.1093/ije/dyr036
Burgess, S., Dudbridge, F., and Thompson, S. G. (2016a). Combining information on multiple instrumental variables in mendelian randomization: comparison of allele score and summarized data methods. Stat. Med. 35, 1880–1906. doi:10.1002/sim.6835
Burgess, S., Davies, N. M., and Thompson, S. G. (2016b). Bias due to participant overlap in two-sample Mendelian randomization. Genet. Epidemiol. 40, 597–608. doi:10.1002/gepi.21998
Burgess, S., Davey Smith, G., Davies, N. M., Dudbridge, F., Gill, D., Glymour, M. M., et al. (2020). Guidelines for performing Mendelian randomization investigations. Wellcome Open Res. 4, 186. doi:10.12688/wellcomeopenres.15555.2
Cai, L., Sun, Y., Liu, Y., Chen, W., He, L., and Wei, D. Q. (2022). Evidence that the pituitary gland connects type 2 diabetes mellitus and schizophrenia based on large-scale trans-ethnic genetic analyses. J. Transl. Med. 20, 501. doi:10.1186/s12967-022-03704-0
Cardno, A. G., and Owen, M. J. (2014). Genetic relationships between schizophrenia, bipolar disorder, and schizoaffective disorder. Schizophr. Bull. 40, 504–515. doi:10.1093/schbul/sbu016
Chen, L., Yang, H., Li, H., He, C., Yang, L., and Lv, G. (2022). Insights into modifiable risk factors of cholelithiasis: A mendelian randomization study. Hepatology 75, 785–796. doi:10.1002/hep.32183
Correll, C. U., Detraux, J., De Lepeleire, J., and De Hert, M. (2015). Effects of antipsychotics, antidepressants and mood stabilizers on risk for physical diseases in people with schizophrenia, depression and bipolar disorder. World Psychiatry 14, 119–136. doi:10.1002/wps.20204
Diaz, F. J., James, D., Botts, S., Maw, L., Susce, M. T., and de Leon, J. (2009). Tobacco smoking behaviors in bipolar disorder: a comparison of the general population, schizophrenia, and major depression. Bipolar Disord. 11, 154–165. doi:10.1111/j.1399-5618.2009.00664.x
Dixon, L., Weiden, P., Delahanty, J., Goldberg, R., Postrado, L., Lucksted, A., et al. (2000). Prevalence and correlates of diabetes in national schizophrenia samples. Schizophr. Bull. 26, 903–912. doi:10.1093/oxfordjournals.schbul.a033504
Enger, C., Jones, M. E., Kryzhanovskaya, L., Doherty, M., and McAfee, A. T. (2013). Risk of developing diabetes and dyslipidemia among adolescents with bipolar disorder or schizophrenia. Int. J. Adolesc. Med. Health 25, 3–11. doi:10.1515/ijamh-2013-0002
Feng, X., and Astell-Burt, T. (2017). Impact of a type 2 diabetes diagnosis on mental health, quality of life, and social contacts: a longitudinal study. BMJ Open Diab Res. Care 5, e000198. doi:10.1136/bmjdrc-2016-000198
Gallo, J. J., Anthony, J. C., and Muthen, B. O. (1994). Age differences in the symptoms of depression: a latent trait analysis. J. Gerontology 49, P251–P264. doi:10.1093/geronj/49.6.p251
Geer, E. B., Islam, J., and Buettner, C. (2014). Mechanisms of glucocorticoid-induced insulin resistance: focus on adipose tissue function and lipid metabolism. Endocrinol. Metabolism Clin. N. Am. 43, 75–102. doi:10.1016/j.ecl.2013.10.005
Hajek, T., Calkin, C., Blagdon, R., Slaney, C., and Alda, M. (2015). Type 2 diabetes mellitus: a potentially modifiable risk factor for neurochemical brain changes in bipolar disorders. Biol. Psychiatry 77, 295–303. doi:10.1016/j.biopsych.2013.11.007
Hou, L., Xu, M., Yu, Y., Sun, X., Liu, X., Liu, L., et al. (2020). Exploring the causal pathway from ischemic stroke to atrial fibrillation: a network mendelian randomization study. Mol. Med. 26, 7. doi:10.1186/s10020-019-0133-y
Howard, D. M., Adams, M. J., Clarke, T. K., Hafferty, J. D., Gibson, J., Shirali, M., et al. (2019). Genome-wide meta-analysis of depression identifies 102 independent variants and highlights the importance of the prefrontal brain regions. Nat. Neurosci. 22, 343–352. doi:10.1038/s41593-018-0326-7
Huang, C. J., Hsieh, H. M., Tu, H. P., Jiang, H. J., Wang, P. W., and Lin, C. H. (2018). Schizophrenia in type 2 diabetes mellitus: prevalence and clinical characteristics. Eur. Psychiatr. 54, 102–108. doi:10.1016/j.eurpsy.2018.08.002
Jin, H., Lee, S., and Won, S. (2020). Causal evaluation of laboratory markers in type 2 diabetes on cancer and vascular diseases using various Mendelian randomization tools. Front. Genet. 11, 597420. doi:10.3389/fgene.2020.597420
Kendler, K. S., Neale, M. C., MacLean, C. J., Heath, A. C., Eaves, L. J., and Kessler, R. C. (1993). Smoking and major depression. A causal analysis. Arch. Gen. Psychiatry 50, 36–43. doi:10.1001/archpsyc.1993.01820130038007
Lam, M., Chen, C. Y., Chen, Z., Li, A. R., Martin, J., Bryois, X., et al. (2019). Comparative genetic architectures of schizophrenia in East Asian and European populations. Nat. Genet. 51, 1670–1678. doi:10.1038/s41588-019-0512-x
Lustman, P. J., Griffith, L. S., Clouse, R. E., and Cryer, P. E. (1986). Psychiatric illness in diabetes mellitus. Relationship to symptoms and glucose control. J. Nerv. Ment. Dis. 174, 736–742. doi:10.1097/00005053-198612000-00005
Mezuk, B., Eaton, W. W., Albrecht, S., and Golden, S. H. (2008). Depression and type 2 diabetes over the lifespan: A meta-analysis. Diabetes Care 31, 2383–2390. doi:10.2337/dc08-0985
Nouwen, A., Winkley, K., Winkley, J., Twisk, C. E., Lloyd, M., Peyrot, K., et al. (2010). Type 2 diabetes mellitus as a risk factor for the onset of depression: a systematic review and meta-analysis. Diabetologia 53, 2480–2486. doi:10.1007/s00125-010-1874-x
Purcell, S. M., Purcell, N. R., Wray, J. L., Stone, P. M., Visscher, M. C., O'Donovan, P. F., et al. (2009). Common polygenic variation contributes to risk of schizophrenia and bipolar disorder. Nature 460, 748–752. doi:10.1038/nature08185
Regenold, W. T., Thapar, R. K., Marano, C., Gavirneni, S., and Kondapavuluru, P. V. (2002). Increased prevalence of type 2 diabetes mellitus among psychiatric inpatients with bipolar I affective and schizoaffective disorders independent of psychotropic drug use. J. Affect Disord. 70, 19–26. doi:10.1016/s0165-0327(01)00456-6
Sanderson, E., Davey Smith, G., Windmeijer, F., and Bowden, J. (2019). An examination of multivariable Mendelian randomization in the single-sample and two-sample summary data settings. Int. J. Epidemiol. 48, 713–727. doi:10.1093/ije/dyy262
Schulze, T. G., Akula, N., Breuer, R., Steele, J., Nalls, M. A., Singleton, A. B., et al. (2014). Molecular genetic overlap in bipolar disorder, schizophrenia, and major depressive disorder. World J. Biol. Psychiatry 15, 200–208. doi:10.3109/15622975.2012.662282
Scott, D., and Happell, B. (2011). The high prevalence of poor physical health and unhealthy lifestyle behaviours in individuals with severe mental illness. Issues Ment. Health Nurs. 32, 589–597. doi:10.3109/01612840.2011.569846
Scott, R. A., Scott, L. J., Mägi, R., Marullo, L., Gaulton, K. J., Kaakinen, M., et al. (2017). An expanded genome-wide association study of type 2 diabetes in Europeans. Diabetes 66, 2888–2902. doi:10.2337/db16-1253
Stahl, E. A., Breen, G., Forstner, A. J., McQuillin, A., Ripke, S., Trubetskoy, V., et al. (2019). Genome-wide association study identifies 30 loci associated with bipolar disorder. Nat. Genet. 51, 793–803. doi:10.1038/s41588-019-0397-8
Sullivan, P. F., Neale, M. C., and Kendler, K. S. (2000). Genetic epidemiology of major depression: review and meta-analysis. Ajp 157, 1552–1562. doi:10.1176/appi.ajp.157.10.1552
Tabák, A. G., Akbaraly, T. N., Batty, G. D., and Kivimäki, M. (2004). Depression and type 2 diabetes: a causal association? Lancet Diabetes Endocrinol. 2, 236–245. doi:10.1016/S2213-8587(13)70139-6
Tsigos, C., and Chrousos, G. P. (2002). Hypothalamic-pituitary-adrenal axis, neuroendocrine factors and stress. J. Psychosomatic Res. 53, 865–871. doi:10.1016/s0022-3999(02)00429-4
Vancampfort, D., Mitchell, A. J., De Hert, M., Sienaert, P., Probst, M., Buys, R., et al. (2015). Type 2 diabetes in patients with major depressive disorder: a meta-analysis of prevalence estimates and predictors. Depress Anxiety 32, 763–773. doi:10.1002/da.22387
Vancampfort, D., Correll, C. U., Galling, B., Probst, M., De Hert, M., Ward, P. B., et al. (2016). Diabetes mellitus in people with schizophrenia, bipolar disorder and major depressive disorder: a systematic review and large scale meta-analysis. World Psychiatry 15, 166–174. doi:10.1002/wps.20309
Verbanck, M., Chen, C. Y., Neale, B., and Do, R. (2018). Detection of widespread horizontal pleiotropy in causal relationships inferred from Mendelian randomization between complex traits and diseases. Nat. Genet. 50, 693–698. doi:10.1038/s41588-018-0099-7
Wang, X., Fang, X., Zheng, W., Zhou, J., Song, Z., Xu, M., et al. (2021). Genetic support of a causal relationship between iron status and type 2 diabetes: a mendelian randomization study. J. Clin. Endocrinol. Metab. 106, e4641–e4651. doi:10.1210/clinem/dgab454
Xuan, L., Zhao, Z., Jia, X., Hou, Y., Wang, T., Li, M., et al. (2018). Type 2 diabetes is causally associated with depression: a mendelian randomization analysis. Front. Med. 12, 678–687. doi:10.1007/s11684-018-0671-7
Yengo, L., Yang, J., and Visscher, P. M. (2018). Expectation of the intercept from bivariate LD score regression in the presence of population stratification. BioRxiv, 310565. doi:10.1101/310565
Zhang, F., and Baranova, A. (2021). Smoking quantitatively increases risk for COVID-19. Eur. Respir. J. 60, 2101273. doi:10.1183/13993003.01273-2021
Zhang, F., Baranova, A., Zhou, C., Cao, H., Chen, J., Zhang, X., et al. (2021a). Causal influences of neuroticism on mental health and cardiovascular disease. Hum. Genet. 140, 1267–1281. doi:10.1007/s00439-021-02288-x
Keywords: depression, type 2 diabetes mellitus, bipolar disorder, schizophrenia, mendelian randomization analysis, causality
Citation: Jin H, Lee S and Won S (2023) Mendelian randomization shows depression increases the risk of type 2 diabetes. Front. Genet. 14:1181851. doi: 10.3389/fgene.2023.1181851
Received: 08 March 2023; Accepted: 08 August 2023;
Published: 24 August 2023.
Edited by:
Jing Hua Zhao, University of Cambridge, United KingdomReviewed by:
Yongkang Kim, University of Colorado Boulder, United StatesShengxu Li, Children’s Minnesota Hospitals and Clinics, United States
Copyright © 2023 Jin, Lee and Won. This is an open-access article distributed under the terms of the Creative Commons Attribution License (CC BY). The use, distribution or reproduction in other forums is permitted, provided the original author(s) and the copyright owner(s) are credited and that the original publication in this journal is cited, in accordance with accepted academic practice. No use, distribution or reproduction is permitted which does not comply with these terms.
*Correspondence: Heejin Jin, amluamluOTYyNUBnbWFpbC5jb20=; Sungho Won, d29uMUBzbnUuYWMua3I=; Sanghun Lee, c2FuZ2h1bmxlZTczQGdtYWlsLmNvbQ==