 Yaochen Xu1†
 FeiMing Huang
 Wei Guo
 KaiYan Feng
 Zhenbing Zeng
 Tao Huang
 Yu-Dong Cai
94% of researchers rate our articles as excellent or good
Learn more about the work of our research integrity team to safeguard the quality of each article we publish.
Find out more
ORIGINAL RESEARCH article
Front. Genet., 01 March 2023
Sec. Computational Genomics
Volume 14 - 2023 | https://doi.org/10.3389/fgene.2023.1145647
This article is part of the Research TopicMachine Learning Methods in Single-Cell Immune and Drug Response PredictionView all 6 articles
Chromatin accessibility is a generic property of the eukaryotic genome, which refers to the degree of physical compaction of chromatin. Recent studies have shown that chromatin accessibility is cell type dependent, indicating chromatin heterogeneity across cell lines and tissues. The identification of markers used to distinguish cell types at the chromosome level is important to understand cell function and classify cell types. In the present study, we investigated transcriptionally active chromosome segments identified by sci-ATAC-seq at single-cell resolution, including 69,015 cells belonging to 77 different cell types. Each cell was represented by existence status on 20,783 genes that were obtained from 436,206 active chromosome segments. The gene features were deeply analyzed by Boruta, resulting in 3897 genes, which were ranked in a list by Monte Carlo feature selection. Such list was further analyzed by incremental feature selection (IFS) method, yielding essential genes, classification rules and an efficient random forest (RF) classifier. To improve the performance of the optimal RF classifier, its features were further processed by autoencoder, light gradient boosting machine and IFS method. The final RF classifier with MCC of 0.838 was constructed. Some marker genes such as H2-Dmb2, which are specifically expressed in antigen-presenting cells (e.g., dendritic cells or macrophages), and Tenm2, which are specifically expressed in T cells, were identified in this study. Our analysis revealed numerous potential epigenetic modification patterns that are unique to particular cell types, thereby advancing knowledge of the critical functions of chromatin accessibility in cell processes.
Chromatin accessibility is a generic property of the eukaryotic genome, which refers to the degree of physical compaction of chromatin (Klemm et al., 2019). Chromatin is a complex of DNA and associated proteins that form chromosomes and present varied states across genomes, tissues, and cell types (Lee et al., 2004). Nucleosome occupancy is variably dynamic, indicating that densely arranged nucleosomes lead to closed chromatin, whereas partially depleted nucleosomes result in accessible or permissive chromatin (Lee et al., 2004; Poirier et al., 2008; Sheffield and Furey, 2012; Klemm et al., 2019). Evidence demonstrates that nucleosomes are typically depleted at the transcriptional regulatory region, including enhancers, promoters, and other transcription factor binding loci (Ozsolak et al., 2007; Thurman et al., 2012). The distinct chromatin accessibility patterns directly reflect different functional states, and they are modulated through a variety of mechanisms, such as histone methylation, acetylation, and DNA methylation (Allis and Jenuwein, 2016). These modifications change the interplays between transcriptional regulators and DNA targets, thereby altering the downstream gene expressions and affecting cell functions. Various changes in chromatin structure and modification have been involved in a range of traits and diseases (Hendrich and Bickmore, 2001). Therefore, characterizing the chromatin accessibility is a critical demand for understanding their functional roles in gene regulation during development and in disease contexts.
In general, the measurement of chromatin accessibility is dependent on the physical access of enzymes to target fragments. Hewish et al. first noticed the periodic hypersensitivity of chromatin to DNA endonucleases across the genome, indicating the accessible regions among nucleosomes (Hewish and Burgoyne, 1973). Combine with next-generation sequencing techniques, a genome-wide profiling of chromatin accessibility was carried out, which was known as DNase I hypersensitive site sequencing (DNase-seq) (Boyle et al., 2008). An alternative assay, namely, ATAC-seq, can profile chromatin accessibility based on Tn5 transposon (Buenrostro et al., 2013). ATAC-seq shows a higher sensitivity on low-input samples, and the protocol is less complex compared with DNase-seq. Therefore, this approach is commonly used in recent research to generate chromatin accessibility profiles.
Chromatin accessibility is cell type dependent, indicating the chromatin heterogeneity across cell lines and tissues (Thurman et al., 2012). Previous studies with bulk chromatin accessibility profiles usually attempt to obtain homogeneous cell samples to avoid bias derived from cell heterogeneity. Recently, single-cell epigenomic assays emerged and provided a new way to investigate the regulatory mechanism of chromatin accessibility in complex tissues. However, accurate cell type annotation in single-cell ATAC-seq data remains a great challenge. Thus, three main strategies of cell type annotation in single-cell ATAC-seq data were implemented, including annotation using cis-regulatory elements, annotation using cell type-specific feature set, and annotation using RNA sequencing data as reference (Corces et al., 2016; Schep et al., 2017; Pliner et al., 2018; Stuart et al., 2019). These strategies show certain limitations that either rely on reliable cell type markers or require additional reference datasets. A combinatorial indexing assay, namely, sci-ATAC-seq, was applied to profile the genome-wide chromatin accessibility in single cells from different mouse tissues (Cusanovich et al., 2018a). Based on these data, the heterogeneity in chromatin accessibility within cell types was characterized, and candidate tissue-specific patterns of chromatin accessibility were identified. Considering that a relatively traditional workflow was applied for analysis and only a few epigenetic markers had been found, several potential characteristic patterns of chromatin accessibility across cell types remain undiscovered.
In this study, based on the single-cell chromatin accessibility data from the atlas (Cusanovich et al., 2018a), we applied several machine learning methods to identify relevant characteristic chromatin accessibility patterns that can serve as cell-type-specific markers. The Boruta (Kursa and Rudnicki, 2010) and Monte Carlo Feature Selection (MCFS) (Micha et al., 2008) were applied to the data one by one, yielding a list containing 3897 genes. Then, the list was subjected to incremental feature selection (IFS) (Liu and Setiono, 1998) method, containing decision tree (DT) (Safavian and Landgrebe, 1991) and random forest (RF) (Breiman, 2001). IFS with RF can help to construct an efficient classifier, whereas IFS with DT was used to generate classification rules, which represent the quantitative characteristics of chromatin accessibility for distinguishing different cell types. Features used in the optimal RF classifier were further processed by autoencoder, light gradient boosting machine (LightGBM) (Ke et al., 2017) and IFS method for accessing a better classifier. The final analysis was focused on top features in the list and classification rules, confirming some potential epigenetic modification patterns in particular cell types. This study gave an important contribution to a comprehensive understanding of the essential roles of chromatin accessibility in cell functions.
Large-scale sci-ATAC-seq data were accessed from the GEO database under accession number of GSE111586 provided by Cusanovich et al. (Cusanovich et al., 2018b). The sci-ATAC-seq data were collected on 77 different cell types from 13 different tissues that contained 69,015 cells, and 77 different cell types were used as classification targets in our research. The number of cells contained in each cell type is shown in Supplementary Table S1. A total of 436,206 chromosome segments mapped to 20,783 genes were obtained by sci-ATAC-seq, and these genes and their existence status (one for existence and 0 for non-existence) in each cell were used as features in this study. Using this quantitative representation, we converted enriched chromosome segments into biologically interpretable genes, thereby providing comprehensive understanding of the classification process.
The Boruta algorithm is a feature selection wrapper that can be used to any classification method that generates a variable significance measure (Kursa and Rudnicki, 2010). Boruta searches for all features that contain relevant information that may be utilized for prediction rather than concentrating on finding a restricted group of features with the lowest classification error. The Boruta algorithm consists of the following steps: 1) For each explanatory variable, a shadow variable is made, and its association with the target variable is eliminated by randomly rearranging its values. 2) RFs are built to fit the expanded data. 3) An accuracy loss z-score is applied to each variable including the original and shadow variables. 4) The original attributes are selected if their z-scores are significantly higher than those of shadow counterparts. The process is repeated until all features have been accepted or disregarded. The z-score of the original attributes must be statistically and significantly higher than the maximum z-score of the shadow attributes to identify the most pertinent features of the original attributes.
In this study, we opted for the Boruta program from https://github.com/scikit-learn-contrib/boruta_py and selected the default parameters for subsequent analysis.
Monte Carlo feature selection is a DT-based feature importance evaluation algorithm commonly used to process biological data (Micha et al., 2008; Chen X. et al., 2019; Li et al., 2020). In MCFS,
where
This study adopted the MCFS program sourced from http://www.ipipan.eu/staff/m.draminski/mcfs.html. It was executed using its default parameters.
The LightGBM is deemed as a strong machine learning algorithm that combines several weak DTs (Ke et al., 2017). It improves the gradient boosting decision tree (GBDT) by increasing the efficiency and reducing memory usage. According to the constructed DTs, LightGBM can also be used to evaluate the importance of features. If K DTs are constructed, the total number of times, denoted by T Split, for each feature is computed, which is defined as the overall used times in all DTs, i.e.,
where
In the present study, we utilized the LightGBM program sourced from https://lightgbm.readthedocs.io/en/latest/and ran the analysis by using the default settings.
It is still quite difficult to extract essential features from a feature list to comprise an optimal feature space for a given classification algorithm. Here, we introduced IFS, a well-liked method for determining the optimal feature space (Liu and Setiono, 1998; Chen L. et al., 2019; Zhang et al., 2020; Huang et al., 2023a; Huang et al., 2023b). The main steps of IFS are as follows: 1) From the feature list, lots of feature subsets are constructed with a fixed step, each of which contained some top features in the list. 2) One classifier is built on each constructed feature subset with a given classification algorithm and it is evaluated by 10-fold cross-validation (Kohavi, 1995). 3) The classifier with the best classification performance is selected as the optimal classifier and features used in this classifier are referred as the optimal features.
Among the 77 cell types, a 70-fold difference was observed between the largest number of cells and the smallest number of cells. It was not easy to build a fair classifier on such imbalanced dataset. The SMOTE is a data augmentation technique, which can be used to balance out the imbalanced dataset (Chawla et al., 2002). It tackles the imbalanced problem by employing new samples to minority classes. In particular, a sample is randomly selected from each minority class. Then,
Classification algorithm is necessary for IFS method. Here, two algorithms were used: DT (Safavian and Landgrebe, 1991) and RF (Breiman, 2001). Their brief introduction is as below.
DT is a basic classification and regression method with tree-like structures (Safavian and Landgrebe, 1991; Zhang et al., 2021). A DT model represents the classification and discrimination of data as a tree-like structure with nodes and directed edges. Based on one path of a DT from the root node to the leaf node, a rule can be set up, where each internal node corresponds to the rule’s condition, and a leaf node displays the outcome of an associated rule. Thus, a collection of if–then rules can be extracted from a DT. In implementing DT, we used the CART method and the scikit-learn package, with Gini coefficients serving as the IG (Pedregosa et al., 2011).
RF is an ensemble method, and its basic unit is DT (Breiman, 2001; Li et al., 2022; Ran et al., 2022; Yang and Chen, 2022; Wang and Chen 2023). Each DT was created based on randomly selected features and samples. For a given test sample, each tree provides its prediction. RF integrates these predictions using majority voting. In this study, the RF package from Python’s scikit-learn module was used for constructing RF classifiers.
Autoencoders are a type of deep learning algorithm that are very useful in the field of unsupervised learning (Hinton and Salakhutdinov, 2006; LeCun et al., 2015). They are a specific type of feedforward neural networks that are designed to receive an input and transform it into a different representation, which compress the data and reduce its dimensionality. Autoencoders compress the input into a lower-dimensional embedding and then reconstruct the output from this embedding, which is a lower-dimensional representation for a higher-dimensional data.
Autoencoders consist of three modules: encoder, embedding and decoder. The encoder maps the input data into the embedding. The embedding contains the compressed knowledge representation, which is typically smaller than the input data. The decoder reconstructs the input data back from the embedding. Autoencoder networks would perform as close to the perfect reconstruction as possible.
Assume we have an input data x with d-dimension, autoencoders first learn a mapping from x to y.
where f is a non-linear function. After this mapping is done, autoencoders learn a mapping from the embedding y back to reconstruction z of the same shape as x, which can be expressed as:
where g is another non-linear function. The loss function used to train autoencoders is called reconstruction loss, which is typically measured using MSE Loss or L1 Loss between x and z.
where z represents the predicted output and x represents the input data.
The reconstruction loss can be minimized by any mathematical optimization technique, but usually be accomplished by stochastic gradient descent (SGD) (Le, 2013). Z can be used as the low-dimensional embeddings of the samples.
In this study, autoencoder was used to process the optimal features obtained by IFS method. The reconstructed features were evaluated by LightGBM and the generated list was fed into IFS method again to set up a more efficient classifier.
The MCC is a comparatively balanced indicator that can be applied when the sample size is unbalanced. The range of MCC is [−1, 1], where a value of one indicates that predictions and actual results match up perfectly; a value of 0 indicates that the predictions are like random predictions, and −1 indicates that the actual outcomes differ from the prediction in a negative way. Thus, MCC can describe the strength of the correlation between the expected and actual results. For the multi-class classification problem, MCC can be calculated by using the following formula (Gorodkin, 2004; Liu et al., 2021; Pan et al., 2022; Tang and Chen, 2022; Wang and Chen, 2022; Zhang et al., 2022; Wu and Chen, 2023):
where N is the number of samples, K denotes the number of classes,
In addition, we also employed other two measurements: individual accuracy and overall accuracy (ACC). Individual accuracy indicates the prediction quality of the classifier on one class, which is defined as the proportion of correctly predicted samples in this class. ACC represents the overall performance of the classifier. It is defined as the proportion of correctly predicted samples to all samples.
In the current work, we used efficient feature selection methods and classification algorithms to mine significant features in various cell types to identify relevant characteristic chromatin accessibility patterns that can serve as cell-type-specific markers. Figure 1 displays the overall analysis framework. The description of the outcomes connected to each step was listed in this section.
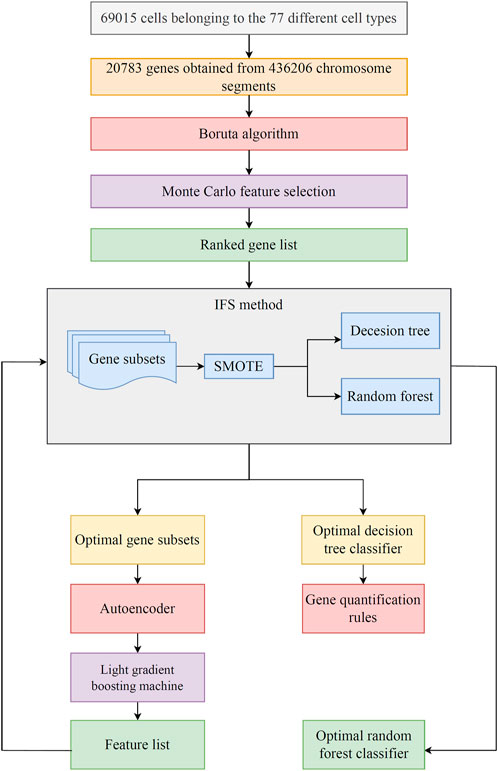
FIGURE 1. Flowchart of the machine learning procedure in this study. The transcriptionally active chromosome segments are identified by sci-ATAC-seq at single-cell resolution, including 69,015 cells belonging to 77 different cell types and 436,206 active chromosome segments mapped to 20,783 genes. The Boruta algorithm is used to filter genes, and then genes are ranked in accordance with the Monte Carlo feature selection algorithm. Subsequently, the optimal classifier and corresponding optimal feature subsets are obtained using incremental feature selection (IFS) and two classification algorithms. The classification rules are mined by the optimal decision tree (DT) classifier. Finally, the optimal features for random forest (RF) are reconstructed by autoencoder. The reconstructed features are evaluated by LightGBM, resulting in a feature list. IFS method is applied on such list to set up the final optimal RF classifier.
The current study included 77 cell types with a total of 69,015 and 20,783 genes. The gene features were first analyzed by Boruta. 3897 features were selected by Boruta, which are provided in Supplementary Table S2. Then, these features were investigated by MCFS, resulting in a feature list. Such list is also provided in Supplementary Table S2. The list would be entered into the IFS approach to determine the optimal features for constructing the optimal classifiers.
After the Boruta and MCFS feature selecting methods, 3897 genes were sorted in a list. Such list was then partitioned into 779 feature subsets by five-step intervals in IFS method. On each feature subset, one DT classifier and one RF classifier were built. Their performance was evaluated through 10-fold cross-validation. As mentioned in Section 2.8, MCC was selected as the major measurement. The IFS curves, as shown in Figure 2, for the two classification algorithms were plotted, where MCC and number of features were set as the Y-axis and X-axis, respectively. The detailed results of IFS are provided in Supplementary Table S3.
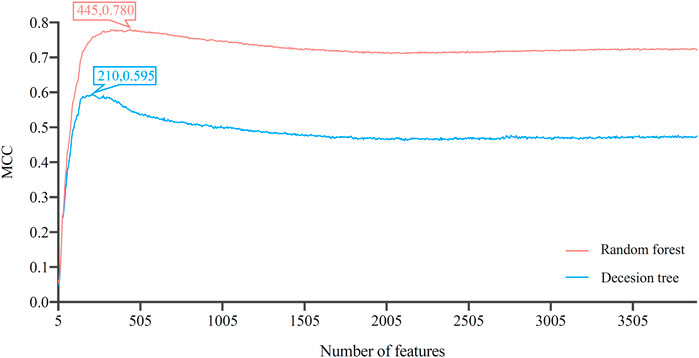
FIGURE 2. Incremental feature selection (IFS) curves of decision tree and random forest. The optimal classification performance alone with the optimal feature number for each algorithm has been labeled on the curve. Random forest has better classification results than decision tree.
The IFS curve indicated that RF had the greatest MCC (0.780) at 445 features. When the top 210 features were used in DT, the greatest MCC were 0.595. Accordingly, the optimal RF and DT classifiers were constructed. The ACC values of these two classifiers were 0.789 and 0.609, respectively, as listed in Table 1. The individual accuracies of them are also shown in Supplementary Table S3, which are illustrated in Figure 3. Evidently, the optimal RF classifier was superior to the optimal DT classifier. For the 445 features used in the optimal RF classifier, we used FindAllMarkers function in Seura package to extract differentially expressed genes for each cell type and adopted logFC to rank these genes in each cell type. The top gene in each cell type was selected, resulting in 73 genes. After excluding genes differentially expressed in more than 1 cell type, 47 genes were obtained. Their expression levels on 77 cell types are illustrated in a heatmap, as shown in Figure 4. It can be observed that some gene features shown good ability to distinguish different mouse cell types and application potential as marker genes for certain cell clusters.
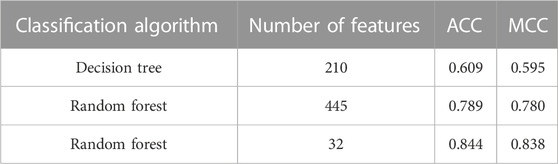
TABLE 1. Performance of the key classifiers.
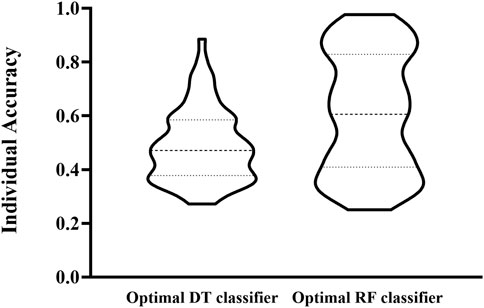
FIGURE 3. Violin plot to show the performance of two optimal classifiers on all cell types. RF classifier is evidently superior to DT classifier.
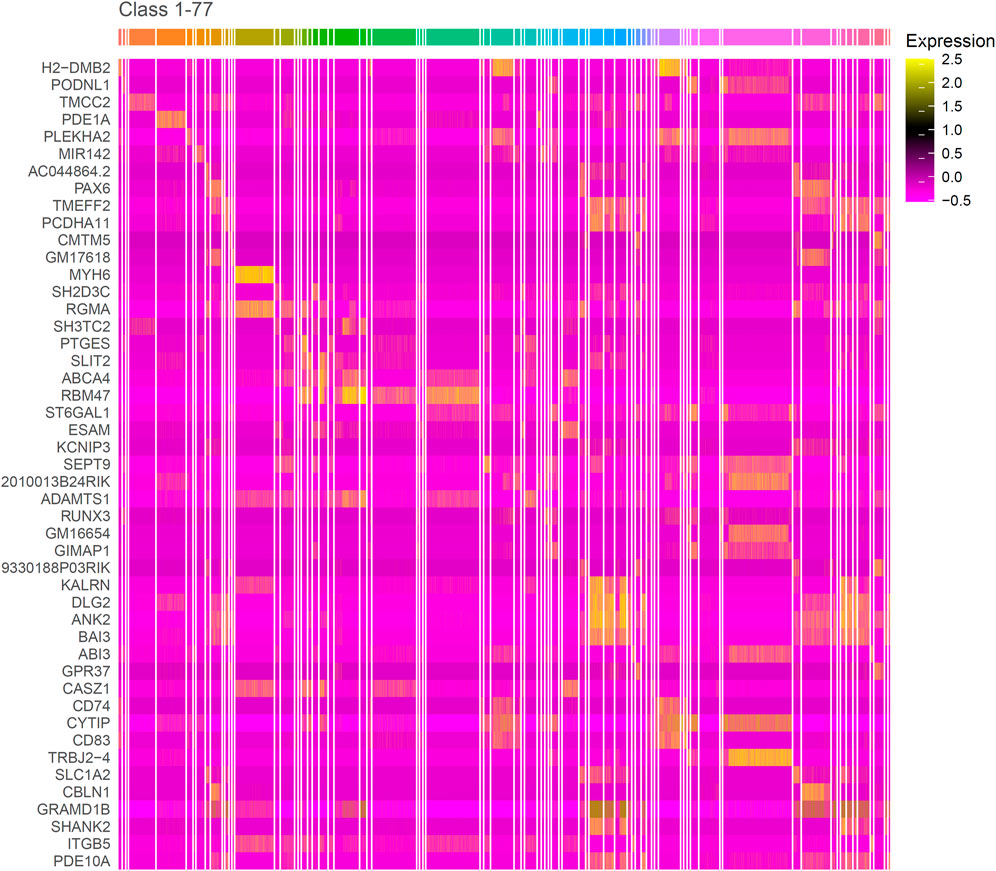
FIGURE 4. Heatmap of genes in the optimal gene subset obtained by MCFS and IFS. The bright color corresponding to the gene in the heatmap in some classes indicates that this gene is transcriptionally active in these classes. Similarly, if the gene is darker in the class, then it is transcriptionally inactive in this class. The marker genes identified by this research can distinguish different cell types.
Although the DT classifiers were generally inferior to the RF classifiers, it can provide more medical insights than RF as it is a classic white-box algorithm. Its readability of the working mechanism serves as its strongest distinguishing ability. We could produce a quantitative representation of the features used for different cell type classifications by exploiting the single-tree structure of DT to extract the classification rules.
As the optimal DT classifier adopted the top 210 genes features, all cells were represented by these features. A large tree was learnt from such dataset by DT. 24,257 rules were extracted from this tree, as shown in Supplementary Table S4. Each rule established a limit on the existence of gene features, indicating the relevance of the existence (value >0.5) or non-existence (value ≤0.5) of genes in distinguishing various cell types. Detailed analysis of these rules can be seen in Section 4. However, some rules can distinguish a small number of samples, which is out of the scope of our analysis.
In improving the classification performance, we introduced autoencoder to optimize feature representation. Based on the IFS results, RF achieved the optimal classification performance with MCC of 0.780 when top 445 features were used. These 445 gene features were reconstructed by autoencoder. The reconstructed features were ranked by LightGBM to generate a feature list. Such list was fed into IFS by one-interval step to obtain the optimal feature subsets and optimal RF classifier.
Similar to Figure 2, the IFS curve was plotted, as shown in Figure 5. The detailed IFS results are shown in Supplementary Table S5. The optimal RF classifier was constructed with MCC of 0.838 using the top 32 features in the feature list. The ACC of this classifier was 0.844 (Table 1). Compared with the previous optimal RF classifier (MCC = 0.780 and ACC = 0.789, see Table 1), the MCC was improved by 0.058 and ACC increased 0.055 after reconstructing features by autoencoder. All individual accuracies of this classifier are shown in Figure 6. All of them were quite high (higher than 0.6). Compared with the performance of the previous optimal RF classifier (Figure 3), they were evidently improved. Such result proved the effectiveness of autoencoder. The final constructed RF classifier can be used for the classification of cells based on single-cell ATAC-seq data.
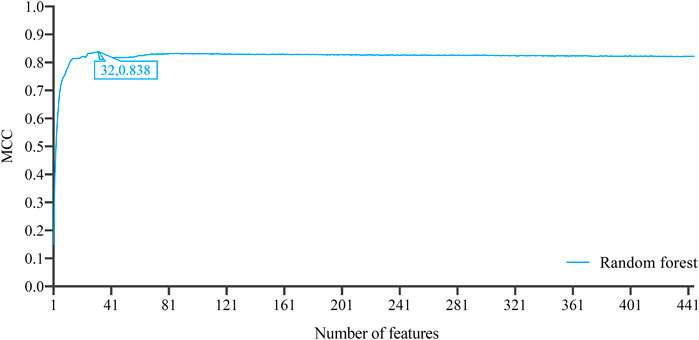
FIGURE 5. Incremental feature selection (IFS) curves of random forest based on the list by applying LightGBM to the features reconstructed by autoencoder. The optimal MCC of 0.838 is achieved when the number of features is 32, which is better than that based on the original 0–1 representation of genes.

FIGURE 6. Lollipop plot of individual accuracies yielded by the final random forest classifier for distinguishing different cell types. The circles represent the number of cells contained in different cell types. Some individual accuracies of this classifier optimized by autoencoder can reach up to 1, whereas no individual accuracies are lower than 0.6, indicating the effectiveness of the classifier for cell type classifications.
Our study presented a computational pipeline for analyzing the cell types of mice in single-cell ATAC-seq data. Cells isolated from 13 distinct tissues were further divided into 77 different cell types. By characterizing the chromatin accessibility at single-cell resolution, the status of chromatin accessibility within the gene region was considered as features. They were analyzed by feature selection methods, IFS method and classification algorithms. Lots of essential genes and classification rules were obtained. Here, we focused on some gene features and rules to discuss the relevance of chromatin accessibility in cell type discrimination, which may reveal the important roles of chromatin accessibility in transcriptional regulation and identify cell-type-specific regulatory patterns.
The genes were ranked in a list according to the evaluation results of MCFS. Genes with high ranks were more important than others. Here, we selected some top genes for detailed analysis, which are listed in Table 2.
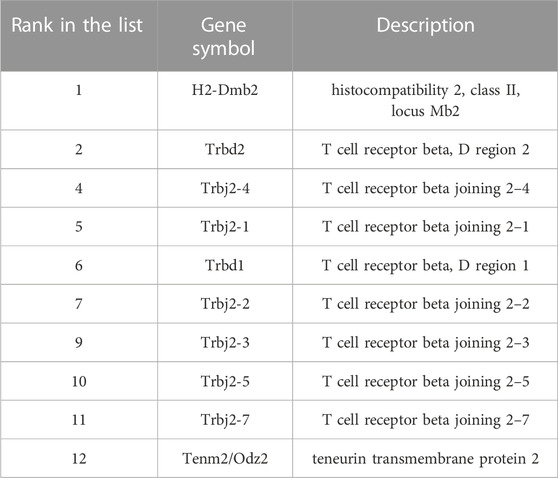
TABLE 2. Essential genes related to chromatin accessibility.
Our analysis identified the chromatin accessibility at the gene region of H2-Dmb2 to be highly related to the classification of cell types. The protein products encoded by H2-Dmb2 belong to the MHC class II beta chain paralogues, which are anchored in the membrane, and such products play a central role in peptide binding. MHC class II molecules are specifically expressed in antigen presenting cells such as dendritic cells or macrophages, thereby generating a biased expression of H2-Dmb2 primarily in the spleen, lymph node, and other immune-activated tissues (Rudensky et al., 1991; Cresswell, 1994; Yue et al., 2014). Given the specific expression pattern of H2-Dmb2 across tissues and cells, gene H2-Dmb2 shows high indicative value for distinguishing antigen-presenting cells and immune-activated tissues; thus, this gene can serve as a biomarker. The ortholog gene of H2-Dmb2 in human, namely, HLA-DMB, plays a critical role in the interaction between antigenic peptides and MHC class II molecules. The aberrant expression of HLA-DMB is associated with many diseases, including diabetes mellitus, autoimmune disease, infection, and cancer (Siegmund et al., 1999; Morel et al., 2004; Callahan et al., 2008; Aissani et al., 2014). Although the detailed mechanisms underlying disease progression remain unknown, the important role of HLA-DMB in antigen presentation cannot be neglected. Understanding the chromatin accessibility in HLA-DMB will contribute to revealing the regulatory mechanism and potential targets for disease treatment.
Among the most relevant features identified by our analysis, we found that alterations in chromatin accessibility are associated with many T cell receptor (TCR)-related genes, such as Trbd1, Trbd2, and Trbj2. In a single cell, the TCR beta chain is generated by the somatic recombination of variable V), joining J), diversity D), and constant C) gene segments. The recombination of different segments provides a wide range of antigen recognition for T cell function (Bassing et al., 2002). TCR genes are particularly expressed in T cells; therefore, they display a biased expression pattern in tissues with high infiltration of T lymphocyte. A TCR-β-targeting study by Mathieu et al. demonstrated that chromatin remodeling is associated with the control of TCR gene activation through several epigenetic regulatory mechanisms, and this process can influence the developmental control of TCR gene recombination (Mathieu et al., 2000). This finding indicates the important role of chromatin accessibility in modulating gene expression and consequent function alterations, which provides support for our results, that is, chromatin accessibility of TCR-related genes is highly related to cell functions and cell type classification.
The chromatin accessibility status of gene Tenm2 (also called ODZ2) was identified as another relevant feature for distinguishing cell and tissue types. Tenm2 is a protein coding gene, which is involved in neural development and cellular signal transduction (Rubin et al., 2002). Given the pivotal role of Tenm2 in neuronal cells, its transcriptional products exhibit a biased expression primarily in the central nervous system, brain, and other neural-related tissues as demonstrated by Mouse ENCODE transcriptome data (Yue et al., 2014). Although gene Tenm2 has been reported to be associated with diseases such as periodontitis and anosmia (Alkelai et al., 2016; Sayad et al., 2020), the linkage between Tenm2 and diseases was primarily built on the basis of genomic studies. Our analysis highlighted the epigenetic modification on gene regulation, indicating that chromatin accessibility at the gene region plays a crucial role in the selective expression of genes, which can serve as cell type-specific markers.
In improving the explicability of the features implicated in the classification, we performed a quantitative computational analysis using DT. A large number of decision rules involving 210 critical features were built to identify 77 cell types. We focused on the associations between the quantitative features and indicated cell types. Thus, we explored the relevance of the chromatin accessibility tendency of genes in distinguishing cell types through a literature review. Our study provided insights into disentangling cell-type-specific chromatin accessibility and suggested the new epigenetic markers of each cell type.
In the decision rules for identifying the cell type of heart cardiomyocyte, the Myh6 gene required a relatively high chromatin accessibility, whereas the Trbv31 and Nrxn1 genes required low chromatin accessibility. The Myh6 gene encodes the alpha heavy chain subunit of cardiac myosin, which is the key component of muscle cells. As demonstrated by the Mouse ENCODE transcriptome study, the expression of Myh6 is highly restricted toward heart tissues (Yue et al., 2014). A recent publication proposed that the repressive chromatin assembly on the Myh6 promoter can silence the expression of Myh6 and impair cardiac contraction (Han et al., 2016). This finding confirmed the crucial role of Myh6 chromatin modification in cardiac phenotypes, which indicates that the accessible chromatin status of Myh6 is an essential marker for functional cardiomyocytes. Trbv31 is a TCR-related gene, and it displays specific expression in T cells (Isobe et al., 1985). The criterion requiring a low chromatin accessibility of Trbv31 reflects a low gene expression, which is consistent with the actual condition, that is, rare lymphocytes reside within the heart cardiomyocyte environment. Nrxn1 encodes a single-pass type I membrane protein, which belongs to the neurexin family. Given that neurexins are cell-surface receptors that are restrictedly located at nervous synapses (Südhof, 2008), the Nrxn1 protein is not expressed in heart cardiomyocytes. Therefore, Nrxn1 serves as a negative marker indicating heart cardiomyocytes.
Among the decision rules for liver hepatocytes, 43 features were involved in the criteria, 42 of which required low chromatin accessibility of genes, whereas only one gene displayed a positive marker, that is, Slc27a2. The protein encoded by Slc27a2 is a fatty-acid coenzyme, which plays a key role in lipid biosynthesis and fatty acid degradation (Steinberg et al., 1999). The biased expression of Slc27a2 in liver and kidney tissues has been demonstrated by a previous study (Yue et al., 2014). The decision rules by our analysis indicate that a high chromatin accessibility of Slc27a2 is a positive marker indicating liver hepatocytes. The negative features for liver hepatocytes are mostly specific markers of other cell types, such as the aforementioned genes Trbv31 and Myh6, which are specifically expressed in T and cardiac cells, respectively. In addition, another gene (Lef1) was identified as a negative marker for liver hepatocytes. This gene encodes a transcription factor that can bind to T-cell receptor enhancer, and it is involved in the Wnt signaling pathway (Petropoulos et al., 2008). A biased expression of Lef1 in the thymus and spleen was demonstrated, which is consistent with its specificity in lymphocytes (Yue et al., 2014). These observations indicated that positive and negative features identified in this analysis contribute to the classification of corresponding cell type.
The relatively high chromatin accessibility of TCR-related genes such as Trbv31 and Trbj2 was required to indicate the cell type of thymus T cells. In addition, another positive feature, which is the chromatin accessibility of gene Lrmp, was identified to be involved in the decision rules for thymus T cells. Lrmp, also known as Irag2, encodes a lymphoid-restricted membrane protein, which can regulate the development of lymphoid cell lines (Behrens et al., 1994). RNA profiling data sets generated by the Mouse ENCODE project demonstrated the biased expression of Lrmp in thymus tissue (Yue et al., 2014). Our results indicated that in addition to post-transcriptional regulations, modifications of chromatin accessibility play important roles in gene expression control, which can be used as epigenetic markers for distinguishing lymphoid cells.
The decision rules for identifying sperm cells from testes include 45 criteria, among which the high chromatin accessibility of gene Nol4 was identified by our analysis. Nol4 is a cancer/testis antigen, and it has been reported to be involved in cancer progression (Kim et al., 2021). Cancer/testis antigens are a group of proteins with normal expression restricted to testicular germ cells but not in adult somatic tissues. In this study, our analysis showed that the chromatin accessibility pattern of the Nol4 gene was highly related to the classification of testicular sperm cells, presenting a reasonable relevance between the expression of Nol4 and testicular cells in non-malignant contexts and indicating the potential mechanism of cancer/testis antigen expression through chromatin accessibility modifications.
In this study, a series of quantitative rules was constructed to predict the category of cerebellar granule cells. Among these decision rules, Cbln1 and Arpp21 genes required high chromatin accessibility to distinguish cerebellar granule cells. Gene Cbln1 encodes a cerebellum-specific precursor protein, namely, precerebellin, which is highly enriched in postsynaptic structures of Purkinje cells (Urade et al., 1991). Research by Hirai et al. demonstrated that Cbln1 was secreted from cerebellar granule cells, which have important functions in Purkinje neurons (Hirai et al., 2005). Arpp21 encodes a cAMP-regulated phosphoprotein, which is enriched in the cerebellar cortex. The high level of Arpp21 mRNA was detected in the cerebellar cortex by in situ hybridization and Northern blot analysis (Brene et al., 1994). All these results confirmed the biased expression of Cbln1 and Arpp21 in cerebellum tissues, which support the predictive values of these genes for distinguishing cerebellar granule cells.
This study computationally investigated the characteristic chromatin accessibility of different mouse cell types at single-cell resolution. The most relevant features and quantitative decision rules were identified through several machine learning algorithms, indicating the potential epigenetic markers for each cell type. Detailed discussion was performed to explore the functional linkage between the chromatin accessibility pattern of genes and the indicated cell types. Many of the identified genes were biased or restrictedly expressed in specific tissues or cells, meaning they can serve as potential biomarkers for the corresponding cell types based on existing experimental evidence and publications. In addition, our study highlighted the epigenetic modification of chromatin in gene expression regulation, implying the critical roles of chromatin accessibility in cell function. Considering the interpretability of features, we primarily focused on features of the chromatin accessibility pattern of genes in cell type discrimination. The classifiers using features reconstructed by autoencoder showed excellent performance. Our study also provides insight into a comprehensive understanding of the genome-wide chromatin accessibility and generic markers in cell lines and tissues.
Publicly available datasets were analyzed in this study. This data can be found here:https://www.ncbi.nlm.nih.gov/geo/query/acc.cgi?acc=GSE111586.
ZZ, TH, and YC designed the study. YX, WG, KF, and LZ performed the experiments. YX and FH analyzed the results. YX, FH, and WG wrote the manuscript. All authors contributed to the research and reviewed the manuscript.
This research was funded by the National Key R&D Program of China [2022YFF1203202], Strategic Priority Research Program of Chinese Academy of Sciences [XDA26040304, XDB38050200], the Fund of the Key Laboratory of Tissue Microenvironment and Tumor of Chinese Academy of Sciences [202002], Shandong Provincial Natural Science Foundation [ZR2022MC072].
The authors declare that the research was conducted in the absence of any commercial or financial relationships that could be construed as a potential conflict of interest.
All claims expressed in this article are solely those of the authors and do not necessarily represent those of their affiliated organizations, or those of the publisher, the editors and the reviewers. Any product that may be evaluated in this article, or claim that may be made by its manufacturer, is not guaranteed or endorsed by the publisher.
The Supplementary Material for this article can be found online at: https://www.frontiersin.org/articles/10.3389/fgene.2023.1145647/full#supplementary-material
Aissani, B., Boehme, A. K., Wiener, H. W., Shrestha, S., Jacobson, L. P., and Kaslow, R. A. (2014). SNP screening of central MHC-identified HLA-DMB as a candidate susceptibility gene for HIV-related Kaposi’s sarcoma. Genes Immun. 15, 424–429. doi:10.1038/gene.2014.42
Alkelai, A., Olender, T., and Haffner, - Krausz, R., Tsoory, M. M., Boyko, V., et al. (2016). A role for TENM1 mutations in congenital general anosmia. Clin. Genet. 90, 211–219. doi:10.1111/cge.12782
Allis, C. D., and Jenuwein, T. (2016). The molecular hallmarks of epigenetic control. Nat. Rev. Genet. 17, 487–500. doi:10.1038/nrg.2016.59
Bassing, C. H., Swat, W., and Alt, F. W. (2002). The mechanism and regulation of chromosomal V (D) J recombination. Cell 109, S45–S55. doi:10.1016/s0092-8674(02)00675-x
Behrens, T. W., Jagadeesh, J., Scherle, P., Kearns, G., Yewdell, J., and Staudt, L. M. (1994). Jaw1, A lymphoid-restricted membrane protein localized to the endoplasmic reticulum. J. Immunol. 153, 682–690. doi:10.4049/jimmunol.153.2.682
Boyle, A. P., Davis, S., Shulha, H. P., Meltzer, P., Margulies, E. H., Weng, Z., et al. (2008). High-resolution mapping and characterization of open chromatin across the genome. Cell 132, 311–322. doi:10.1016/j.cell.2007.12.014
Brene, S., Lindefors, N., Ehrlich, M., Taubes, T., Horiuchi, A., Kopp, J., et al. (1994). Expression of mRNAs encoding ARPP-16/19, ARPP-21, and DARPP-32 in human brain tissue. J. Neurosci. 14, 985–998. doi:10.1523/JNEUROSCI.14-03-00985.1994
Buenrostro, J. D., Giresi, P. G., Zaba, L. C., Chang, H. Y., and Greenleaf, W. J. (2013). Transposition of native chromatin for fast and sensitive epigenomic profiling of open chromatin, DNA-binding proteins and nucleosome position. Nat. methods 10, 1213–1218. doi:10.1038/nmeth.2688
Callahan, M. J., Nagymanyoki, Z., Bonome, T., Johnson, M. E., Litkouhi, B., Sullivan, E. H., et al. (2008). Increased HLA-DMB expression in the tumor epithelium is associated with increased CTL infiltration and improved prognosis in advanced-stage serous ovarian cancer. Clin. Cancer Res. 14, 7667–7673. doi:10.1158/1078-0432.CCR-08-0479
Chawla, N. V., Bowyer, K. W., Hall, L. O., and Kegelmeyer, W. P. (2002). Smote: Synthetic minority over-sampling technique. J. Artif. Intell. Res. 16, 321–357. doi:10.1613/jair.953
Chen, L., Zeng, T., Pan, X., Zhang, Y. H., Huang, T., and Cai, Y. D. (2019a). Identifying methylation pattern and genes associated with breast cancer subtypes. Int. J. Mol. Sci. 20, 4269. doi:10.3390/ijms20174269
Chen, X., Jin, Y., and Feng, Y. (2019b). Evaluation of plasma extracellular vesicle MicroRNA signatures for lung adenocarcinoma and granuloma with monte-carlo feature selection method. Front. Genet. 10, 367. doi:10.3389/fgene.2019.00367
Corces, M. R., Buenrostro, J. D., Wu, B., Greenside, P. G., Chan, S. M., Koenig, J. L., et al. (2016). Lineage-specific and single-cell chromatin accessibility charts human hematopoiesis and leukemia evolution. Nat. Genet. 48, 1193–1203. doi:10.1038/ng.3646
Cresswell, P. (1994). Assembly, transport, and function of MHC class II molecules. Annu. Rev. Immunol. 12, 259–293. doi:10.1146/annurev.iy.12.040194.001355
Cusanovich, D. A., Hill, A. J., Aghamirzaie, D., Daza, R. M., Pliner, H. A., Berletch, J. B., et al. (2018a). A single-cell atlas of in vivo mammalian chromatin accessibility. Cell 174, 1309–1324.e18. doi:10.1016/j.cell.2018.06.052
Cusanovich, D. A., Hill, A. J., Aghamirzaie, D., Daza, R. M., Pliner, H. A., Berletch, J. B., et al. (2018b). A single-cell atlas of in vivo mammalian chromatin accessibility. Cell 174, 1309–1324.e18. doi:10.1016/j.cell.2018.06.052
Gorodkin, J. (2004). Comparing two K-category assignments by a K-category correlation coefficient. Comput. Biol. Chem. 28, 367–374. doi:10.1016/j.compbiolchem.2004.09.006
Han, P., Li, W., Yang, J., Shang, C., Lin, C.-H., Cheng, W., et al. (2016). Epigenetic response to environmental stress: Assembly of BRG1–G9a/GLP–DNMT3 repressive chromatin complex on Myh6 promoter in pathologically stressed hearts. Biochimica Biophysica Acta (BBA)-Molecular Cell Res. 1863, 1772–1781. doi:10.1016/j.bbamcr.2016.03.002
Hendrich, B., and Bickmore, W. (2001). Human diseases with underlying defects in chromatin structure and modification. Hum. Mol. Genet. 10, 2233–2242. doi:10.1093/hmg/10.20.2233
Hewish, D. R., and Burgoyne, L. A. (1973). Chromatin sub-structure. The digestion of chromatin DNA at regularly spaced sites by a nuclear deoxyribonuclease. Biochem. biophysical Res. Commun. 52, 504–510. doi:10.1016/0006-291x(73)90740-7
Hinton, G. E., and Salakhutdinov, R. R. (2006). Reducing the dimensionality of data with neural networks. Science 313, 504–507. doi:10.1126/science.1127647
Hirai, H., Pang, Z., Bao, D., Miyazaki, T., Li, L., Miura, E., et al. (2005). Cbln1 is essential for synaptic integrity and plasticity in the cerebellum. Nat. Neurosci. 8, 1534–1541. doi:10.1038/nn1576
Huang, F., Fu, M., Li, J., Chen, L., Feng, K., Huang, T., et al. (2023a). Analysis and prediction of protein stability based on interaction network, gene ontology, and KEGG pathway enrichment scores. BBA - Proteins Proteomics 1871, 140889. doi:10.1016/j.bbapap.2023.140889
Huang, F., Ma, Q., Ren, J., Li, J., Wang, F., Huang, T., et al. (2023b). Identification of smoking associated transcriptome aberration in blood with machine learning methods. BioMed Res. Int. 2023, 5333361. doi:10.1155/2023/5333361
Isobe, M., Erikson, J., Emanuel, B. S., Nowell, P. C., and Croce, C. M. (1985). Location of gene for beta subunit of human T-cell receptor at band 7q35, a region prone to rearrangements in T cells. Science 228, 580–582. doi:10.1126/science.3983641
Ke, G., Meng, Q., Finley, T., Wang, T., Chen, W., Ma, W., et al. (2017). Lightgbm: A highly efficient gradient boosting decision tree. Adv. neural Inf. Process. Syst. 30, 3146–3154.
Kim, Y.-R., Kim, K.-U., Lee, J.-H., Kim, D.-W., Chung, J.-H., Kim, Y.-D., et al. (2021). Cancer testis antigen, NOL4, is an immunogenic antigen specifically expressed in small-cell lung cancer. Curr. Oncol. 28, 1927–1937. doi:10.3390/curroncol28030179
Klemm, S. L., Shipony, Z., and Greenleaf, W. J. (2019). Chromatin accessibility and the regulatory epigenome. Nat. Rev. Genet. 20, 207–220. doi:10.1038/s41576-018-0089-8
Kohavi, R. (1995). “A study of cross-validation and bootstrap for accuracy estimation and model selection,” in Proceedings of the 14th international joint conference on Artificial intelligence - volume 2 (Montreal, Quebec, Canada: Morgan Kaufmann Publishers Inc.).
Kursa, M. B., and Rudnicki, W. R. (2010). Feature selection with the Boruta package. J. Stat. Softw. 36, 1–13. doi:10.18637/jss.v036.i11
Le, Q. V. (2013). Building high-level features using large scale unsupervised learning. IEEE international conference on acoustics, speech and signal processing. IEEE, 8595–8598.
Lecun, Y., Bengio, Y., and Hinton, G. (2015). Deep learning. nature 521, 436–444. doi:10.1038/nature14539
Lee, C.-K., Shibata, Y., Rao, B., Strahl, B. D., and Lieb, J. D. (2004). Evidence for nucleosome depletion at active regulatory regions genome-wide. Nat. Genet. 36, 900–905. doi:10.1038/ng1400
Li, J., Lu, L., Zhang, Y. H., Xu, Y., Liu, M., Feng, K., et al. (2020). Identification of leukemia stem cell expression signatures through Monte Carlo feature selection strategy and support vector machine. Cancer Gene Ther. 27, 56–69. doi:10.1038/s41417-019-0105-y
Li, X., Lu, L., and Chen, L. (2022). Identification of protein functions in mouse with a label space partition method. Math. Biosci. Eng. 19, 3820–3842. doi:10.3934/mbe.2022176
Liu, H., Hu, B., Chen, L., and Lu, L. (2021). Identifying protein subcellular location with embedding features learned from networks. Curr. Proteomics 18, 646–660. doi:10.2174/18756247mtexbnzcw1
Liu, H., and Setiono, R. (1998). Incremental feature selection. Appl. Intell. 9, 217–230. doi:10.1023/a:1008363719778
Mathieu, N., Hempel, W. M., Spicuglia, S., Verthuy, C., and Ferrier, P. (2000). Chromatin remodeling by the T cell receptor (TCR)-β gene enhancer during early T cell development: Implications for the control of TCR-β locus recombination. J. Exp. Med. 192, 625–636. doi:10.1084/jem.192.5.625
Micha, D., Rada-Iglesias, A., Enroth, S., Wadelius, C., Koronacki, J., and Komorowski, J. (2008). Monte Carlo feature selection for supervised classification. Bioinformatics 24, 110–117. doi:10.1093/bioinformatics/btm486
Morel, J., Roch-Bras, F., Molinari, N., Sany, J., Eliaou, J., and Combe, B. (2004). HLA-DMA* 0103 and HLA-DMB* 0104 alleles as novel prognostic factors in rheumatoid arthritis. Ann. Rheumatic Dis. 63, 1581–1586. doi:10.1136/ard.2003.012294
Ozsolak, F., Song, J. S., Liu, X. S., and Fisher, D. E. (2007). High-throughput mapping of the chromatin structure of human promoters. Nat. Biotechnol. 25, 244–248. doi:10.1038/nbt1279
Pan, X., Chen, L., Liu, I., Niu, Z., Huang, T., and Cai, Y. D. (2022). Identifying protein subcellular locations with embeddings-based node2loc. IEEE/ACM Trans. Comput. Biol. Bioinform 19, 666–675. doi:10.1109/TCBB.2021.3080386
Pedregosa, F., Varoquaux, G., Gramfort, A., Michel, V., Thirion, B., Grisel, O., et al. (2011). Scikit-learn Mach. Learn. Python 12, 2825–2830.
Petropoulos, K., Arseni, N., Schessl, C., Stadler, C. R., Rawat, V. P., Deshpande, A. J., et al. (2008). A novel role for Lef-1, a central transcription mediator of Wnt signaling, in leukemogenesis. J. Exp. Med. 205, 515–522. doi:10.1084/jem.20071875
Pliner, H. A., Packer, J. S., Mcfaline-Figueroa, J. L., Cusanovich, D. A., Daza, R. M., Aghamirzaie, D., et al. (2018). Cicero predicts cis-regulatory DNA interactions from single-cell chromatin accessibility data. Mol. Cell 71, 858–871.e8. doi:10.1016/j.molcel.2018.06.044
Poirier, M. G., Bussiek, M., Langowski, J., and Widom, J. (2008). Spontaneous access to DNA target sites in folded chromatin fibers. J. Mol. Biol. 379, 772–786. doi:10.1016/j.jmb.2008.04.025
Ran, B., Chen, L., Li, M., Han, Y., and Dai, Q. (2022). Drug-Drug interactions prediction using fingerprint only. Comput. Math. Methods Med. 2022, 7818480. doi:10.1155/2022/7818480
Rubin, B. P., Tucker, R. P., Brown-Luedi, M., Martin, D., and Chiquet-Ehrismann, R. (2002). Teneurin 2 is expressed by the neurons of the thalamofugal visual system in situ and promotes homophilic cell-cell adhesion in vitro.
Rudensky, A. Y., Preston-Hurlburt, P., Hong, S.-C., Barlow, A., and Janeway, C. A. (1991). Sequence analysis of peptides bound to MHC class II molecules. Nature 353, 622–627. doi:10.1038/353622a0
Safavian, S. R., and Landgrebe, D. (1991). A survey of decision tree classifier methodology. IEEE Trans. Syst. man, Cybern. 21, 660–674. doi:10.1109/21.97458
Sayad, A., Gholami, L., Mirzajani, S., Omrani, M. D., Ghafouri-Fard, S., and Taheri, M. (2020). Genetic susceptibility for periodontitis with special focus on immune-related genes: A concise review. Gene Rep. 21, 100814. doi:10.1016/j.genrep.2020.100814
Schep, A. N., Wu, B., Buenrostro, J. D., and Greenleaf, W. J. (2017). chromVAR: inferring transcription-factor-associated accessibility from single-cell epigenomic data. Nat. methods 14, 975–978. doi:10.1038/nmeth.4401
Sheffield, N. C., and Furey, T. S. (2012). Identifying and characterizing regulatory sequences in the human genome with chromatin accessibility assays. Genes 3, 651–670. doi:10.3390/genes3040651
Siegmund, T., Donner, H., Braun, J., Usadel, K., and Badenhoop, K. (1999). HLA-DMA and HLA-DMB alleles in German patients with type 1 diabetes mellitus. Tissue antigens 54, 291–294. doi:10.1034/j.1399-0039.1999.540313.x
Steinberg, S. J., Wang, S. J., Kim, D. G., Mihalik, S. J., and Watkins, P. A. (1999). Human very-long-chain acyl-CoA synthetase: Cloning, topography, and relevance to branched-chain fatty acid metabolism. Biochem. biophysical Res. Commun. 257, 615–621. doi:10.1006/bbrc.1999.0510
Stuart, T., Butler, A., Hoffman, P., Hafemeister, C., Papalexi, E., Mauck, W. M., et al. (2019). Comprehensive integration of single-cell data. Cell 177, 1888–1902.e21. doi:10.1016/j.cell.2019.05.031
Südhof, T. C. (2008). Neuroligins and neurexins link synaptic function to cognitive disease. Nature 455, 903–911. doi:10.1038/nature07456
Tang, S., and Chen, L. (2022). iATC-NFMLP: Identifying classes of anatomical therapeutic chemicals based on drug networks, fingerprints and multilayer perceptron. Curr. Bioinforma. 17, 814–824. doi:10.2174/1574893617666220318093000
Thurman, R. E., Rynes, E., Humbert, R., Vierstra, J., Maurano, M. T., Haugen, E., et al. (2012). The accessible chromatin landscape of the human genome. Nature 489, 75–82. doi:10.1038/nature11232
Urade, Y., Oberdick, J., Molinar-Rode, R., and Morgan, J. (1991). Precerebellin is a cerebellum-specific protein with similarity to the globular domain of complement C1q B chain. Proc. Natl. Acad. Sci. 88, 1069–1073. doi:10.1073/pnas.88.3.1069
Wang, H., and Chen, L. (2023). PMPTCE-HNEA: Predicting metabolic pathway types of chemicals and enzymes with a heterogeneous network embedding algorithm. Current Bioinformatics.
Wang, R., and Chen, L. (2022). Identification of human protein subcellular location with multiple networks. Curr. Proteomics 19, 344–356. doi:10.2174/1570164619666220531113704
Wu, C., and Chen, L. (2023). A model with deep analysis on a large drug network for drug classification. Math. Biosci. Eng. 20, 383–401. doi:10.3934/mbe.2023018
Yang, Y., and Chen, L. (2022). Identification of drug–disease associations by using multiple drug and disease networks. Curr. Bioinforma. 17, 48–59. doi:10.2174/1574893616666210825115406
Yue, F., Cheng, Y., Breschi, A., Vierstra, J., Wu, W., Ryba, T., et al. (2014). A comparative encyclopedia of DNA elements in the mouse genome. Nature 515, 355–364. doi:10.1038/nature13992
Zhang, Y. H., Li, Z. D., Zeng, T., Chen, L., Huang, T., and Cai, Y. D. (2022). Screening gene signatures for clinical response subtypes of lung transplantation. Mol. Genet. Genomics 297, 1301–1313. doi:10.1007/s00438-022-01918-x
Zhang, Y. H., Li, Z., Zeng, T., Pan, X., Chen, L., Liu, D., et al. (2020). Distinguishing glioblastoma subtypes by methylation signatures. Front. Genet. 11, 604336. doi:10.3389/fgene.2020.604336
Keywords: chromatin accessibility, chromatin heterogeneity, single-cell resolution, mouse cell type, machine learning, biomarker genes
Citation: Xu Y, Huang F, Guo W, Feng K, Zhu L, Zeng Z, Huang T and Cai Y-D (2023) Characterization of chromatin accessibility patterns in different mouse cell types using machine learning methods at single-cell resolution. Front. Genet. 14:1145647. doi: 10.3389/fgene.2023.1145647
Received: 16 January 2023; Accepted: 20 February 2023;
Published: 01 March 2023.
Edited by:
Quan Zou, University of Electronic Science and Technology of China, ChinaReviewed by:
Taigang Liu, Shanghai Ocean University, ChinaCopyright © 2023 Xu, Huang, Guo, Feng, Zhu, Zeng, Huang and Cai. This is an open-access article distributed under the terms of the Creative Commons Attribution License (CC BY). The use, distribution or reproduction in other forums is permitted, provided the original author(s) and the copyright owner(s) are credited and that the original publication in this journal is cited, in accordance with accepted academic practice. No use, distribution or reproduction is permitted which does not comply with these terms.
*Correspondence: Zhenbing Zeng, emJ6ZW5nQHNodS5lZHUuY24=; Tao Huang, dG9odWFuZ3Rhb0AxMjYuY29t; Yu-Dong Cai, Y2FpX3l1ZEAxMjYuY29t
†These authors have contributed equally to this work
Disclaimer: All claims expressed in this article are solely those of the authors and do not necessarily represent those of their affiliated organizations, or those of the publisher, the editors and the reviewers. Any product that may be evaluated in this article or claim that may be made by its manufacturer is not guaranteed or endorsed by the publisher.
Research integrity at Frontiers
Learn more about the work of our research integrity team to safeguard the quality of each article we publish.