 Yuqiao Ji
 Zhengjun Lin
 Guoqing Li1
 Yanlin Wu
 Tang Liu
95% of researchers rate our articles as excellent or good
Learn more about the work of our research integrity team to safeguard the quality of each article we publish.
Find out more
ORIGINAL RESEARCH article
Front. Genet. , 04 September 2023
Sec. Cancer Genetics and Oncogenomics
Volume 14 - 2023 | https://doi.org/10.3389/fgene.2023.1136783
This article is part of the Research Topic Machine Learning Faciliates Biomarker Discovery for Complex Diseases View all 4 articles
Objectives: Osteosarcoma is the most common primary malignant tumor in children and adolescents, and the 5-year survival of osteosarcoma patients gained no substantial improvement over the past decades. Effective biomarkers in diagnosing osteosarcoma are warranted to be developed. This study aims to explore novel biomarkers correlated with immune cell infiltration in the development and diagnosis of osteosarcoma.
Methods: Three datasets (GSE19276, GSE36001, GSE126209) comprising osteosarcoma samples were extracted from Gene Expression Omnibus (GEO) database and merged to obtain the gene expression. Then, differentially expressed genes (DEGs) were identified by limma and potential biological functions and downstream pathways enrichment analysis of DEGs was performed. The machine learning algorithms LASSO regression model and SVM-RFE (support vector machine-recursive feature elimination) analysis were employed to identify candidate hub genes for diagnosing patients with osteosarcoma. Receiver operating characteristic (ROC) curves were developed to evaluate the discriminatory abilities of these candidates in both training and test sets. Furthermore, the characteristics of immune cell infiltration in osteosarcoma, and the correlations between these potential genes and immune cell abundance were illustrated using CIBERSORT. qRT-PCR and western blots were conducted to validate the expression of diagnostic candidates.
Results: GEO datasets were divided into the training (merged GSE19276, GSE36001) and test (GSE126209) groups. A total of 71 DEGs were screened out in the training set, including 10 upregulated genes and 61 downregulated genes. These DEGs were primarily enriched in immune-related biological functions and signaling pathways. After machine learning by SVM-RFE and LASSO regression model, four biomarkers were chosen for the diagnostic nomogram for osteosarcoma, including ASNS, CD70, SRGN, and TRIB3. These diagnostic biomarkers all possessed high diagnostic values (AUC ranging from 0.900 to 0.955). Furthermore, these genes were significantly correlated with the infiltration of several immune cells, such as monocytes, macrophages M0, and neutrophils.
Conclusion: Four immune-related candidate hub genes (ASNS, CD70, SRGN, TRIB3) with high diagnostic value were confirmed for osteosarcoma patients. These diagnostic genes were significantly connected with the immune cell abundance, suggesting their critical roles in the osteosarcoma tumor immune microenvironment. Our study provides highlights on novel diagnostic candidate genes with high accuracy for diagnosing osteosarcoma patients.
Osteosarcoma is one of the most common bone malignancies that mainly affect children and adolescents (Ritter and Bielack, 2010; Gill and Gorlick, 2021). Despite advances in the development of treatment approaches, improving the clinical outcomes of patients with osteosarcoma is still largely challenging (Chen Y. et al., 2021; Meltzer and Helman, 2021). Notably, the genomic complexity and instability of osteosarcoma have become the major hinder to successful treatment (Kansara et al., 2014; Gianferante et al., 2017). It is necessary to optimize the early detection, treatment progress, and prognosis prediction of osteosarcoma based on molecular genetics. Hence, developing novel and reliable biomarkers to complement and improve current osteosarcoma screening strategies is urgently warranted. Notably, the tumor immune microenvironment has gained increasing attention, and complex tumor immune microenvironment components can contribute to the tumor heterogeneity and multifaceted mechanisms of osteosarcoma progression and metastasis (Zhou et al., 2020; Yu et al., 2021; Marchais et al., 2022). For instance, a previous single-cell RNA study has reported that the infiltration of proinflammatory FABP4 macrophages is detected in lung metastatic osteosarcoma lesions, and TIGIT (T cell immune receptor with immunoglobulin and ITIIM domain) blockade treatment significantly facilitates the cytotoxicity effects of the primary CD3+ T cells with a high proportion of TIGIT + cells against osteosarcoma (Zhou et al., 2020). Hence, identifying immune-related gene signatures can facilitate the diagnosis of patients with osteosarcoma and the elucidation of the general mechanisms of osteosarcoma initiation and progression.
Nowadays, comprehensive bioinformatics analysis and microarray technology have been widely applied to explore novel specific disease-related genes and their biological functions, thus helping the early diagnosis of diseases and illustrating the underlying mechanisms of disease occurrence and development (Perez-Iratxeta et al., 2007; Werner, 2008; Gong et al., 2018). Machine learning is an emerging field of artificial intelligence, which can identify future trends and predict the results of existing data (Deo, 2015; Greener et al., 2022). Machine learning has broad applications in biological medicine, and can effectively explore prospective biomarkers and therapeutic targets, and potential mechanisms for various human diseases (Bigorra et al., 2019; Chen Z. et al., 2021; Liu et al., 2021). For instance, five immune-associated diagnostic genes (ITGAL, CXCL16, MORF4L2, SPRY2, and BEX2) have been identified to diagnose aortic valve calcification patients with metabolic syndrome by employing bioinformatics analysis and machine learning algorithms (Zhou et al., 2022). Recently, several studies have explored novel diagnostic and prognostic biomarkers in osteosarcoma by comprehensive bioinformatics analysis. For instance, Li et al. (2022) have constructed a model based on six machine learning (ML) algorithms for the prediction of lymph node metastasis, and T and M stage, surgery, and chemotherapy have been regarded as independent risk factors. A recent study has constructed a prognosis model based on ferroptosis-related genes for osteosarcoma patients by univariate COX regression and LASSO regression (Huang et al., 2023). However, there has limited research focusing on the identification and validation of diagnostic biomarkers associated with immune signatures for patients with osteosarcoma by combining machine learning and bioinformatics methods, as well as further illustrating the prognostic value of these diagnostic candidates.
In the present study, we obtained three osteosarcoma datasets from the GEO database, which were further merged and divided into two sets. After identifying DEGs in the training set, machine learning algorithms were employed to further select key diagnostic candidates. We also investigated the immune landscape in osteosarcoma and explored the relationship between these potential diagnostic biomarkers and immune cell infiltration. Besides, we also validated the expression pattern of these biomarkers in vitro.
Three raw datasets (GSE19276, GSE36001, GSE126209) comprising osteosarcoma samples were extracted from the GEO database (https://www.ncbi.nlm.nih.gov/geo/). The GSE19276 (comprising 44 osteosarcoma samples and 5 normal samples) and GSE36001 (comprising 19 osteosarcoma samples and 6 normal samples) datasets are merged to be the training group while the GSE126209 (comprising 12 osteosarcoma samples and 11 normal samples) dataset was confirmed as the test group. The Principal Component Analysis (PCA) plots before and after merging the two datasets were generated using “stats” package of R software to examine the comprehensive data representation.
To identify differentially expressed genes (DEGs) between osteosarcoma and normal samples, the two datasets (GSE19276 and GSE36001) were merged as the training set, and DEGs were filtered with |logFC|≥1.0 and FDR<0.05 by utilizing the “limma” package in R software. After extracting the DEGs and their expression in the training set, the “pheatmap” and “ggplot2” packages were utilized to visually draw the “heat map” and “volcano plot” of these DEGs.
The Gene Ontology (GO; http://www.geneontology.org) comprehensively and computably provided the functions of genes and gene products (The Gene Ontology Consortium, 2019). Kyoto Encyclopedia of Genes and Genomes (KEGG; https://www.kegg.jp) were utilized to integrate various biological pathways on gene and gene products (Kanehisa et al., 2022). Disease Ontology (DO; http://disease-ontology.org) was employed to integrate human diseases and the human genome corresponding to genes (Schriml et al., 2012). We utilized GO, KEGG and DO enrichment analysis by the “clusterProfiler” package to reveal the biological functions, downstream signaling pathways, and human diseases of these DEGs.
Focused on interpreting the shared functions, properties, and regulation of the biological items represented within the datasets, GSEA was performed to identify the biological functions-related items that differed most significantly between the osteosarcoma and the control subgroups. GESA enrichment has become the most curial analytical methods analysis (Subramanian et al., 2005). The GSEA was performed by employing the “clusterProfiler” package of R software.
To further select diagnostic candidates among these DEGs, we adopted two commonplace algorithms LASSO and SVM-RFE. The LASSO algorithm could stabilize the vanilla linear regression and circumvent overfitting and outliers, thereby predicating the accuracy for selecting variables (McEligot et al., 2020). The SVM-RFE algorithm was committed to accurate feature selection, and hence, it is commonplacely utilized to filter out the features and potential disease biomarkers for microarray data (Sanz et al., 2018). In our research, the two algorithms were combined to identify the important DEGs via the “glmnet” package for LASSO and “e1071” package for SVM-RFE. On the basis of LASSO and SVM-RFE algorithms, we use a Venn diagram to visualize the overlapping genes and the final diagnostic candidates.
The receiver operating characteristic (ROC) curve with horizontal coordinate sensitivity and vertical coordinate 1-specificity range from 0–1.0 was employed to evaluate the diagnostic value of each diagnostic biomarker. The calculation area below the ROC curve (AUC) value along with 95% CI was calculated by “pROC” package of R software (Mandrekar, 2010). Additionally, the candidates are considered to have great diagnostic value and considerable accuracy in further research with AUC value > 0.9 in the training group. Next, “rms” and “rmda” packages were used to generate the nomogram comprising all candidates. By using the nomogram’s predictions, the comprehensive ROC curve was constructed to assess the overall model accuracy.
In order to further validate the diagnostic value and differential expression of feature biomarkers, the GSE126209 dataset as test group was employed for verify the diagnostic value. Simultaneously, we compared the expression of candidate genes between osteosarcoma and normal samples in the test dataset, and plotted a diagram to visualize the outcome.
In this section, we conducted univariate Cox analysis and Kaplan-Meier survival analysis to explore the prognostic value of screened genes in the prognosis of osteosarcoma patients. Osteosarcoma patients with survival information were extracted from TARGET-OS database samples were obtained from the TARGET database (https://ocg.cancer.gov/programs/target). R packages “survival” and “survminer” were used to conduct this investigation process.
Increasing evidence has demonstrated that the degree of immune cell infiltration was significantly correlated with cancer progression and the prognosis of cancer patients (Mao et al., 2021). By employing CIBERSORT algorithm, the infiltration of 22 immune cell types in osteosarcoma was illustrated. The “ggplot2” and “pheatmap” packages were utilized to visualize the relationship among these different immune cells. The correlation heatmap was implemented by “corrplot” package while the violin plot was corresponded by “vioplot” package, which showed the difference in immune cell infiltration between the osteosarcoma subgroup and the normal subgroup. Simultaneously, the “ggplot2” and “ggpubr” packages are utilized to analyze the correlation between the functional biomarkers and immune cell infiltration via Spearman correlation analysis.
The total RNA of hfob, HOS, U2-OS and 143B was extracted using SteadyPure Rapid RNA Extraction Kit (Accurate Biology, China). The step of reverse transcription of the total RNA into complementary DNA (cDNA) synthesis was conducted by Evo M-MLV Reverse Transcription Kit (Accurate Biology, China). SYBR Green qPCR Hub Mix (Accurate Biology, China) was utilized for quantitative real-time polymerase chain reaction (qRT-PCR). The GAPDH gene is used as an internal reference gene. Conditions for PCR were: one cycle at 95°C for 30 s, 40 cycles of denaturation for 5 s at 95°C followed by amplification for 30 s at 60°C. The primer sequences of ASNS, CD70, SRGN and TRIB3 can be found in of the Supplementary Material.
Western blot was used to detect the expression levels of ASNS, CD70 and TRIB3 proteins in hfob, HOS and U2OS cell lines. The protein was extracted using RIPA lysate and the concentration of the protein was measured using BCA method. We added protein solution in a 4:1 ratio to 5 × Sample the buffer solution and denatured it in 100°C for 15 min. We performed 10% SDS-PAGE electrophoresis, and transferred the PVDF membrane for an hour. Then the membrane was placed in a TBST incubator, and with skimmed milk at room temperature, and sealed for 2 h. We added diluted first antibodies, ASNS (R22614, Chengdu Zen Biotechnology), TRIB3 (R383249, Chengdu Zen Biotechnology) and CD70 (AF5265, Affinity), and then incubated them overnight on a shaking bed at 4°C. We used TBST to elute 3 times for 5 min each time. The secondary antibody was diluted with TBST in a ratio of 1:5,000, incubated at room temperature for 2 h and then colored using ECL method. Finally, we used Image Lab software to analyze the grayscale values of the bands, and the relative expression level of the target protein = the grayscale value of the target protein/Tubulin grayscale value.
All analyses above were conducted on R (4.2.1) and Perl software. All experiments were carried out in replicates of three times. Differential comparisons between two subgroups were analyzed by Student’s t-test. p-value < 0.05 was considered statistically significant.
The workflow of this investigation was shown in Figure 1. A total of 71 DEGs were confirmed in the GEO osteosarcoma merged dataset by employing the limma method, of which 10 genes were upregulated and 61 genes were downregulated. The heatmap and volcano plot of these detailed DEGs between osteosarcoma samples and normal samples are shown in Figures 2A, B. The principal component analysis (PCA) plot (Supplementary Figure S1) indicated that batch effects between samples had been removed after correction.
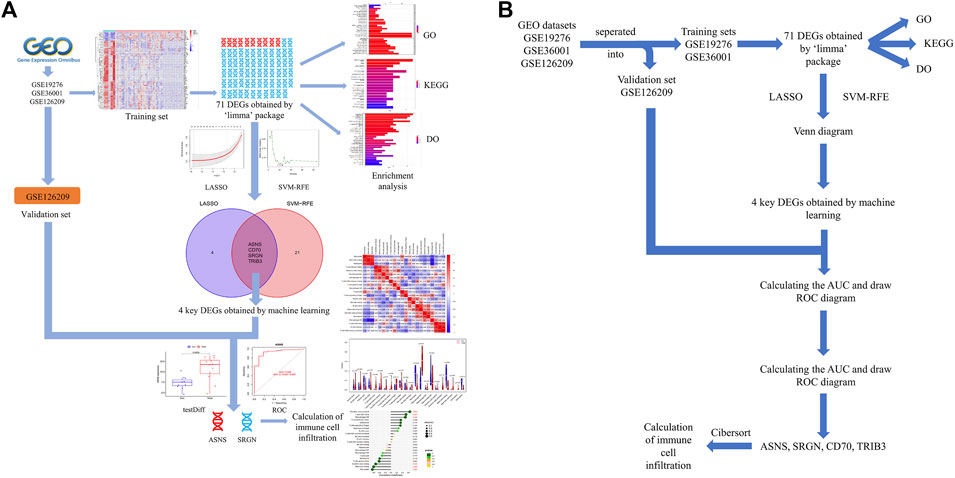
FIGURE 1. (A) Flowchart of this present study. (B) Pipeline flow chart of the study.
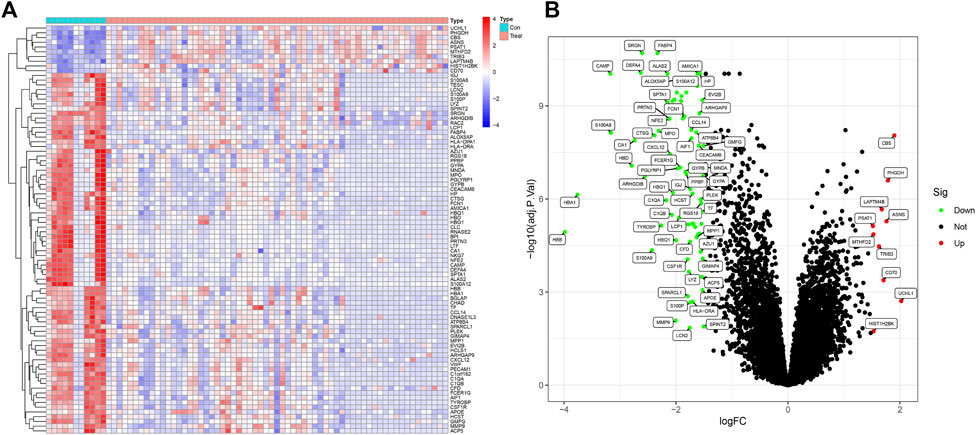
FIGURE 2. DEGs between osteosarcoma samples and normal samples in the training dataset (A) The heatmap of DEGs. (B) The volcano plots of DEGs, (GSE19276, 36001).
In furtherance of identifying the potential function and biological processes among these DESs, GO, KEGG and DO were utilized to analysis. The results of GO analysis revealed that the major enrichment of these DEGs on biological process (BP) were defense response to bacterium, humoral immune response, and leukocyte migration, suggesting the influence of DEGs on the immune system. As for the cellular component (CC) ontology, DEGs were mainly enriched in intracellular membranous structures, counting secretory granule lumen, and cytoplasmic vesicle lumens. Molecular function (MF) analysis showed that antioxidant activity, serine-type endopeptidase, and organic acid were identified (Figure 3A). Simultaneously, the KEGG analysis showed that bacterial infections, immune processes, and malaria were the most enriched items (Figure 3B). With regard to DO research, it was demonstrated that these DEGs were most correlated with cardiovascular disease, including arteriosclerosis, arteriosclerotic, cardiovascular disease and hematopoietic system disease, etc. (Figure 3C).
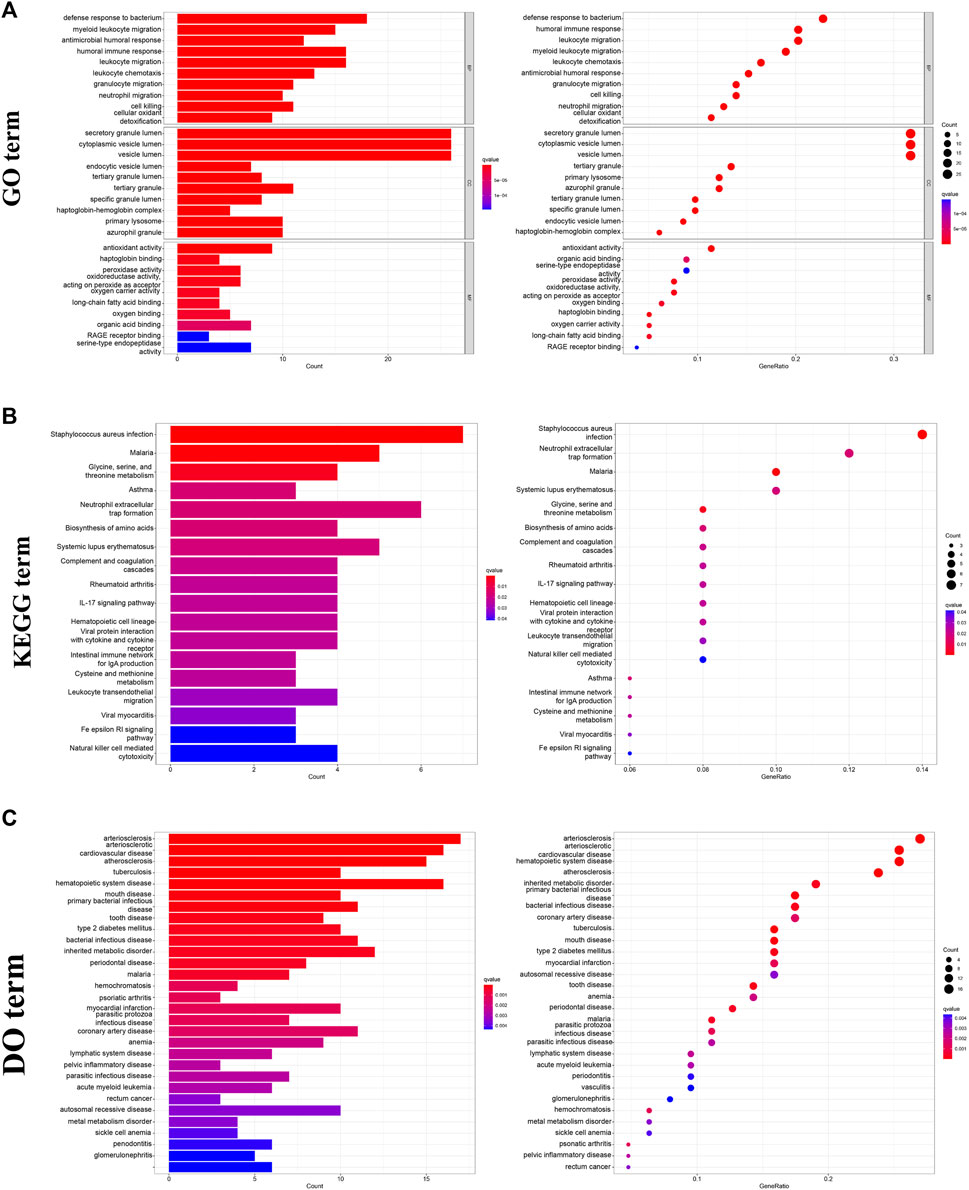
FIGURE 3. Functional enrichment analysis of DEGs. (A) GO analysis of DEGs, including BP, CC, and MF. (B) KEGG analysis of DEGs. (C) DO analysis of DEGs, (GSE19276, 36001).
In GESA enrichment analysis, including KEGG and Gene Ontology Biological Process (GOBP), our results of GOBP showed that DEGs were most enriched in defense response to bacterium, humoral immune response, myeloid leukocyte mediated immunity, specific granule and tertiary granule in normal samples. In osteosarcoma samples, mitochondrial translation, mitochondrial translational termination, translational termination, mitochondrial protein containing complex and organellar ribosome were mostly enriched GOBP items, indicating the potential biological functions of these genes in mediating mitochondrial functions during osteosarcoma initiation and progression (Figures 4A, C). With regards to KEGG analysis, asthma, hematopoietic cell lineage, leishmania infection, NK cell mediated cytotoxicity and systemic lupus erythematosus were enriched downstream pathways of DEGs in normal samples, while huntingtins disease, proteasome, protein export, spliceosome and ubiquitin mediated proteolysis were potential signaling pathways modulated by DEGs in osteosarcoma samples (Figures 4B, D).
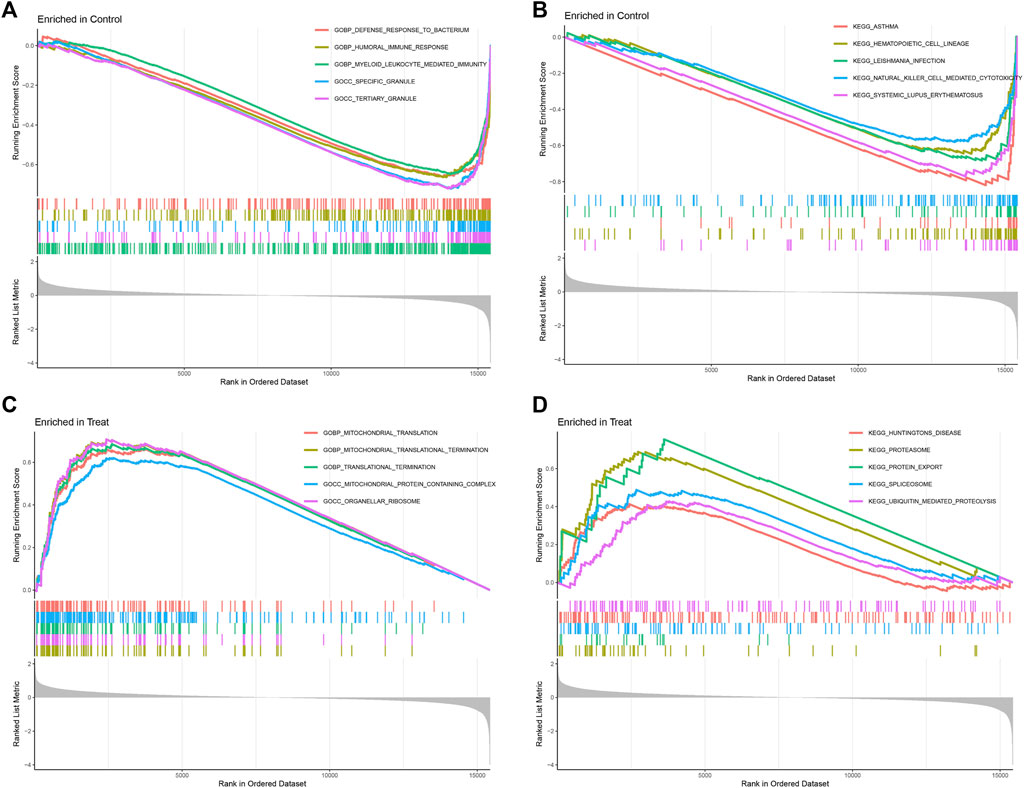
FIGURE 4. Gene set enrichment analysis (GSEA) of GOBP (A,B) and KEGG (C,D) between control and treatment groups, (GSE19276, 36001).
Furthermore, we combined LASSO liner regression and SVM-RFE algorithms to select critical candidate genes with promising diagnostic values from the above-obtained DEGs. There was a total of eight candidate biomarkers being captured by the LASSO algorithm, and 25 outputs were identified based on the SVM-RFE algorithm (Figures 5A, B). Then, a total of four genes (ASNS, SRGN, CD70, TRIB3) were yielded by intersecting the two baskets of genes from LASSO and SVM-RFE algorithm, and the results were visualized by Venn image (Figure 5C).
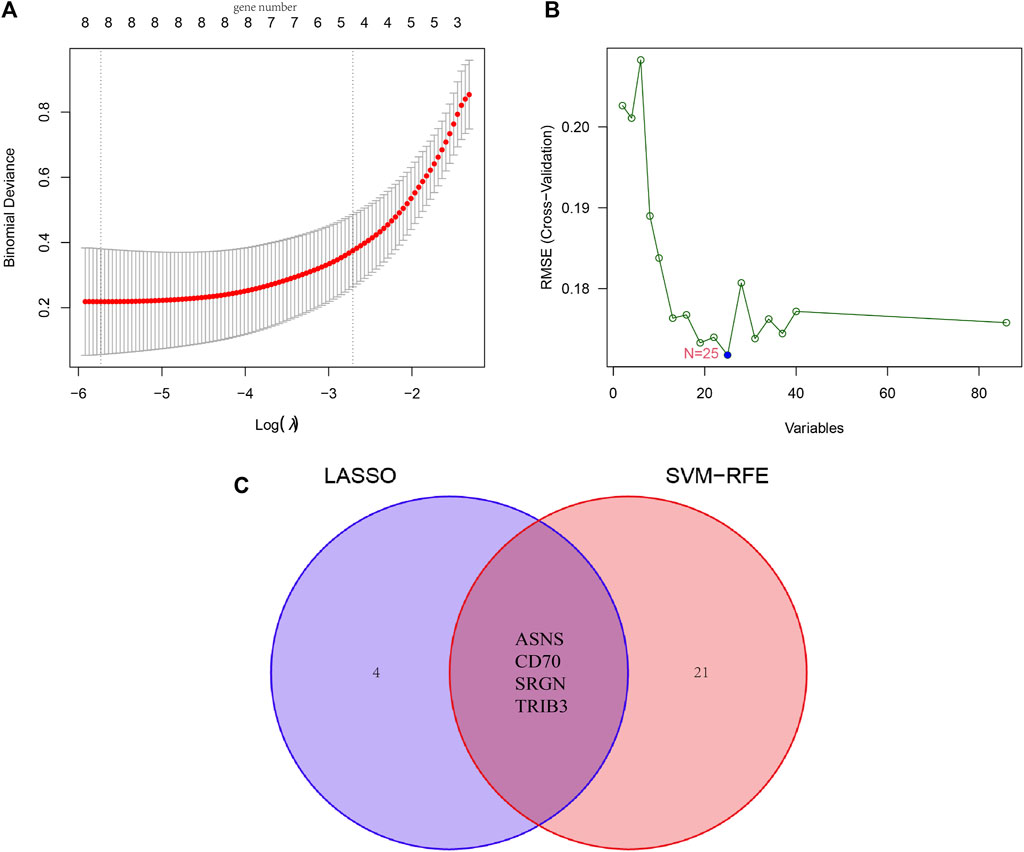
FIGURE 5. Identification of novel diagnostic biomarkers for patients with osteosarcoma by machine learning. (A) Tuning feature selection in the LASSO. (B) A plot of diagnostic markers selected by the SVM-RFE algorithm. (C) The Venn diagram of four diagnostic markers shared by the LASSO and SVM-RFE algorithms, (GSE19276, 36001).
To further examine the potential of these four candidate genes in diagnosing osteosarcoma, we employed a ROC curve to evaluate the diagnostic specificity and sensitivity of each gene with the AUC and 95% CI. Conforming to the ROC curves in Figure 6A, the results were as follows: ASNS (AUC 0.928, 95% CI 0.837–0.987), SRGN (AUC 0.954, 95% CI 0.867–1.000), CD70 (AUC 0.900, 95% CI 0.814–0.964), TRIB3 (AUC 0.955, 95% CI 0.900–0.991), indicating that all 4 genes had high AUC value than 0.90 and possessed excellent diagnostic value for osteosarcoma patients (Figure 6A). Furthermore, we constructed a nomogram comprising all the four candidates. By using the nomogram’s predictions, the comprehensive ROC curve was constructed to assess the overall model accuracy. In Figure 6C, the comprehensive ROC curve showed the results: AUC 0.997, 95% CI 0.987–1.000. The results demonstrated the excellent performance of the model in diagnosing osteosarcoma patients.
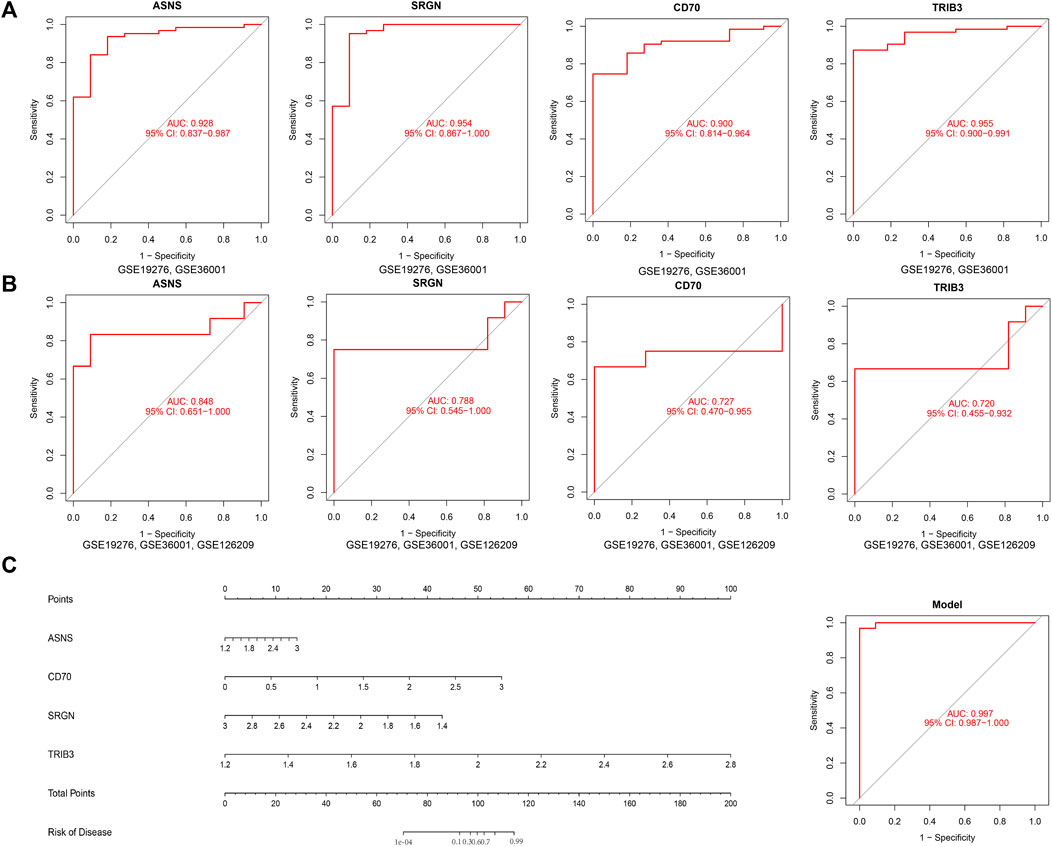
FIGURE 6. Investigation of the diagnostic efficacy of four biomarkers for osteosarcoma. (A) ROC curves of ASNS, SRGN, CD70, and TRIB3 in the training set, (GSE19276, 36001) (B) ROC curves of ASNS, SRGN, CD70, and TRIB3 in the validation set, (GSE19276, 36001, 126209). (C) Comprehensive ROC curve of the model.
To further verify the diagnostic value of these genes in osteosarcoma, we also established the ROC curve in the testing dataset in Figure 6B. The AUC and 96% CI of each gene were as follows: ASNS (AUC 0.848, CI 0.651–1.000), SRGN (AUC 0.788, CI 0.545–1.000), CD70 (AUC 0.727, CI 0.470–0.955), and TRIB3 (AUC 0.722, CI 0.455–0.932). These findings further confirmed these candidate genes all possessed high diagnostic value for osteosarcoma patients. In furtherance of obtaining more credible results, we also compared the differential expression of ASNS, SRGN, CD70, and TRIB3 between the normal samples and osteosarcoma samples in the testing dataset in Figures 7A–D. The results showed that the expression of ASNS (p = 0.0036), CD70 (p = 0.019) and TRIB3 (p = 0.069) expression was upregulated while SRGN (p = 0.079) expression was slightly downregulated in osteosarcoma samples compared with normal samples, which was consistent with the findings in the training dataset.
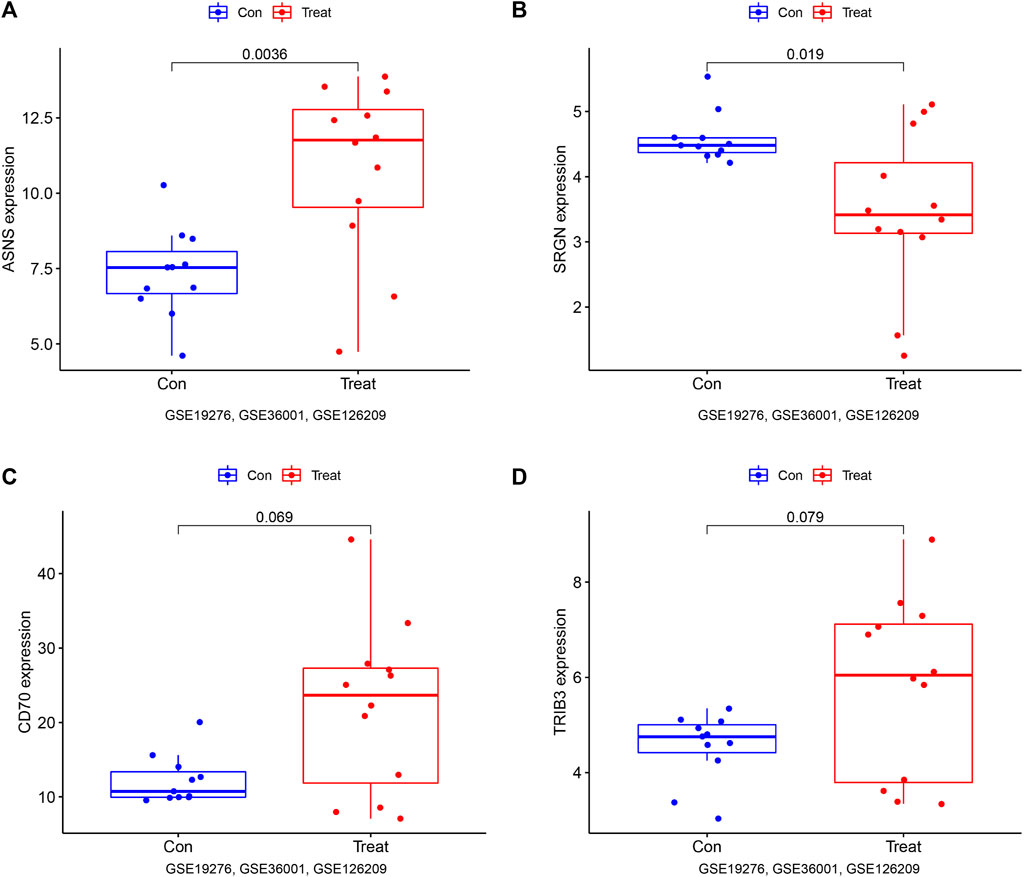
FIGURE 7. Box plots of differential expression of ASNS (A) SRGN (B), CD70 (C), and TRIB3 (D) in the validation set, (GSE19276, 36001, 126209).
To further investigate the relationship between the expression of these candidates and survival outcomes in osteosarcoma, we employed the Cox proportional hazards model and Kaplan-Meier curves. Our results (Supplementary Figure S2) found that osteosarcoma patients with high TRIB3 (p = 0.017) and SRGN (p = 0.010) expression levels had longer overall survival times than those with low expression. In addition, the overall survival time of osteosarcoma patients with high ASNS expression was shorter than those with low expression of ASNS, but without reaching statistical significance (p = 0.076). While the OS of osteosarcoma patients with high expression of CD70 was higher than that of patients with low expression of CD70 without reaching statistical significance (p = 0.108). The univariate Cox analysis results (Supplementary Figure S3) indicated that SRGN was a protective factor for osteosarcoma patients with hazard ratio (95% CIs) of 0.733 (0.546–0.985) (p = 0.039). The HRs (95% CIs) of ASNS, CD70 and TRIB3 were 1.128 (0.784–1.623) (p = 0.516), 0.893 (0.583–1.370) (p = 0.605), 0.840 (0.542–1.301) (p = 0.435). These findings confirmed that several candidates, such as SRGN and TRIB3 may function as promising prognostic biomarkers for osteosarcoma patients.
Previous results showed that DEGs were enriched in several immune-related biological functions and signaling pathways, and the immune microenvironment has been confirmed to play important roles in osteosarcoma tumorigenesis and progression. Hence, we further investigated the immune cell infiltration in osteosarcoma. The CIBERSORT algorithm was employed to identify the proportions of immune cells in osteosarcoma and normal samples (Figure 8A). Then, we further investigated the interaction among the 22 immune cells in the osteosarcoma immune microenvironment. As the results demonstrated, several immune cells were detected to have a positive correlation with the high coefficient value above 0.7: T cells CD4 memory activated with B cells memory (R = 0.84) and T cells CD4 naïve (R = 0.75), neutrophils with mast cells resting (R = 0.76) and Monocytes (R = 0.72), T cells CD4 naive with B cells memory (R = 0.75), and Mast cells resting with Monocytes (R = 0.73). Simultaneously, negative correlations were also detected between several immune cell types with high coefficient values: macrophages M0 with mast cells resting (R = −0.81) and neutrophils (R = −0.81) and monocytes (R = −0.61), T cells regulatory (Tregs) with T cells gamma delta (R = −0.57) and T cells CD4 memory activated (R = −0.54), and NK cells activated with NK cells resting (R = −0.52) (Figure 8B). In addition, with the results yielded by the CIBERSORT algorithm, the proportions of monocytes (p = 0.004), macrophages M0 (p < 0.001), mast cells resting (p = 0.004), and neutrophils (p = 0.012) in osteosarcoma samples were extremely higher than normal samples with all p values < 0.05 (Figure 8C). Overall, a variety of immune cells were differentially infiltrated in patients with osteosarcoma, which may serve as the potential therapeutic target in osteosarcoma treatment.
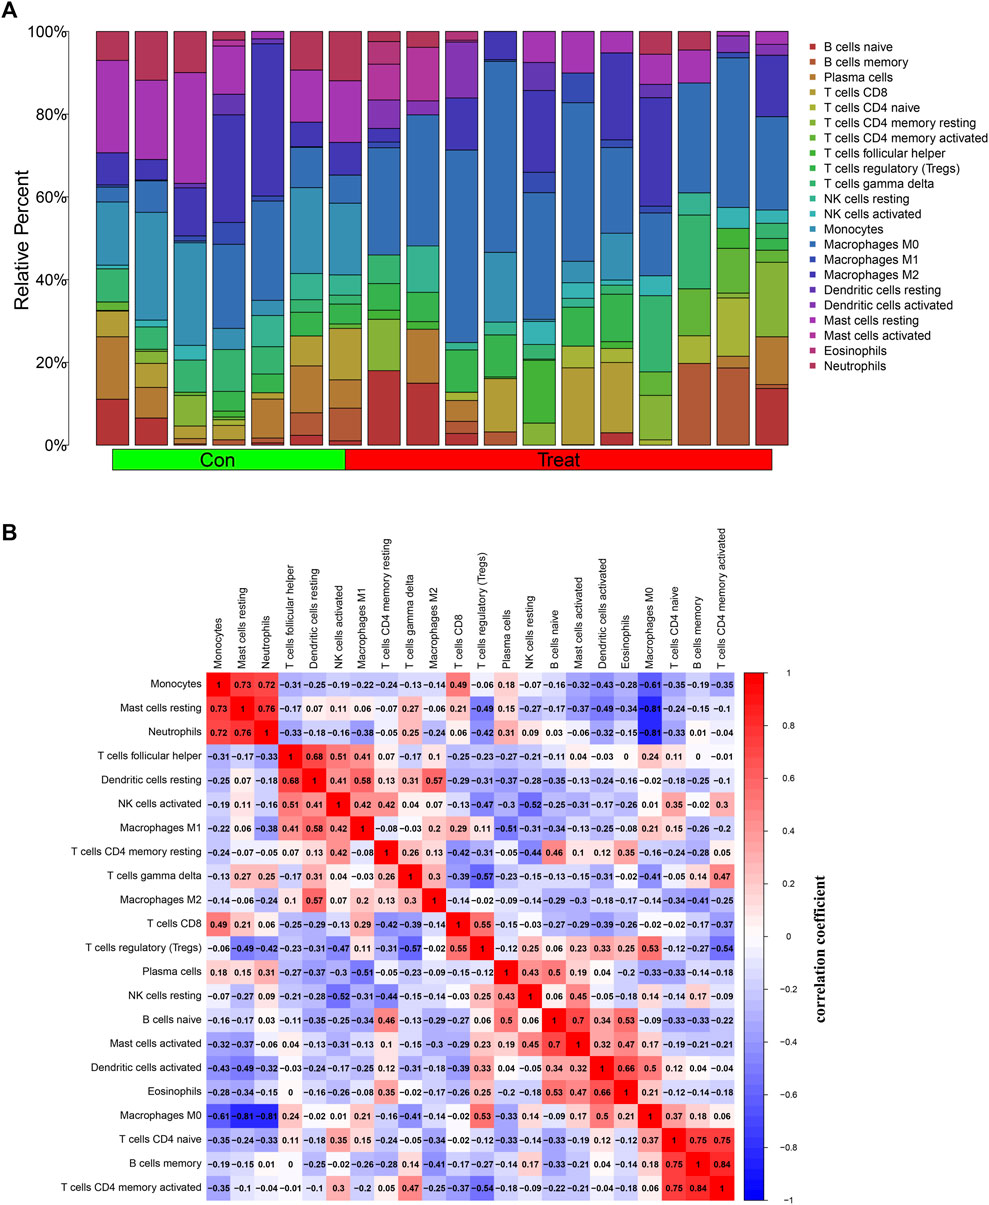
FIGURE 8. Investigation of immune cell infiltration in osteosarcoma by the CIBERSORT algorithm. (A) Bar plot of the relative proportions of immune cells. (B) The heatmap of correlations between 22 immune cell types; red indicated a positive correlation and blue indicated a negative correlation between two immune cells. (C) Violin plot of the differential infiltration of immune cells between osteosarcoma and normal samples.
Next, we further illustrated the potential role of these 4 diagnostic biomarkers in mediating the infiltration of immune cells in osteosarcoma. ASNS expression was positively correlated with dendritic cells activated (R = 0.65, p = 0.0034), T cells CD4 naive (R = 0.52, p = 0.027), macrophages M0 (R = 0.5, p = 0.037) and was negatively correlated with monocytes (R = −0.64, p = 0.0045), Mast cells resting (R = −0.59, p = 0.0093), Dendritic cells resting (R = −0.52, p = 0.026). While, CD70 expression was positively with Macrophages M0 (R = 0.79, p = 0.00013), Dendritic cells activated (R = 0.59, p = 0.011), Mast cells activated (R = 0.56, p = 0.016) and was negatively with Monocytes (R = −0.64, p = 0.0043), Mast cells resting (R = −0.63, p = 0.0053), Neutrophils (R = −0.54, p = 0.021). Simultaneously, SRGN expression was positively correlated with Neutrophils (R = 0.72, p = 0.00077), Mast cells resting (R = 0.7, p = 0.0014), T cells delta (R = 0.57, p = 0.013), and was negatively correlated with Macrophages M0 (R = −0.84, p < 2.2e−16), T cells regulatory (Tregs) (R = −0.59, p = 0.011), T cells naïve (R = −0.48, p = 0.046). Currently, TRIB3 was positively correlated with Dendritic cells activated (R = 0.74, p = 0.00041), Macrophages M0 (R = 0.6, p = 0.011), Eosinophils (R = 0.5, p = 0.036) and was negatively correlated with T cells CD8 (R = −0.8, p = 7.6e−05), Monocytes (R = −0.76, p = 0.00027), T cells CD8 (R = −0.65, p = 0.0033) (Figures 9A, B). These results suggested that these diagnostic biomarkers might be significantly correlated with the immune signature, and targeting these biomarkers might be utilized to promote the anti-tumor immune microenvironment in osteosarcoma.
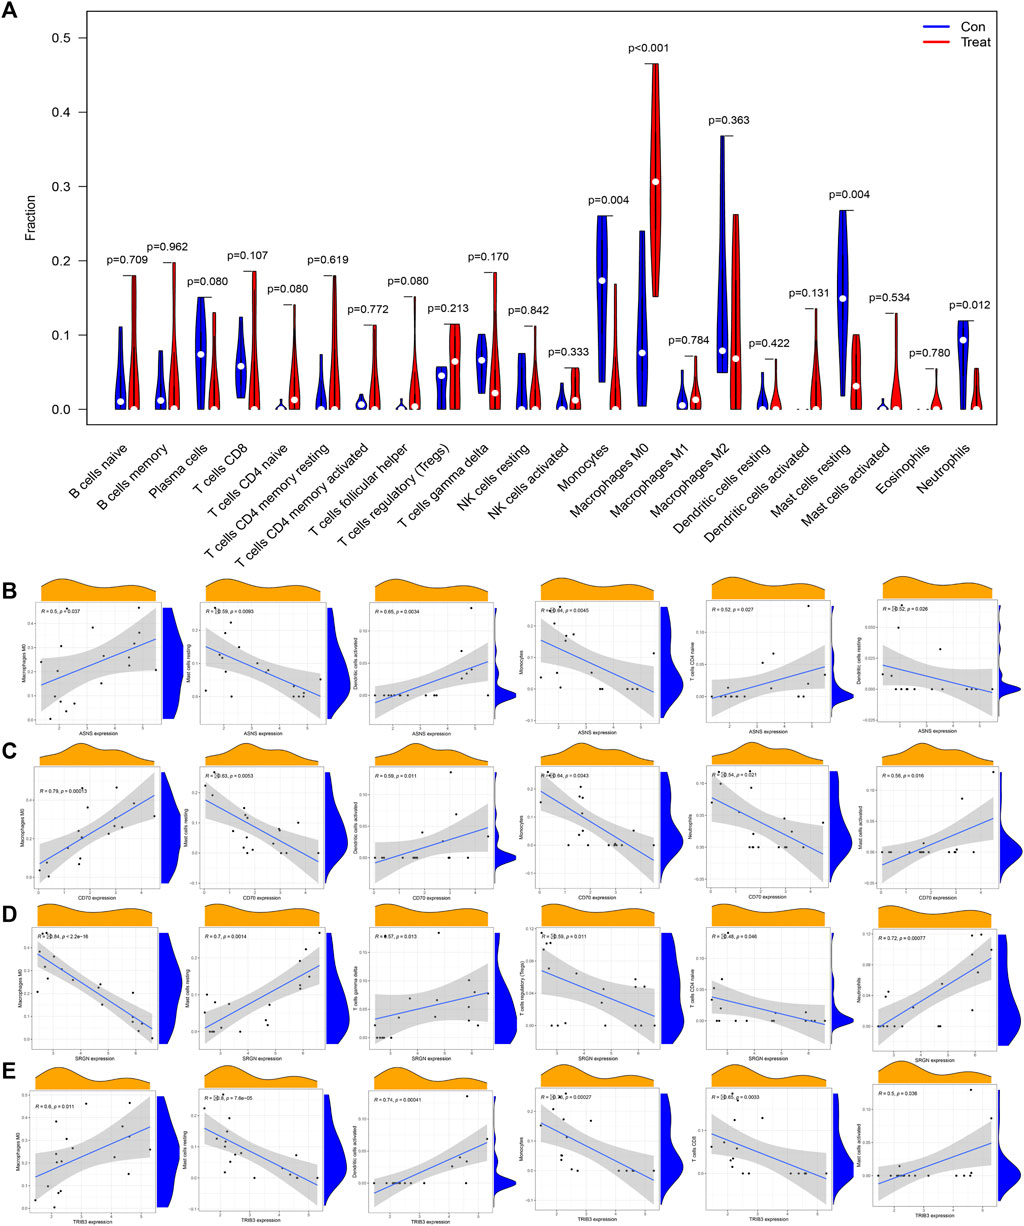
FIGURE 9. Correlation analysis between diagnostic biomarkers and the infiltration of immune cells in osteosarcoma. (A) Lollipop plot of the association of ASNS, SRGN, CD70, and TRIB3 with immune cells. (B–E) Correlation plots of the association of ASNS (B), SRGN (C), CD70 (D), and TRIB3 (E) with immune cells.
The qRT-PCR results showed that compared to the control group (hfob), the expression level of CD70 was significantly increased in HOS, U2OS and 143B. The expression level of ASNS was significantly increased in HOS and U2OS, while the trend was not significant in 143B. The significant upregulation of TRIB3 was only detected in HOS cell line. The expression level of SRGN was significantly decreased in all three cell lines compared to the control group (Figures 10A–D).
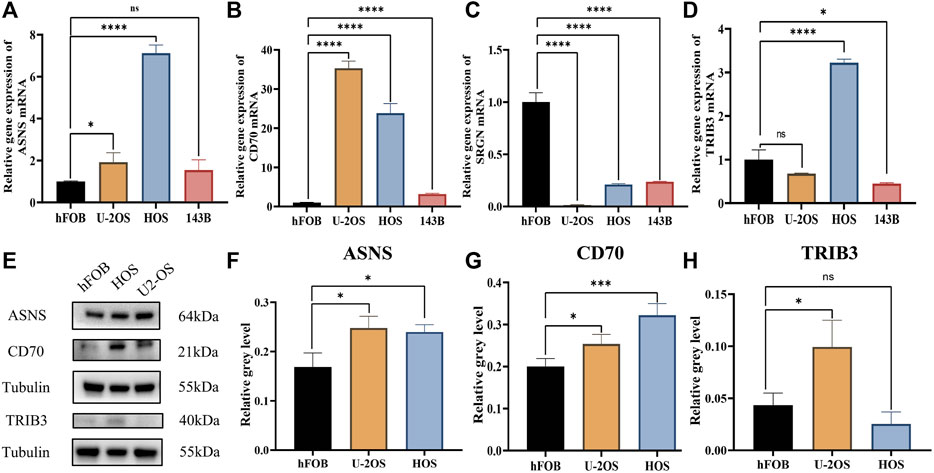
FIGURE 10. The qRT-PCR for the levels of key genes in control and osteosarcoma cell lines. (A) ASNS. (B) CD70. (C) SRGN. (D) TRIB3. The western blot band chart (E) and the protein level of (F) ASNS, (G) CD70 and (H) TRIB3.
Furthermore, the western blots results showed that ASNS and CD70 protein levels in both U2OS and HOS cell lines significantly increased compared to the control group, while TRIB3 protein only increased in HOS cell line with statistical significance (Figures 10E–H). These experimental results were basically in line with our bioinformatics analysis results.
Osteosarcoma is the most frequent malignant bone tumor frequently affecting children and adolescents with poor prognosis (Gill and Gorlick, 2021; Meltzer and Helman, 2021). Despite the booming development of therapeutic strategies in osteosarcoma, the 5-year survival of patients with osteosarcoma has hit a plateau over the past decades, and it is urgent to develop effective biomarkers and therapeutic targets (Belayneh et al., 2021; Celik et al., 2022). There have been several studies investigating novel biomarkers for osteosarcoma patients, including lipid metabolism-, ferroptosis-, immune-related genes and so on (Huang W. et al., 2022; Wang et al., 2022; Yang et al., 2022). Nevertheless, machine learning methods have not been applied in screening diagnostic biomarkers for patients with osteosarcoma. In the present study, we combined integrated bioinformatics analysis and machine learning to explore novel diagnostic biomarkers for patients with osteosarcoma as well as their prognostic value and potential functions and roles in mediating osteosarcoma immune microenvironment. Besides, we also validated the expression of diagnostic candidates in osteosarcoma in vitro.
Three osteosarcoma microarray datasets were extracted from the GEO online database. A total of DEGs were identified in osteosarcoma. DEGs were mainly enriched in small molecule catabolic process, amino acid metabolic process, and other biological processes. GSEA enrichment results showed that were highly active in. which may be closely related to the initiation and development of osteosarcoma. To improve the diagnostic value and clinical availability of novel diagnostic candidates, the LASSO regression algorithm was employed to minimize regression coefficients to reduce overfitting, and the machine learning SVM-RFE algorithm was employed to achieve the minimal classification error. As a result, a total of five pivotal candidate genes (ASNS, SRGN, CD70, and TRIB3) were identified for diagnosing patients with osteosarcoma. According to our results, ASNS, CD70, and TRIB3 were upregulated in osteosarcoma patients, while SRGN was downregulated in osteosarcoma patients.
Asparagine synthase (ASNS) catalyzes the synthesis of asparagine and glutamate from aspartic acid and glutamine in an ATP-dependent amidotransferase reaction (Richards and Kilberg, 2006). ASNS has recently received considerable attention in several cancers. ASNS is highly methylated in B-cell precursor acute lymphoblastic leukemia (BCP-ALL) patients with favorable karyotypes but is mostly unmethylated in BCP-ALL patients with poor prognostic karyotypes (Watanabe et al., 2020). In NSCLC, it has been found that ATF4 targets ASNS to achieve apoptotic suppression, protein biosynthesis, and mTORC1 activation. Moreover, the inhibition of AKT can suppress ASNS expression and depletion of extracellular asparagine, subsequently inhibiting tumor growth. Inhibiting ASNS through AKT suppression can sensitize cancer cells to L-asparaginase, providing evidence for ASNS as a novel therapeutic target in NSCLC (Gwinn et al., 2018). Serglycin (SRGN), a major proteoglycan expressed in hematopoietic cells, endothelial cells, and macrophages, has been found to participate in the initiation and progression of human malignancies (Zhang et al., 2017; Ma et al., 2020; Tanaka et al., 2022). For instance, the upregulation of SRGN in chemoresistant breast cancer cells, serum and tissue samples from breast cancer patients with poor response to chemotherapy. Mechanistically, SRGN can facilitate chemoresistance by cross-talking with the transcriptional coactivator YAP to maintain the stemness of breast cancer cells in vivo and in vitro (Zhang Z. et al., 2020). However, the expression pattern and biological functions of SRGN in multiple cancer types, especially osteosarcoma remain largely unknown.
CD70 is the natural ligand for the tumor necrosis factor (TNF) superfamily member CD27, which has been identified to induce the B cell and T cell activation. In cancer biology, CD70 can facilitate immune evasion and tumor progression in the tumor immune microenvironment (Jacobs et al., 2015). The vital functions of the CD70-CD27 pathway in oncology have been investigated over the last decade, and targeting the CD70-CD27 pathway by different approaches has also been illustrated in different malignancies. In osteosarcoma studies, CD70 has been found to be expressed in a subset of osteosarcoma patients, and CD70 may represent a novel candidate for antibody-based targeted immunotherapy in these patients with CD70 (+) osteosarcoma (Pahl et al., 2015). In addition, PLCE1 may induce immune escape in osteosarcoma through the CD70-CD27 signaling pathway (Huang L. et al., 2022). Tribbles homolog 3 (TRIB3) is a mammalian gene that is upregulated in response to several types of cell death-inducing cellular stress (Ord and Ord, 2017). The functions of TRIB3 on cancer progression have attracted multiple studies. It has been found that TRIB3 is positively related to breast cancer stemness and development. Mechanistically, TRIB3 can facilitate breast cancer stem cells through regulating AKT to interfere with the FOXO1-AKT interaction and inhibit FOXO1 phosphorylation, ubiquitination, and degradation by E3 ligases SKP2 and NEDD4L (Yu et al., 2019). In NSCLC, TRIB3 has been found to interact with EGFR and recruits PKCα to induce a Thr654 phosphorylation and WWP1-induced Lys689 ubiquitination in the EGFR juxtamembrane region, subsequently promoting EGFR recycling, stability, downstream activity, and NSCLC stemness (Yu et al., 2020). Overall, these four diagnostic biomarkers have been found to be critically involved in cancer initiation and progression, but their roles in osteosarcoma are still largely inconclusive. Identifying the clinical significance and functional roles of these candidates in osteosarcoma may help understand pathological process of osteosarcoma and provide novel therapeutic targets.
Furthermore, our study investigated the potential biological functions and signaling pathways mediated by these diagnostic biomarkers in osteosarcoma. Our findings indicate that these diagnostic biomarkers are mainly involved in immune response, leukocyte function, serine/glycine metabolism and IL-17 signaling pathways in osteosarcoma progression. Several studies have investigated the roles of IL-17 signaling pathways in osteosarcoma. IL-17 can facilitate the susceptibility of osteosarcoma cells to NK cell lysis, and IL-17A/IL-17RA interaction can promote osteosarcoma cells metastasis, indicating that targeting IL-17 may be a novel promising strategy to treat osteosarcoma patients (Honorati et al., 2003; Wang et al., 2013). The CD27 and CD70 costimulatory pathway has been found to inhibit the transcription of the key effector molecules IL-17 and the chemokine receptor CCR6, subsequently attenuates associated autoimmunity, Cancer cells can reprogramme their metabolism to support cell growth and proliferation. Serine and glycine are biosynthetically linked, and together provide the essential precursors for the synthesis of proteins, nucleic acids, and lipids that are crucial to cancer cell growth. It has been found that serine and glycine are critical metabolites for cancer cells, and metabolic enzymes of serine and glycine biosynthesis are significantly upregulated during cancer progression (Amelio et al., 2014). In osteosarcoma, the mTORC1/serine/glycine metabolic axis has been reported to promote cellular proliferation and the antioxidant ability to environmental stress, thereby resulting in osteosarcoma progression (Wang et al., 2017). To date, few studies have focused on these biological functions of these diagnostic genes, the involvement of these candidates in these biological functions during osteosarcoma initiation and progression require in-depth investigation in future studies.
Multiple lines of evidence have suggested the critical roles of diverse immune cells in the tumor immune microenvironment in osteosarcoma. In the present investigation, we found that osteosarcoma patients had a higher level of M0 macrophages, whereas a lower level of monocytes, mast cell resting, and neutrophils. Previous studies have indicated that the abundance of monocytes was lower in osteosarcoma, and was significantly correlated with the poor prognosis of osteosarcoma patients (Chen et al., 2020; Chen and Zhao, 2020). M0 macrophages have been found to be highly infiltrated in osteosarcoma samples, which is also consistent with our findings (Zhang C. et al., 2020). We further investigated the relationship between these hub genes and the abundance of these infiltrating immune cells. Our findings showed that ASNS, CD70, and TRIB3 were positively correlated with the abundance of macrophages M0 and dendritic activated cells, while was negatively correlated with the abundance of mast cells resting and monocytes. There was also a positive correlation between ASNS and CD4+ T cells, and a negative correlation between ASNS and dendritic resting cells. Our results found that SRGN was positively associated with the infiltration of T cells gamma delta, T regulatory cells, and CD4+ T cells. In addition, TRIB3 was a negative modulator of CD8+ T cells in osteosarcoma. Previous research has confirmed that TRIB3 can inhibit CD8+ T cell infiltration and stimulate the immune evasion through inhibiting the STAT1-CXCL10 axis in colorectal cancer, which is consistent with our results (Shang et al., 2022). These findings indicate that these candidate genes may function as modulators of T cell infiltration in osteosarcoma, thereby regulating osteosarcoma progression and clinical outcomes. Therefore, targeting these biomarkers may be an effective method to modulate the immune cell infiltration in osteosarcoma.
There are still several limitations in the present research. First, although we included three osteosarcoma datasets, the samples remained few, especially the limited sample size in the validation cohort. The results should be further identified in a more large-scale cohort in the future, which is time-consuming but meaningful. We have also validated the expression pattern of these candidates in vitro. Second, although we illustrated the correlations of these candidate hub genes with the abundance of immune cells in osteosarcoma was presented, the exact functions and mechanisms of these genes in mediating osteosarcoma are still worth investigating.
Our research systematically discovered and verified four immune-associated candidate hub genes (ASNS, SRGN, CD70, TRIB3) with high predictive value for diagnosing osteosarcoma by bioinformatics analysis and machine learning algorithms. Besides, we also illustrated the dysregulated immune cell proportion in osteosarcoma, and the potential regulatory functions of these diagnostic hub genes in the tumor immune microenvironment in osteosarcoma, thus providing novel immune-related diagnostic candidate genes for patients with osteosarcoma.
The datasets presented in this study can be found in online repositories. The names of the repository/repositories and accession number(s) can be found in the article/Supplementary Material.
Ethical approval was not required for the studies on animals in accordance with the local legislation and institutional requirements because only commercially available established cell lines were used.
YJ and ZL: writing–original draft, data curation, and formal analysis. GL and XT: writing–original draft. YW, JW, and ZL: formal analysis. TL: writing–review and editing, supervision, and funding acquisition. MX: writing–review and editing, supervision, and funding acquisition. All authors contributed to the article and approved the submitted version.
This study was supported by grants from the National Natural Science Foundation of China (Grant Nos 81871783 and 82072441).
We acknowledge GEO database for providing its platforms and contributors for uploading its meaningful datasets.
The authors declare that the research was conducted in the absence of any commercial or financial relationships that could be construed as a potential conflict of interest.
All claims expressed in this article are solely those of the authors and do not necessarily represent those of their affiliated organizations, or those of the publisher, the editors and the reviewers. Any product that may be evaluated in this article, or claim that may be made by its manufacturer, is not guaranteed or endorsed by the publisher.
The Supplementary Material for this article can be found online at: https://www.frontiersin.org/articles/10.3389/fgene.2023.1136783/full#supplementary-material
SUPPLEMENTARY FIGURE S1 | PCA plot before (A) and after (B) the batch effect between GSE19276 and GSE36001 was removed.
SUPPLEMENTARY FIGURE S2 | Kaplan–Meier estimated overall survival in osteosarcoma patients stratified by ASNS (A), CD70 (B), SRGN (C) and TRIB3 (D).
SUPPLEMENTARY FIGURE S3 | Forest plot of studies evaluating the hazard ratios of ASNS, CD70, SRGN and TRIB3 for overall survival of patients with osteosarcoma.
Amelio, I., Cutruzzolá, F., Antonov, A., Agostini, M., and Melino, G. (2014). Serine and glycine metabolism in cancer. Trends Biochem. Sci. 39, 191–198. doi:10.1016/j.tibs.2014.02.004
Belayneh, R., Fourman, M. S., Bhogal, S., and Weiss, K. R. (2021). Update on osteosarcoma. Curr. Oncol. Rep. 23, 71. doi:10.1007/s11912-021-01053-7
Bigorra, L., Larriba, I., and Gutierrez-Gallego, R. (2019). Machine learning algorithms for accurate differential diagnosis of lymphocytosis based on cell population data. Br. J. Haematol. 184, 1035–1037. doi:10.1111/bjh.15230
Celik, B., Cicek, K., Leal, A. F., and Tomatsu, S. (2022). Regulation of molecular targets in osteosarcoma treatment. Int. J. Mol. Sci. 23, 12583. doi:10.3390/ijms232012583
Chen, T., and Zhao, L. (2020). Patrolling monocytes inhibit osteosarcoma metastasis to the lung. Aging (Albany NY) 12, 23004–23016. doi:10.18632/aging.104041
Chen, Y., Liu, R., Wang, W., Wang, C., Zhang, N., Shao, X., et al. (2021a). Advances in targeted therapy for osteosarcoma based on molecular classification. Pharmacol. Res. 169, 105684. doi:10.1016/j.phrs.2021.105684
Chen, Y., Zhao, B., and Wang, X. (2020). Tumor infiltrating immune cells (TIICs) as a biomarker for prognosis benefits in patients with osteosarcoma. BMC Cancer 20, 1022. doi:10.1186/s12885-020-07536-3
Chen, Z., Wang, M., De Wilde, R. L., Feng, R., Su, M., Torres-de la Roche, L. A., et al. (2021b). A machine learning model to predict the triple negative breast cancer immune subtype. Front. Immunol. 12, 749459. doi:10.3389/fimmu.2021.749459
Deo, R. C. (2015). Machine learning in medicine. Circulation 132, 1920–1930. doi:10.1161/CIRCULATIONAHA.115.001593
Gianferante, D. M., Mirabello, L., and Savage, S. A. (2017). Germline and somatic genetics of osteosarcoma - connecting aetiology, biology and therapy. Nat. Rev. Endocrinol. 13, 480–491. doi:10.1038/nrendo.2017.16
Gill, J., and Gorlick, R. (2021). Advancing therapy for osteosarcoma. Nat. Rev. Clin. Oncol. 18, 609–624. doi:10.1038/s41571-021-00519-8
Gong, L., Zhang, D., Dong, Y., Lei, Y., Qian, Y., Tan, X., et al. (2018). Integrated bioinformatics analysis for identificating the therapeutic targets of aspirin in small cell lung cancer. J. Biomed. Inf. 88, 20–28. doi:10.1016/j.jbi.2018.11.001
Greener, J. G., Kandathil, S. M., Moffat, L., and Jones, D. T. (2022). A guide to machine learning for biologists. Nat. Rev. Mol. Cell Biol. 23, 40–55. doi:10.1038/s41580-021-00407-0
Gwinn, D. M., Lee, A. G., Briones-Martin-Del-Campo, M., Conn, C. S., Simpson, D. R., Scott, A. I., et al. (2018). Oncogenic KRAS regulates amino acid homeostasis and asparagine biosynthesis via ATF4 and alters sensitivity to L-asparaginase. Cancer Cell 33, 91–107. doi:10.1016/j.ccell.2017.12.003
Honorati, M. C., Neri, S., Cattini, L., and Facchini, A. (2003). IL-17 enhances the susceptibility of U-2 OS osteosarcoma cells to NK cell lysis. Clin. Exp. Immunol. 133, 344–349. doi:10.1046/j.1365-2249.2003.02234.x
Huang, H., Ye, Z., Li, Z., Wang, B., Li, K., Zhou, K., et al. (2023). Employing machine learning using ferroptosis-related genes to construct a prognosis model for patients with osteosarcoma. Front. Genet. 14, 1099272. doi:10.3389/fgene.2023.1099272
Huang, L., Liao, C., Wu, H., and Huang, P. (2022b). PLCE1 is a poor prognostic marker and may promote immune escape from osteosarcoma by the CD70-CD27 signaling pathway. Bosn. J. Basic Med. Sci. 22, 992–1004. doi:10.17305/bjbms.2022.7416
Huang, W., Xiao, Y., Wang, H., Chen, G., and Li, K. (2022a). Identification of risk model based on glycolysis-related genes in the metastasis of osteosarcoma. Front. Endocrinol. (Lausanne) 13, 1047433. doi:10.3389/fendo.2022.1047433
Jacobs, J., Deschoolmeester, V., Zwaenepoel, K., Rolfo, C., Silence, K., Rottey, S., et al. (2015). CD70: an emerging target in cancer immunotherapy. Pharmacol. Ther. 155, 1–10. doi:10.1016/j.pharmthera.2015.07.007
Kanehisa, M., Furumichi, M., Sato, Y., Kawashima, M., and Ishiguro-Watanabe, M. (2022). KEGG for taxonomy-based analysis of pathways and genomes. Nucleic Acids Res. 51, D587–D592. doi:10.1093/nar/gkac963
Kansara, M., Teng, M. W., Smyth, M. J., and Thomas, D. M. (2014). Translational biology of osteosarcoma. Nat. Rev. Cancer 14, 722–735. doi:10.1038/nrc3838
Li, W., Liu, Y., Liu, W., Tang, Z. R., Dong, S., Li, W., et al. (2022). Machine learning-based prediction of lymph node metastasis among osteosarcoma patients. Front. Oncol. 12, 797103. doi:10.3389/fonc.2022.797103
Liu, L. P., Lu, L., Zhao, Q. Q., Kou, Q. J., Jiang, Z. Z., Gui, R., et al. (2021). Identification and validation of the pyroptosis-related molecular subtypes of lung adenocarcinoma by bioinformatics and machine learning. Front. Cell Dev. Biol. 9, 756340. doi:10.3389/fcell.2021.756340
Ma, Q., Gu, W., Li, T., Zhang, K., Cui, Y., Qu, K., et al. (2020). SRGN, a new identified shear-stress-responsive gene in endothelial cells. Mol. Cell Biochem. 474, 15–26. doi:10.1007/s11010-020-03830-7
Mandrekar, J. N. (2010). Receiver operating characteristic curve in diagnostic test assessment. J. Thorac. Oncol. 5, 1315–1316. doi:10.1097/JTO.0b013e3181ec173d
Mao, X., Xu, J., Wang, W., Liang, C., Hua, J., Liu, J., et al. (2021). Crosstalk between cancer-associated fibroblasts and immune cells in the tumor microenvironment: new findings and future perspectives. Mol. Cancer 20, 131. doi:10.1186/s12943-021-01428-1
Marchais, A., Marques da Costa, M. E., Job, B., Abbas, R., Drubay, D., Piperno-Neumann, S., et al. (2022). Immune infiltrate and tumor microenvironment transcriptional programs stratify pediatric osteosarcoma into prognostic groups at diagnosis. Cancer Res. 82, 974–985. doi:10.1158/0008-5472.CAN-20-4189
McEligot, A. J., Poynor, V., Sharma, R., and Panangadan, A. (2020). Logistic LASSO regression for dietary intakes and breast cancer. Nutrients 12, 2652. doi:10.3390/nu12092652
Meltzer, P. S., and Helman, L. J. (2021). New horizons in the treatment of osteosarcoma. N. Engl. J. Med. 385, 2066–2076. doi:10.1056/NEJMra2103423
Ord, T., and Ord, T. (2017). Mammalian pseudokinase TRIB3 in normal physiology and disease: charting the progress in old and new avenues. Curr. Protein Pept. Sci. 18, 819–842. doi:10.2174/1389203718666170406124547
Pahl, J. H., Santos, S. J., Kuijjer, M. L., Boerman, G. H., Sand, L. G., Szuhai, K., et al. (2015). Expression of the immune regulation antigen CD70 in osteosarcoma. Cancer Cell Int. 15, 31. doi:10.1186/s12935-015-0181-5
Perez-Iratxeta, C., Andrade-Navarro, M. A., and Wren, J. D. (2007). Evolving research trends in bioinformatics. Brief. Bioinform 8, 88–95. doi:10.1093/bib/bbl035
Richards, N. G., and Kilberg, M. S. (2006). Asparagine synthetase chemotherapy. Annu. Rev. Biochem. 75, 629–654. doi:10.1146/annurev.biochem.75.103004.142520
Ritter, J., and Bielack, S. S. (2010). Osteosarcoma. Ann. Oncol. 21 (7), vii320–325. doi:10.1093/annonc/mdq276
Sanz, H., Valim, C., Vegas, E., Oller, J. M., and Reverter, F. (2018). SVM-RFE: selection and visualization of the most relevant features through non-linear kernels. BMC Bioinforma. 19, 432. doi:10.1186/s12859-018-2451-4
Schriml, L. M., Arze, C., Nadendla, S., Chang, Y. W., Mazaitis, M., Felix, V., et al. (2012). Disease ontology: a backbone for disease semantic integration. Nucleic Acids Res. 40, D940–D946. doi:10.1093/nar/gkr972
Shang, S., Yang, Y. W., Chen, F., Yu, L., Shen, S. H., Li, K., et al. (2022). TRIB3 reduces CD8(+) T cell infiltration and induces immune evasion by repressing the STAT1-CXCL10 axis in colorectal cancer. Sci. Transl. Med. 14, eabf0992. doi:10.1126/scitranslmed.abf0992
Subramanian, A., Tamayo, P., Mootha, V. K., Mukherjee, S., Ebert, B. L., Gillette, M. A., et al. (2005). Gene set enrichment analysis: a knowledge-based approach for interpreting genome-wide expression profiles. Proc. Natl. Acad. Sci. U. S. A. 102, 15545–15550. doi:10.1073/pnas.0506580102
Tanaka, I., Dayde, D., Tai, M. C., Mori, H., Solis, L. M., Tripathi, S. C., et al. (2022). SRGN-triggered aggressive and immunosuppressive phenotype in a subset of TTF-1-negative lung adenocarcinomas. J. Natl. Cancer Inst. 114, 290–301. doi:10.1093/jnci/djab183
The Gene Ontology Consortium (2019). The gene ontology resource: 20 years and still GOing strong. Nucleic Acids Res. 47, D330–d338. doi:10.1093/nar/gky1055
Wang, D. W., Wu, L., Cao, Y., Yang, L., Liu, W., Xq, E., et al. (2017). A novel mechanism of mTORC1-mediated serine/glycine metabolism in osteosarcoma development. Cell Signal 29, 107–114. doi:10.1016/j.cellsig.2016.06.008
Wang, M., Wang, L., Ren, T., Xu, L., and Wen, Z. (2013). IL-17A/IL-17RA interaction promoted metastasis of osteosarcoma cells. Cancer Biol. Ther. 14, 155–163. doi:10.4161/cbt.22955
Wang, X., Xia, G., Xiao, S., Wu, S., Zhang, L., Huang, J., et al. (2022). A ferroptosis-related gene signature associated with immune landscape and therapeutic response in osteosarcoma. Front. Oncol. 12, 1024915. doi:10.3389/fonc.2022.1024915
Watanabe, A., Miyake, K., Nordlund, J., Syvanen, A. C., van der Weyden, L., Honda, H., et al. (2020). Association of aberrant ASNS imprinting with asparaginase sensitivity and chromosomal abnormality in childhood BCP-ALL. Blood 136, 2319–2333. doi:10.1182/blood.2019004090
Werner, T. (2008). Bioinformatics applications for pathway analysis of microarray data. Curr. Opin. Biotechnol. 19, 50–54. doi:10.1016/j.copbio.2007.11.005
Yang, W., Wu, H., Tong, L., Wang, Y., Guo, Q., Xu, L., et al. (2022). A cuproptosis-related genes signature associated with prognosis and immune cell infiltration in osteosarcoma. Front. Oncol. 12, 1015094. doi:10.3389/fonc.2022.1015094
Yu, J. J., Zhou, D. D., Yang, X. X., Cui, B., Tan, F. W., Wang, J., et al. (2020). TRIB3-EGFR interaction promotes lung cancer progression and defines a therapeutic target. Nat. Commun. 11, 3660. doi:10.1038/s41467-020-17385-0
Yu, J. M., Sun, W., Wang, Z. H., Liang, X., Hua, F., Li, K., et al. (2019). TRIB3 supports breast cancer stemness by suppressing FOXO1 degradation and enhancing SOX2 transcription. Nat. Commun. 10, 5720. doi:10.1038/s41467-019-13700-6
Yu, W., Lei, Q., Yang, L., Qin, G., Liu, S., Wang, D., et al. (2021). Contradictory roles of lipid metabolism in immune response within the tumor microenvironment. J. Hematol. Oncol. 14, 187. doi:10.1186/s13045-021-01200-4
Zhang, C., Zheng, J. H., Lin, Z. H., Lv, H. Y., Ye, Z. M., Chen, Y. P., et al. (2020b). Profiles of immune cell infiltration and immune-related genes in the tumor microenvironment of osteosarcoma. Aging (Albany NY) 12, 3486–3501. doi:10.18632/aging.102824
Zhang, Z., Deng, Y., Zheng, G., Jia, X., Xiong, Y., Luo, K., et al. (2017). SRGN-TGFβ2 regulatory loop confers invasion and metastasis in triple-negative breast cancer. Oncogenesis 6, e360. doi:10.1038/oncsis.2017.53
Zhang, Z., Qiu, N., Yin, J., Zhang, J., Liu, H., Guo, W., et al. (2020a). SRGN crosstalks with YAP to maintain chemoresistance and stemness in breast cancer cells by modulating HDAC2 expression. Theranostics 10, 4290–4307. doi:10.7150/thno.41008
Zhou, Y., Shi, W., Zhao, D., Xiao, S., Wang, K., and Wang, J. (2022). Identification of immune-associated genes in diagnosing aortic valve calcification with metabolic syndrome by integrated bioinformatics analysis and machine learning. Front. Immunol. 13, 937886. doi:10.3389/fimmu.2022.937886
Keywords: osteosarcoma, machine learning, immune cell infiltration, diagnosis, hub genes
Citation: Ji Y, Lin Z, Li G, Tian X, Wu Y, Wan J, Liu T and Xu M (2023) Identification and validation of novel biomarkers associated with immune infiltration for the diagnosis of osteosarcoma based on machine learning. Front. Genet. 14:1136783. doi: 10.3389/fgene.2023.1136783
Received: 03 January 2023; Accepted: 18 August 2023;
Published: 04 September 2023.
Edited by:
Cong Liu, Columbia University, United StatesReviewed by:
Yu Hu, Children’s Hospital of Philadelphia, United StatesCopyright © 2023 Ji, Lin, Li, Tian, Wu, Wan, Liu and Xu. This is an open-access article distributed under the terms of the Creative Commons Attribution License (CC BY). The use, distribution or reproduction in other forums is permitted, provided the original author(s) and the copyright owner(s) are credited and that the original publication in this journal is cited, in accordance with accepted academic practice. No use, distribution or reproduction is permitted which does not comply with these terms.
*Correspondence: Min Xu, eHVtaW42NkBjc3UuZWR1LmNu
†These authors have contributed equally to this work and share first authorship
Disclaimer: All claims expressed in this article are solely those of the authors and do not necessarily represent those of their affiliated organizations, or those of the publisher, the editors and the reviewers. Any product that may be evaluated in this article or claim that may be made by its manufacturer is not guaranteed or endorsed by the publisher.
Research integrity at Frontiers
Learn more about the work of our research integrity team to safeguard the quality of each article we publish.