
94% of researchers rate our articles as excellent or good
Learn more about the work of our research integrity team to safeguard the quality of each article we publish.
Find out more
ORIGINAL RESEARCH article
Front. Genet., 14 September 2023
Sec. Applied Genetic Epidemiology
Volume 14 - 2023 | https://doi.org/10.3389/fgene.2023.1132110
 Vincent P. Diego1,2
 Eron G. Manusov1,2*
 Xi Mao3
 Joanne E. Curran1,2Harald Göring1,2
 Marcio Almeida1,2
 Michael C. Mahaney1,2
 Juan M. Peralta1,2
 John Blangero1,2
 Sarah Williams-Blangero1,2
Background: Socioeconomic status (SES) is a potent environmental determinant of health. To our knowledge, no assessment of genotype-environment interaction has been conducted to consider the joint effects of socioeconomic status and genetics on risk for cardiovascular disease (CVD). We analyzed Mexican American Family Studies (MAFS) data to evaluate the hypothesis that genotype-by-environment interaction (GxE) is an important determinant of variation in CVD risk factors.
Methods: We employed a linear mixed model to investigate GxE in Mexican American extended families. We studied two proxies for CVD [Pooled Cohort Equation Risk Scores/Framingham Risk Scores (FRS/PCRS) and carotid artery intima-media thickness (CA-IMT)] in relation to socioeconomic status as determined by Duncan’s Socioeconomic Index (SEI), years of education, and household income.
Results: We calculated heritability for FRS/PCRS and carotid artery intima-media thickness. There was evidence of GxE due to additive genetic variance heterogeneity and genetic correlation for FRS, PCRS, and CA-IMT measures for education (environment) but not for household income or SEI.
Conclusion: The genetic effects underlying CVD are dynamically modulated at the lower end of the SES spectrum. There is a significant change in the genetic architecture underlying the major components of CVD in response to changes in education.
Cardiovascular disease (Tsao et al., 2022) (CVD) is a significant cause of mortality globally (Barquera et al., 2015; Joseph et al., 2017; Roth et al., 2020) and is the leading cause of mortality in the United States (US) (Ahmad and Anderson, 2021; Murphy et al., 2021; Tsao et al., 2022). The stall and even decline in US life expectancy since 2010 is primarily due to CVD mortality (Roth et al., 2018; Mehta et al., 2020). A study of high-income countries, including Austria, Belgium, Germany, Italy, Netherlands, Sweden, Switzerland, and the United Kingdom, similarly implicated CVD mortality as a leading cause of life expectancy decline (Ho and Hendi, 2018).
Results from the Whitehall I Study, conducted over 4 decades ago, and the Whitehall II study, conducted 2 decades later, demonstrate a social gradient describing an inverse relationship between mortality (particularly CVD mortality) and morbidity, and socioeconomic status (SES) (Mar et al., 1978; Rose and Marmot, 1981; Marmot, 1982; Marmot and Wilkinson, 1986; Marmot, 1989) The pattern of an inverse relationship between mortality and morbidity outcomes and socioeconomic status (SES) determinants has since been substantiated across numerous studies. (Marmot et al., 1991; Marmot and Bartley, 2002; Marmot, 2003; de Mestral and Stringhini, 2017; Tillmann et al., 2017; Schultz et al., 2018; Carter et al., 2019; Rosengren et al., 2019; Yusuf et al., 2020; Powell-Wiley et al., 2022). The disparities in mortality and obesity-related health issues by SES are increasing, worsening the social gradient (Bosworth, 2018) particularly prevalent in Mexican Americans (Hazuda et al., 1988; Hazuda et al., 1991).
We conducted a statistical genetic investigation of the potential role of genotype-by-environment interaction (GxE) in mediating the social gradient related to CVD. SES is a composite environment that dynamically modulates the genetic architecture underlying CVD mortality and morbidity phenotypes. Our approach tests predictions derived from the general hypothesis that the complex genotype-phenotype map governing CVD outcomes is dependent upon or a function of the SES environment. Using three measures of SES [household income (INC), education years (EDU), and Duncan’s socioeconomic index (SEI)], we assessed the evidence for genotype by socioeconomic status in the Mexican American Family Studies (MAFS). We investigate potential genotype-by-SES interaction (GSI) influencing several atherosclerosis or CVD risk measures. Since there are no specific risk-scores for Mexican Americans, we used the established Framingham Risk Score (FRS-08), which was developed initially as a 10-year atherosclerosis risk assessment (Wilson et al., 1998) and later revised in 2008 as a more general CVD risk prediction algorithm; (D'Agostino et al., 2008); and the American College of Cardiology/American Heart Association (ACC/AHA) atherosclerotic CVD risk score, (Goff et al., 2014), which is a 10-year risk of atherosclerosis score (Pooled Cohort Equation Risk Score) developed for African Americans (PCE-AA) and Caucasian Americans (PCE-CA) (Boateng et al., 2018; Topel et al., 2018; Wang et al., 2018; Rospleszcz et al., 2019; Ko et al., 2020; Wekesah et al., 2020). Our measures of CVD risk (based on research published by our research team) include quantitative measures of carotid intima-media thickness (IMT), including the common carotid artery IMT (CCAIMT), common carotid artery far-wall IMT (CCAFIMT), internal carotid artery IMT (ICAIMT), and internal carotid artery far-wall IMT (ICAFIMT). (Tsao et al., 2022; Centurión, 2016; Polak and O’Leary, 2016; Melton et al., 2013).
We propose that SES acts at the cellular and molecular levels to modify gene expression regarding the risk of CVD and that this can be captured by GSI modeling.
The Institutional Review Board at the University of Texas Health Science Center at San Antonio approved the MAFS study protocols. All study participants provided written informed consent.
As described by our team in earlier publications, the MAFS population (1431) comprises large Mexican American extended families (42) randomly ascertained with respect to CVD or comorbidities (Hazuda et al., 1988; Hazuda et al., 1991; Mitchell et al., 1996; MacCluer et al., 1999). The probands were recruited from a single census tract of a low-income San Antonio, Texas neighborhood. Inclusion criteria included the proband age between 40 years and 60 years, a spouse willing to participate in the study, and at least six relatives [first-, second-, and third-degree relatives of the proband (≥16 years) and of the probands spouse] available to participate in the study. Surveys determined social, behavioral, and lifestyle factors (past medical history, educational background, household income level, reproductive history, and smoking and alcohol use) related to cardiovascular risk. Established questionnaires accessed physical activity and food frequency (physical activity measured in units of metabolic-equivalent-tasks (METs), Stanford 7-Day Physical Activity Recall Instrument, and data on dietary intake variables (food frequency questionnaire developed specifically for the Mexican American population of San Antonio) (Hazuda et al., 1991).
Traditional MS risk factors [fasting glucose (mg/d), fasting insulin (u/mL), 2-h glucose (mg/dL), leptin (ng/mL), high-density lipoprotein-cholesterol (mmol/L), triglycerides (mmol/L), total serum cholesterol (mmol/L), 2-h insulin (u/mL), body mass index (kg/m2), waist circumference (cm), systolic blood pressure (mmHg), diastolic blood pressure (mmHg) were collected on all participants (Mitchell et al., 1996; MacCluer et al., 1999). We excluded 291 individuals with diabetes, diabetes medications, hypertension, or dyslipidemia to account for the impact of altered metabolism due to disease or medication (Final sample size = 1140 individuals).
We collected DM status, DM medications, HTN medications, dyslipidemia medications, smoking history, leisure time, physical activity-work, total physical activity, diet intake-protein (g/d), carb (g/d), saturated fat (g/d), monosaturated fat (g/d), polyunsaturated fat (g/d), cholesterol (g/d), sucrose (g/d), alcohol (g/d)]. Our SES variables obtained at interview were INC, and EDU where SEI was computed following the method in (Hazuda et al., 1988; Hazuda et al., 1991). This variable was used as our index of the SES environment in all our GxE analyses.
The 10-year atherosclerosis scores were computed by applying the appropriate formulas to the requisite MAFS data for the FRS, PCE-AA, and PCE-CA (D’Agostino et al., 2008; Goff et al., 2014). The PCE scores were also race-specific. All three risk scores used age, total cholesterol (TC), high-density lipoprotein-cholesterol (HDL-C), systolic blood pressure (SBP), diabetes status, and smoking status as predictors. The PCE algorithms variably modeled interactions (depending on their statistical significance) between age and the other main predictors, whereas the FRS algorithm did not. The protocol for measuring the intima-media thicknesses is reported by Melton et al. (2013).
Our statistical genetic approach is a linear mixed model, where for a generic phenotype vector y we write:
where
where
The polygenic model is used to obtain estimates of trait heritabilities and as a model reference point upon which more complex models can be elaborated. For a sample of related individuals, assuming fully uncorrelated genetic and environmental effects, the polygenic model posits that the phenotypic covariance is decomposable into additive genetic and residual environmental variance components and that inter-individual covariances will be given strictly by the additive genetic variance weighted by the genetic relatedness coefficient. The latter feature of the polygenic model makes two implicit assumptions regarding the genetic covariance: that the pairwise genetic correlation is unity, and that the additive genetic variance is homogeneous.
Under the general GxE model, we relax these assumptions by expressing both the additive genetic variance and genetic correlations as continuous functions of a specific environment to capture any potential interaction between the genetic effects (i.e., the additive genetic variance and/or genetic correlation) and the specific environment. The null hypothesis under this extension is that the expression of the aggregate of all genotypes underlying a phenotype (polygenotype) is independent of the specific environment. Rejection of this null implies that the genotype-phenotype map for the trait in question depends on a specific environment or, in other words, is a function of the specific environment. We propose that the extent to which the genotype-phenotype interaction depends on a function of the environment can be captured by modeling the GxE variance. For the simplest case of contrasting two different SES environments, for example, high versus low levels of income, the GxE variance is zero if the following two conditions are simultaneously true: homogeneity in the additive genetic variance:
There is GxE evidence if either null hypothesis is rejected (Diego et al., 2003; Diego et al., 2007; Santos et al., 2014; Arya et al., 2018; Manusov et al., 2022). Rejection of either or both is evidence that the phenotypic response to the environment has a genetic basis.
We now extend this theory to a spectrum of such measures to model GxE for continuous SES environments as opposed to two levels of the SES variable. To this end, we employ variance and correlation functions (Diego et al., 2003; Diego et al., 2007; Santos et al., 2014; Arya et al., 2018; Manusov et al., 2022), which we now define as:
where the additive genetic variance is re-parameterized as an exponential function of the value of the environmental variable
We then posit a diagonal matrix
where
To ensure that we are highlighting the potential for SES environments to modulate the genotype-phenotype map, we employ Best Linear Unbiased Prediction (BLUP) methods to extract any associated additive genetic effects influencing EDU, INC, and SEI. (Quillen et al., 2014; Diego et al., 2015a; Porto et al., 2018). BLUP accounts for additive genetic and environmental covariances among relatives based on known pedigree structure (Diego et al., 2015a). We then subtracted the BLUP genetic values from the original SES variable to get a BLUP-computed version of that variable that reflects primarily environmental effects (Diego et al., 2015a; Manusov et al., 2022). This lattermost variable is our GXE models’ focal (genetically corrected) environment.
For the basic polygenic model, denote the parameter vector by
The statistical genetics package SOLAR (http://solar-eclipse-genetics.org/brief-overview.html) was used to obtain the model likelihoods, maximum likelihood estimates (MLEs) of model parameters, and their standard errors (SEs) (Almasy and Blangero, 1998). Hypothesis tests were performed by way of the likelihood ratio test (LRT) statistic, denoted as
where
We adopted a two-stage hypothesis testing approach that our team has implemented to analyze GxE models of biomedically significant trait-environment dyads (Santos et al., 2014; Arya et al., 2018; Manusov et al., 2022). In the first stage, we examined if the overall GxE model provided a better fit to the data when compared with the polygenic model by the LRT. It is important to note that the polygenic model is nested within the full GxE model and that relative to the polygenic model, the GxE model has three additional parameters (
In the second stage, we examined the more specific GxE hypotheses. The full GxE model with all parameters estimated was compared with models when either
Our analysis reveals that genetic factors play a significant role in shaping the phenotypic response to various socioeconomic (SES) measures. The heritability estimates indicate that genetic factors account for a substantial portion of the variation in these traits, ranging from 41% to 51%. Table 1 provides an overview of the heritabilities and demographic data (EDU-h2 = 0.41, INC-h2 = 0.43, and SEI-H2 = 0.51 p < 1.0 s 10–5 for each).
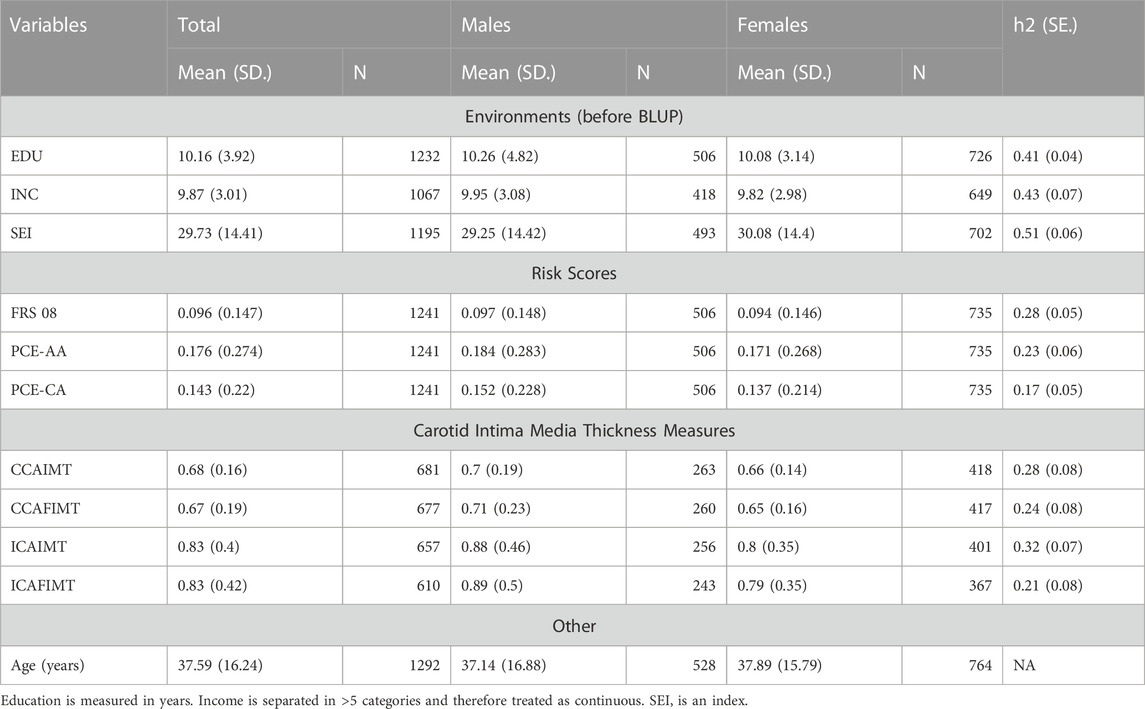
TABLE 1. Descriptive statistics and heritabilities of variables.
In the initial stage of our analysis, we compared the performance of the genotype-by-socioeconomic status interaction (GSI) model to that of the polygenic model. We showed a significant improvement of the GSI model over the polygenic model only when EDU, and not INC or SEI, served as the environmental index Table 2.

TABLE 2. Polygenic model vs. full genotype-by-socioeconomic status interaction (GSI) model.
Further Analysis: Additive Genetic Variance Homogeneity, Genetic Correlation, and Residual Environmental variance homogeneity, specifically for the genotype-by-EDU interaction (GEdI) models.
Moving to the second stage, we focused on more specific hypotheses related to additive genetic variance homogeneity, a genetic correlation of 1, and residual environmental variance homogeneity, specifically for the genotype-by-EDU interaction (GEdI) model.
For FRS-08, we found that the GSE (genetic correlation) was not significantly different from 1. Under a reduced GEdI model (where the gamma-G parameter was always constrained to 0), we discovered significant evidence of GEdI. This was indicated by a genetic correlation function that declined significantly away from 1 (Table 3; Figures 1C, 2A), as well as significant heterogeneity in the residual environmental variance (Table 3; Figures 1B, 2A). Notably, the residual environmental variance decreased as EDU values increased. All other traits were analyzed under the full GEdI model because the parameter standard errors were always less than their MLEs.
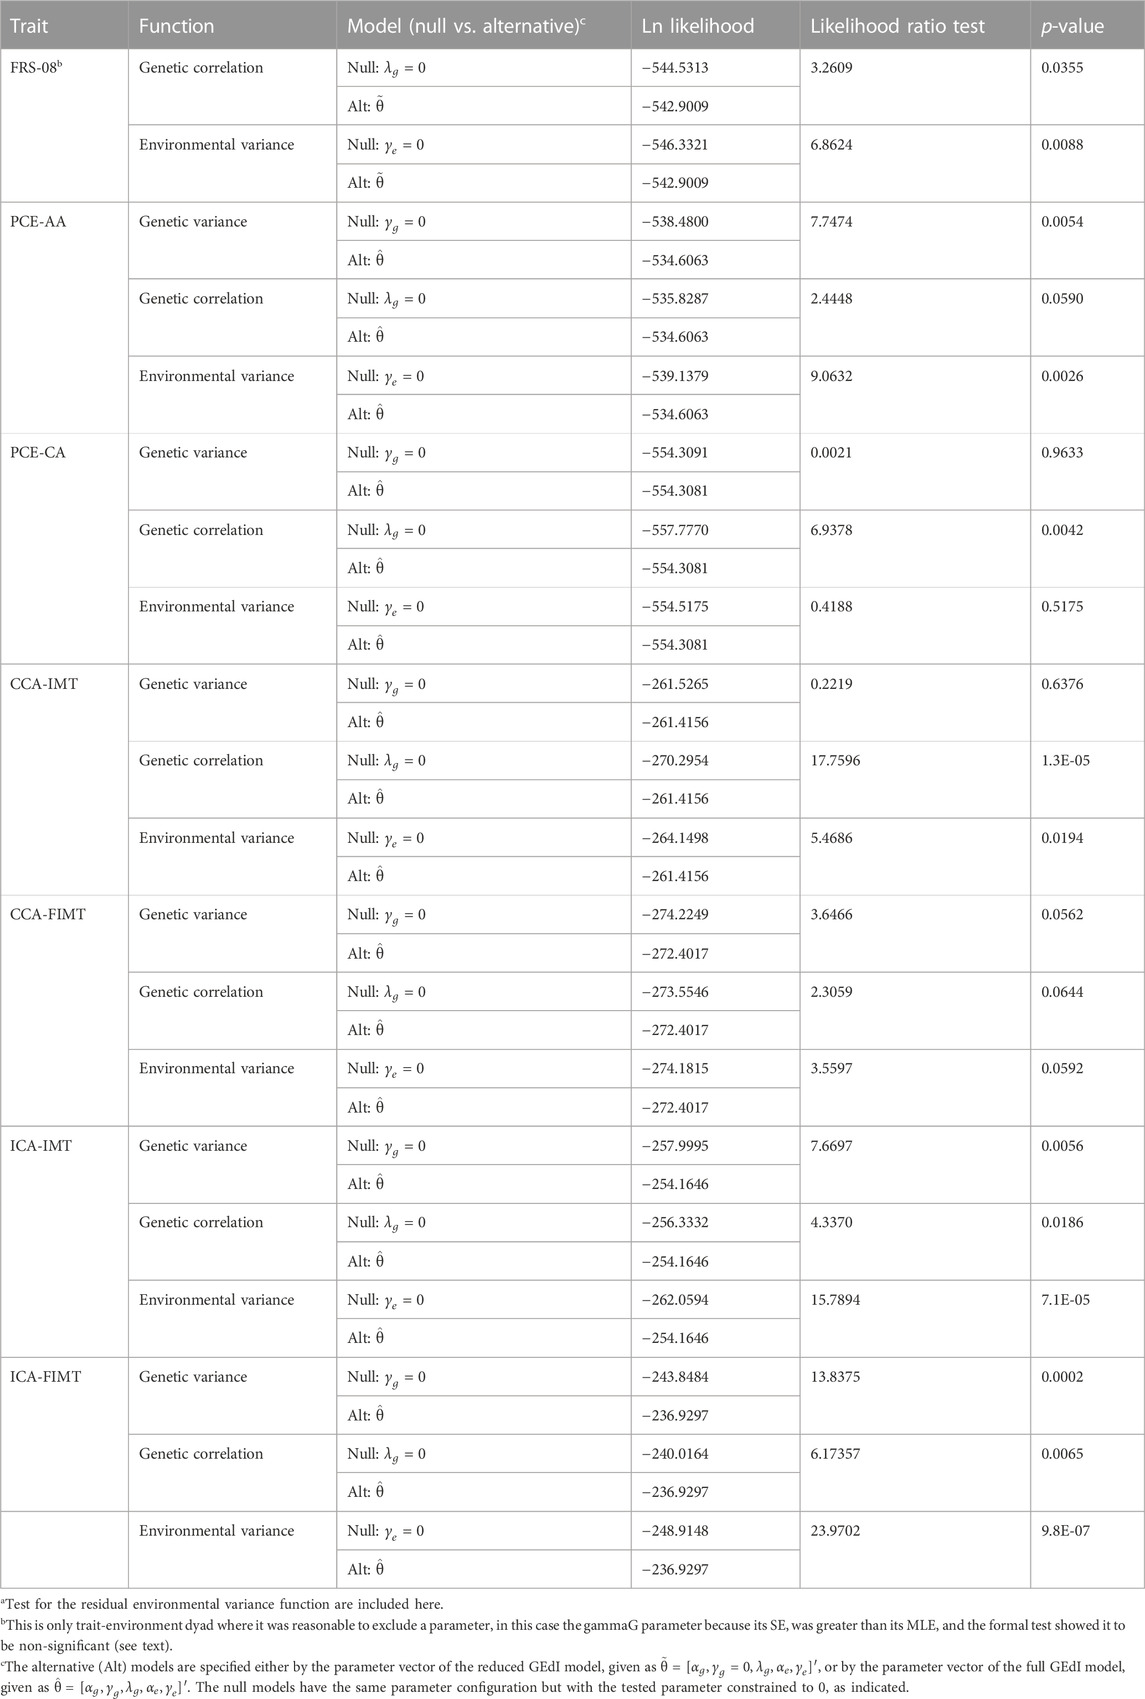
TABLE 3. Genotype-by-education interaction (GEdI) effects on heart disease risk variablesa.

FIGURE 1. Variance and correlation functions under the genotype-by-education interaction model. (A) Additive genetic variance functions. (B) Residual environmental variance functions. (C) Genetic correlation functions.
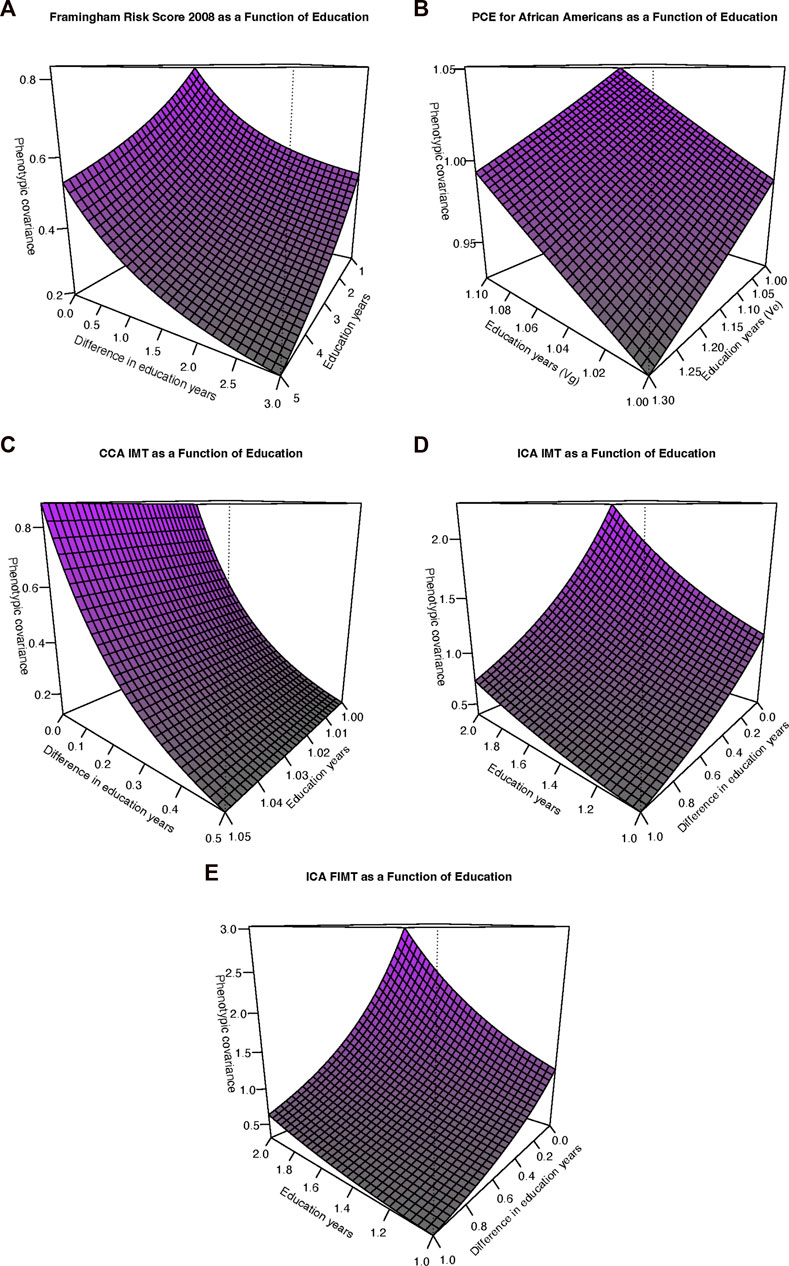
FIGURE 2. Phenotypic covariance functions. (A) Framingham risk score, 2008. The sum of the additive genetic and residual environmental variances increases along the “Education years” (Edu) axis whereas the genetic correlation function decreases away from 1 with increasing differences along the “Difference in education years” (Diff) axis. (B) Pooled cohort equations (PCE) for African Americans (PCE-AA). The additive genetic variance (Vg) increases for increasing values along the Edu axis whereas the residual environmental variance decreases for increasing Edu axis values. (C) Common carotid artery (CCA) Intima-media thickness (IMT). Axes as in (A). However, as also depicted in Figure 2B, the residual environmental variance is in fact decreasing but at a relatively slower rate (but still statistically significant). (D) Internal carotid artery (ICA) IMT. Axes as in (A). The phenotypic covariance is increasing overall as a function of increasing additive genetic variance, decreasing residual environmental variance, and a genetic correlation significantly declining away from 1. (E) ICA FIMT. Axes as in (A). Interpretation as in (D).
In the case of PCE-AA, we found evidence of GEdI through significant heterogeneity in additive genetic variance (Table 3; Figures 1A, 2B), which increased with higher levels of EDU. Additionally, we observed a significant decrease in the residual environmental variance as EDU values increased (Table 3; Figures 1A, 2B). It is important to note that whenever there was evidence of significant additive genetic variance heterogeneity for all traits, it was consistently increasing. Similarly, significant residual environmental variance heterogeneity was consistently decreasing. These two functions were independent under our model and free to increase or decrease. This is an important point because the observed pattern is not an artifact or constraint of the model.
For PCE-CA., we identified significant GEdI due to a genetic correlation function declining away from 1 with increasing differences in the EDU index (Table 3; Figure 1C).
Our analysis of CCA-IMT revealed evidence of GEdI, as indicated by a genetic correlation function declining away from 1 and significant heterogeneity in the residual environmental variance (decreasing) (Table 3; Figures 1B, C, 2C).
There was no evidence of GEdI or residual environmental variance heterogeneity for CCA-FIMT (Table 3). The p-values were slightly above the nominal significance level (p•0.05). It is worth noting that this trait had the smallest sample size among the variables examined (Table 1), suggesting a potential lack of statistical power rather than an absolute absence of an effect.
For both ICA-IMT and ICA-FIMT, there was evidence of GEdI for both mechanisms of additive genetic variance heterogeneity and a genetic correlation not equal to 1 and evidence of residual environmental variance heterogeneity (Table 3; Figures 1A–C, 2D,E).
There is evidence of an interaction of genes and obesity related to CVD in Mexican Americans (Mitchell et al., 1996; MacCluer et al., 1999; Diego et al., 2007). Mexican Americans, like Mexicans, are carriers of risk alleles related to chronic disease, especially CVD and Lipid metabolism, and adversely respond to obesogenic Westernized diets (Hazuda et al., 1988; Hazuda et al., 1991). The current report makes several key additional contributions. Firstly, education influences the genotype-phenotype map underlying CVD risk variables. We observed an increase in additive genetic variance with higher levels of education, implying the expression of different sets of genes at different ends of the education spectrum. While social determinants of health are undeniably important for CVD and overall health outcomes, our findings emphasize that of the three considered SES variables education plays a predominant role. For several traits (PCE-AA, ICA-IMT, and ICA-FIMT), increasing educations levels were associated with higher additive genetic variance and reduced residual environmental variance. Additionally, for four traits (FRS-08, CCA-IMT, ICA-IM, and ICA-FIMT), the genetic correlations function deviated from 1, indicating the expression of different sets of genes across varying environmental conditions. It is important to note that a genetic correlation of less than 1 across environmental differences does not imply diminishing genetic effects, rather the dynamic nature of genetic effects in response to varying levels of education, while the influence of residual environmental factors becomes less prominent. Our findings highlight that genetic effects become increasingly crucial with higher levels of education.
The role of social determinants of health, particularly socioeconomic status (SES), in the development of cardiovascular disease in Mexican Americans has also garnered significant attention from various disciplines. (de Mestral and Stringhini, 2017; Tillmann et al., 2017; Schultz et al., 2018; Carter et al., 2019; Rosengren et al., 2019; Yusuf et al., 2020; Powell-Wiley et al., 2022). Rosengren et al. (2019) reported results consistent with ours---at the same time that there was a significant inverse relationship between education levels and CVD outcomes, there was, at best, a weak inverse relationship and, at worst, no relationship between income levels and CVD outcomes. We found consistent evidence of GXE effects for education, but not for household income or SEI. Using a Mendelian randomization approach, Tillmann et al. (2017) reported that education levels mediated increased genetic predisposition to CVD. Carter et al. (2019) demonstrated that while certain factors such as body mass index, systolic blood pressure, and smoking mediated some of the inverse relationships between education and CVD outcomes, a significant portion of the protective effect of education remains unexplained. Our results indicate that a substantial proportion of this unexplained effect may be attributed to genotype-by-education (GEdI) effects. By explicitly modeling GEdI, we account for effects beyond additive genetic effects and capture the effects triggered in response to the educational environment.
Recognizing education to be crucially important in the genesis of the social gradient, Marmot hypothesized that SDoH in general (Marmot, 2003; Marmot, 2006a; Marmot, 2006b) and education in particular (Marmot, 2015a; Marmot, 2015b) might directly translate to greater degrees of empowerment, autonomy, and control. Our findings suggest that the effects of education arise at the genetic level, not primarily at the socioeconomic level, as Marmot hypothesized. The potential of education to modulate genetic factors underlying disease phenotypes may be the foundational factor to consider in the role of SDoH in the genesis of the social gradient. How genes and environment interact at a molecular level remains a mystery, although recent evidence suggests that inflammatory pathways may be involved (Hartiala et al., 2021).
Our study is unique in several ways. Firstly, this is a family-based design of Mexican American families and is useful for combined linkage and association analysis. The increased genetic relationship among relatives allows the implementation of genetic variance decomposition methods (Blangero et al., 2013). Family-based studies can identify rare variants (Laird and Lange, 2006; Benyamin et al., 2009). Our environmental decomposition methods approach allows for isolation of gene and environmental interaction. It is important to note that family-based studies have a smaller sample size compared to population-based studies but serve to provide important information from a group (Mexican Americans) that historically has not been included in genetic studies.
The Framingham Risk Score could overestimate/underestimate risk in US-Hispanic populations as the magnitude of associations between risk factors differs between race/ethnic groups (Gijsberts et al., 2015). The findings are theoretical and may not extrapolate to gene expression and regulation. The statistics provide valuable insight, however, future gene evaluations, such as mRNA sequencing, will provide helpful information on genes and pathways involved. In addition to education, income, and SEI, other SES candidates that offer a better resolution of socioeconomic determinants of health include measures of individual endowments, such as asset and human capital, as well as the measure of external constraint from family and culture assimilation, such as family, community, society, and the systems of governance.
Since education significantly affects genetic factors underlying CVD risk variables, future studies should prioritize education as the critical socioeconomic determinant when investigating gene-environment interactions for CVD risk. Future studies should investigate how education may directly affect genetic factors underlying CVD risk and the mechanisms through which it may exert its influence. We can also examine the genetic correlation across different education levels---the genetic correlation of CVD risk variables was found to decline with increasing differences in education levels. This suggests different genes may be involved in CVD risk at different education levels. Future studies should further examine this relationship and the specific genetic variants that may be involved. Researchers can consider the interplay between genetic and environmental factors. Our findings suggest that genetic and residual environmental factors significantly influence CVD risk variables, with environmental factors becoming less important as education levels increase. Future research should continue to investigate this complex interplay and how genetic and environmental factors interact to impact CVD risk across varying education levels.
The next step in this research is to determine the genes involved in the genotype by education interaction. Once identified, established canonical pathways and molecular expression can provide intervention targets and a better understanding of how genes interact with environments to modify genetic expression in health and illness.
We examined potential GxE interaction using likelihood-based statistical inference in the phenotypical expression of CVD. We assessed Social Determinants of Health (SDoH), specifically measurements of socioeconomic level, and identified significant GxE interactions for CVD and education. These findings provide evidence that genetic factors interact with the level of education to influence CVD. Future directions will focus on the specific genes involved and the nature of the interactions.
The raw data supporting the conclusion of this article will be made available by the authors, without undue reservation.
The studies involving human participants were reviewed and approved by the Institutional Review Board at the University of Texas Health Science Center at San Antonio. The participants provided their written informed consent to participate in this study.
VD was involved in developing the concept, collecting data, the analysis, and writing the manuscript EM was involved in developing the concept, analysis, and writing of the manuscript XM was involved in developing the concept, analysis, and writing of the manuscript. HG was involved in collecting data and writing the manuscript. MA was involved in collecting data and writing the manuscript. MM was involved in developing the concept, collecting data, and the analysis. JP was involved in collecting data and the analysis. JB was involved in developing the concept, collecting data, the analysis, and writing the manuscript SW-B was involved in developing the concept, collecting data, the analysis, and writing the manuscript. All authors contributed to the article and approved the submitted version.
This research was funded by National Institutes of Health (NIH) grants P01 HL45522, and R01 MH 59490. Portions of the research were conducted in facilities constructed with support from NIH grant C06 RR020547 and Project THRIVE funded by the Valley Baptist Legacy Foundation.
The authors declare that the research was conducted in the absence of any commercial or financial relationships that could be construed as a potential conflict of interest.
All claims expressed in this article are solely those of the authors and do not necessarily represent those of their affiliated organizations, or those of the publisher, the editors and the reviewers. Any product that may be evaluated in this article, or claim that may be made by its manufacturer, is not guaranteed or endorsed by the publisher.
American College of Cardiology/American Heart Association, (ACC/AHA); cardiovascular disease, (CVD); common carotid artery far-wall IMT, (CCAFIMT); common carotid artery IMT, (CCAIMT); Duncan’s socioeconomic index, (SEI); education years, (EDU); Framingham Risk Score, (FRS-08; genotype-by-education, (GEdI); genotype-by-environment interaction, (GxE); genotype-by-SES interaction, (GSI); genotype-by-socioeconomic status interaction, (GSI); household income, (INC); internal carotid artery far-wall IMT, (ICAFIMT); internal carotid artery IMT, (ICAIMT); Mexican American Family Studies, (MAFS); pooled Cohort Equation Risk Score African Americans, (PCE-AA); pooled Cohort Equation Risk Score Caucasian Americans, (PCE-CA); socioeconomic status, (SES).
Ahmad, F. B., and Anderson, R. N. (2021). The leading causes of death in the US for 2020. JAMA 325 (18), 1829–1830. doi:10.1001/jama.2021.5469
Almasy, L., and Blangero, J. (1998). Multipoint quantitative-trait linkage analysis in general pedigrees. Am. J. Hum. Genet. 62 (5), 1198–1211. doi:10.1086/301844
Arya, R., Farook, V. S., Fowler, S. P., Puppala, S., Chittoor, G., Resendez, R. G., et al. (2018). Genetic and environmental (physical fitness and sedentary activity) interaction effects on cardiometabolic risk factors in Mexican American children and adolescents. Genet. Epidemiol. 42 (4), 378–393. doi:10.1002/gepi.22114
Barquera, S., Pedroza-Tobías, A., Medina, C., Hernández-Barrera, L., Bibbins-Domingo, K., Lozano, R., et al. (2015). Global overview of the Epidemiology of atherosclerotic cardiovascular disease. Arch. Med. Res. 46 (5), 328–338. doi:10.1016/j.arcmed.2015.06.006
Benyamin, B., Visscher, P. M., and McRae, A. F. (2009). Family-based genome-wide association studies. Pharmacogenomics 10 (2), 181–190. doi:10.2217/14622416.10.2.181
Blangero, J., Diego, V. P., Dyer, T. D., Almeida, M., Peralta, J., Kent, J. W., et al. (2013). A kernel of truth: statistical advances in polygenic variance component models for complex human pedigrees. Adv. Genet. 81, 1–31. doi:10.1016/B978-0-12-407677-8.00001-4
Boateng, D., Agyemang, C., Beune, E., Meeks, K., Smeeth, L., Schulze, M. B., et al. (2018). Cardiovascular disease risk prediction in sub-Saharan African populations - comparative analysis of risk algorithms in the RODAM study. Int. J. Cardiol. 254, 310–315. doi:10.1016/j.ijcard.2017.11.082
Bosworth, B. (2018). Increasing disparities in mortality by socioeconomic status. Annu. Rev. Public Health 39, 237–251. doi:10.1146/annurev-publhealth-040617-014615
Carter, A. R., Gill, D., Davies, N. M., Taylor, A. E., Tillmann, T., Vaucher, J., et al. (2019). Understanding the consequences of education inequality on cardiovascular disease: mendelian randomisation study. BMJ 365, l1855. doi:10.1136/bmj.l1855
Centurión, O. A. (2016). Carotid intima-media thickness as a cardiovascular risk factor and imaging pathway of atherosclerosis. Crit. Pathw. Cardiol. 15 (4), 152–160. doi:10.1097/HPC.0000000000000087
D'Agostino, R. B., Vasan, R. S., Pencina, M. J., Wolf, P. A., Cobain, M., Massaro, J. M., et al. (2008). General cardiovascular risk profile for use in primary care: the Framingham heart study. Circulation 117 (6), 743–753. doi:10.1161/CIRCULATIONAHA.107.699579
de Mestral, C., and Stringhini, S. (2017). Socioeconomic status and cardiovascular disease: an update. Curr. Cardiol. Rep. 19 (11), 115. doi:10.1007/s11886-017-0917-z
Diego, V. P., Almasy, L., Dyer, T. D., Soler, J. M., and Blangero, J. (2003). Strategy and model building in the fourth dimension: A null model for genotype x age interaction as a Gaussian stationary stochastic process. BMC Genet. 4, S34. doi:10.1186/1471-2156-4-S1-S34
Diego, V. P., Rainwater, D. L., Wang, X. L., Cole, S. A., Curran, J. E., Johnson, M. P., et al. (2007). Genotype x adiposity interaction linkage analyses reveal a locus on chromosome 1 for lipoprotein-associated phospholipase A2, a marker of inflammation and oxidative stress. Am. J. Hum. Genet. 80 (1), 168–177. doi:10.1086/510497
Diego, V. P., Kent, J. W., and Blangero, J. (2015a). “Familial studies: genetic inferences,” in International encyclopedia of the behavioral and social sciences (Elsevier).
Diego, V. P., de Chaves, R. N., Blangero, J., de Souza, M. C., Santos, D., Gomes, T. N., et al. (2015b). Sex-specific genetic effects in physical activity: results from a quantitative genetic analysis. BMC Med. Genet. 16, 58. doi:10.1186/s12881-015-0207-9
Gijsberts, C. M., Groenewegen, K. A., Hoefer, I. E., Eijkemans, M. J., Asselbergs, F. W., Anderson, T. J., et al. (2015). Race/ethnic differences in the associations of the Framingham risk factors with carotid IMT and cardiovascular events. PLoS One 10 (7), e0132321. doi:10.1371/journal.pone.0132321
Goff, D. C., Lloyd-Jones, D. M., Bennett, G., Coady, S., D'Agostino, R. B., Gibbons, R., et al. (2014). 2013 ACC/AHA guideline on the assessment of cardiovascular risk: A report of the American College of Cardiology/American heart association task force on practice guidelines. Circulation 129 (25), S49–S73. doi:10.1161/01.cir.0000437741.48606.98
Hartiala, J. A., Hilser, J. R., Biswas, S., Lusis, A. J., and Allayee, H. (2021). Gene-environment interactions for cardiovascular disease. Curr. Atheroscler. Rep. 23 (12), 75. doi:10.1007/s11883-021-00974-9
Hazuda, H. P., Haffner, S. M., Stern, M. P., and Eifler, C. W. (1988). Effects of acculturation and socioeconomic status on obesity and diabetes in Mexican Americans. The San Antonio Heart Study. Am. J. Epidemiol. 128 (6), 1289–1301. doi:10.1093/oxfordjournals.aje.a115082
Hazuda, H. P., Mitchell, B. D., Haffner, S. M., and Stern, M. P. (1991). Obesity in Mexican American subgroups: findings from the san Antonio heart study. Am. J. Clin. Nutr. 53 (6), 1529S–1534S. doi:10.1093/ajcn/53.6.1529S
Ho, J. Y., and Hendi, A. S. (2018). Recent trends in life expectancy across high income countries: retrospective observational study. BMJ 362, k2562. doi:10.1136/bmj.k2562
Jaffrézic, F., and Pletcher, S. D. (2000). Statistical models for estimating the genetic basis of repeated measures and other function-valued traits. Genetics 156 (2), 913–922. doi:10.1093/genetics/156.2.913
Joseph, P., Leong, D., McKee, M., Anand, S. S., Schwalm, J. D., Teo, K., et al. (2017). Reducing the global burden of cardiovascular disease, Part 1: the Epidemiology and risk factors. Circ. Res. 121 (6), 677–694. doi:10.1161/CIRCRESAHA.117.308903
Kirkpatrick, M., and Heckman, N. (1989). A quantitative genetic model for growth, shape, reaction norms, and other infinite-dimensional characters. J. Math. Biol. 27 (4), 429–450. doi:10.1007/BF00290638
Ko, D. T., Sivaswamy, A., Sud, M., Kotrri, G., Azizi, P., Koh, M., et al. (2020). Calibration and discrimination of the Framingham risk score and the pooled cohort equations. CMAJ 192 (17), E442–E449. doi:10.1503/cmaj.190848
Laird, N. M., and Lange, C. (2006). Family-based designs in the age of large-scale gene-association studies. Nat. Rev. Genet. 7 (5), 385–394. doi:10.1038/nrg1839
MacCluer, J. W., Stern, M. P., Almasy, L., Atwood, L. A., Blangero, J., Comuzzie, A. G., et al. (1999). Genetics of atherosclerosis risk factors in Mexican Americans. Nutr. Rev. 57 (5), S59–S65. doi:10.1111/j.1753-4887.1999.tb01790.x
Manusov, E. G., Diego, V. P., Sheikh, K., Laston, S., Blangero, J., and Williams-Blangero, S. (2022). Non-alcoholic fatty liver disease and depression: evidence for genotype × environment interaction in Mexican Americans. Front. Psychiatry 13, 936052. doi:10.3389/fpsyt.2022.936052
Marmot, M. G., Rose, G., Shipley, M., and Hamilton, P. J. (1978). Employment grade and coronary heart disease in British civil servants. J. Epidemiol. Community Health 32 (4), 244–249. doi:10.1136/jech.32.4.244
Marmot, M., Bartley, , and Levi, L. (2002). “Social class and coronary heart disease,” in Stress and the heart: Psychosocial pathways to coronary heart disease, Stansfeld SA and Marmot MG (BMJ Books), 5–19.
Marmot, M. G. (1986). “Social inequalities in mortality: the social environment,” in Class and health. Editor R. G. Wilkinson (Routledge), 21–33.
Marmot, M. G., Smith, G. D., Stansfeld, S., Patel, C., North, F., Head, J., et al. (1991). Health inequalities among British civil servants: the Whitehall II study. Lancet 337 (8754), 1387–1393. doi:10.1016/0140-6736(91)93068-k
Marmot, M. G. (1982). Socioeconomic and cultural factors in ischaemic heart disease. Adv. Cardiol. 29, 68–76. doi:10.1159/000406199
Marmot, M. (1989). Socioeconomic determinants of CHD mortality. Int. J. Epidemiol. 18 (3), S196–S202. doi:10.1093/ije/18.supplement_1.s196
Marmot, M. G. (2003). Understanding social inequalities in health. Perspect. Biol. Med. 46 (3), S9–S23. doi:10.1353/pbm.2003.0070
Marmot, M. (2006a). Status syndrome: A challenge to medicine. JAMA 295 (11), 1304–1307. doi:10.1001/jama.295.11.1304
Marmot, M. (2006b). Health in an unequal world. Lancet 368 (9552), 2081–2094. doi:10.1016/S0140-6736(06)69746-8
Marmot, M. (2015a). The health gap: the challenge of an unequal world. Lancet 386 (10011), 2442–2444. doi:10.1016/S0140-6736(15)00150-6
Marmot, M. (2015b). The health gap: The challenge of an unequal world. First U.S. Edition. Bloomsbury Press, an imprint of Bloomsbury Publishing Plc.
Mehta, N. K., Abrams, L. R., and Myrskylä, M. (2020). US life expectancy stalls due to cardiovascular disease, not drug deaths. Proc. Natl. Acad. Sci. U. S. A. 117 (13), 6998–7000. doi:10.1073/pnas.1920391117
Melton, P. E., Carless, M. A., Curran, J. E., Dyer, T. D., Göring, H. H., Kent, J. W., et al. (2013). Genetic architecture of carotid artery intima-media thickness in Mexican Americans. Circ. Cardiovasc Genet. 6 (2), 211–221. doi:10.1161/CIRCGENETICS.113.000079
Meyer, K., and Kirkpatrick, M. (2005). Up hill, down dale: quantitative genetics of curvaceous traits. Philos. Trans. R. Soc. Lond B Biol. Sci. 360 (1459), 1443–1455. doi:10.1098/rstb.2005.1681
Mitchell, B. D., Kammerer, C. M., Blangero, J., Mahaney, M. C., Rainwater, D. L., Dyke, B., et al. (1996). Genetic and environmental contributions to cardiovascular risk factors in Mexican Americans. The san Antonio family heart study. Circulation 94 (9), 2159–2170. doi:10.1161/01.cir.94.9.2159
Murphy, S. L., Kochanek, K. D., Xu, J., and Arias, E. (2021). Mortality in the United States, 2020. NCHS Data Brief. (427), 1–8.
Pawitan, Y. (2001). In all likelihood: Statistical modelling and inference using likelihood. Oxford University Press.
Pletcher, S. D., and Geyer, C. J. (1999). The genetic analysis of age-dependent traits: modeling the character process. Genetics 153 (2), 825–835. doi:10.1093/genetics/153.2.825
Pletcher, S. D., and Jaffrézic, F. (2002). Generalized character process models: estimating the genetic basis of traits that cannot be observed and that change with age or environmental conditions. Biometrics 58 (1), 157–162. doi:10.1111/j.0006-341x.2002.00157.x
Polak, J. F., and O'Leary, D. H. (2016). Carotid intima-media thickness as surrogate for and predictor of CVD. Glob. Heart 11 (3), 295–312. doi:10.1016/j.gheart.2016.08.006
Porto, A., Peralta, J. M., Blackburn, N. B., and Blangero, J. (2018). Reliability of genomic predictions of complex human phenotypes. BMC Proc. 12 (9), 51. doi:10.1186/s12919-018-0138-5
Powell-Wiley, T. M., Baumer, Y., Baah, F. O., Baez, A. S., Farmer, N., Mahlobo, C. T., et al. (2022). Social determinants of cardiovascular disease. Circ. Res. 130 (5), 782–799. doi:10.1161/CIRCRESAHA.121.319811
Quillen, E. E., Voruganti, V. S., Chittoor, G., Rubicz, R., Peralta, J. M., Almeida, M. A., et al. (2014). Evaluation of estimated genetic values and their application to genome-wide investigation of systolic blood pressure. BMC Proc. 8, S66. doi:10.1186/1753-6561-8-S1-S66
Rose, G., and Marmot, M. G. (1981). Social class and coronary heart disease. Br. Heart J. 45 (1), 13–19. doi:10.1136/hrt.45.1.13
Rosengren, A., Smyth, A., Rangarajan, S., Ramasundarahettige, C., Bangdiwala, S. I., AlHabib, K. F., et al. (2019). Socioeconomic status and risk of cardiovascular disease in 20 low-income, middle-income, and high-income countries: the prospective urban rural epidemiologic (PURE) study. Lancet Glob. Health 7 (6), e748–e760. doi:10.1016/S2214-109X(19)30045-2
Rospleszcz, S., Thorand, B., de Las Heras Gala, T., Meisinger, C., Holle, R., Koenig, W., et al. (2019). Temporal trends in cardiovascular risk factors and performance of the Framingham risk score and the pooled cohort equations. J. Epidemiol. Community Health 73 (1), 19–25. doi:10.1136/jech-2018-211102
Roth, G. A., Johnson, C. O., Abate, K. H., Abd-Allah, F., Ahmed, M., Alam, K., et al. (2018). The burden of cardiovascular diseases among US States, 1990-2016. JAMA Cardiol. 3 (5), 375–389. doi:10.1001/jamacardio.2018.0385
Roth, G. A., Mensah, G. A., Johnson, C. O., Addolorato, G., Ammirati, E., Baddour, L. M., et al. GBD-NHLBI-JACC Global Burden of Cardiovascular Diseases Writing Group (2020). Global burden of cardiovascular diseases and risk factors, 1990-2019: update from the GBD 2019 study. J. Am. Coll. Cardiol. 76 (25), 2982–3021. doi:10.1016/j.jacc.2020.11.010
Santos, D. M., Katzmarzyk, P. T., Diego, V. P., Blangero, J., Souza, M. C., Freitas, D. L., et al. (2014). Genotype by sex and genotype by age interactions with sedentary behavior: the Portuguese Healthy family study. PLoS One 9 (10), e110025. doi:10.1371/journal.pone.0110025
Schultz, W. M., Kelli, H. M., Lisko, J. C., Varghese, T., Shen, J., Sandesara, P., et al. (2018). Socioeconomic status and cardiovascular outcomes: challenges and interventions. Circulation 137 (20), 2166–2178. doi:10.1161/CIRCULATIONAHA.117.029652
Tillmann, T., Vaucher, J., Okbay, A., Pikhart, H., Peasey, A., Kubinova, R., et al. (2017). Education and coronary heart disease: mendelian randomisation study. BMJ 358, j3542. doi:10.1136/bmj.j3542
Topel, M. L., Shen, J., Morris, A. A., Al Mheid, I., Sher, S., Dunbar, S. B., et al. (2018). Comparisons of the Framingham and pooled cohort equation risk scores for detecting subclinical vascular disease in blacks versus whites. Am. J. Cardiol. 121 (5), 564–569. doi:10.1016/j.amjcard.2017.11.031
Tsao, C. W., Aday, A. W., Almarzooq, Z. I., Alonso, A., Beaton, A. Z., Bittencourt, M. S., et al. (2022). Heart disease and stroke statistics-2022 update: A report from the American heart association. Circulation 145 (8), e153–e639. doi:10.1161/CIR.0000000000001052
Wang, H., Sun, Y., Yi, X., and Zhang, L. (2018). Evaluation of the Framingham risk score and pooled cohort risk equation for prediction of cardiovascular risk in low resource areas: insights from asian rural population. Int. J. Cardiol. 265, 237. doi:10.1016/j.ijcard.2018.04.063
Wekesah, F. M., Mutua, M. K., Boateng, D., Grobbee, D. E., Asiki, G., Kyobutungi, C. K., et al. (2020). Comparative performance of pooled cohort equations and Framingham risk scores in cardiovascular disease risk classification in a slum setting in Nairobi Kenya. Int. J. Cardiol. Heart Vasc. 28, 100521. doi:10.1016/j.ijcha.2020.100521
Wilson, P. W., D'Agostino, R. B., Levy, D., Belanger, A. M., Silbershatz, H., and Kannel, W. B. (1998). Prediction of coronary heart disease using risk factor categories. Circulation 97 (18), 1837–1847. doi:10.1161/01.cir.97.18.1837
Yusuf, S., Joseph, P., Rangarajan, S., Islam, S., Mente, A., Hystad, P., et al. (2020). Modifiable risk factors, cardiovascular disease, and mortality in 155 722 individuals from 21 high-income, middle-income, and low-income countries (PURE): A prospective cohort study. Lancet 395 (10226), 795–808. doi:10.1016/S0140-6736(19)32008-2
Keywords: GxE, CVD (cardio vascular disease), Duncan’s SEI, SES, Mexican Americans, Framingham 10-year general cardiovascular disease risk, linear mixed model
Citation: Diego VP, Manusov EG, Mao X, Curran JE, Göring H, Almeida M, Mahaney MC, Peralta JM, Blangero J and Williams-Blangero S (2023) Genotype-by-socioeconomic status interaction influences heart disease risk scores and carotid artery thickness in Mexican Americans: the predominant role of education in comparison to household income and socioeconomic index. Front. Genet. 14:1132110. doi: 10.3389/fgene.2023.1132110
Received: 29 December 2022; Accepted: 17 July 2023;
Published: 14 September 2023.
Edited by:
M. Geoffrey Hayes, Northwestern University, United StatesReviewed by:
Elizabeth Hauser, Duke University, United StatesCopyright © 2023 Diego, Manusov, Mao, Curran, Göring, Almeida, Mahaney, Peralta, Blangero and Williams-Blangero. This is an open-access article distributed under the terms of the Creative Commons Attribution License (CC BY). The use, distribution or reproduction in other forums is permitted, provided the original author(s) and the copyright owner(s) are credited and that the original publication in this journal is cited, in accordance with accepted academic practice. No use, distribution or reproduction is permitted which does not comply with these terms.
*Correspondence: Eron G. Manusov, ZXJvbi5tYW51c292QHV0cmd2LmVkdQ==
Disclaimer: All claims expressed in this article are solely those of the authors and do not necessarily represent those of their affiliated organizations, or those of the publisher, the editors and the reviewers. Any product that may be evaluated in this article or claim that may be made by its manufacturer is not guaranteed or endorsed by the publisher.
Research integrity at Frontiers
Learn more about the work of our research integrity team to safeguard the quality of each article we publish.