
95% of researchers rate our articles as excellent or good
Learn more about the work of our research integrity team to safeguard the quality of each article we publish.
Find out more
ORIGINAL RESEARCH article
Front. Genet. , 20 March 2023
Sec. Livestock Genomics
Volume 14 - 2023 | https://doi.org/10.3389/fgene.2023.1118367
This article is part of the Research Topic Genetics of Reproduction for Livestock Species View all 6 articles
 Hao Wu1,2,3Qi Yi2Wenkui Ma1Laiqing Yan1Shengyu Guan1Likai Wang1
 Guang Yang2Xinxing Tan4Pengyun Ji1
 Guoshi Liu1,2*
Previous studies have reported that the endogenous melatonin level is positively associated with the quality and yield of milk of cows. In the current study, a total of 34,921 SNPs involving 1,177 genes were identified in dairy goats by using the whole genome resequencing bulked segregant analysis (BSA) analysis. These SNPs have been used to match the melatonin levels of the dairy goats. Among them, 3 SNPs has been identified to significantly correlate with melatonin levels. These 3 SNPs include CC genotype 147316, GG genotype 147379 and CC genotype 1389193 which all locate in the exon regions of ASMT and MT2 genes. Dairy goats with these SNPs have approximately 5-fold-higher melatonin levels in milk and serum than the average melatonin level detected in the current goat population. If the melatonin level impacts the milk production in goats as in cows, the results strongly suggest that these 3 SNPs can serve as the molecular markers to select the goats having the improved milk quality and yield. This is a goal of our future study.
Dairy sheep and goat account for about 21% of all sheep species and most of them are distributed in subtropical areas of Asia, Europe, and Africa (Pulina et al., 2018). The goat milk is used to make a variety of dairy products including butter, ice cream, cheese, buttermilk, yogurt, flavored milk and they are the popular human diet (Nayik et al., 2021). Goat milk characterizes with relatively higher milk fat than cow milk and it is nutritional value is very similar to human milk; therefore, it is considered importance for human health including prevention of cardiovascular diseases, cancer, allergies, and microorganism infection (García et al., 2014; Clark and Mora Garcia, 2017). As a result, many countries are expanding their dairy goat industry. It was estimated that the global production of goat milk was around 18.7 million tons in 2017, an increase of 16% compared to the 2007 (Miller and Lu, 2019). In addition, more and more modern technologies of molecular biology have been used to increase the dairy goat breeding and improve the milk quality as well as the yield. In the previous study, we have found that melatonin supplementation significantly reduces the milk somatic cell number and increases the milk protein and fat contents in cows (Wu et al., 2021). This observation makes us to think whether the enhanced endogenous melatonin production also has the similar result.
Melatonin was believed to be mainly produced by the pineal gland in vertebrates (Amaral and Cipolla-Neto, 2018). Currently, melatonin has been identified to be synthesized in other tissues and organs. These include gastrointestinal tract, brain, liver, kidney, adrenal gland, heart, thymus, gonad, placenta and uterus (Acuna-Castroviejo et al., 2014). Melatonin is produced in the mitochondria and thus, virtually, all cells having mitochondria can synthesize melatonin (Reiter et al., 2017). Melatonin is a potent antioxidant, anti-inflammatory and immunoregulatory molecule. It also participates in the regulatory activities in central nerve, immune, respiratory, digestive and urinary systems (Singh and Jadhav, 2014). In mammals, melatonin synthesis is under the control of gene expression of both aralkylamine N-acetyltransferase (AANAT) and acetylserotonin O-methyltransferase (ASMT) which are the rate-limiting enzymes for melatonin synthesis while some of its biological functions are mediated by its membrane receptors 1 and 2 (MT1 and MT2), respectively (Wang et al., 2014). Even though the melatonin synthetic pathway has been well documented, its fine regulatory mechanisms especially in the level of single nucleotide polymorphism (SNP), have not been extensively studied.
SNP mainly refers to DNA sequence polymorphism at the genome level, which is the most ideal marker for DNA inheritance and molecular breeding (Kruglyak, 1997). It can be used to establish a variety of analytic models to estimate the degree of heritable variation and phenotypes, thus, it can be used as the biomarker for biological breeding process (Tang et al., 2022). Yao et al. (2022) have found the key SNPs in genes of melatonin synthesis in Holstein dairy cows. Whether these similar SNPs existing in goats are unknown. Currently, the multiple SNP chips for dairy and cashmere goat are available, and the genome-wide analysis for some important traits of goats has been conducted by several researchers (Mucha et al., 2018; Jin et al., 2020). In addition, the SNP in the whole genome related to the selected traits in general populations can be quickly identified by the BSA method (Li et al., 2022). This method is widely used in molecular marker screening and quantitative trait locus (QTL) mapping analysis to target traits in plants and animals (Kurlovs et al., 2019; Li and Xu, 2022). BSA has been successfully used to analyze the F2 and F3 populations of the crossover between Wagyu and Qinchuan cattle and has identified four potential SNPs related to intramuscular fat traits (Zhu et al., 2021).
In this study, BSA method will be used to analyze the genotypes of individual dairy goats to match up their endogenous melatonin levels. The focus will be given to the SNP polymorphisms of AANAT/ASMT as well as MT1/MT2. Our purpose is to identify whether SNPs among these genes are associated with melatonin production in dairy goats. If this is the case, the SNPs can be used as molecular markers to select dairy goats with the naturally high melatonin production.
A total of 103 healthy, 18-month-old dairy goats in their peak lactation period were selected. 5 mL of blood were collected from subcutaneous vein at the neck, centrifuged for 8 min at 3,000 r/min, and serum was collected and stored at −20°C for future use. The breast was cleaned with wash, and 5 mL of milk sample was collected and stored at −20°C for future use.
Melatonin was dissolved in methanol (chromatographic grade) to make 1 mg/mL melatonin stock solution. The stock solution was successively diluted into 100, 50, 20, 10, and 5 ng/L to set up the melatonin test standard curve. 200 μL of blood or milk were mixed into 800 μL of cold methanol, vortexed for 30 min, centrifuged at 14,000 r/min at 4°C for 20 min. The supernatant was filtered with a filter size of 0.22 μm and stored in a brown sample bottle at −20°C for future use. Melatonin was detected using Liquid chromatography tandem mass spectrometry (LC-MS/MS) (Santa Clara, CA, United States) in the Central Laboratory of Beijing Institute of Animal Science, Chinese Academy of Sciences. The C18 column was used to separate the melatonin in the samples.
Goat blood DNA was extracted following the instructions of the manufacturer’s protocol (NEBNext® Ultra™ DNA Library Prep Kit for Illumina®). For each sample, 1 μg genomic DNA was randomly fragmented to <500 bp by sonication (Covaris S220). The fragments were treated with End Prep Enzyme Mix for end repairing, 5′ Phosphorylationand dA-tailing in one reaction, followed by aT-A ligation to add adaptors to both ends. Size selection of Adaptor-ligated DNA was then performed using AxyPrep Mag PCR Clean-up (Axygen) and fragments of ∼410 bp were recovered. Each sample was then amplified by PCR for eight cycles using P5 and P7 primers, with both primers carrying sequences which can anneal with flow cell to perform bridge PCR and P7 primer carrying a six-base index allowing for multiplexing. The PCR products were cleaned up using AxyPrep Mag PCR clean-up (Axygen), validated using an agilent 2,100 bioanalyzer (agilent technologies, PaloAlto, CA, United States) and quantified by Qubit2.0 fluorometer (invitrogen, carlsbad, CA, United States)
Then, libraries with different indexes were multiplexed and loaded on an Illumina HiSeq instrument according to manufacturer’s instructions (Illumina, San Diego, CA, United States). Sequencing was carried out using a 2 × 150 paired-end (PE) configuration; image analysis and base calling were conducted by the HiSeq Control Software (HCS) + OLB + GAPipeline-1.6 (Illumina) on the HiSeq instrument.
For the original image data of sequencing results, the software BCF2FASTQ (version 2.17.1.14) was used for Base calling and preliminary quality analysis to obtain the original Data of sequencing samples (PF), which is stored in FASTQ (FQ) file format. The data of Pair End sequencing consists of two FQ files, one storing read segment 1 (Read1) and the other storing read segment 2 (Read2). Cutadapt (version 1.9.1), the second-generation sequencing Data quality statistics software, was used to remove connectors and low-quality sequences from the original sequencing Data (Pass Filter Data) to obtain Clean Data for subsequent information analysis. Using Dragen Genome Pipeline, Clean data were aligned to the reference Genome sequence, and the resulting BAM (binary SAM file) was compared. Picard and GATK were used for PCR duplicate removal, local realignment, and base quality recalibration. The corrected genome alignment results were obtained. The coverage and coverage depth of the genome were calculated according to the comparison results.
Variant detection was performed using the Haplotype Caller module of the software GATK (version 4.0.4.0) based on the comparison results of Clean Reads in the reference genome. Filtering was performed using the Variant Filtration module with the filtering parameter: -filter expression “QD < 2.0 || MQ < 40.0 || FS > 60.0 || SOR >3.0 || MQ Rank Sum < −12.5 || Read Pos Rank Sum < −8.0.” ANNOVAR software was applied for functional annotation of the detected gene variants. The genotyping information of SNPs was extracted from the above comparison results and variant results. When the coverage depth of a sample for an SNP is <5X, the locus is treated as deletion, which is indicated as NA in the table; when the genotypic mutation frequency of a sample at an SNP is ≥ 0.8 or ≤0.2, the purity of locus is confirmed; if the mutation frequency is between 0.2–0.8 and each allele in the heterozygous genotype should be supported by at least four reads, the SNP is heterozygous mutation. Otherwise, the locus was treated as deletion and expressed as NA in the table; Finally, the genotype results of samples at all SNPs were summarized.
Euclidean Distance (ED) algorithm was used to find markers with significant differences between mixed pools and evaluate the regions associated with traits. The calculation formula of the ED method is as follows:
Note: Amut is the frequency of A base in the mutant pool, Awt is the frequency of A base in the wild-type pool. The Cmut is the frequency of the C base in the mutant pool, and Cwt is the frequency of the C base in the wild-type pool. Gmut is the frequency of the G base in the mutant pool, and Gwt is the frequency of the G base in the wild-type pool. Tmut is the frequency of the T base in the mutant pool, and Twt is the frequency of the T base in the wild-type pool.
In the process of ED analysis, the MMAPPR software package will process SNP as follows.
(1) Filter out SNP of non-secondary allele;
(2) If the frequency of A, T, C, and G in the wild-type mixing pool is greater than or equal to 95%, it will be filtered;
(3) SNPs with sequencing depth lower than 10X in wild-type or mutant pools were filtered.
In the study, the fourth power of the original ED was taken as the correlation value to achieve the function of eliminating background noise, and then local polynomial regression fitting was performed to obtain the fitting curve. Median+3SD of the fitted values of all sites was used as the association threshold for analysis. The associated region is determined based on the association threshold. Candidate SNPs were selected from the associated regions, namely, those with mutation frequency >0.75 and Euclidean distance >0.5. For the candidate SNPs, the annotation results of ANNOVAR were extracted.
The GO function of candidate genes was analyzed for significance enrichment. The candidate genes were mapped to each term of GO database (http://www.geneontology.org/) and the gene numbers of each term were calculated to obtain the list and the statistic number of a certain GO functional gene. Hypergeometric tests were then applied to find GO entries that were significantly enriched in genes compared to the whole genomic background.
KEGG enrichment analysis was carried out based on the hypergeometric distribution. After correction for multiple tests, pathways with Q value ≤ 0.05 were defined as those significantly enriched in candidate genes. The calculation formula is as follows:
Note: “N” is the number of genes with Pathway annotation in the whole genome; “n” is the number of candidate genes screened according to the selection signal index; “M” is the number of genes annotated as a specific Pathway among all genes; “m” is the number of candidate genes annotated for a specific Pathway.
PCR amplification was performed in the samples with primers and the results were shown in Table 1. Simply, the reaction mixture was comprised of Premix Taq (TaKaRa Taq Version 2.0 Plus Dye) 25 μL, genomic DNA (20 ng/μL) 1 μL, primer 1 (20 μm) 1 μL, primer 2 (20 μm) 1 μL and with the addition of sterilized water up to total 50 μL. The PCR procedure consisted of a pre-denaturation stage of 95°C for 5 min, 30 cycles of 94°C for 30 s, 60°C for 30 s, and 72°C for 10 s. The final extension period was 72°C for 5 min, followed by cooling to 4°C. PCR products were sent to Jin Weizhi Biotechnology Co., Ltd. for sequencing. Sequence results were compared with DNASTAR software (version 7.1), and SNPs were screened using SeqMan Pro software.
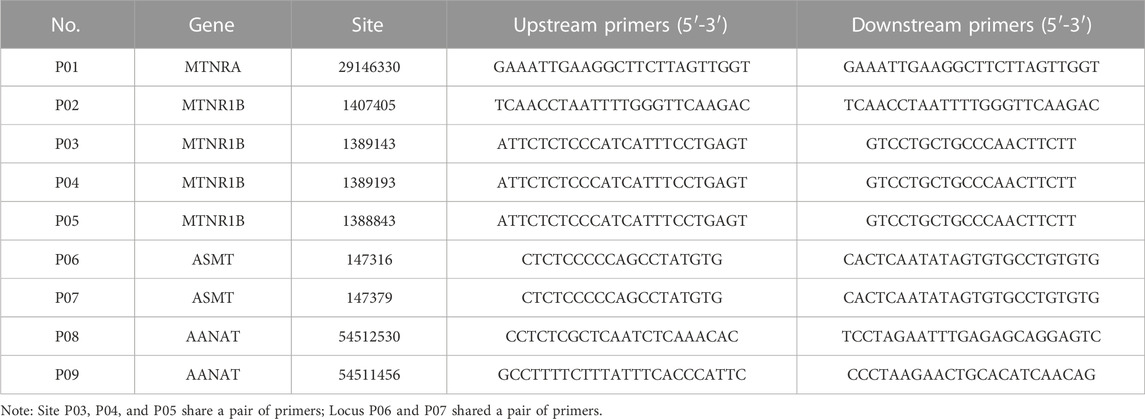
TABLE 1. Sequence list of validation primers.
Pearson correlation coefficient test between melatonin level and mutation sites was performed using SPSS 20.0 (IBM SPSS Statistics, Armonk, NY, United States) statistical software. p < 0.05 was considered statistically significant.
The distribution of different levels of melatonin in milk and blood samples of 103 dairy goats were shown in Supplementary Figure S1. The goats having melatonin level of 0–0.5 ng/mL in milk (34.95%, 36 goats) was classified as low melatonin group, goats having melatonin level excessive of 1 ng/mL (15.53%, 16 goats) was classified as high melatonin group. The same criteria was used to classify the blood melatonin levels in which, low melatonin group accounted for 44.66% (46 goats) and high melatonin group accounted for 30.10% (31 goats). In general, the dairy goats with melatonin level excessive 1 ng/mL was less than other groups. Based on the results, three dairy goats with the relatively high and three with the relatively low melatonin levels in their milk were selected for whole genome sequencing analysis. The detailed information on these dairy goats were listed in Table 2.
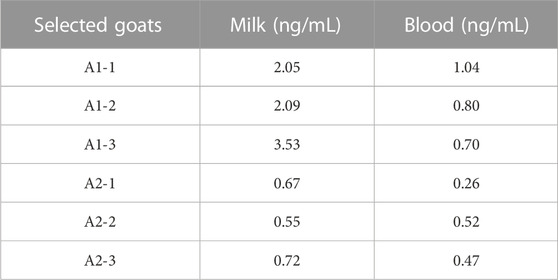
TABLE 2. The melatonin levels of selected goats for whole genome sequencing analysis.
Whole-genome resequencing was performed on blood samples of six goats, and the original Data (PF) was shown in Table 3. Clean Data was obtained by removing low-quality sequences from the original data, as shown in Table 4. The purity of Clean Data after QC excessed more than 99% in PF data, as shown in Table 5. The Clean Data was aligned with the reference Genome sequence by Dragen Genome Pipline and the ratio of alignment matched 99.64%. The number of unique RESDs in the reference Genome accounted for 80.77% of all the reference genomes in the alignment, as shown in Table 6. The average base Quality of Reads range from 35 to 37 Supplementary Figure S2. The average coverage reached 96.05% and the average coverage depth reached 28.32%, as shown in Supplementary Figure S3. The results indicated high quality of the original sequencing data and these data were suitable for subsequent related bioinformatics analysis.

TABLE 3. PF Data statistics.
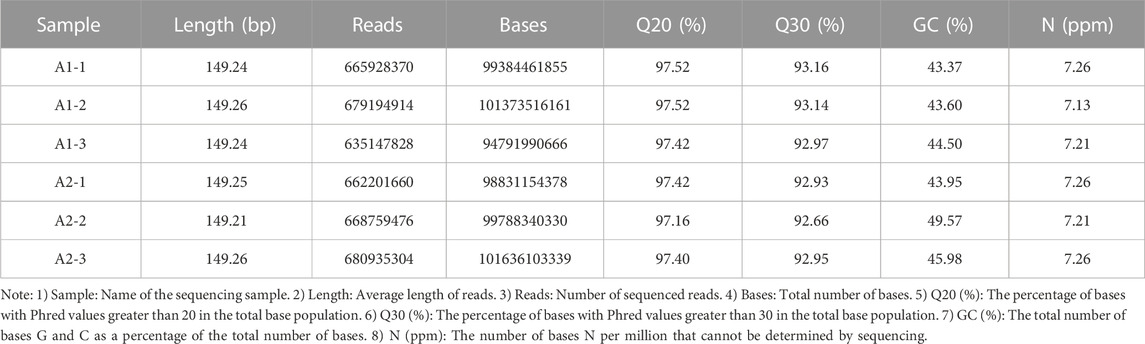
TABLE 4. Clean Data statistics.
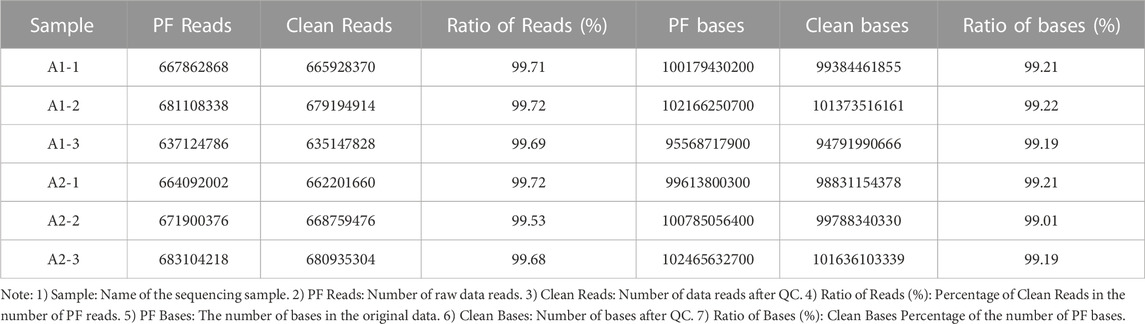
TABLE 5. Clean Data Ratio statistics.
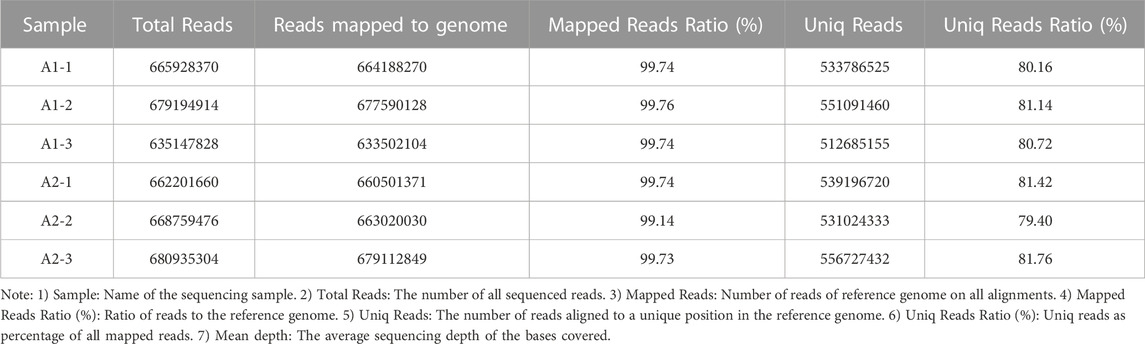
TABLE 6. Sequencing comparison statistics.
Based on the results from comparison, SNPs were detected by Dragen Genome Pipline. After identification of the functional changes caused by mutation sites, SNPs were divided into synonymous and non-synonymous mutations. The results showed that the proportion of non-synonymous mutations was higher than that of synonymous mutations (Table 7). Based on the base complementary pairing principle, SNPs mutation modes were divided into six categories and the focus was given to C:G > T:A and A:T > C:G, as shown in Supplementary Figure S4. The site deletion and mutation of each sample were calculated and the statistical results were shown in Table 8. After screening and filtering the SNPs in the samples, a total of 5,534,640 SNPs were obtained. The results showed that mutation sites were mainly located in the Intronic and ncRNA regions of the genome, and few were located in the UTR5 and UTR3 regions (Figure 1).
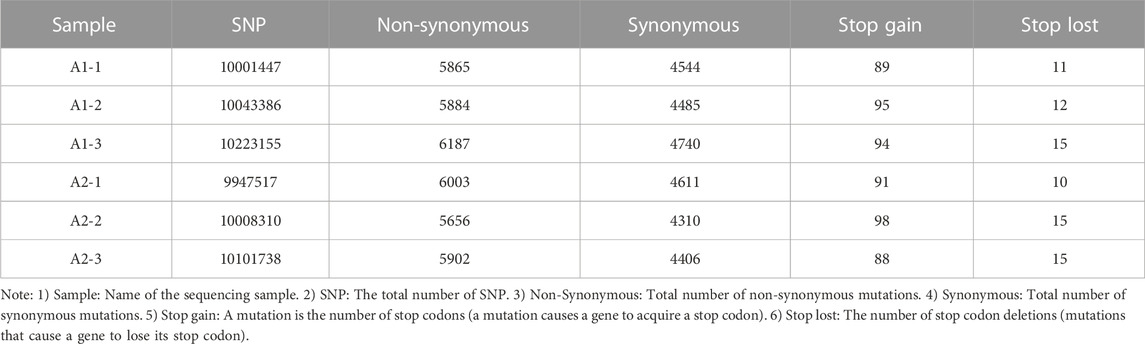
TABLE 7. Genome-wide SNP type statistics.
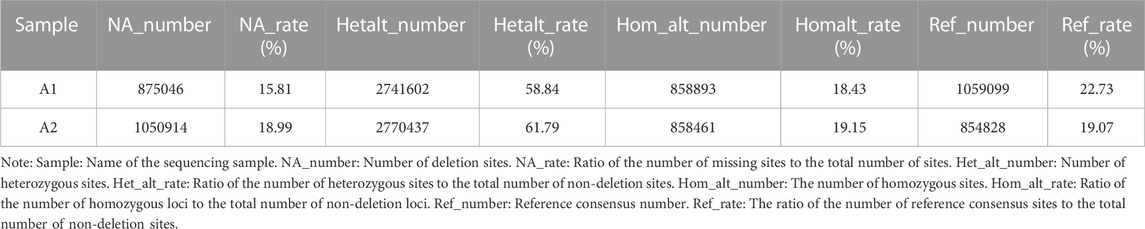
TABLE 8. Sample statistics.
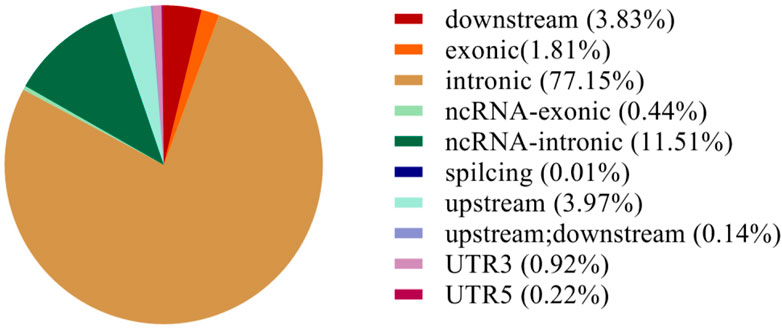
FIGURE 1. SNP annotation statistics.
Association analysis of 5,534,640 SNPs was performed using ED analysis and 2,740,786 SNPs were selected for further analysis (Table 9). The distribution of these SNPs on each chromosome is shown in Figure 2. The association threshold was set up as Median +3SD of all selected sites and the calculated median+3SD value was 0.2086. Based on the association threshold, a total of 1,095 regions with a total length of 34,387,035 bp were obtained, as shown in Supplementary Table S1. Candidate SNPs were selected from the associated regions with mutation frequency >0.75 and Euclidean distance >0.5. A total of 34,921 SNPs were identified, ANNOVAR annotation analysis showed that these selected candidate SNPs involved in 1,177 genes.
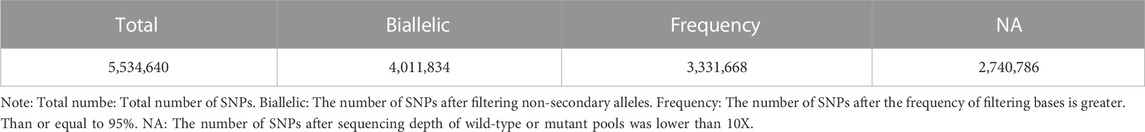
TABLE 9. SNP site filtering statistics.
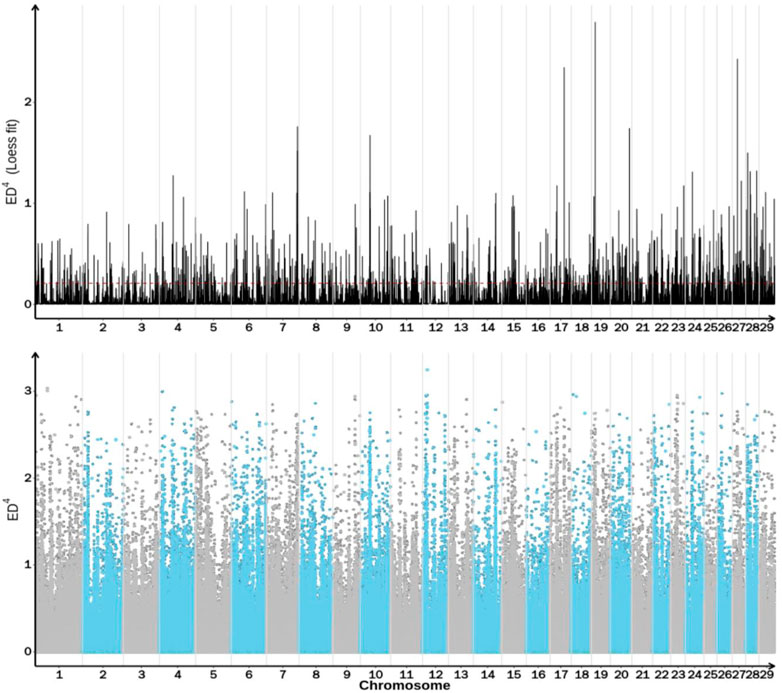
FIGURE 2. Distribution of ED association values across the genome.
The abscissa is the chromosome name, and the dot plot represents the ED value of each SNP locus. The line graph shows the ED value after fitting. The higher the ED value, the better the correlation effect of the point, and the blue shadow represents the interval to be located.
After annotation for the GO function of candidate genes, it was found that these genes were enriched into Molecular Function, Cellular Component and Biological Process, respectively, as shown in Figure 3. A total of 10 terms enriched to Molecular Function and 328 genes enriched to Binging. A total of 9 terms were enriched to Cellular Component and 242 genes were enriched to Organelle.

FIGURE 3. GO functional classification statistics.
A total of 22 terms were enriched in Biological Process and 498 genes were enriched in cellular process. To identify significantly enriched GO items, the GO function of candidate genes was analyzed for significance enrichment with hypergeometric test. The results indicated that the anchoring junction was the most enriched differential genes in Cellular Component (Figure 4). In Molecular Function, only one gene was found in the TOP 20 pathways and the Rich Factor is 1 (Figure 5). Among them the lipid binding pathway represented the largest amount of all differentiated GO term. The pathway with the highest concentration of differential genes in Biological Process is the regulation of negative chemotaxis (Figure 6). Among them, biological adhesion pathway accounted for the largest percentage of the GO term in all differentiated genes.
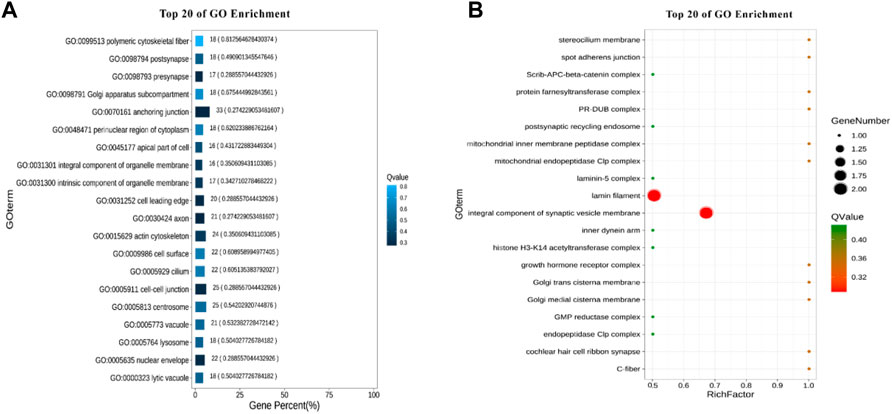
FIGURE 4. GO enrichment results of cellular component (A) Enrichment bar chart. Note: The ordinate is GO term and the abscissa is the percentage of all differences accounted for by this GO term. From the largest to the smallest, the top 20 are selected. The darker the color, the smaller the Q value. The number of GO term and Q value are labeled above. (B) Bubble chart. Note: The ordinate is GO term, and the abscissa is enrichment factor (the number of differences in the GO term divided by all the numbers). From the largest to the smallest, the top 20 are selected. Size of bubble area: the number of genes belonging to this GO in the target gene set; Bubble color: enrichment significance, that is, the size of Q value; The size is the quantity, and the redder the color, the smaller the Q.
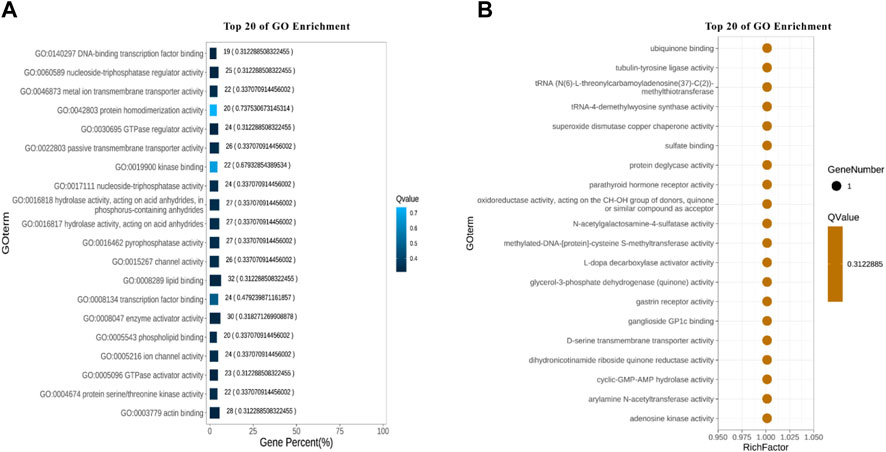
FIGURE 5. Molecular functional GO enrichment results (A) Enrichment bar chart. (B) Bubble chart.
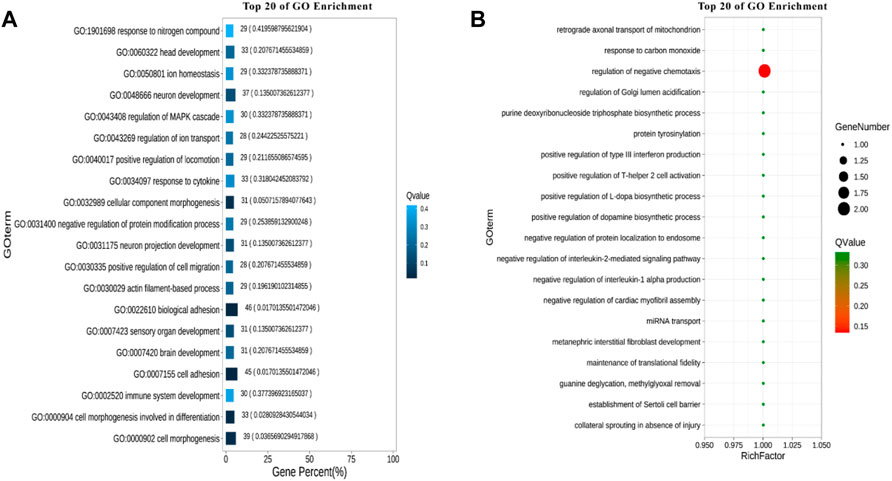
FIGURE 6. GO enrichment results of biological processes. (A) Enrichment bar chart. (B) Bubble chart.
In organisms, different genes coordinate with each other to perform biological functions. For example, the different genes can share the same pathway to produce same effect. Pathway analysis is helpful to further understand the function of genes. Based on the principle of hypergeometric distribution, the genes of the whole genome were served as background genes, and the candidate genes were analyzed by KO, as shown in Figure 7. The pathways with the highest number of enriched genes are Pathways in cancer. The Pathways accounted for the largest percentage of all different pathways were Axon guidance.
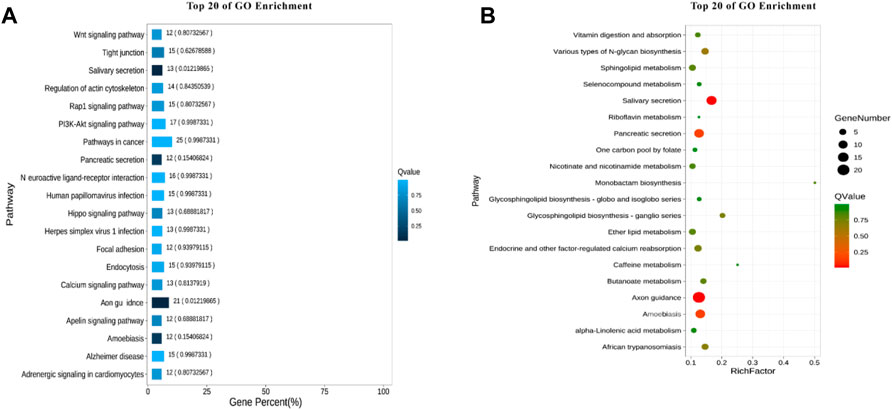
FIGURE 7. KEGG enrichment analysis. (A) Enrichment bar chart. (B) Bubble chart.
SNPs of AANAT/ASMT and MT1/MT2 exon mutations are shown in Table 10. The SNP markers are at position of 147316, 147379 and 1389193, respectively, as shown in Table 11. As shown in Figure 8, the dominant genotype of SNP markers at position of 147316 was GG with the proportion of 87%, while the other genotypes were CC (4%) and GC (9%). The dominant genotype of SNP at position of 147379 was CC with the proportion of 90%, and the other genotypes were GC (7%) and GG (3%). The dominant genotype of SNP marker at position of 1389193 was CT with the proportion of 51%, and the other genotypes were CC (15%) and TT (34%). The melatonin levels of genotype CC at position 147316, GG at position 147379 and CC at position 1389193 were all higher than the average melatonin level of 1.05 ng/mL, as shown in Table 12.
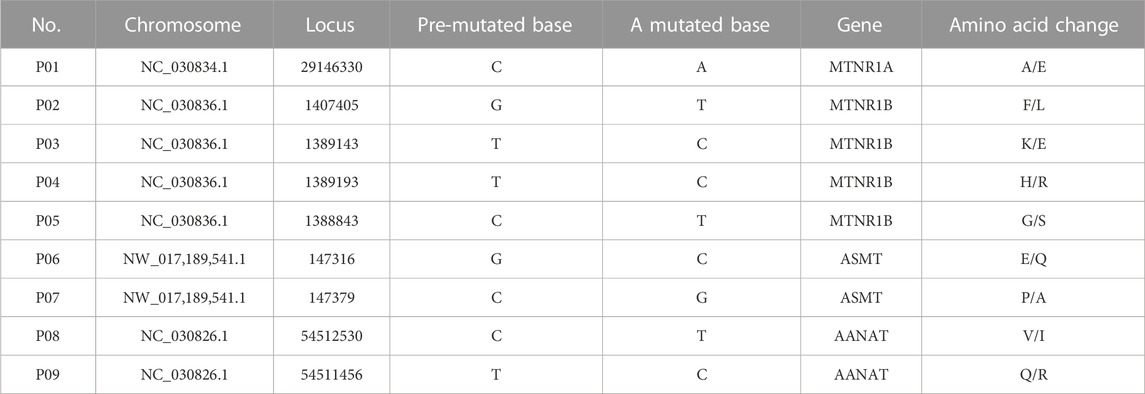
TABLE 10. Summary of non-synonymous mutations.
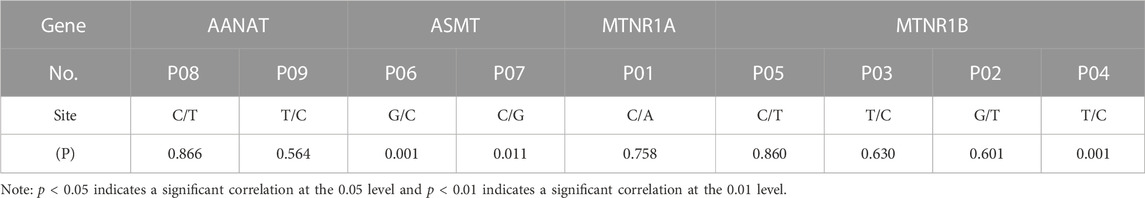
TABLE 11. Significance test for mutation sites.
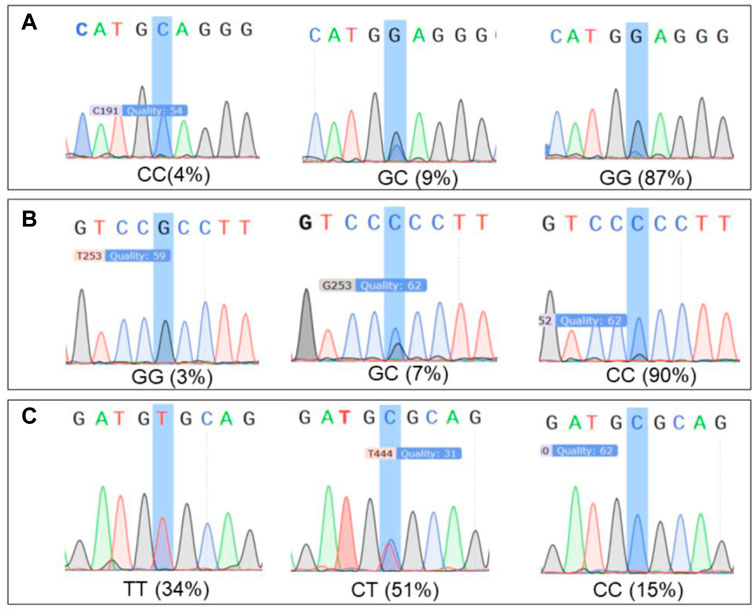
FIGURE 8. The proportion of significant locus genotypes. Note: (A) 147316 loci genotypes. (B) 147379 loci genotypes. (C) 1389193 loci genotypes.
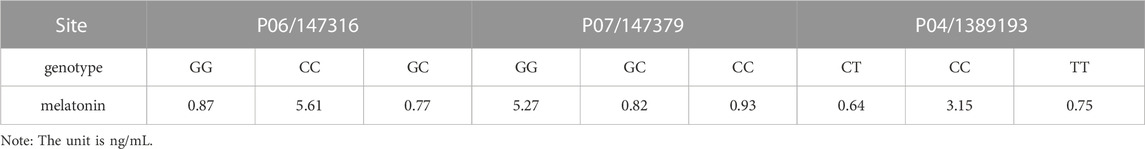
TABLE 12. Melatonin concentrations at significant loci genotypes.
Dairy products are important human non-staple food with high nutritional value (Lu and Miller, 2019). Among them, goat milk contains higher protein and fat contents than cow milk and its nutritional value is close to the human milk (Hodgkinson et al., 2018). Even though the numbers of dairy goats have been dramatically expended, it still cannot satisfy the global demanding for the goat milk and its dairy products. To increase production and quality of the goat milk, the first step is to cultivate the dairy goats with the best traits for milk production. To achieve this purpose, the breeding strategy is critical. The traditional breeding strategy is the crossover of the animal with the selected traits. But, for the last decade, the breeding has advanced to the technology of molecular biology (Lenstra et al., 2012). By use of the DNA marker and microarray technologies, the reference populations can be rapidly established with a large scale (Kraus et al., 2015). Compared with other farming animals, the modern technology for dairy goat breeding has lagged behind for a while, but currently, it has also been advanced into the era of microarray breeding (Gipson, 2019). By comparing the high and low fecundity of the dairy goats and sequencing their whole genes, Lai et al. have identified some candidate genes related to reproductive traits including non-synonymous exon SNPs in SETDB2 and CDH26 genes (Lai et al., 2016). In the previous study, we have found that the transgenic dairy goats with overexpression of AANAT and ASMT not only had the improved milk quality, but also had stronger anti-inflammatory ability than that of wild type (Tao et al., 2018; Wu et al., 2022). AANAT and ASMT are rate limiting enzymes for melatonin synthesis and their gene expressions and activities determine endogenous melatonin production. Melatonin is distributed in all cells, tissues and organ. It is synthesized in the mitochondria (He et al., 2016) and majority of its actions may also occur in the level of mitochondria (Reiter et al., 2018). It participates in a variety of biological functions. For example, melatonin regulates the reproductive action in vertebrates and has strong influence on biological rhythmicity of many organisms (Johnston and Skene, 2015; Talpur et al., 2018). Season, light and age all affect the level of melatonin in the body (Adamsson et al., 2017; Cardinali, 2021). Since the overexpression of AANAT and ASMT positively associates with milk production and quality of the goats, we believed that this beneficial effect is mediated by the increased endogenous melatonin production. Therefore, in the study, 103 dairy goats were included to measure their milk and serum melatonin levels. Among them, 6 goats (3 with highest and 3 with lowest melatonin levels) were selected for whole genome screening analysis and correlation analysis of key SNPs of AANAT and ASMT with melatonin level.
A total of 5,534,640 SNPs were obtained by preliminary screening and the mutations mainly occurred in the Intronic and ncRNA regions of the genome. Further ED association analysis was conducted on these SNPs and a total of 34,921 SNPs were selected, involving 1,177 genes. GO enrichment analysis showed that the lipid binding is one of the most significant pathways. The lipid binding pathway involves in genes set related to lipid structure, which is the main component of cell membrane and involves in signal transduction (Fahy et al., 2011). It is well known that melatonin is a small lipid soluble molecule and plays its biological function mainly through the membrane receptor MT1/MT2 (Liu et al., 2016). It appears that the high level of melatonin is required to upregulate the gene expression of this pathway (Dies et al., 2015) and the increased lipid metabolism is directly related to milk quality. In addition, KEGG enrichment analysis indicated that the melatonin also impacted the Axon guidance pathway which is important for signal transduction. The Axon guidance pathway and lipid binding pathway have much functional overlap (Negishi et al., 2005).
As mentioned above, melatonin synthesis depends on the expression and activities of AANAT and ASMT and its biological functions are mediated by MT1 and MT2 receptors. Therefore, we specifically analyzed the SNPs in the exon regions of these four genes (AANAT, ASMT, MT1 and MT2). Since alterations of SNPs in these genes will significantly affect the level of melatonin as well as its functions. Yao et al. (2022) have reported that 3 SNPs in AANAT and 4 SNPs in ASMT were significantly correlated with melatonin levels in blood and milk of Holstein cows. In this study, the similar results were observed in the dairy goats, nine non-synonymous loci located in exon regions of AANAT and ASMT. Pearson correlation coefficient test showed that three out of them were significantly correlated to melatonin production. To determine the genotype, the genotype information of the mutant sites of 103 dairy goats was analyzed. The results showed that the milk and serum melatonin concentrations in CC genotype 147316, GG genotype 147379 and CC genotype 1389193 were all significantly higher than the average melatonin level (1.05 ng/mL) of the tested goats in the study. The data strongly suggests that the mutations of these three SNPs would significantly affect the level of melatonin in dairy goats. As we know that the endogenous melatonin is positively associated with the milk quality and yield of Holstein cows. Elevated melatonin not only increases the protein and fat content but also reduce the somatic cell number of the milk. In addition, milk with high level of melatonin is suitable for elderly consumers for their sleep or other biological rhythmic regulation (Singh et al., 2011). Therefore, these three SNPs can serve as the molecular markers to selectively breed the dairy goats to improve quality and yield of milk. Especially the genotypes of CC 147316 and GG 147379 are the most favorable molecular markers since the dairy goats with these genotypes have five folds of higher melatonin level than the average value (1.05 ng/mL). Based on our best knowledge, this is the first study to identify the association between the SNPs of melatonin synthetic enzymes and endogenous melatonin level, as well as their potential link to the milk quality and yield in the dairy goats. The data strongly suggest that these SNPs can serve as the molecular markers to breed dairy goats with beneficial traits in the large scale.
Whole genome sequencing data of dairy goats have been successfully submitted to the National Center for Biotechnology Information. SRA data: PRJNA941958.
All treatment protocols involving experimental animals in this study were approved by the Animal Welfare Committee of China Agricultural University, and the approval protocol number is AW13012202-1-1.
HW conducted the experiments and prepared the original manuscript; WM, LY, XT, and LW contributed to the testing of sample collection; QY, GY, SG, and PJ contributed to the data analysis and management; QY and GL contributed in reviewing, and editing the manuscript. GL designed the experiment and supervised the project. All authors listed have made a substantial, direct, and in-tellectual contribution to the work. All authors have read and agreed to the published version of the manuscript.
The financial support of the Key Project of Hainan Province (ZDYF2021XDNY174), the Major Science and Technology Project of Inner Mongolia (2021ZD0023-1). Beijing Livestock Innovation Team (BAIC05-2023), Biological Breeding Project-Topic 4 (2022ZD0401404).
Author XT was employed by Inner Mongolia Grassland Hongbao Food Co., Ltd.
The remaining authors declare that the research was conducted in the absence of any commercial or financial relationships that could be construed as a potential conflict of interest.
All claims expressed in this article are solely those of the authors and do not necessarily represent those of their affiliated organizations, or those of the publisher, the editors and the reviewers. Any product that may be evaluated in this article, or claim that may be made by its manufacturer, is not guaranteed or endorsed by the publisher.
The Supplementary Material for this article can be found online at: https://www.frontiersin.org/articles/10.3389/fgene.2023.1118367/full#supplementary-material
SUPPLEMENTARY FIGURE S1 | Distribution of the phenotypes of dairy goats related to their melatonin levels in milk and blood.
SUPPLEMENTARY FIGURE S2 | Mean mass distribution of sequencing reads. Note: The abscissa is the average base Quality of Reads. The ordinate is the number of Reads in the sequencing data.
SUPPLEMENTARY FIGURE S3 | Sample depth distribution. Note: The abscissa is the coverage depth; The ordinate is the number of bases covered at the specified depth of coverage.
SUPPLEMENTARY FIGURE S4 | Cumulative distribution curve of SNP distances. Note: The abscissa is the number of SNP sites with different mutation types. The ordinate is the classification of six mutation types.
SUPPLEMENTARY TABLE S1 | Mutation area calculated based on median+3SD.
Acuna-Castroviejo, D., Escames, G., Venegas, C., Diaz-Casado, M. E., Lima-Cabello, E., Lopez, L. C., et al. (2014). Extrapineal melatonin: Sources, regulation, and potential functions. Cell Mol. Life Sci. 71, 2997–3025. doi:10.1007/s00018-014-1579-2
Adamsson, M., Laike, T., and Morita, T. (2017). Annual variation in daily light exposure and circadian change of melatonin and cortisol concentrations at a northern latitude with large seasonal differences in photoperiod length. J. Physiol. Anthropol. 36, 6–15. doi:10.1186/s40101-016-0103-9
Amaral, F. G. d., and Cipolla-Neto, J. (2018). A brief review about melatonin, a pineal hormone. Archives Endocrinol. metabolism 62, 472–479. doi:10.20945/2359-3997000000066
Cardinali, D. P. (2021). Melatonin and healthy aging. Vitam. Horm. 115, 67–88. doi:10.1016/bs.vh.2020.12.004
Clark, S., and Mora Garcia, M. B. (2017). A 100-Year Review: Advances in goat milk research. J. Dairy Sci. 100, 10026. doi:10.3168/jds.2017-13287
Dies, H., Cheung, B., Tang, J., and Rheinstadter, M. C. (2015). The organization of melatonin in lipid membranes. Biochim. Biophys. Acta 1848, 1032–1040. doi:10.1016/j.bbamem.2015.01.006
Fahy, E., Cotter, D., Sud, M., and Subramaniam, S. (2011). Lipid classification, structures and tools. Biochim. Biophys. Acta 1811, 637–647. doi:10.1016/j.bbalip.2011.06.009
García, V., Rovira, S., Boutoial, K., and López, M. (2014). Improvements in goat milk quality: A review. Small Ruminant Res. 121, 51. doi:10.1016/j.smallrumres.2013.12.034
Gipson, T. A. (2019). Recent advances in breeding and genetics for dairy goats. Asian-Australas J. Anim. Sci. 32, 1275–1283. doi:10.5713/ajas.19.0381
He, C., Wang, J., Zhang, Z., Yang, M., Li, Y., Tian, X., et al. (2016). Mitochondria synthesize melatonin to ameliorate its function and improve mice oocyte's quality under in vitro conditions. Int. J. Mol. Sci. 17, 939. doi:10.3390/ijms17060939
Hodgkinson, A. J., Wallace, O. A. M., Boggs, I., Broadhurst, M., and Prosser, C. G. (2018). Gastric digestion of cow and goat milk: Impact of infant and young child in vitro digestion conditions. Food Chem. 245, 275–281. doi:10.1016/j.foodchem.2017.10.028
Jin, M., Lu, J., Fei, X., Lu, Z., Quan, K., Liu, Y., et al. (2020). Genetic signatures of selection for cashmere traits in Chinese goats. Anim. (Basel) 10, 1905. doi:10.3390/ani10101905
Johnston, J. D., and Skene, D. J. (2015). 60 Years of Neuroendocrinology: Regulation of mammalian neuroendocrine physiology and rhythms by melatonin. J. Endocrinol. 226, T187–T198. doi:10.1530/JOE-15-0119
Kraus, R. H., Vonholdt, B., Cocchiararo, B., Harms, V., Bayerl, H., Kühn, R., et al. (2015). A single-nucleotide polymorphism-based approach for rapid and cost-effective genetic wolf monitoring in E urope based on noninvasively collected samples. Mol. Ecol. Resour. 15, 295–305. doi:10.1111/1755-0998.12307
Kruglyak, L. (1997). The use of a genetic map of biallelic markers in linkage studies. Nat. Genet. 17, 21–24. doi:10.1038/ng0997-21
Kurlovs, A. H., Snoeck, S., Kosterlitz, O., Van Leeuwen, T., and Clark, R. M. (2019). Trait mapping in diverse arthropods by bulked segregant analysis. Curr. Opin. Insect Sci. 36, 57–65. doi:10.1016/j.cois.2019.08.004
Lai, F. N., Zhai, H. L., Cheng, M., Ma, J. Y., Cheng, S. F., Ge, W., et al. (2016). Whole-genome scanning for the litter size trait associated genes and SNPs under selection in dairy goat (Capra hircus). Sci. Rep. 6, 38096. doi:10.1038/srep38096
Lenstra, J. A., Groeneveld, L. F., Eding, H., Kantanen, J., Williams, J. L., Taberlet, P., et al. (2012). Molecular tools and analytical approaches for the characterization of farm animal genetic diversity. Anim. Genet. 43, 483–502. doi:10.1111/j.1365-2052.2011.02309.x
Li, Z., Chen, X., Shi, S., Zhang, H., Wang, X., Chen, H., et al. (2022). DeepBSA: A deep-learning algorithm improves bulked segregant analysis for dissecting complex traits. Mol. Plant 15, 1418–1427. doi:10.1016/j.molp.2022.08.004
Li, Z., and Xu, Y. (2022). Bulk segregation analysis in the NGS era: A review of its teenage years. Plant J. 109, 1355–1374. doi:10.1111/tpj.15646
Liu, J., Clough, S. J., Hutchinson, A. J., Adamah-Biassi, E. B., Popovska-Gorevski, M., and Dubocovich, M. L. (2016). MT1 and MT2 melatonin receptors: A therapeutic perspective. Annu Rev. Pharmacol. Toxicol. 56, 361–383. doi:10.1146/annurev-pharmtox-010814-124742
Lu, C. D., and Miller, B. A. (2019). Current status, challenges and prospects for dairy goat production in the Americas. Asian-Australas J. Anim. Sci. 32, 1244–1255. doi:10.5713/ajas.19.0256
Miller, B. A., and Lu, C. D. (2019). Current status of global dairy goat production: An overview. Asian-Australas J. Anim. Sci. 32, 1219. doi:10.5713/ajas.19.0253
Mucha, S., Mrode, R., Coffey, M., Kizilaslan, M., Desire, S., and Conington, J. (2018). Genome-wide association study of conformation and milk yield in mixed-breed dairy goats. J. Dairy Sci. 101, 2213–2225. doi:10.3168/jds.2017-12919
Nayik, G. A., Jagdale, Y. D., Gaikwad, S. A., Devkatte, A. N., Dar, A. H., Dezmirean, D. S., et al. (2021). Recent insights into processing approaches and potential health benefits of goat milk and its products: A review. Front. Nutr. 8, 789117. doi:10.3389/fnut.2021.789117
Negishi, M., Oinuma, I., and Katoh, H. (2005). Plexins: Axon guidance and signal transduction. Cell Mol. Life Sci. 62, 1363–1371. doi:10.1007/s00018-005-5018-2
Pulina, G., Milan, M. J., Lavin, M. P., Theodoridis, A., Morin, E., Capote, J., et al. (2018). Invited review: Current production trends, farm structures, and economics of the dairy sheep and goat sectors. J. Dairy Sci. 101, 6715. doi:10.3168/jds.2017-14015
Reiter, R. J., Rosales-Corral, S., Tan, D. X., Jou, M. J., Galano, A., and Xu, B. (2017). Melatonin as a mitochondria-targeted antioxidant: One of evolution’s best ideas. Cell. Mol. life Sci. 74, 3863–3881. doi:10.1007/s00018-017-2609-7
Reiter, R. J., Tan, D. X., Rosales-Corral, S., Galano, A., Zhou, X. J., and Xu, B. (2018). Mitochondria: Central organelles for melatonin’s antioxidant and anti-aging actions. Molecules 23, 509. doi:10.3390/molecules23020509
Singh, M., and Jadhav, H. R. (2014). Melatonin: Functions and ligands. Drug Discov. Today 19, 1410–1418. doi:10.1016/j.drudis.2014.04.014
Singh, V., Sachan, N., and Verma, A. (2011). Melatonin milk; a milk of intrinsic health benefit: A review. Int. J. Dairy Sci. 6, 246–252. doi:10.3923/ijds.2011.246.252
Talpur, H. S., Chandio, I. B., Brohi, R. D., Worku, T., Rehman, Z., Bhattarai, D., et al. (2018). Research progress on the role of melatonin and its receptors in animal reproduction: A comprehensive review. Reprod. Domest. Anim. 53, 831–849. doi:10.1111/rda.13188
Tang, M., Wang, T., and Zhang, X. (2022). A review of SNP heritability estimation methods. Brief. Bioinform 23, bbac067. doi:10.1093/bib/bbac067
Tao, J., Yang, M., Wu, H., Ma, T., He, C., Chai, M., et al. (2018). Effects of AANAT overexpression on the inflammatory responses and autophagy activity in the cellular and transgenic animal levels. Autophagy 14, 1850–1869. doi:10.1080/15548627.2018.1490852
Wang, L., Zhao, Y., Reiter, R. J., He, C., Liu, G., Lei, Q., et al. (2014). Changes in melatonin levels in transgenic 'Micro-Tom' tomato overexpressing ovine AANAT and ovine HIOMT genes. J. Pineal Res. 56, 134–142. doi:10.1111/jpi.12105
Wu, H., Cui, X., Guan, S., Li, G., Yao, Y., Wu, H., et al. (2022). The improved milk quality and enhanced anti-inflammatory effect in acetylserotonin-O-methyltransferase (ASMT) overexpressed goats: An association with the elevated endogenous melatonin production. Molecules 27, 572. doi:10.3390/molecules27020572
Wu, H., Yao, S., Wang, T., Wang, J., Ren, K., Yang, H., et al. (2021). Effects of melatonin on dairy herd improvement (DHI) of Holstein cow with high SCS. Molecules 26, 834. doi:10.3390/molecules26040834
Yao, S., Liu, Y., Liu, X., and Liu, G. (2022). Effects of SNPs in AANAT and ASMT genes on milk and peripheral blood melatonin concentrations in Holstein cows (Bos taurus). Genes (Basel). 13, 1196. doi:10.3390/genes13071196
Keywords: dairy goat, melatonin, BSA analysis, AANAT, ASMT, SNP
Citation: Wu H, Yi Q, Ma W, Yan L, Guan S, Wang L, Yang G, Tan X, Ji P and Liu G (2023) Genome-wide analysis for the melatonin trait associated genes and SNPs in dairy goat (Capra hircus) as the molecular breeding markers. Front. Genet. 14:1118367. doi: 10.3389/fgene.2023.1118367
Received: 07 December 2022; Accepted: 28 February 2023;
Published: 20 March 2023.
Edited by:
Ramin Abdoli, Agricultural Research, Education and Extension Organization (AREEO), IranReviewed by:
Sonika Ahlawat, National Bureau of Animal Genetic Resources (NBAGR), IndiaCopyright © 2023 Wu, Yi, Ma, Yan, Guan, Wang, Yang, Tan, Ji and Liu. This is an open-access article distributed under the terms of the Creative Commons Attribution License (CC BY). The use, distribution or reproduction in other forums is permitted, provided the original author(s) and the copyright owner(s) are credited and that the original publication in this journal is cited, in accordance with accepted academic practice. No use, distribution or reproduction is permitted which does not comply with these terms.
*Correspondence: Guoshi Liu, Z3NobGl1QGNhdS5lZHUuY24=
Disclaimer: All claims expressed in this article are solely those of the authors and do not necessarily represent those of their affiliated organizations, or those of the publisher, the editors and the reviewers. Any product that may be evaluated in this article or claim that may be made by its manufacturer is not guaranteed or endorsed by the publisher.
Research integrity at Frontiers
Learn more about the work of our research integrity team to safeguard the quality of each article we publish.