 Yong Gu1,2†
 Zhengming Wang3,4†
 Rui Wang5Yunshang Yang1,2Peijian Tong5
 Shuaijie Lv5*
 Long Xiao1,2*
 Zhirong Wang1,2*
- 1Translational Medical Innovation Center, Zhangjiagang TCM Hospital Affiliated to Nanjing University of Chinese Medicine, Zhangjiagang, China
- 2Department of Orthopedics, Zhangjiagang TCM Hospital Affiliated to Nanjing University of Chinese Medicine, Zhangjiagang, China
- 3Shi’s Center of Orthopedics and Traumatology, Shuguang Hospital Affiliated to Shanghai University of Traditional Chinese Medicine, Shanghai, China
- 4Institute of Traumatology and Orthopedics, Shanghai Academy of Traditional Chinese Medicine, Shanghai, China
- 5The First Affiliated Hospital of Zhejiang Chinese Medical University, Zhejiang Provincial Hospital of Chinese Medicine, Hangzhou, China
Background: Osteoarthritis is a common chronic degenerative disease, and recently, an increasing number of studies have shown that immunity plays an important role in the progression of osteoarthritis, which is exacerbated by local inflammation. The role of N6-methyladenine (m6A) modification in immunity is being explored. However, the role of m6A modification in regulating the immune microenvironment of osteoarthritis remains unknown. In this study, we sought to discuss the association between the N6-methyladenine (m6A) modification and the immune microenvironment of osteoarthritis.
Methods: First, the data and gene expression profiles of 139 samples, including 33 healthy samples and 106 osteoarthritis samples, were obtained from the Genetics osteoARthritis and Progression (GARP) study. Then the differences in m6A regulators between healthy individuals and osteoarthritis patients were analyzed. The correlation between m6A regulators and immune characteristics was also investigated by single-sample gene set enrichment analysis (ssGSEA). Principal component analysis (PCA), Gene Set Variation Analysis (GSVA) enrichment analysis, weighted gene coexpression network analysis (WGCNA), and Associated R packages were used to identify the m6A phenotype and its biological functions.
Results: A total of 23 m6A regulators were involved in this study. We found a close correlation between most m6A regulators in all samples as well as in osteoarthritis samples. VIRMA and LRPPRC were the most highly correlated m6A regulators and showed a positive correlation, whereas VIRMA and RBM15B were the most negatively correlated. M6A regulators are associated with osteoarthritis immune characteristics. For example, MDSC cell abundance was strongly correlated with RBM15B and HNRNPC. Meanwhile, RBM15B and HNRNPC were important effectors of natural killer cell immune responses. IGFBP3 is an important regulator of cytolytic activity immune function. We performed an unsupervised consensus cluster analysis of the osteoarthritis samples based on the expression of 23 m6A regulators. Three different m6A subtypes of osteoarthritis were identified, including 27 samples in subtype C1, 21 samples in subtype C2, and 58 samples in subtype C3. Different m6A subtypes have unique biological pathways and play different roles in the immune microenvironment of osteoarthritis.
Conclusion: The m6A modification plays a crucial role in the diversity and complexity of the immune microenvironment in osteoarthritis.
1 Introduction
Osteoarthritis (OA) is a common chronic degenerative disease that is characterized by joint pain, swelling, and limited activity, resulting in decreased activity and dysfunction of elderly individuals (Abramoff and Caldera, 2020). Patients may endure severe pain with decreased joint mobility, resulting in rising healthcare system costs and decreased work productivity. It was thought in the past that OA is simply produced by mechanical wear and tear and that its mechanism was an imbalance in joint biomechanics (Vincent, 2013). Recently, OA has been understood to result from a complex interplay of local and systemic factors. An increasing number of studies have demonstrated that immune cell infiltration plays an important role in the progression of OA and that local inflammation further aggravates the disease process (Moradi et al., 2015; Rosshirt et al., 2019). The body’s natural wound healing response is manifested in osteoarthritic joints, and there is growing interest in how immunity influences disease initiation and progression (Daghestani and Kraus, 2015). Therefore, immunomodulation in osteoarthritis may be key to the new pathological mechanisms behind it and may shed some light on the discovery of novel immunotherapies for osteoarthritis.
Currently, an increasing number of studies are revealing a novel mode of inheritance, epigenetics, which is based on changes in the expression levels of genes caused by non-genetic sequence alterations (Harvey et al., 2018). Among them, as the third layer of epigenetics, more than 150 RNA modifications have been identified, including N1-methyladenosine (m1A), N6-methyladenine (m6A), 5-methylcytosine (m5C), and 7-methylguanosine (m7G). Notably, m6A is the most abundant form and has received substantial attention (Patil et al., 2016). It is a dynamic and reversible RNA modification that is involved in a wide range of biological and pathological processes, such as cancer progression and inflammation (Lan et al., 2019; Zong et al., 2019). m6A is the most common chemical modification of eukaryotic mRNA and is important in the regulation of mRNA stability, splicing, and translation (Cao et al., 2016). Its regulatory proteins include writers (METTL3, METTL14, WTAP, etc.), erasers (FTO, ALKBH5, etc.), and readers (YTHDF1, YTHDF2, YTHDF3, etc.) (Yang et al., 2018).
Recent studies have identified that m6A modification can regulate various aspects of immune function, including immune recognition, activation of innate and adaptive immune responses, and cell fate decisions (Shulman and Stern-Ginossar, 2020). Despite increasing evidence for the regulatory role of m6A in immune responses, current studies focusing on the role of m6A modification in the immune-related pathogenesis of osteoarthritis are still lacking. Existing studies have mainly focused on METTL3 and FTO (Liu et al., 2019; arc et al., 2012; Panoutsopoulou et al., 2014). The correlation between m6A regulators and osteoarthritis remains elusive and requires further exploration. In-depth investigation of immune dysregulation between normal samples and osteoarthritis samples as well as among the various subtypes of osteoarthritis and how m6A regulators act on these changes may shed light on osteoarthritis pathogenesis from a new perspective.
However, previous studies have been limited to a few m6A regulators due to technical limitations. In this study, we systematically evaluated the modification patterns of m6A regulators in osteoarthritis, which furthers our understanding of the immune microenvironment in osteoarthritis. We found that the classification model based on m6A regulators could distinguish osteoarthritis samples from healthy samples. There was a high degree of coordination and correlation between m6A regulators and infiltrating immune cells, immune responses, and immune functions in osteoarthritis. We identified 3 distinct m6A-modified subtypes where different immune characteristics were observed, and we compared the biological functions of these subtypes. In addition, we studied 1175 m6A phenotype-related genes and their biological functions. In conclusion, the effect of m6A modification on the immune microenvironment of osteoarthritis cannot be ignored.
2 Materials and methods
2.1 Dataset sources and preprocessing
The data used in this study consisted of 139 samples, including 33 healthy samples and 106 osteoarthritis samples. These samples were obtained from 139 participants of the Genetics osteoARthritis and Progression (GARP) study, and gene expression profiles were extracted from peripheral blood mononuclear cells (PBMCs) of these participants (The age and gender information are provided in Supplementary Table S1). The sample processing protocol and RNA extraction method were well described in a previous study (Ramos et al., 2014). The dataset was deposited in the Gene Expression Omnibus (GEO) database with the accession number GSE48556. The R/Bioconductor package “GEOquery” (Davis & Meltzer, 2007) was used to extract the GEO dataset, which consisted of the gene expression matrix and clinical features. According to the annotation information of the GPL6947 platform, probe mapping was applied to genes. If multiple probes corresponded to one gene, the average value was taken, and probes corresponding to multiple genes were deleted. Matrix expression values were preprocessed by correction with the “normalizeBetweenArrays” function in the “limma” package (Ritchie et al., 2015).
2.2 Alteration analysis of m6A regulators between healthy individuals and osteoarthritis patients
These 23 m6A regulators involved in the study included 8 writers (METTL3, METTL14, METTL16, WTAP, VIRMA, ZC3H13, RBM15, and RBM15B), 2 erasers (FTO and ALKBH5), and 13 readers (YTHDC1, YTHDC2, YTHDF1, YTHDF2, YTHDF3, HNRNPC, FMR1, LRPPRC, HNRNPA2B1, IGFBP1, IGFBP2, IGFBP3, and RBMX). The expression relationships among the 23 m6A regulators were evaluated by Spearman correlation analysis in all samples and osteoarthritis samples. Then, we constructed a correlation network of these 23 m6A regulators. The expression differences of the 23 m6A regulators between healthy and osteoarthritis samples were compared by the Wilcoxon test. OA-related m6A regulators were determined by univariate logistic regression with a cutoff criterion of p-value <0.2. Least absolute shrinkage and selection operator (LASSO) regression was used for feature selection and dimension reduction. Multivariate logistic regression was used to develop a m6A regulator-associated osteoarthritis classification model and external data sets (Details are provided in Supplementary Table S2) were used for verification. Receiver operating characteristic (ROC) curve analysis was used to evaluate the discriminatory performance of the model signatures.
2.3 Correlation between m6A regulators and immune characteristics
Single-sample gene set enrichment analysis (ssGSEA) was used to estimate the abundance of specific infiltrating immune cells and the activity of specific immune responses and immune function. It defines an enrichment fraction to express the absolute degree of enrichment of a gene set in each sample (Shen et al., 2019). The immune cell gene set and the immune function gene set were derived from previous studies (Zhang et al., 2020a; Liang et al., 2020). The immune genes and immune response gene sets were obtained from the ImmPort database (http://www.immport.org) (Bhattacharya et al., 2014). The Wilcoxon test was used to compare the abundance of immune cells, immune response, and immune function enrichment scores between healthy and osteoarthritis samples. We analyzed the correlation between the expression of m6A regulators and the immune cell fraction, immune response activity, and immune function activity by the Spearman method.
2.4 Identification of distinct m6A modification patterns by unsupervised clustering
The ConsensusClusterPlus package was applied to classify disease samples into distinct subtypes based on the expression of 23 m6A regulators (Wilkerson and Hayes, 2010). This is an unsupervised clustering analysis method. The Euclidean distance was utilized to calculate the similarity distance between samples, and the K-means algorithm was used to evaluate cluster numbers and robustness (Hartigan and Wong, 2013). The maximum cluster number was set to be 9. Eighty percent of the samples were sampled by the resampling scheme, and resampling was conducted 1000 times. The final cluster number was determined by the consensus matrix and the cluster consensus score (>0.8). Principal component analysis (PCA) was used to further verify the distinct modification patterns of 23 m6A regulators.
2.5 Immune characteristics and biological enrichment analysis of distinct m6A modification subtypes
We compared the differences in the immune cell fraction, immune response activity, and immune function activity among the m6A subtypes by the Kruskal test. To investigate the differences in biological functions and processes between m6A modification patterns, Gene Set Variation Analysis (GSVA) enrichment analysis was applied by the “GSVA” package. GSVA, known as gene set variant analysis, is a non-parametric unsupervised analysis method that transforms the expression matrix of genes across different samples into a pathway activation score matrix and evaluates whether different biological pathways are enriched across samples (Hanzelmann et al., 2013). The HALLMARKS pathway and KEGG pathway are two commonly used pathway gene sets. From the MSigDB database (http://www.gsea-msigdb.org/gsea/msigdb), the “h.all.v7.4.symbols” and “c2.cp.kegg.v7.4.symbols” gene sets were downloaded for running the GSVA analysis. Pathway activation scores were compared between the two groups by the R package “limma”, and adjusted p-values less than 0.05 were considered statistically significant.
2.6 Identification of m6A phenotype-related genes
To identify genes mediated by m6A regulators, differentially expressed genes (DEGs) between distinct m6A phenotypes were analyzed by the empirical Bayesian method of the “limma” R package, and the cutoff criterion for screening DEGs were set as adjusted p-value <0.01. The biological functions of m6A phenotype-related genes were analyzed by GO and KEGG enrichment analysis using the R package “clusterProfiler” (Yu et al., 2012). WGCNA (weighted gene coexpression network analysis) was used to identify the modification pattern-related gene modules through the “WGCNA” package (Langfelder and Horvath, 2008).
3 Results
3.1 Landscape of m6A regulators between healthy and osteoarthritis samples
A total of 23 m6A regulators were involved in this study, including 8 writers, 13 readers, and 2 erasers. An overview of m6A regulators and their functions was given (Figure 1A). By analyzing the transcriptome matrix, we found a close correlation between most m6A regulators in all samples as well as in osteoarthritis samples (Figures 1B, D). This illustrated that these regulators influenced each other, and this correlation was approximately the same across all samples as well as across disease samples. Among them, VIRMA and LRPPRC were the most highly correlated m6A regulators expressed in all samples and osteoarthritis samples and showed a positive correlation, whereas VIRMA and RBM15B were the most negatively correlated (Figures 1C, E). These suggested that they function together. We constructed a correlation network of m6A regulators in osteoarthritis (Figure 1F), again verifying that they generally function as a group. Differential expression analysis identified 6 m6A regulators with altered expression. These factors with altered expression were distributed among the writers and readers, whereas the erasers did not change significantly, suggesting that they might not play an important role in osteoarthritis independently (Figure 1G).
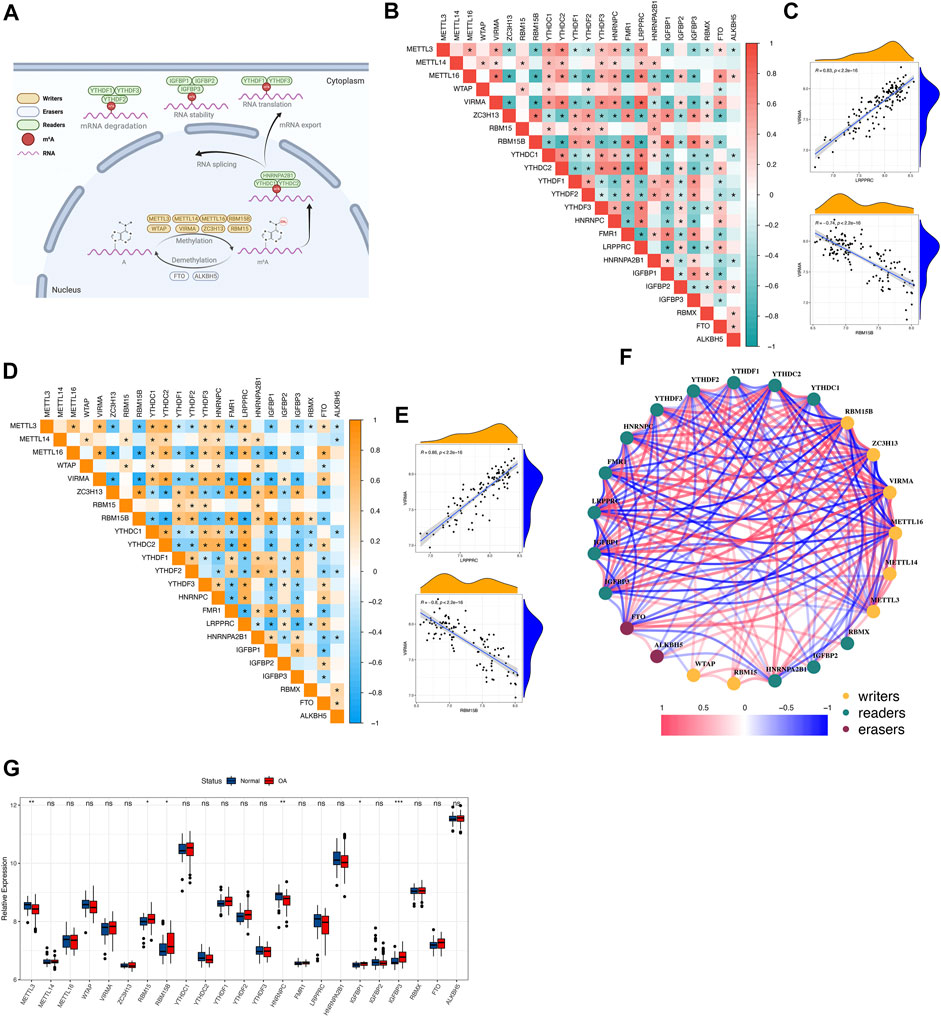
FIGURE 1. The landscape of m6A RNA methylation regulators in osteoarthritis (A) Overview of the dynamic reversible process of m6A RNA methylation modification regulated by “writers”, “erasers” and “readers” in osteoarthritis and their potential biological functions for RNA. (B,C) The correlation of the expression of 23 m6A regulators in all samples. Red indicates a positive correlation, and green indicates a negative correlation. Two scatter plots showed the two most relevant sets of m6A regulators: VIRMA and LRPPRC were the most positively correlated and VIRMA and RBM15B were the most negatively correlated. Above * means p < 0.05. (D,E) The correlation of the expression of 23 m6A regulators in osteoarthritis samples. Orange indicates a positive correlation, and blue indicates a negative correlation. Two scatter plots showed the two most relevant sets of m6A regulators: VIRMA and LRPPRC were the most positively correlated and VIRMA and RBM15B were the most negatively correlated. Above * means p < 0.05. (F) The regulatory network of 23 m6A regulators in osteoarthritis: red indicates a positive correlation, and blue indicates a negative correlation. (G,H) The boxplot and heatmap show the expression of 23 m6A regulators between healthy and osteoarthritis samples. Above * indicates p < 0.05, ** indicates p < 0.01, *** indicates p < 0.001, and ns indicates that the difference was not statistically significant.
3.2 m6A regulators contribute to the osteoarthritis process
We employed a series of statistical algorithms to explore the impact of m6A modification on osteoarthritis pathogenesis. We found that 12 m6A regulators were associated with osteoarthritis by univariate logistic regression (Figure 2A; see Supplementary Table S3 in the Supplementary Material). LASSO regression was performed on 12 m6A regulators for feature selection and dimensionality reduction to exclude non-significant regulators (Figures 2B, C). We found that all 12 m6A regulators were essential for osteoarthritis. When lambda with the minimum squared error (MSE) was employed, 12 variables were obtained, and 8 were obtained when the one-fold standard error (1-SE) was chosen. The ROC curve indicated the higher precision of the former 12 regulators in distinguishing disease from the normal group (AUC = 0.913) (Figure 2D). Multivariate logistic regression was performed to develop a categorical model to discriminate between normal and osteoarthritis samples (Figure 2E; see Supplementary Table S4 in the Supplementary Material). The model consisted of 6 m6A regulators and discriminated well between healthy and osteoarthritis samples based on predicted probability values, where the probability scores of osteoarthritis were significantly higher than those of healthy samples (Figure 2F). The ROC curve illustrated the excellent performance of the 6 m6A regulators in classifying health and osteoarthritis, indicating their diagnostic value for OA (Figure 2G). We found that our model based on the expression of 6 m6A regulators had excellent diagnostic performance in other data sets (Supplementary Figure S1).
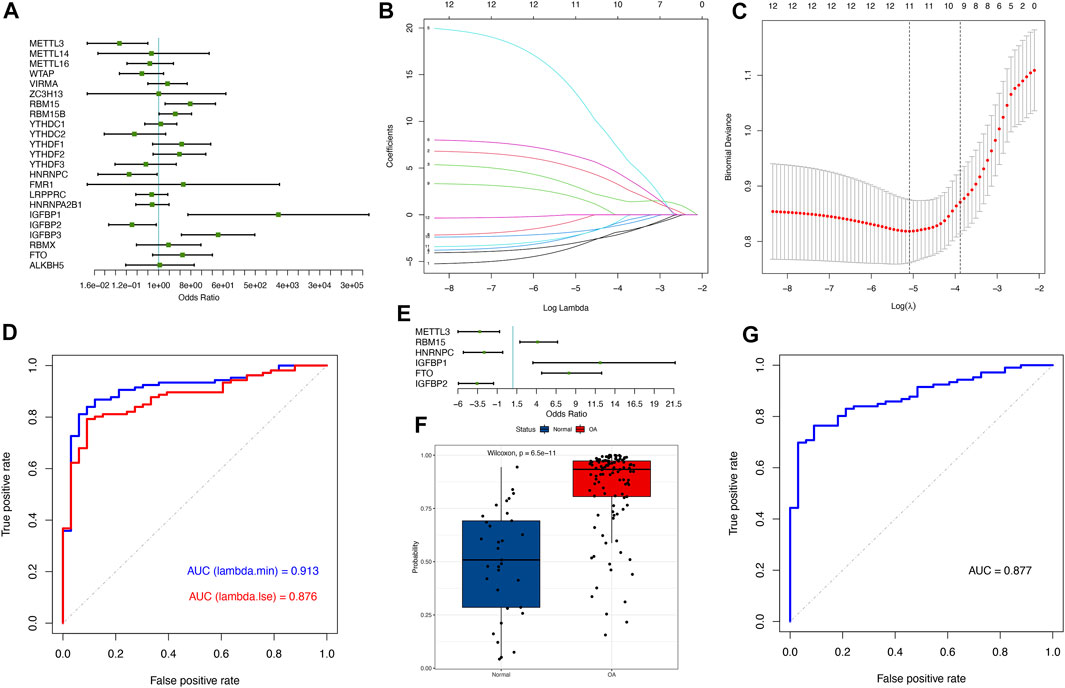
FIGURE 2. m6A regulators have profound effects on the osteoarthritis process. (A) Univariate logistic regression presenting the relationship between m6A regulators and osteoarthritis revealed 12 OA-related m6A regulators (p < 0.2). (B) LASSO coefficient distribution of 12 OA-associated m6A regulators. (C) Cross-validation for tuning parameter selection in the LASSO regression. For each λ value, around the mean of the target parameter shown by the red dot, we obtained the confidence interval of one target parameter. Two dashed lines indicate two special λ values: lambda. min was referred to in all λ values, the one giving the minimum target parametric mean, and lambda.1se refers to the one that gave the simplest model with a variance in the lambda. min λ value. (D) The ROC curve illustrated that the LASSO model, which includes 12 m6A regulators according to MSE, has better performance in distinguishing between normal and osteoarthritis samples than 1-SE, with an AUC value of 0.913. (E) Multivariate logistic regression presenting the relationship between m6A regulators and osteoarthritis revealed 6 osteoarthritis-related m6A regulators (p < 0.05). (F) Boxplot showing the probability difference between normal and osteoarthritis samples, where osteoarthritis had a much higher probability score than normal samples. (G) The ROC curve depicting that the classification model based on 6 m6A regulators has good prediction performance.
3.3 m6A regulators are associated with osteoarthritis immune characteristics
To investigate the biological behaviors between m6A regulators and the immune microenvironment, we performed correlation analyses between m6A regulators and immune infiltration cells, immune responses, and immune functions. First, the results revealed differences in the abundance of 23 infiltrating immune cells between healthy and osteoarthritis samples (See Supplementary Figure S2 in the Supplementary Material for comprehensive image analysis). Some immune cells changed in osteoarthritis, such as myeloid-derived suppressor cells (MDSCs), T follicular helper cells, type 1 T helper cells and type 17 T helper cells, involving innate immunity and adaptive immunity. Correlation analysis identified that m6A regulators were closely associated with these immune cells (Figure 3A). For example, the MDSC cell abundance was positively correlated with RBM15B and negatively correlated with HNRNPC (Figures 3B, C). This showed that infiltrating MDSCs were increased in osteoarthritis, which was closely related to the expression of RBM15B and HNRNPC. Similarly, we analyzed the immune response in osteoarthritis. The differences in the activity of each immunoreaction gene set between the healthy and osteoarthritis samples are presented (See Supplementary Figure S3 in the Supplementary Material for comprehensive image analysis). Several immune responses were increased in osteoarthritis, such as natural killer cell activity and TNF family members receptors. Natural killer cell activity was positively correlated with RBM15B, but it was negatively correlated with HNRNPC (Figures 3D, F). This suggested that RBM15B and HNRNPC played important roles in the natural killer cell response of osteoarthritis. We observed that RBM15B had a positive regulatory effect on multiple immune responses, while HNRNPC showed a negative regulatory effect. We also investigated the active state of immune function, in which half of the immune functions were altered in patients with osteoarthritis (See Supplementary Figure S4 in the Supplementary Material for comprehensive image analysis). For example, the check-point, cytolytic activity, and T-cell costimulation scores were higher in osteoarthritis. We found that METTL16 and ZC3H13 were positively and negatively correlated with most immune functions, respectively (Figures 3E, G). Check-point-METTL16 was the most positively correlated pair, and the most negatively correlated pair was APC costimulation-ZC3H13 (Figure 3G). However, for dysregulated m6A regulators, pairs with a stronger positive correlation were cytolytic activity-IGFBP3, whereas a negative correlation was with check-point-IGFBP1 (Figure 3G).
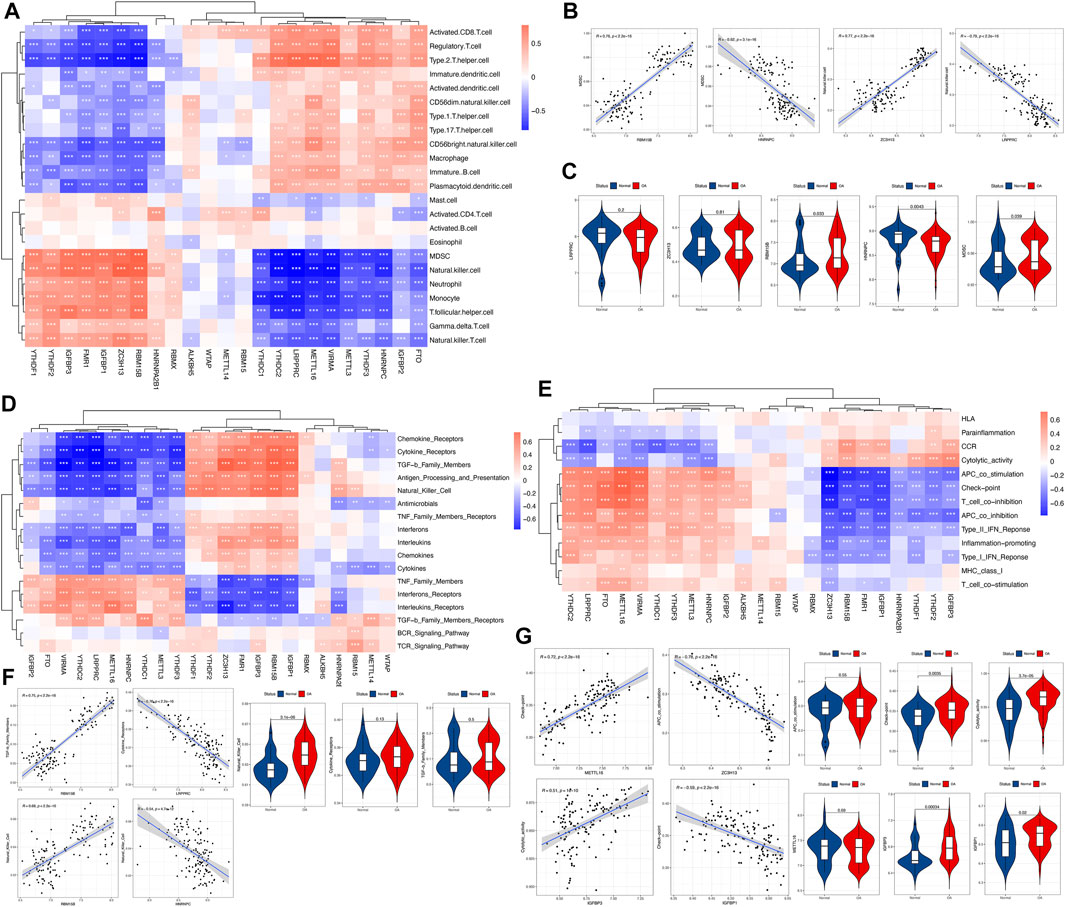
FIGURE 3. Correlations between the immune cell infiltration fraction, immune response gene sets, immune function gene sets, and m6A regulators. (A) Heatmap demonstrating the correlations between each immune infiltration cell type and each m6A regulator. Red indicates a positive correlation, and blue indicates a negative correlation. (B,C) Scatterplot demonstrating the correlations between the dysregulated immune cell fraction and the m6A regulator. The fraction or expression status is presented as a violin plot, indicating that there were more MDSCs, higher expression of RBM15B, and lower expression of HNRNPC in osteoarthritis. (D,F) Heatmap demonstrating the correlations between each immune response gene set and each m6A regulator. For dysregulated m6A regulators, the most positively correlated pair was natural killer cell-RBM15B, and the most negatively correlated pair was natural killer cell-HNRNPC. There was a more active natural killer cell reaction in osteoarthritis, as presented by the violin plot. (E,G) Heatmap demonstrating the correlations between each immune function gene set and each m6A regulator. For dysregulated m6A regulators, pairs with a stronger positive correlation were cytolytic activity-IGFBP3, whereas a negative correlation was found for check-point-IGFBP1, and there were stronger check-point and cytolytic activity functions activated in osteoarthritis, as presented by the violin plot.
3.4 Patterns of m6A methylation modification mediated by 23 regulators in osteoarthritis
To investigate the m6A modification patterns in osteoarthritis, we performed an unsupervised consensus cluster analysis of the osteoarthritis samples based on the expression of 23 m6A regulators. Three different m6A subtypes of osteoarthritis were identified, including 27 samples in subtype C1, 21 samples in subtype C2, and 58 samples in subtype C3 (Figures 4A–C). The results of PCA confirmed that the 23 m6A regulators could discriminate the 3 subtypes well (Figure 4D). The 3 distinct modification patterns differed from the current osteoarthritis classification, with no significant differences in clinical features between the different modification patterns, such as sex and age (Figures 4E, F). Except for RBMX, all m6A regulators showed significant differences in their expression among the 3 m6A subtypes (Figure 4G). The 23 m6A regulators could still be divided into 3 parts according to their expression levels (Figure 4H), verifying the diversity of m6A modification patterns in osteoarthritis.

FIGURE 4. Identification of subtypes by unsupervised clustering based on the expression of 23 m6A regulators. (A) Consensus clustering cumulative distribution function (CDF) for k = 2–9. (B) Relative change in the area under the CDF curve for k = 2–9. (C) Heatmap of the consensus matrix for osteoarthritis samples. (D) PCA of the transcriptome profiles of 3 m6A subtypes, showing a remarkable difference in the transcriptome between different modification patterns. (E,F) Comparison of age and gender. The boxplot illustrated the association of age with the 3 subtypes. The bar plot illustrates the association of age with the 3 subtypes. Above ns means the difference was not statistically significant. (G) Expression differences of 23 m6A regulators among the 3 m6A subtypes. Above * indicates p < 0.05, ** indicates p < 0.01, *** indicates p < 0.001, **** indicates p < 0.0001, and ns indicates that the difference was not statistically significant. (H) Heatmap of the expression status of 23 m6A regulators in the 3 subtypes with unsupervised clustering.
3.5 Immune characteristics of 3 distinct m6A subtypes
To determine the differences in immune microenvironment features among these different m6A modification patterns, infiltrating immune cells, immune response gene sets, and immune function gene sets were assessed, and we found that the immune features were different among the three groups. The vast majority of the immune cells were distinct in the 3 patterns (Figure 5A). Subtype C3 had relatively higher infiltrating immune cells than subtypes C1 and C2, and the immune cell infiltration status of C1 was closer to that of C2. Subtype C3 had higher levels of activated CD8 T Cells, CD56bright natural killer cells, immune B Cells and macrophages, whereas monocytes, natural killer cells and MDSCs were enriched in subtype C2. A similar pattern in terms of immunoreactivity was observed, with more complex results. The immunoreactivity of subtype C3 differed from those of subtypes C1 and C2, with the status of C1 and C2 more similar, whereas the immunoreactivity of C2 was more active. For example, chemokines, cytokine receptor, and cytokines were more active in subtype C2, while interferon receptors and interleukins were more active in subtype C3, and TGF-b family members were much lower than in C1 and C2 (Figure 5B). Similar trends were also observed in the immune function scores (Figure 5C). The differences in terms of immune function were greater in subtype C3 than in C1 and C2. These results suggested that m6A modification of subtype C3 mediated a unique immune inflammatory response that was distinguished from subtypes C1 and C2, whereas subtypes C1 and C2 also mediated distinct immune responses. The above results once again demonstrated that m6A methylation modification had an important regulatory effect on the formation of different immune microenvironments in osteoarthritis.
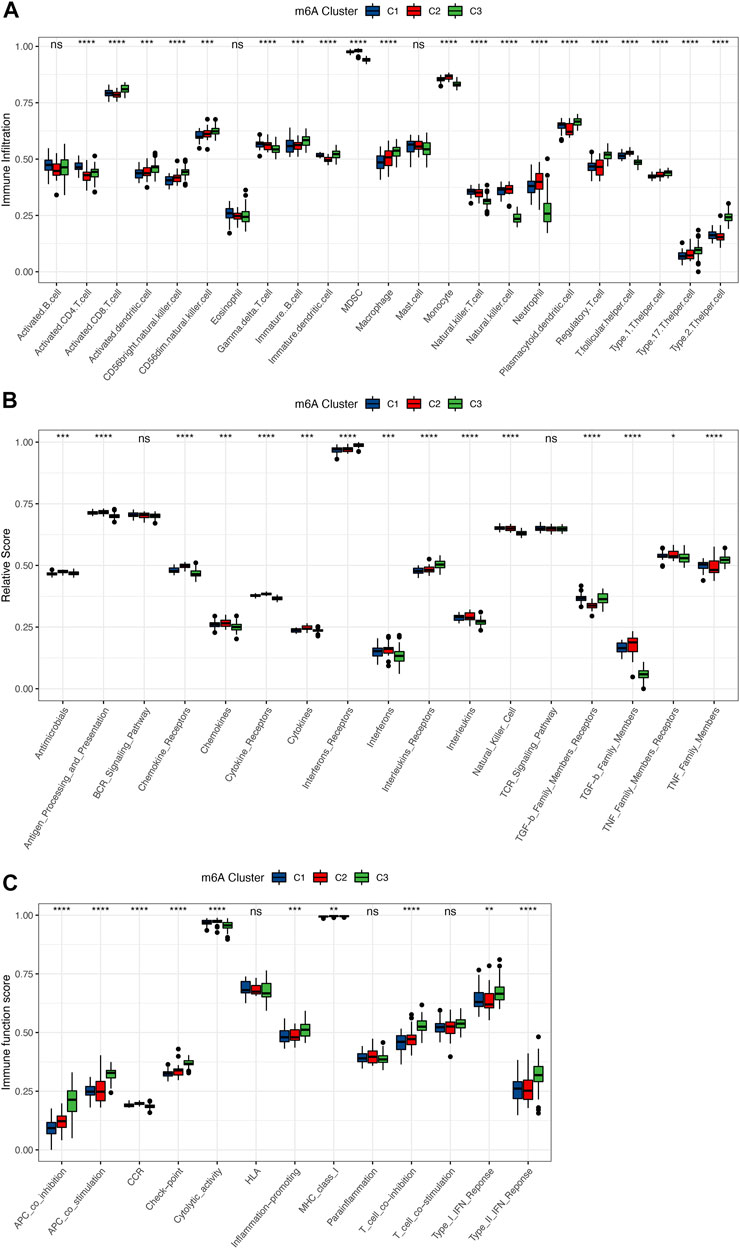
FIGURE 5. Immune microenvironment characteristics among 3 distinct m6A subtypes. (A) Differences in the abundance of each immune cell infiltration in 3 m6A subtypes. (B) Activity differences of each immune response gene set in 3 m6A subtypes. (C) Expression differences of each immune function gene set in 3 m6A subtypes. Above * indicates p < 0.05, ** indicates p < 0.01, *** indicates p < 0.001, **** indicates p < 0.0001, and ns indicates that the difference was not statistically significant.
3.6 Biological properties of the 3 m6A modification patterns
To investigate the biological responses in the 3 m6A subtypes, we compared KEGG pathways and HALLMARKS pathways between each of them and applied GSVA enrichment analysis to evaluate the activation status of biological pathways. Compared with subtypes C1 and C3, subtype C2 had more enriched pathways, such as the ECM receptor interaction, calcium signaling, cytokine to cytokine interaction receptor, and leukocyte transendothelial migration pathways (Figures 6A–D). Subtypes C1 and C3 had almost the same number of enriched pathways compared with each other (Figures 6E, F). To further understand the molecular mechanisms by which genes were involved in the regulation mediated by m6A regulators, we obtained differential gene intersections between m6A phenotypes to obtain phenotype-related genes. As a result, a total of 1175 m6A phenotype-related genes were obtained (Figure 7A), and GO enrichment analysis revealed that they were mainly involved in RNA splicing, nuclear transport, and regulation of mRNA metabolic processes (Figure 7B).
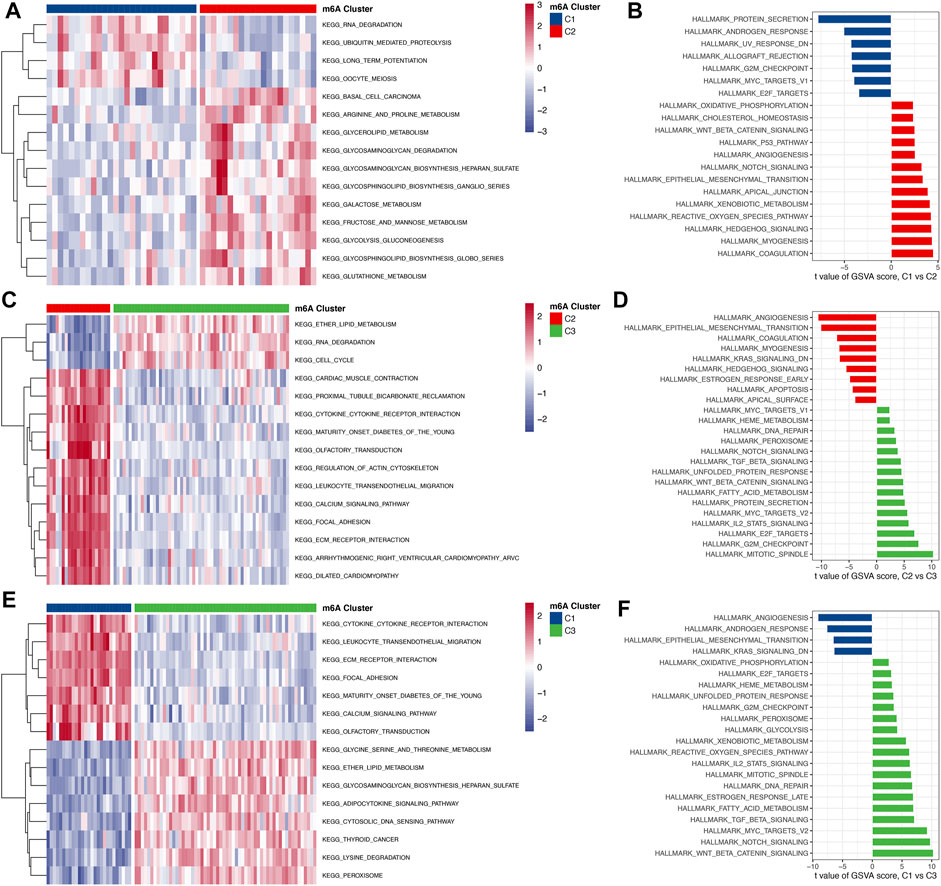
FIGURE 6. The biological function characteristics among the 3 m6A subtypes. (A,B) Differences in GSVA enrichment scores for the KEGG pathway and HALLMARK pathway between m6A cluster 1 and cluster 2 (A for the KEGG pathway and B for the HALLMARK pathway). (C,D) Differences in GSVA enrichment scores for the KEGG pathway and HALLMARK pathway between m6A cluster 2 and cluster 3 (A for the KEGG pathway and B for the HALLMARK pathway). (E,F) Differences in GSVA enrichment scores for the KEGG pathway and HALLMARK pathway between m6A cluster 1 and cluster 3 (A for the KEGG pathway and B for the HALLMARK pathway).
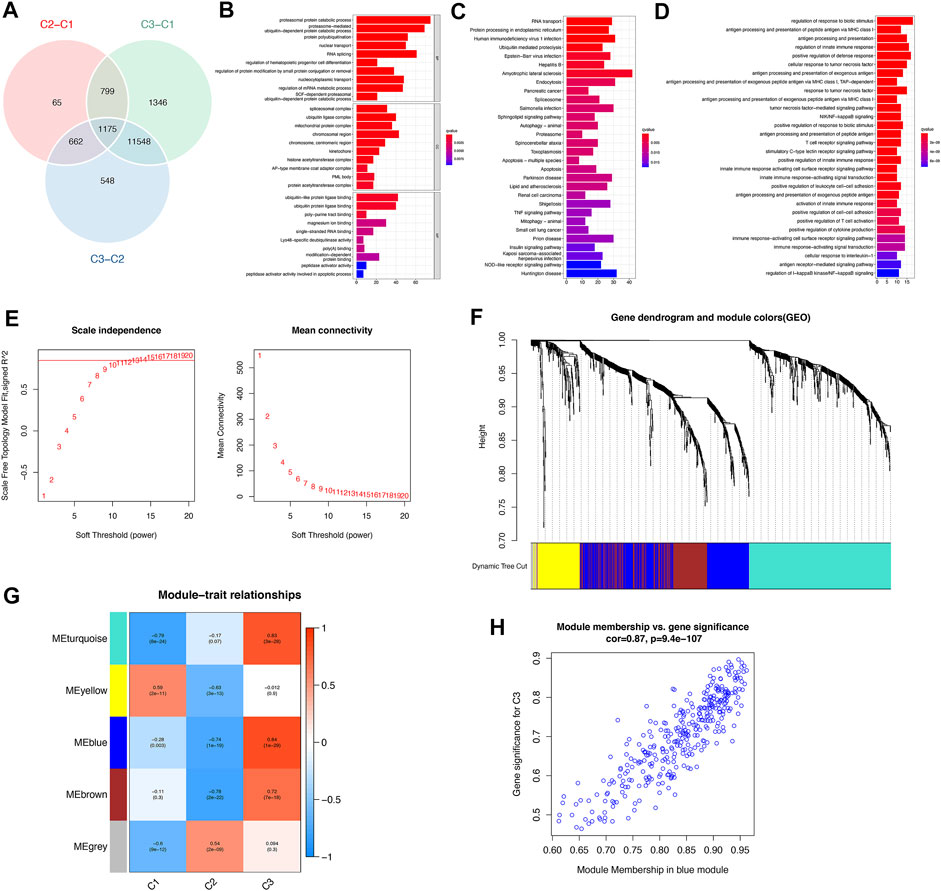
FIGURE 7. Identification and functional analysis of m6A phenotype-related genes in osteoarthritis. (A) Venn diagram of 1175 m6A phenotype-related genes. (B) GO enrichment analysis revealed the biological function characteristics of m6A phenotype-related genes. (C) KEGG enrichment analysis revealed the biological signaling pathways of m6A phenotype-related genes. (D) GO-BP enrichment results revealed the biological processes (BPs) of m6A modification-mediated immune genes. (E) Analysis of the scale-free topology model fit index and the mean connectivity for various soft-thresholding powers. (F) Gene dendrogram obtained by average linkage hierarchical clustering. The color row underneath the dendrogram shows the module assignment determined by the dynamic tree cut, in which 5 modules were identified. (G) Heatmap of the correlation between characteristic gene modules and 3 distinct m6A subtypes: red indicates a positive correlation, and blue indicates a negative correlation. (H) The scatterplot of gene significance for m6A subtype C3 vs. module membership in the blue module. The gene significance and module membership exhibited highly significant correlations, implying that the hub genes of the blue module also tended to be highly correlated with subtype C3.
KEGG enrichment analysis showed that signaling pathways mainly involved RNA transport, protein processing in the endoplasmic reticulum, the TNF signaling pathway, and the NOD−like receptor signaling pathway (Figure 7C). We extracted 57 immune genes from these m6A phenotype-related genes (See Supplementary Table S5 in the Supplementary Material), of which the enriched biological processes were remarkably related to the regulation of the response to biotic stimulus, regulation of the innate immune response, cellular response to tumor necrosis factor, and T Cell receptor signaling pathway (Figure 7D). We then constructed a comprehensive gene map associated with m6A modification patterns, and WGCNA identified gene-gene modules associated with distinct m6A subtypes (Figures 7E, F). Five gene modules were identified, and distinct modification patterns matched their related genes (Figure 7G; see Supplementary Table S6 in the Supplementary Material). For example, genes in the blue module were highly correlated with the m6A regulator modification pattern C2 (Figure 7H). These genes were highly correlated not only with their corresponding modules but also with their corresponding subtypes, further illustrating that genes deserve deep exploration. These results might elucidate the gene expression regulatory network mediated by m6A regulators.
4 Discussion
Osteoarthritis is a chronic degenerative disease with a complex pathological mechanism that has not been clarified thus far. The understanding of this process has gone beyond mechanical wear and tear, in which inflammatory processes and immune responses also exist (Woodell-May and Sommerfeld, 2020). Increasing evidence has confirmed the indispensable role of m6A modification in innate and adaptive immune responses (Zheng et al., 2017). To date, studies have been carried out to explore the role of m6A in immunity, especially in tumor microenvironment infiltrating cells (Han et al., 2019; Yang et al., 2019; Zhang et al., 2019). Therefore, we believe that similar results can be observed in the regulation of the immune microenvironment of osteoarthritis by m6A modification. In this study, we systematically investigated the modification pattern of m6A in the immune microenvironment of osteoarthritis. To clarify how m6A modification shapes the immune cell infiltration, immune response, immune function, and activation pathway of osteoarthritis, we conducted a series of analyses and obtained the following findings.
First, we found that compared with the normal samples, the expression of some m6A regulators was out of balance in osteoarthritis. At the same time, there was a close relationship between the 23 regulators. We constructed a regulatory network of m6A regulators, which indicates that m6A regulators interact with each other and participate in the development of osteoarthritis. We used a series of multiple statistical approaches to screen out the significant m6A regulators involved in osteoarthritis. The disease classification model based on these factors can distinguish healthy and osteoarthritis samples well, which confirms the important role of m6A regulators in osteoarthritis. METTL3, HNRNPC, and IGFBP1 may be the most important among the 23 m6A regulators, and they are of great significance in multivariate analysis. METTL3 has a functional role in mediating osteoarthritis progression by regulating NF-κB signaling and extracellular matrix (ECM) synthesis in chondrocytes (Liu et al., 2019). It has also been further confirmed that the expression of the m6A methylated gene METTL3 is decreased in osteoarthritis and may be involved in osteoarthritis by regulating inflammatory responses (Sang et al., 2021). In addition, studies have shown that in pathological conditions, increased concentrations of IGF-I in joint synovial fluid are accompanied by increased levels of IGFBP-1 and IGFBP-3 (Matsumoto et al., 1996). These results are consistent with our findings in peripheral blood. However, the changes in HNRNPC in osteoarthritis have still not been specifically reported.
Next, we explored the correlations between m6A regulators and immune characteristics in osteoarthritis, including scores for infiltrating immune cells, immune response, and immune function. We found that most m6A regulators were closely associated with these immune characteristics, implying an important role of m6A modification in the regulation of the osteoarthritis immune microenvironment. For example, MDSC abundance was strongly positively correlated with RBM15B and negatively correlated with HNRNPC. MDSCs can inhibit body immune cells to exert regular innate and adaptive immune functions. In the context of innate immunity, MDSCs downregulate the expression of NKG2D by membrane-bound TGF-β, which inhibits the function of NK cells (Li et al., 2009). MDSCs can also induce Treg expansion and promote the negative regulatory effect of Treg on immunity (Serafini et al., 2008). In terms of adaptive immunity, MDSCs can inhibit T Cell immune response responses and proliferation through multiple pathways (Rodríguez and Ochoa, 2008). Studies have found that MDSCs are significantly expanded in arthritic mice and RA patients. The transfer of MDSCs promotes disease progression, and proinflammatory MDSCs with the ability to drive Th17 cell differentiation may be a key pathogenic factor in autoimmune arthritis (Guo et al., 2016). RBM15B is reported to recruit this complex to certain mRNA and lncRNA XIST to promote m6A formation (Coker et al., 2020). HNRNPC plays a cancer-promoting role in adrenocortical carcinoma (ACC) progression, and experiments have demonstrated that HNRNPC promotes the proliferation, migration, and invasion of H295R and SW13 cells and influences the immune microenvironment (Xu et al., 2021). These findings may point to an immunoregulatory mechanism of m6A in osteoarthritis.
Third, unsupervised clustering of osteoarthritis samples based on the expression profiles of 23 m6A regulators identified 3 subtypes with unique m6A modification patterns, each with unique immune characteristics. Among them, subtype C3 had more infiltrating immune cells and more active immune functions than subtype C1 and subtype C2, and a portion of the immune response was more active in C3. We confirmed the reliability of phenotypic classification of different m6A alterations by contrasting immune properties across the subtypes. The inspiration for this approach stems from a recent high-quality study in which a team used this approach to identify 3 distinct novel m6A modification patterns in gastric cancer, gaining a deeper understanding of the tumor microenvironment (Zhang et al., 2020a). Identifying new molecular subtypes will not only unearth new pathogenesis but also enable the development of more precise treatment regimens. For osteoarthritis, Coutinho de Almeida R et al performed an unsupervised cluster analysis based on the top 1000 gene expressions deregulated in osteoarthritis, resulting in 2 distinct osteoarthritis subtypes possessing distinct cartilage pathophysiological processes as well as radiological features (Coutinho de Almeida et al., 2021). Thus, the 3 different m6A subtypes in osteoarthritis suggest that the m6A modification patterns present in peripheral blood can indeed be considered another pathobiology-based classification of osteoarthritis, which is related to the phenotypic features of the disease.
Finally, we identified m6A phenotype-associated genes and m6A modification subtype-associated gene modules. The expression regulation of these genes and gene sets is affected by m6A modification, and revealing their biological functions can help illustrate the pathogenesis of osteoarthritis from the perspective of m6A modification. Subtype C3 had more activation in the well-known TGF-β signaling pathway, while decreased NK cell infiltration was seen in subtype C3, and IGFBP1 was downregulated in subtype C3. These results may suggest that IGFBP1, the TGF-β signaling pathway, and NK cells are strongly implicated in osteoarthritis. The results of our study can give many of these similar correlations, and other researchers in the field will be directed to rapidly capture key m6A regulators and immune signatures in osteoarthritis. This is one of the most important scientific implications of our study.
Although there is no consensus on the immune characteristics of OA, more and more studies have shown that immune inflammation is closely related to the pain and pathological progress of OA in recent years (Zhang et al., 2020b; Miller et al., 2020; Woodell-May and Sommerfeld, 2020; Li et al., 2022). And immunoengineering is expected to become the next-generation of arthritis treatment method (Klimak et al., 2021). Our study is the first to systematically analyze the relationship between m6A modification and the immune microenvironment of osteoarthritis, and we are also the first team to introduce the latest m6A mechanisms in osteoarthritis. Through this study, we obtained a wealth of results that can open new directions for studying the immune-related pathogenesis of osteoarthritis from the perspective of m6A modification mechanisms. In addition, we confirmed that m6A modification is involved in the regulation of the immune microenvironment in osteoarthritis. Current correlative studies of m6A regulators in the osteoarthritis field are tenuous, and thus, this osteoarthritis research was seminal. We combined the latest m6A modification and immune microenvironment theory to unravel osteoarthritis pathogenesis, largely complementing the gap in osteoarthritis regarding epigenetic modifications, particularly m6A modification. This study will motivate more researchers to carry out m6A-related research in the field of osteoarthritis, and the numerous results of this research can provide a better direction for them.
However, the study has some drawbacks. Firstly, this study was based on bioinformatics analysis, and many of the results were valid in theory, but their accuracy needs to be verified experimentally. Immune cell fraction were calculated by using currently accepted methods, but single-cell sequencing is still required to obtain the most accurate immune cell count. Secondly, some clinical characteristics were not available, such as Osteoarthritis Research Society International (OARSI) score, visual analog scale (VAS) score, joint range of motion and radiographic staging. All these made it difficult to reveal the correlation between clinical severity or outcome and the diversity of m6A modification patterns. We also could not perform the analyses that associate the m6A-mediated gene expression regulatory network with the progression of OA. In addition, because of the lack of clinical efficacy data, we failed to reflect the advantages of m6A patterns compared with current diagnosis methods and its help for follow-up treatment. We hope to obtain data in the future and analyze them from the perspective of multiomics to obtain more valuable results. Thirdly, it is worth noting that expression level of m6A regulators is not identical to m6A methylation level and clinical samples are required for methylation level detection. Fourthly, Many studies were limited to gene regulation mediated by m6A, but ignored the mechanism of regulating m6A precipitation (Yang et al., 2022). For example, aging and inflammation are not only pathogenic factors, but also the result of m6A dysfunction. Elucidating the complex regulatory mechanism of m6A is helpful for the targeted treatment of bone related diseases. Nevertheless, these results enhance the understanding of the novel pathogenesis and phenotypes of osteoarthritis and provide new ideas for promoting personalized immunotherapy in the future.
5 Conclusion
This study reveals a potential regulatory mechanism of m6A methylation modification in the immune microenvironment of osteoarthritis. The diversity of m6A modification patterns is a factor contributing to the heterogeneity and complexity of the osteoarthritis immune microenvironment that cannot be ignored. Comprehensive analysis of m6A modification patterns in osteoarthritis allows us to gain a deeper understanding of the underlying mechanisms of osteoarthritis immune regulatory networks and guide more effective precision therapies.
Data availability statement
The original contributions presented in the study are included in the article/Supplementary Material, further inquiries can be directed to the corresponding authors.
Author contributions
YG, LX, and YSY established the concept of this study. YG, ZMW, and PJT performed the literature research, data extraction, statistical analysis, and drafting paper. RW and LX revised this paper. LX, ZRW, and SJL contributed to the review of the paper and supervision of the whole study. YG and ZMW contributed equally to this work. All authors have read and approved the manuscript.
Funding
This study was supported by the National Natural Science Foundation of China (82074473, and 82104892), Natural Science Foundation of Jiangsu province (BK20180001, BK20191201, and BE2020666), Project of Excellent Young Talents of Traditional Chinese Medicine of Zhejiang Province (2019ZQ016) and the “Zhejiang Medical and Health Science and Technology Young Talents Program (2019RC059)” from the Health Commission of Zhejiang Province.
Conflict of interest
The authors declare that the research was conducted in the absence of any commercial or financial relationships that could be construed as a potential conflict of interest.
Publisher’s note
All claims expressed in this article are solely those of the authors and do not necessarily represent those of their affiliated organizations, or those of the publisher, the editors and the reviewers. Any product that may be evaluated in this article, or claim that may be made by its manufacturer, is not guaranteed or endorsed by the publisher.
Supplementary material
The Supplementary Material for this article can be found online at: https://www.frontiersin.org/articles/10.3389/fgene.2023.1113515/full#supplementary-material
References
Abramoff, B., and Caldera, F. E. (2020). Osteoarthritis: Pathology, diagnosis, and treatment options. Med. Clin. North Am. 104, 293–311. doi:10.1016/j.mcna.2019.10.007
arc, O. C., arc, O. C., Zeggini, E., Panoutsopoulou, K., Southam, L., Rayner, N. W., et al. (2012). Identification of new susceptibility loci for osteoarthritis (arcOGEN): A genome-wide association study. Lancet 380, 815–823. doi:10.1016/S0140-6736(12)60681-3
Bhattacharya, S., Andorf, S., Gomes, L., Dunn, P., Schaefer, H., Pontius, J., et al. (2014). ImmPort: Disseminating data to the public for the future of immunology. Immunol. Res. 58, 234–239. doi:10.1007/s12026-014-8516-1
Cao, G., Li, H. B., Yin, Z., and Flavell, R. A. (2016). Recent advances in dynamic m6A RNA modification. Open Biol. 6, 160003. doi:10.1098/rsob.160003
Coker, H., Wei, G., Moindrot, B., Mohammed, S., Nesterova, T., and Brockdorff, N. (2020). The role of the Xist 5' m6A region and RBM15 in X chromosome inactivation. Wellcome Open Res. 5, 31. doi:10.12688/wellcomeopenres.15711.1
Coutinho de Almeida, R., Mahfouz, A., Mei, H., Houtman, E., den Hollander, W., Soul, J., et al. (2021). Identification and characterization of two consistent osteoarthritis subtypes by transcriptome and clinical data integration. Rheumatol. Oxf. 60, 1166–1175. doi:10.1093/rheumatology/keaa391
Daghestani, H. N., and Kraus, V. B. (2015). Inflammatory biomarkers in osteoarthritis. Osteoarthr. Cartil. 23, 1890–1896. doi:10.1016/j.joca.2015.02.009
Guo, C., Hu, F., Yi, H., Feng, Z., Li, C., Shi, L., et al. (2016). Myeloid-derived suppressor cells have a proinflammatory role in the pathogenesis of autoimmune arthritis. Ann. Rheum. Dis. 75, 278–285. doi:10.1136/annrheumdis-2014-205508
Han, D., Liu, J., Chen, C., Dong, L., Liu, Y., Chang, R., et al. (2019). Anti-tumour immunity controlled through mRNA m6A methylation and YTHDF1 in dendritic cells. Nature 566, 270–274. doi:10.1038/s41586-019-0916-x
Hanzelmann, S., Castelo, R., and Guinney, J. (2013). GSVA: Gene set variation analysis for microarray and RNA-seq data. BMC Bioinforma. 14, 7. doi:10.1186/1471-2105-14-7
Harvey, Z. H., Chen, Y., and Jarosz, D. F. (2018). Protein-based inheritance: Epigenetics beyond the chromosome. Mol. Cell 69, 195–202. doi:10.1016/j.molcel.2017.10.030
Klimak, M., Nims, R. J., Pferdehirt, L., Collins, K. H., Harasymowicz, N. S., Oswald, S. J., et al. (2021). Immunoengineering the next generation of arthritis therapies. Acta Biomater. 133, 74–86. doi:10.1016/j.actbio.2021.03.062
Lan, Q., Liu, P. Y., Haase, J., Bell, J. L., Huttelmaier, S., and Liu, T. (2019). The critical role of RNA m(6)A methylation in cancer. Cancer Res. 79, 1285–1292. doi:10.1158/0008-5472.CAN-18-2965
Langfelder, P., and Horvath, S. (2008). WGCNA: an R package for weighted correlation network analysis. BMC Bioinforma. 9, 559. doi:10.1186/1471-2105-9-559
Li, H., Han, Y., Guo, Q., Zhang, M., and Cao, X. (2009). Cancer-expanded myeloid-derived suppressor cells induce anergy of NK cells through membrane-bound TGF-beta 1. J. Immunol. 182, 240–249. doi:10.4049/jimmunol.182.1.240
Li, M., Yin, H., Yan, Z., Li, H., Wu, J., Wang, Y., et al. (2022). The immune microenvironment in cartilage injury and repair. Acta Biomater. 140, 23–42. doi:10.1016/j.actbio.2021.12.006
Liang, J-Y., Wang, D-S., Lin, H-C., Chen, X-X., Yang, H., Zheng, Y., et al. (2020). A novel ferroptosis-related gene signature for overall survival prediction in patients with hepatocellular carcinoma. Int. J. Biol. Sci. 16, 2430–2441. doi:10.7150/ijbs.45050
Liu, Q., Li, M., Jiang, L., Jiang, R., and Fu, B. (2019). METTL3 promotes experimental osteoarthritis development by regulating inflammatory response and apoptosis in chondrocyte. Biochem. Biophys. Res. Commun. 516, 22–27. doi:10.1016/j.bbrc.2019.05.168
Matsumoto, T., Gargosky, S. E., Iwasaki, K., and Rosenfeld, R. G. (1996). Identification and characterization of insulin-like growth factors (IGFs), IGF-binding proteins (IGFBPs), and IGFBP proteases in human synovial fluid. J. Clin. Endocrinol. Metab. 81, 150–155. doi:10.1210/jcem.81.1.8550744
Miller, R. J., Malfait, A. M., and Miller, R. E. (2020). The innate immune response as a mediator of osteoarthritis pain. Osteoarthr. Cartil. 28 (5), 562–571. doi:10.1016/j.joca.2019.11.006
Moradi, B., Rosshirt, N., Tripel, E., Kirsch, J., Barié, A., Zeifang, F., et al. (2015). Unicompartmental and bicompartmental knee osteoarthritis show different patterns of mononuclear cell infiltration and cytokine release in the affected joints. Clin. Exp. Immunol. 180, 143–154. doi:10.1111/cei.12486
Panoutsopoulou, K., Metrustry, S., Doherty, S. A., Laslett, L. L., Maciewicz, R. A., Hart, D. J., et al. (2014). The effect of FTO variation on increased osteoarthritis risk is mediated through body mass index: A mendelian randomisation study. Ann. Rheum. Dis. 73, 2082–2086. doi:10.1136/annrheumdis-2013-203772
Patil, D. P., Chen, C. K., Pickering, B. F., Chow, A., Jackson, C., Guttman, M., et al. (2016). m(6)A RNA methylation promotes XIST-mediated transcriptional repression. Nature 537, 369–373. doi:10.1038/nature19342
Ramos, Y. F., Bos, S. D., Lakenberg, N., Bohringer, S., den Hollander, W. J., Kloppenburg, M., et al. (2014). Genes expressed in blood link osteoarthritis with apoptotic pathways. Ann. Rheum. Dis. 73, 1844–1853. doi:10.1136/annrheumdis-2013-203405
Ritchie, M. E., Phipson, B., Wu, D., Hu, Y., Law, C. W., Shi, W., et al. (2015). Limma powers differential expression analyses for RNA-sequencing and microarray studies. Nucleic Acids Res. 43, e47. doi:10.1093/nar/gkv007
Rodríguez, P. C., and Ochoa, A. C. (2008). Arginine regulation by myeloid derived suppressor cells and tolerance in cancer: Mechanisms and therapeutic perspectives. Immunol. Rev. 222, 180–191. doi:10.1111/j.1600-065X.2008.00608.x
Rosshirt, N., Hagmann, S., Tripel, E., Gotterbarm, T., Kirsch, J., Zeifang, F., et al. (2019). A predominant Th1 polarization is present in synovial fluid of end-stage osteoarthritic knee joints: Analysis of peripheral blood, synovial fluid and synovial membrane. Clin. Exp. Immunol. 195, 395–406. doi:10.1111/cei.13230
Sang, W., Xue, S., Jiang, Y., Lu, H., Zhu, L., Wang, C., et al. (2021). METTL3 involves the progression of osteoarthritis probably by affecting ECM degradation and regulating the inflammatory response. Life Sci. 278, 119528. doi:10.1016/j.lfs.2021.119528
Serafini, P., Mgebroff, S., Noonan, K., and Borrello, I. (2008). Myeloid-derived suppressor cells promote cross-tolerance in B-cell lymphoma by expanding regulatory T cells. Cancer Res. 68, 5439–5449. doi:10.1158/0008-5472.CAN-07-6621
Shen, S., Wang, G., Zhang, R., Zhao, Y., Yu, H., Wei, Y., et al. (2019). Development and validation of an immune gene-set based Prognostic signature in ovarian cancer. EBioMedicine 40, 318–326. doi:10.1016/j.ebiom.2018.12.054
Shulman, Z., and Stern-Ginossar, N. (2020). The RNA modification N6-methyladenosine as a novel regulator of the immune system. Nat. Immunol. 21, 501–512. doi:10.1038/s41590-020-0650-4
Vincent, T. L. (2013). Targeting mechanotransduction pathways in osteoarthritis: A focus on the pericellular matrix. Curr. Opin. Pharmacol. 13, 449–454. doi:10.1016/j.coph.2013.01.010
Wilkerson, M. D., and Hayes, D. N. (2010). ConsensusClusterPlus: A class discovery tool with confidence assessments and item tracking. Bioinformatics 26, 1572–1573. doi:10.1093/bioinformatics/btq170
Woodell-May, J. E., and Sommerfeld, S. D. (2020). Role of inflammation and the immune system in the progression of osteoarthritis. J. Orthop. Res. 38, 253–257. doi:10.1002/jor.24457
Xu, F., Guan, Y., Ma, Y., Xue, L., Zhang, P., Yang, X., et al. (2021). Bioinformatic analyses and experimental validation of the role of m6A RNA methylation regulators in progression and prognosis of adrenocortical carcinoma. Aging (Albany NY) 13, 11919–11941. doi:10.18632/aging.202896
Yang, C., Dong, Z., Ling, Z., and Chen, Y. (2022). The crucial mechanism and therapeutic implication of RNA methylation in bone pathophysiology. Ageing Res. Rev. 79, 101641. doi:10.1016/j.arr.2022.101641
Yang, S., Wei, J., Cui, Y-H., Park, G., Shah, P., Deng, Y., et al. (2019). m6A mRNA demethylase FTO regulates melanoma tumorigenicity and response to anti-PD-1 blockade. Nat. Commun. 10, 2782. doi:10.1038/s41467-019-10669-0
Yang, Y., Hsu, P. J., Chen, Y. S., and Yang, Y. G. (2018). Dynamic transcriptomic m(6)A decoration: Writers, erasers, readers and functions in RNA metabolism. Cell Res. 28, 616–624. doi:10.1038/s41422-018-0040-8
Yu, G., Wang, L-G., Han, Y., and He, Q-Y. (2012). clusterProfiler: an R package for comparing biological themes among gene clusters. OMICS 16, 284–287. doi:10.1089/omi.2011.0118
Zhang, B., Wu, Q., Li, B., Wang, D., Wang, L., and Zhou, Y. L. (2020). m(6)A regulator-mediated methylation modification patterns and tumor microenvironment infiltration characterization in gastric cancer. Mol. Cancer 19, 53. doi:10.1186/s12943-020-01170-0
Zhang, C., Zhang, M., Ge, S., Huang, W., Lin, X., Gao, J., et al. (2019). Reduced m6A modification predicts malignant phenotypes and augmented Wnt/PI3K-Akt signaling in gastric cancer. Cancer Med. 8, 4766–4781. doi:10.1002/cam4.2360
Zhang, H., Cai, D., and Bai, X. (2020). Macrophages regulate the progression of osteoarthritis. Osteoarthr. Cartil. 28 (5), 555–561. doi:10.1016/j.joca.2020.01.007
Zheng, Q., Hou, J., Zhou, Y., Li, Z., and Cao, X. (2017). The RNA helicase DDX46 inhibits innate immunity by entrapping m6A-demethylated antiviral transcripts in the nucleus. Nat. Immunol. 18, 1094–1103. doi:10.1038/ni.3830
Keywords: N6-methyladenine (m6A), osteoarthritis, methylation, immune, microenvironment
Citation: Gu Y, Wang Z, Wang R, Yang Y, Tong P, Lv S, Xiao L and Wang Z (2023) N6-methyladenine regulator-mediated RNA methylation modification patterns in immune microenvironment regulation of osteoarthritis. Front. Genet. 14:1113515. doi: 10.3389/fgene.2023.1113515
Received: 01 December 2022; Accepted: 13 January 2023;
Published: 26 January 2023.
Edited by:
Xiao Wang, Konge Larsen ApS, DenmarkReviewed by:
Yueqi Chen, Army Medical University, ChinaChunhui Ma, Shanghai General Hospital, China
Weiwei Lin, Zhejiang University, China
Copyright © 2023 Gu, Wang, Wang, Yang, Tong, Lv, Xiao and Wang. This is an open-access article distributed under the terms of the Creative Commons Attribution License (CC BY). The use, distribution or reproduction in other forums is permitted, provided the original author(s) and the copyright owner(s) are credited and that the original publication in this journal is cited, in accordance with accepted academic practice. No use, distribution or reproduction is permitted which does not comply with these terms.
*Correspondence: Zhirong Wang, empnZnlfc3BpbmVfd3pyQG5qdWNtLmVkdS5jbg==; Long Xiao, empnZnlfc3BpbmVfeGxAbmp1Y20uZWR1LmNu; Shuaijie Lv, bHZzaHVhaWppZTE5OTBAemNtdS5lZHUuY24=
†These authors have contributed equally to this work and share first authorship