 Zhijun Zhang
 Tingting Zhang*
 Lei Ma
94% of researchers rate our articles as excellent or good
Learn more about the work of our research integrity team to safeguard the quality of each article we publish.
Find out more
ORIGINAL RESEARCH article
Front. Genet. , 17 April 2023
Sec. Genomics of Plants and the Phytoecosystem
Volume 14 - 2023 | https://doi.org/10.3389/fgene.2023.1097381
This article is part of the Research Topic Application of Network Theoretic Approaches in Biology View all 11 articles
Background: Abiotic stress is a significant environmental factor that limits plant growth. Plants have complex and diverse mechanisms for dealing with abiotic stress, and different response mechanisms are interconnected. Our research aims to find key transcription factors that can respond to multiple non -biological stress.
Methods: We used gene expression profile data of Arabidopsis in response to abiotic stress, constructed a weighted gene co-expression network, to obtain key modules in the network. The functions and pathways involved in these modules were further explored by Gene Ontology (GO) and Kyoto Encyclopedia of Genes and Genomes (KEGG) enrichment analyses. Through the enrichment analysis of transcription factor, the transcription factor that plays an important regulatory role in the key module. Through gene difference expression analysis and building protein interaction networks, the important role of key transcription factors is verified.
Result: In weighted gene co-expression network, identified three gene modules that are primarily associated with cold stress, heat stress, and salt stress. Functional enrichment analysis indicated that the genes in these modules participate in biological processes such as protein binding, stress response, and others. Transcription factor enrichment analysis revealed that the transcription factor Basic Pentacysteine6 (BPC6) plays a crucial regulatory role in these three modules. The expression of the BPC6 gene is dramatically affected under a variety of abiotic stress treatments, according to an analysis of Arabidopsis gene expression data under abiotic stress treatments. Differential expression analysis showed that there were 57 differentially expressed genes in bpc4 bpc6 double mutant Arabidopsis relative to normal Arabidopsis samples, including 14 BPC6 target genes. Protein interaction network analysis indicated that the differentially expressed genes had strong interactions with BPC6 target genes within the key modules.
Conclusion: Our findings reveal that the BPC6 transcription factor plays a key regulatory function in Arabidopsis coping with a variety of abiotic stresses, which opens up new ideas and perspectives for us to understand the mechanism of plants coping with abiotic stresses.
Adverse environmental factors, such as abiotic stress, severely limit agricultural production, reduce crop yield and quality, and affect plant growth and development, thereby threatening food security. Extreme temperatures and soil salinity are common extreme environmental conditions in nature, and climate change further complicates these adverse factors (GONG et al., 2020). Therefore, it is crucial to understand the response mechanism of plants to abiotic stress.
Arabidopsis is widely used as a model organism for research in plant genetics, developmental biology and molecular biology. And it is an ideal experimental material for exploring the mechanisms of plant response to abiotic stresses (KILIAN et al., 2007). In previous studies, some important Arabidopsis genes and metabolic pathways have been shown that they are involved in the process to respond to abiotic stress with Arabidopsis. For example, the C-repeat Binding Transcription Factor3 (CBF3) transcription factor plays a key role in the cold response pathway (HE et al., 2008). Cold-inducible RNA helicase Regulator of CBF gene expression1 (RCF1) regulates cold-responsive genes and enhances the cold tolerance of plants by clipping pre-mRNA (GUAN et al., 2013). Exogenous application of jasmonate significantly enhances Arabidopsis freezing tolerance (HU et al., 2013). Humic acid (HA) significantly induces Heat Shock Protein-encoding (HSP) genes, including HSP101, HSP81.1, HSP26.5, HSP23.6, and HSP17.6A, which promotes heat tolerance in Arabidopsis (CHA et al., 2020). The Arabidopsis Temperature-Induced Lipocalins1 (TIL1) gene (AT5G58070) is an important component of thermotolerance (CHI et al., 2009). Sanguinarine affects heat tolerance in Arabidopsis by enhancing the expression of heat shock protein genes such as HSP17. 6C-CI, HSP70, and HSP90.1 (HARA and KURITA, 2014). The Arabidopsis histone acetyltransferase General Control Non-Derepressible5 (GCN5) is also an important component of Arabidopsis thermotolerance (HU et al., 2015). The Arabidopsis regulator RCF2, expressed by the C-repeat Binding Factor (CBF) gene, has been shown to be an integrator of hyperthermia signaling and a mechanism of Heat Stress Transcription Factor (HSF) and HSP activation (GUAN et al., 2014). Overexpression of Arabidopsis Stress-Induced BTB Protein 1 (SIBP1) genes increases salt tolerance in transgenic Arabidopsis (WAN et al., 2019). MADS-box transcription factor Agamous-Linke16 (AGL16) acts as a negative regulator in stress response in Arabidopsis. The absence of AGL16 makes Arabidopsis resistant to salt stress (ZHAO et al., 2021). Different members of the Phosphoglycerate Dehydrogenase (PGHD) gene family have different effects on salt tolerance in Arabidopsis, and the response to salt stress depends on the specific gene (ROSA-TELLEZ et al., 2020). Many genes or pathways are also involved in the response to multiple abiotic stresses in Arabidopsis. Overexpression of Cysteine2/Histidine2 (C2H2)-Type Zinc Finger of Arabidopsis Thaliana6 (ATZAT6) in Arabidopsis can increase resistance to pathogen infection, salt, drought and freeze stress (SHI et al., 2014). DNA methylation is also an important mechanism to regulate abiotic stress resistance in plants (OGNEVA et al., 2019).
Despite the fact that these studies have discovered numerous genes and biological processes in response to abiotic stress, most of these studies have focused on the link between a single gene and a single abiotic stress scenario. However, in nature, stress conditions are frequently layered on a range of unfavorable environmental circumstances. Therefore, the biological processes by which plants respond to different abiotic stresses are not completely independent. Responses to various abiotic stresses are both independent and highly interrelated. Plants possess genes that can respond to several different abiotic stressors simultaneously. To improve plant yield and quality and expand agricultural production, research must be conducted on genes that can adapt to multiple abiotic stresses.
In this study, we retrieved expression data from Arabidopsis plants that were subjected to abiotic stress treatments to identify genes that respond to these stressors. We then used the Weighted Gene Co-expression Network Analysis (WGCNA) method to identify the gene modules that are mostly related to cold stress, heat stress, and salt stress. We used a comprehensive bioinformatics approach to analyze the molecular function, signaling pathway, and transcription factor enrichment results of the modules. Finally, we identified a transcription factor, BPC6 (Basic Pentacysteine), that is highly related to these three stresses. The expression data of BPC6 under abiotic stress showed that it is involved in Arabidopsis responding to various abiotic stresses. Our study will improve the understanding of plant abiotic stress response mechanisms and may play an important role in improving plant yield and quality and promoting agricultural production.
The 18 gene expression profile data associated with abiotic stress in Arabidopsis were preprocessed, and only wild-type Arabidopsis samples from all datasets were retained, for a total of 97 samples. All data were normalized. Each dataset contained 20,642 genes. After removing batch effects and putting the 18 datasets together into a new matrix file, all 54 stress-related samples from the new matrix file were selected and control samples were removed. The results of an analysis of Median Absolute Deviation (MAD) are shown in Supplementary Table S1. For building the weighted gene co-expression network, the top 10,000 genes with the most variable expression levels were selected as input genes (mad ≥ 0.390897091). The clustering analysis showed that the 54 Arabidopsis samples were close to each other, with no significant outliers (Figure 1), and the overall effect was good.
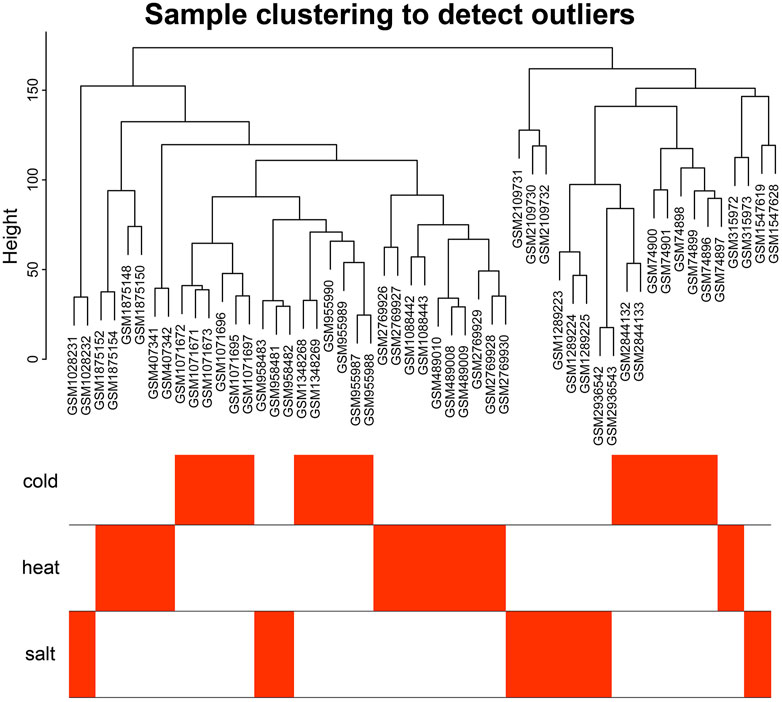
FIGURE 1. Sample cluster analysis diagram. Sample clustering analysis showed that no samples were outliers.
To build the scale-free network, we optimized the appropriate network weighting coefficient β. The β was calculated using the “pick Soft Threshold” function of the WGCNA package. When the threshold β was set to 3, the topology analysis showed that the scale-free topology fitting index (R2) was close to 90% (Supplementary Figure S1), indicates that the network was close to being a scale-free network. We established a co-expression network with a soft threshold β of 3. The genes with similar expression patterns were grouped into modules in the network, and a total of seven modules were identified (Figure 2). For visualization, modules were named with colors: Black (258 genes), Blue (1,415 genes), Brown (882 genes), Green (654 genes), Red (571 genes), Turquoise (5,392 genes), and Yellow (827 genes).
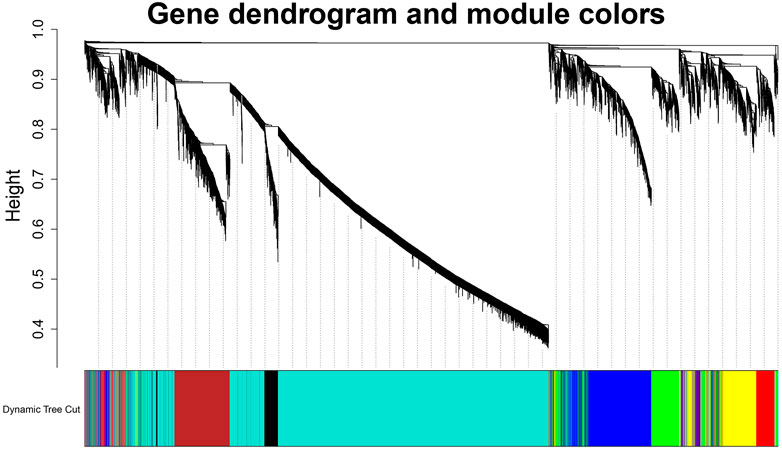
FIGURE 2. Identification diagram of gene co-expression module. Identification of gene co-expression modules via hierarchical average linkage clustering. The color row underneath the dendrogram shows the module assignment determined by the Dynamic Tree Cut.
The seven modules are primarily divided into three clusters (Figure 3A). Compared to the other modules (Figure 3B), the red module is most closely associated with cold stress, the black module is most closely associated with heat stress, and the blue module is most relevant to salt stress. The results demonstrate that the red (MM = 0.62, p = 6e-7), black (MM = 0.33, p = 0.01), and blue (MM = 0.35, p = 0.01) modules play crucial roles in the Arabidopsis response to abiotic stress. Therefore, these three modules are identified as the key modules.
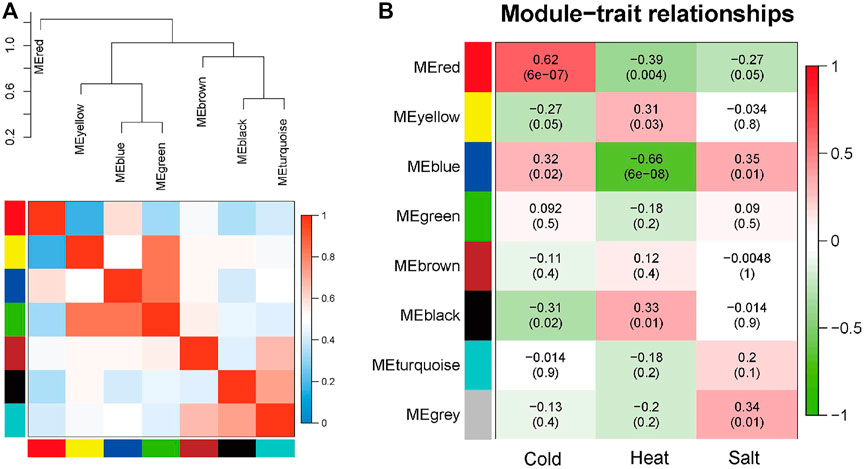
FIGURE 3. Hierarchical clustering dendrogram of module eigengenes and heatmap plot of the adjacencies in the eigengene network (labeled by their colors). (A) In the heatmap, the green color represents low adjacency (negative correlation), while a red represents high adjacency (positive correlation). (B) Correlation between sample grouping and gene modules. Each row of the table corresponds to a gene module, and each column corresponds to a group.
To better understand the biological functions of genes in key modules, the red, black, and blue modules were analyzed for GO function enrichment and KEGG pathway enrichment. The 93 GO terms are significantly enriched in the red module (Figure 4A). For biological processes, genes are mainly concentrated in the response to water shortage, abscisic acid and light stimulation, and signal transduction. For cellular components, genes are mainly enriched in membrane components, the plasma membrane, and cytoplasm. For molecular functions, genes are mainly enriched in protein binding.
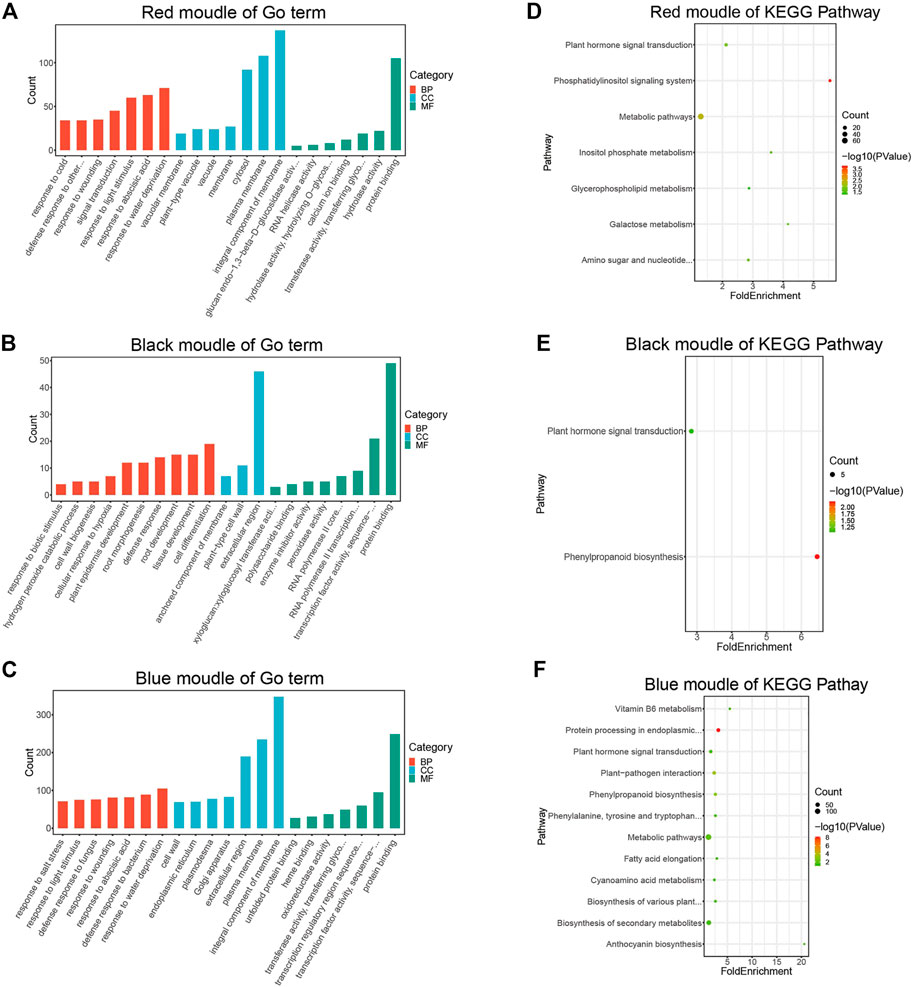
FIGURE 4. GO and KEGG enrichment analysis diagram. (A) GO Enrichment results of genes in the red module. (B) GO enrichment results of genes in the black module. (C) Enrichment results of genes in the blue module. (D) KEGG pathway enrichment results of genes in the red module. (E) KEGG pathway enrichment results of genes in the black module. (F) KEGG pathway enrichment results of genes in the blue module.
The 24 GO terms are significantly enriched in the black module (Figure 4B). For biological processes, genes are mainly enriched in cell differentiation, root development, tissue development, defense responses, and plant epidermis development. For cellular components, genes were mainly enriched in the extracellular region. For molecular functions, genes were mainly enriched in protein transport, transcription factor activity, and sequence-specific DNA binding.
The 178 GO terms are significantly enriched in the blue module (Figure 4C). For biological processes, genes were mainly enriched in response to water shortage, defense response to bacteria, response to injury, and defense response to fungi. For cellular components, genes were mainly enriched in membrane components, the plasma membrane, extracellular region, and Golgi apparatus. For molecular functions, genes were mainly enriched in protein binding, transcription factor activity, sequence-specific DNA binding, and transcriptional regulatory region sequence specific DNA binding.
According to the KEGG pathway analysis, the red module is primarily involved in metabolic pathways (Figure 4D), the black module is mainly associated with phenylpropionic acid biosynthesis (Figure 4E), and the blue module is mainly involved in metabolic pathways and secondary metabolite synthesis (Figure 4F).
To further investigate the common biological mechanisms behind the three key modules responding to abiotic stress, transcription factor enrichment analysis of genes in the three key modules was performed using transcription factor enrichment in PlantTFDB (5.0). Figure 5A shows the enrichment results of the red module, Figure 5B shows the enrichment results of the black module, and Figure 5C shows the enrichment results of the blue module. Supplementary Tables S2–S4 show the regulatory relationship between genes and transcription factors in the red, black, and blue modules, respectively. The intersection of the three enrichment results (Figure 5D) showed that the BPC6 transcription factor synthesized by the AT5G42520 gene played a key regulatory role in all three modules simultaneously.
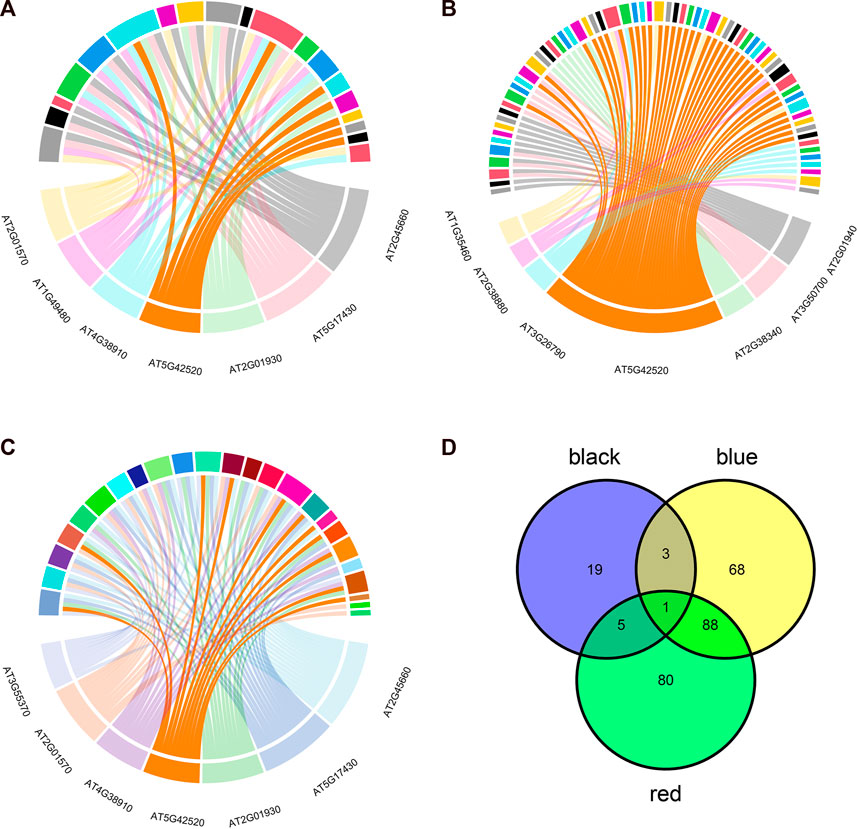
FIGURE 5. Transcription factor enrichment analysis results. (A) Transcription factor enrichment results of genes in the red module. (B) Transcription factor enrichment results of genes in the black module. (C) Transcription factor enrichment results of genes in the blue module. (D) Transcription factor enrichment results are intersected.
To test whether the BPC6 gene plays a key role in Arabidopsis responses to multiple abiotic stresses, we analyzed Arabidopsis expression profile data from the AtGenExpress project under different abiotic stresses and obtained the expression of the BPC6 gene under different abiotic stresses (Figure 6). According to the expression profile data. The expression of the BPC6 gene in Arabidopsis decreased significantly during the continuous cold stress period of 4°C. After 6 h of stress, the expression of the BPC6 gene in plants began to increase significantly, and the change of expression in leaves was more significant. The expression level of the BPC6 gene in the root continued to decrease initially, but after 6 h, the expression level began to increase and returned to the level before the stress.
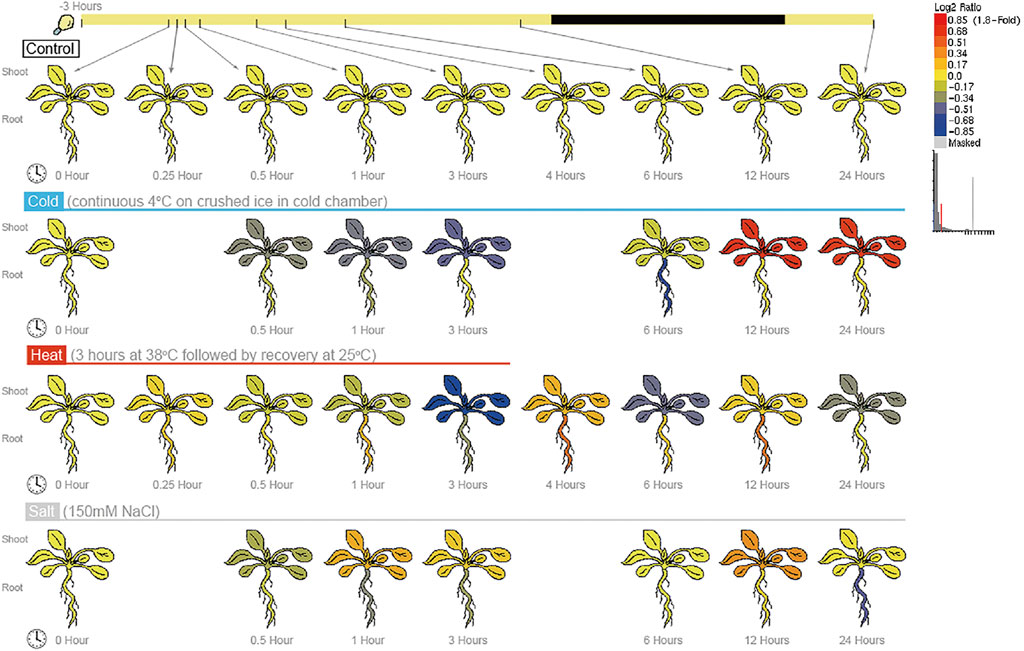
FIGURE 6. Expression of BPC6 gene under different abiotic stresses.
During the 38°C/3 h heat stress period, the expression level of the Arabidopsis BPC6 gene slowly decreased. After the stress was stopped, the expression level first increased, then decreased, then increased again, and then decreased once more. At 24 h, the expression level of the BPC6 gene in the leaves was still low, while the expression level in roots returned to the level before the heat stress.
During the 150 mM/L NaCl salt stress, the expression of the BPC6 gene in Arabidopsis firstly decreased within half an hour of salt stress, then increased within 1 h, then decreased within 6 h, and then increased within 12 h. After 24 h, the expression of the BPC6 gene in leaves recovered to the pre-stress level, but the expression in roots was significantly lower than that before stress. These results indicated that the Arabidopsis BPC6 gene is involved in the Arabidopsis response to various abiotic stresses, which confirms our data analysis results.
After comparing bpc4 bpc6 double mutant Arabidopsis with normal samples, a total of 57 genes were differentially expressed (DEG), with 27 genes being downregulated and 30 genes being upregulated (refer to Supplementary Figure S2, Supplementary Table S7). Out of the 30 upregulated genes, five were identified as BPC6 target genes according to the plantregmap database, accounting for 20% of all upregulated genes. Similarly, eight of the 27 downregulated genes were BPC6 target genes, accounting for 29.6% of all downregulated genes (Figure 7B). However, the expression of genes regulating BPC6 remained unchanged (Figure 7A). These findings suggest that a substantial proportion of the DEGs were target genes regulated by BPC6, underscoring the critical role of the BPC gene in modulating the expression of these genes.
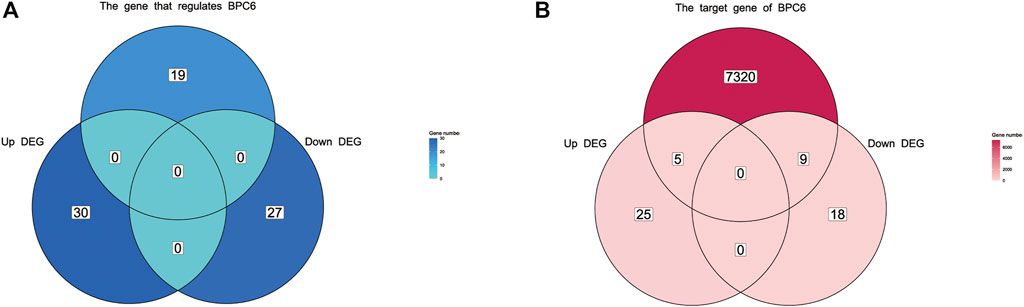
FIGURE 7. Venn diagram of differentially expressed genes and BPC upstream regulatory genes and downstream target genes. (A) Venn diagram of differentially expressed genes and upstream regulatory genes of BPC. (B) Venn diagram of differentially expressed genes and target genes regulated by BPC.
To ensure the accuracy of our findings, we analyzed the Protein-Protein Interaction (PPI) network from both a global and regional perspective. The results of the PPI network analysis of DEGs and target genes controlled by BPC6 in key modules revealed a significant overall interaction link between these genes (Figure 8A). The PPI network has 48 DEGs, accounting for 84% of the total differential genes. The PPI network contains 157 of the 188 BPC6 target genes in the red module, accounting for 84% of the total. The PPI network contains 59 of the 80 BPC6 target genes in the black module, accounting for 74% of the total. The PPI network contains 337 of the 431 BPC6 target genes in the blue module, accounting for 78% of the total.
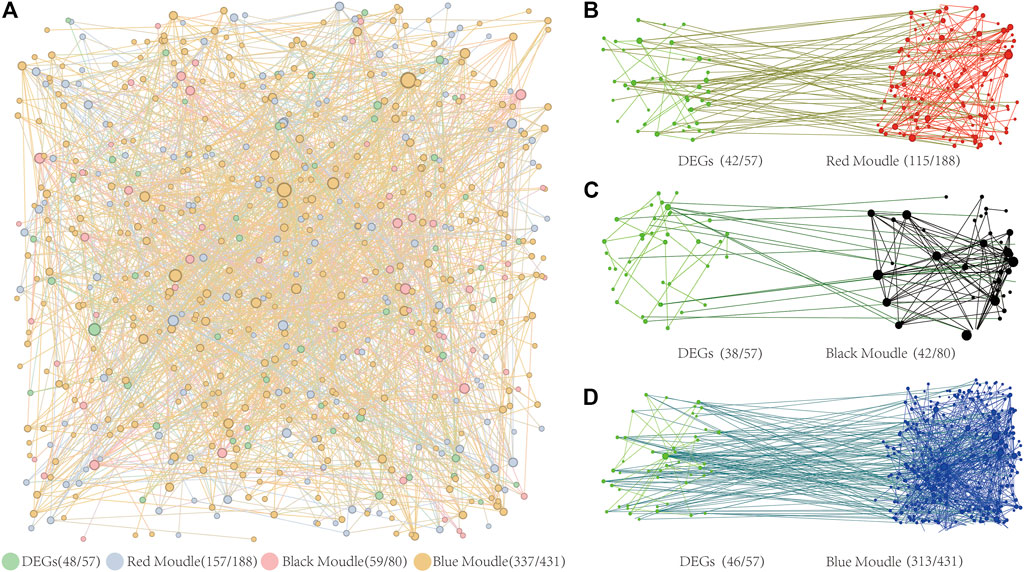
FIGURE 8. PPI Network Diagram. (A) PPI network diagram of three key modules and differentially expressed genes. (B) The PPI network diagram of target genes regulated by BPC6 and differentially expressed genes in the red module. (C) The PPI network diagram of target genes regulated by BPC6 and differentially expressed genes in the black module. (D) The PPI network diagram of target genes regulated by BPC6 and differentially expressed genes in the blue module.
PPI network analysis was performed on DEGs and the different key modules. The PPI network analysis results of the red module and 57 DEGs showed that 115 (64%) of the 180 target genes had obvious interactions with 42 (74%) DEGs (Figure 8B). The PPI network analysis results of the black module and 57 DEGs showed that there were obvious interactions between 42 (53%) of the 80 target genes and 38 (67%) DEGs (Figure 8C). The PPI network analysis results of the blue module and 57 DEGs showed that 313 (73%) of the 431 target genes had obvious interactions with 46 (81%) DEGs (Figure 8D). For different key modules, most of the target genes were regulated by BPC6 and most of the DEGs had obvious interactions.
The ever-increasing global population and the hard-to-increase arable land have aggravated the negative impact on human survival. The best solution to this problem is to increase crop yield per unit area. However, abiotic stress has a strong negative impact on plant growth and crop yield. Abiotic stress factors such as extreme temperatures and soil salinization seriously affect crop production every year, making it significant to improve plant tolerance to abiotic stress. As a model plant, Arabidopsis exhibits strong adaptability to environmental stress and is widely used to study various abiotic stress response mechanisms. Most of the previous work has focused on studying Arabidopsis response mechanisms to a single stress. However, many extreme climatic conditions occur simultaneously in nature, and the mechanisms by which plants responding to different stresses are not independent of each other. At present, the shared response mechanisms of plants to cope with multiple abiotic stresses are unclear. The BPC6 transcription factor is an important regulatory transcription factor, and studying its mechanism of participation in coping with abiotic stress is significant.
In this study, we constructed a weighted gene co-expression network using Arabidopsis gene expression data and identified three modules that were most associated with cold, heat, and salt stress. The GO enrichment analysis showed that the blue module was mainly involved in the response to water shortage, and had a superior response to bacteria and fungi. The red module was mainly involved in the response to water shortage, abscisic acid, and so on. The black module was mainly involved in cell differentiation, plant development, protein transport, and transcription factor activity. The KEGG pathway enrichment analysis showed that the blue and red modules were mainly involved in the metabolic pathway, while the black module was mainly involved in the phenyl-propionic acid synthesis pathway. The three modules were then enriched for transcription factors, and the results showed that most of the genes in the three modules were simultaneously regulated by the BPC6 transcription factor. The expression of the BPC6 gene in Arabidopsis was analyzed under different abiotic stresses, and the results showed that the expression of the BPC6 gene changed significantly under different abiotic stresses.
The DEGs between the bpc4 bpc6 double mutant Arabidopsis samples and normal samples were analyzed. The differential expression analysis shows that compared with normal samples, the bpc4 bpc6 double mutant Arabidopsis must have a total of 57 DEGs. Sequence analysis showed that the BPC gene family has a total of 7 genes in Arabidopsis, which are divided into three classes: class I proteins BPC1 (AT2G01930), BPC2 (AT1G14685) and BPC3 (AT1G68120); class II proteins BPC4 (AT2G21240), BPC5 (AT4G38910) and BPC6 (AT5G42520); and class III protein BPC7 (AT2G35550). They are all ubiquitously expressed transcriptional activators and repressors, except for BPC5, which is considered a pseudogene (MEISTER et al., 2004). There is functional overlap between different classes. Single gene mutations do not produce visible phenotypic effects, and severe morphological phenotypes occur only in higher-order mutants between class I and class II members. Therefore, to study the function of the BPC6 gene through gene mutant, it is necessary to knock out all BPC genes that are similar to the BPC6 gene function. The control group samples and gene mutant samples used in sequencing are cultivated in normal environments without coercion. Therefore, the only reason for generating differential genes is the mutant of the BPC4 and BPC6 genes. The number of different genes is very small. It may be due to the overlapping function of other unintended BPC genes with BPC6, which caused the physiological biochemical activity of gene knocking Arabidopsis not be significantly affected. There are 13 genes among the DEGs that are direct or indirect targets of the BPC6 transcription factor, accounting for 23% of the total number of different genes. The PPI network analysis of the BPC6 target genes and DEGs in the key modules can be seen that most of the differences can have a strong interaction with most of the differential genes in the key module in the key module. This proves that the analysis results of the weighted gene co-expression network.
Cytokinin plays an important role in plant growth and development and also participates in the response process of plants to non-biological stress. Research indicates that cytokinins can regulate ion channels, antioxidant enzyme activity, protect chlorophyll and cell membrane stability, and modulate the balance of hormones in plants. The promotes the growth and differentiation of roots, thus increasing plant adaptability to abiotic stress (Sabagh et al., 2021). In addition, cytokinins can also regulate plant abiotic stress responses by interacting with other signaling molecules such as ABA, SA, and ROS (GUPTA and HUANG, 2014; GAO et al., 2019). The type-B Arabidopsis response regulator (ARR) transcription factors have emerged as primary targets of cytokinin signaling and are required for essentially all cytokinin-mediated changes in gene expression. By cooperating with other transcription factors, ARR can affect the process and effect of cytokinin in plants (ARGUESO et al., 2010). BPC transcription factors are a potential set of coregulators regulating cytokinin responses. Disruption of multiple BPC genes in Arabidopsis thaliana reduces its sensitivity to cytokinin. Further, a significant number of BPC6 regulated genes are also direct targets of the type-B ARRs (SHANKS et al., 2018). Therefore, cytokinin is likely to be a key substance involved in Arabidopsis’s response to abiotic stress by the BPC6 transcription factor.
The BPC transcription factor family plays a crucial role in regulating gene expression in plants. These proteins are located in the nucleus and regulates the transcription process by specifically binding to the GA dinucleotide repeat sequence of the gene. BPC proteins were first discovered in barley in 2003 (SANTI et al., 2003), and subsequently in Arabidopsis in 2004 (MEISTER et al., 2004). BPC genes have a broad expression pattern in Arabidopsis, more than 3,000 Arabidopsis genes contain at least one GA-rich segment in their regulatory region. BPC transcription factors are essential for normal plant growth and development. The Arabidopsis BPC1 transcription factor has been shown to bind to a GA-rich consensus sequence in the Seedstick (STK) promoter in vitro, and this binding induces conformational changes. Vivo BPCs also bind to the consensus boxes, and when these were mutated, expression from the STK promoter was derepressed, resulting in ectopic expression in the inflorescence. GA consensus sequences in the STK promoter to which BPCs bind are essential for the recruitment of the corepressor complex to this promoter (SIMONINI et al., 2012). Shootmeristemless (STM) and Brevipedicellus/Knat1 (BP) genes are both direct targets of BPCs, and BPC transcription factors also play an important role in the fine regulation of cytokinin content in meristem (SIMONINI and KATER, 2014). BPC6 can interact with two Arabidopsis Polycomb-Repressive Complexes (PRC1.PRC2) to affect the expression of a large number of genes (HECKER et al., 2015). BPCs can bind to the promoter of transcription factors Abscisic Acid Insensitive4 (AAI4), inhibit the expression of ABI4 in roots, and promote lateral root (LR) development in Arabidopsis (MU et al., 2017). BPCs also significantly affect the function of cytokinins in Arabidopsis, and disruption of multiple BPCs in Arabidopsis results in reduced sensitivity to cytokinins (SHANKS et al., 2018). BPCs may also promote Arabidopsis ovule and seed development by limiting the transcription of Fusca3 (FUS3) (ROSCOE et al., 2019; CARELLA, 2020). Class I BPC works by directly binding to the GA/CT cis-element in FUS3 and limiting its expression (Wu et al., 2020).
Previous studies have demonstrated that the BPC transcription factor family plays an important role in regulating plant growth and development. However, from the perspective of abiotic stress, our study expounds a brand-new research result, that is, the BPC6 transcription factor is involved in the process of plants responding to various abiotic stresses. Compared with previous studies, our advantages lie in the large sample size, abundant data, novel research angles, and diverse research methods. We illustrate new findings with existing data.
Base on further discussion of the results of this study, the following points can be paid attention to: First of all, the specificity and regulatory mechanism of BPC6 transcription factor in various abiotic stresses can be further explored. Additionally, the interactions and regulatory networks between BPC6 and other regulators can be studied to gain a deeper understanding of its role in plant abiotic stress responses.
Second, this study found that the blue and red modules were mainly involved in the metabolic pathway, and the black module was mainly involved in the phenylpropionic acid synthesis pathway. This suggests that metabolic and synthetic pathways have important roles in plant responses to abiotic stresses. Therefore, future studies can further focus on the key genes and regulatory mechanisms in these pathways to better understand the physiological and metabolic regulation of plants under abiotic stress.
In addition, the results of this study indicated that different modules have different response characteristics to abiotic stresses. For example, blue modules are mainly involved in the response to water deprivation, while red modules are mainly involved in the response to abscisic acid. This suggests that plants may require different adaptive mechanisms for optimal growth and survival in response to different abiotic stresses. Therefore, future studies could delve deeper into these adaptive mechanisms and response traits to guide plant breeding and planting practices to improve plant adaptability and stress resistance.
Finally, the results of this study demonstrate that key genes and regulatory mechanisms in plants under abiotic stress can be effectively identified using the WGCNA approach. Therefore, future research can apply the WGCNA method to more plant species and different types of abiotic stress to establish a more comprehensive and accurate plant abiotic stress response network, and provide a more scientific basis for plant breeding and cultivation. In addition, by combining other bioinformatics methods, such as gene expression profiling and functional annotation, deeper information and mechanisms of the abiotic stress response network can be further explored. At the same time, since Arabidopsis is a model organism, our research results can also guide the study of other plants, which is of great significance for agricultural production and food security.
The BPC transcription factor family is very important in plants and can regulate various plant growth and development processes. From the perspective of abiotic stress, this study explored the role of the BPC6 transcription factor in Arabidopsis response to abiotic stress. It confirmed that Arabidopsis BPC6 transcription factor can participate in coping with various abiotic stresses by regulating the expression of many genes. Analysis of Arabidopsis gene expression data validated this result. This study proves that the biological processes of Arabidopsis in response to different abiotic stresses are not isolated, but have commonality at the level of transcription factors. This work provides new ideas and perspectives for the study of plant responses to abiotic stress.
In order to study the mechanism of Arabidopsis response to abiotic stress, we searched the GEO (https://www.ncbi.nlm.nih.gov/geo/) database using “Arabidopsis” as the keyword. To query gene expression profiles associated with abiotic stress in Arabidopsis, we downloaded 18 groups of gene expression profiles related to abiotic stress. These included 6 groups related to salt stress, 6 groups related to heat stress, and 6 groups related to cold stress. We only retained wild-type Arabidopsis expression data in the gene expression profiles, resulting in a total of 97 samples. The detailed information of all gene expression profiles is shown in Supplementary Table S8. We also searched the GEO database using “Arabidopsis” and “BPC” as keywords and obtained gene expression data of Arabidopsis thaliana with BPC gene mutant (GSE68437). This data set contains eight samples, of which two bpc4 bpc6 double mutant Arabidopsis samples and two control samples were retained. All data used whole plants as material to be sequenced.
Gene expression profiles were downloaded in TXT format from the GEO database. The R software package was used to process the matrix files and filter out low-quality data. The probe ID was converted to a gene symbol, invalid expression data were deleted, and the expression data of duplicate gene symbols were averaged. The expression profiles without log2 transformation were log2 transformed using R language. We used the combat package to remove batch effects from all expression profiles, and merged them into a matrix file. The expression data from all stress-treated Arabidopsis samples in the matrix file were merged into a new matrix file. Subsequently, we performed WGCNA using the new matrix files containing only stress-treated Arabidopsis samples. The GSE68437 dataset was used for gene differential expression analysis.
In statistics, the median absolute deviation (MAD) is a robust measure of sample bias on univariate numerical data. At the same time, it can also represent the population parameters estimated by the MAD of the sample. We used the MAD algorithm to select the expression data of the top 10,000 genes as input data for WGCNA.
WGCNA is regarded as a methodology to reconstruct a free-scale gene co-expression network and concurrently identify modules consisting of highly correlated genes to appraise connectivity between external clinical traits and the module. Eigengene is used for summarizing relationships among internal gene membership. In this study, we applied the one-step network construction and module detection function of the WGCNA package (https://horvath.genetics.ucla.edu/html/Co-expressionNetwork/Rpackages/WGCNA/Tutorials/) in R to handle the analysis of the expression profiles of Arabidopsis, which contained 20 cold-treated samples, 18 heat-treated samples, and 15 NaCl-treated samples. We correlated gene clusters with each other and external sample features. The weighted adjacency matrix was calculated to represent the connection strength of each pair of genes. According to the scale-free topology network, the soft thresholding power was set to 4. Then, a hierarchical clustering dendrogram composed of rich branches was established. The dynamic tree-cutting method was used to complete module identification, the minimum size of the gene dendrogram is 25, and the grouping information of samples is made by setting the value of 1 under stress and 0 under no stress as the grouping standard. Finally, modules were associated with groups using module-group associations based on Module Membership (MM) and Gene Salience (GS).
We evaluate the relationship between module and sample grouping by using the correlation between module eigengenes and sample grouping. When dealing with sample features, statistical significance measures between module feature genes and features can be defined. For example, using correlation values or p-values, modules with high feature significance values are considered to be associated with sample grouping.
Gene Ontology (GO) enrichment and Kyoto Encyclopedia of Genes and Genomes (KEGG) pathway enrichment analyses of genes in key modules were performed using the online DAVID (https://david.ncifcrf.gov/). The gene list of key modules was uploaded to the DAVID database to obtain the GO enrichment and KEGG pathway enrichment results. Results with p < 0.05 were considered significant, and the obtained enrichment analysis results were visualized using the ggplot2 package.
Transcription factor enrichment analysis of genes in key modules was performed using the online plantTFDB database (http://planttfdb.gao-lab.org/). The gene list of key modules was uploaded to the plantTFDB database, and the enrichment results of transcription factors of key modules were obtained. R language was used for subsequent analysis of transcription factor enrichment results.
Arabidopsis eFP Browsers (http://bar.utoronto.ca/#GeneExpressionAndProteinTools) from the AtGenExpress project were used to analyze the expression profiles of Arabidopsis genes under different abiotic stresses, using the Arabidopsis eFP in the BAR database (KILIAN et al., 2007).
To verify our data analysis results, we used the plantregmap database (http://plantregmap.gao-lab.org/) to obtain all target genes regulated by BPC6 and all genes that regulate BPC6 in Arabidopsis. We also used the limma package (https://bioconductor.org/packages/release/bioc/html/limma.html) to analyze the gene differential expression of the which two bpc4 bpc6 double mutant Arabidopsis samples and normal samples in the GSE68437 dataset (|log2FC| > 2, adj.p < 0.05). Additionally, we utilized the STRING (https://string-db.org/) to perform PPI networks analysis on DEGs and key genes within the three modules, and then used Gephi V0.10.1 to visualize the PPI network. Finally, we took the intersection of BPC6-related genes and DEGs to verify our data analysis results.
The datasets presented in this study can be found in online repositories. The names of the repository/repositories and accession number(s) can be found in the article/Supplementary Material.
ZZ and LM contributed to the conception and design. LM and TZ provided administrative support. ZZ contributed to data collection, analysis and interpretation. ZZ, LM, and TZ contributed to manuscript writing and provided final approval of the manuscript. All authors contributed to the article and approved the submitted version.
The research was supported by the National Natural Science Foundation of China (32060300, 32060145, and 31860308), International Science and Technology Cooperation Project of Bingtuan (2020BC002), the China Scholarship Council and the Science Foundation of Shihezi University (RCZK201953). The funders had no role in the study design, data collection and analysis, decision to publish, or preparation of the manuscript.
The authors declare that the research was conducted in the absence of any commercial or financial relationships that could be construed as a potential conflict of interest.
All claims expressed in this article are solely those of the authors and do not necessarily represent those of their affiliated organizations, or those of the publisher, the editors and the reviewers. Any product that may be evaluated in this article, or claim that may be made by its manufacturer, is not guaranteed or endorsed by the publisher.
The Supplementary Material for this article can be found online at: https://www.frontiersin.org/articles/10.3389/fgene.2023.1097381/full#supplementary-material
SUPPLEMENTARY FIGURE S1 | Soft threshold analysis result.
SUPPLEMENTARY FIGURE S2 | Volcano plot of differentially expressed genes.
SUPPLEMENTARY TABLE S1 | Median Absolute Deviation (MAD) analysis results.
SUPPLEMENTARY TABLE S2 | Regulatory relationship between genes and transcription factors in red module.
SUPPLEMENTARY TABLE S3 | Regulatory relationship between genes and transcription factors in black module.
SUPPLEMENTARY TABLE S4 | Regulatory relationship between genes and transcription factors in blue module.
SUPPLEMENTARY TABLE S5 | The gene list and regulatory relationship that can regulate BPC6 in Arabidopsis.
SUPPLEMENTARY TABLE S6 | The target gene and regulatory relationship of BPC6 in Arabidopsis.
SUPPLEMENTARY TABLE S7 | Results of gene differential expression analysis.
SUPPLEMENTARY TABLE S8 | Detailed information about GEO data.
Argueso, C. T., Raines, T., and Kieber, J. J. (2010). Cytokinin signaling and transcriptional networks. Curr. Opin. plant Biol. 13 (5), 533–539. doi:10.1016/j.pbi.2010.08.006
Carella, P. (2020). Stop the FUSS: BPCs restrict FUSCA3 transcription to promote ovule and seed development. Plant Cell 32 (6), 1779–1780. doi:10.1105/tpc.20.00295
Cha, J. Y., Kang, S. H., Ali, I., Lee, S. C., Ji, M. G., Jeong, S. Y., et al. (2020). Humic acid enhances heat stress tolerance via transcriptional activation of Heat-Shock Proteins in Arabidopsis. Sci. Rep. 10 (1), 15042. doi:10.1038/s41598-020-71701-8
Chi, W. T., Fung, R. W., Liu, H. C., Hsu, C. C., and Charng, Y. Y. (2009). Temperature-induced lipocalin is required for basal and acquired thermotolerance in Arabidopsis. Plant Cell Environ. 32 (7), 917–927. doi:10.1111/j.1365-3040.2009.01972.x
Gao, S., Xiao, Y., Xu, F., Gao, X., Cao, S., Zhang, F., et al. (2019). Cytokinin-dependent regulatory module underlies the maintenance of zinc nutrition in rice. New Phytol. 224 (1), 202–215. doi:10.1111/nph.15962
Gong, Z. Z., Xiong, L. M., Shi, H. Z., Yang, S., Herrera-Estrella, L. R., Xu, G., et al. (2020). Plant abiotic stress response and nutrient use efficiency. Sci. China Life Sci. 63 (5), 635–674. doi:10.1007/s11427-020-1683-x
Guan, Q., Wu, J., Zhang, Y., Jiang, C., Liu, R., Chai, C., et al. (2013). A DEAD box RNA helicase is critical for pre-mRNA splicing, cold-responsive gene regulation, and cold tolerance in Arabidopsis. Plant Cell 25 (1), 342–356. doi:10.1105/tpc.112.108340
Guan, Q., Yue, X., Zeng, H., and Zhu, J. (2014). The protein phosphatase RCF2 and its interacting partner NAC019 are critical for heat stress-responsive gene regulation and thermotolerance in Arabidopsis. Plant Cell 26 (1), 438–453. doi:10.1105/tpc.113.118927
Gupta, B., and Huang, B. (2014). Mechanism of salinity tolerance in plants: Physiological, biochemical, and molecular characterization [J]. Int. J. Genomics 2014 (1), 701596.
Hara, M., and Kurita, I. (2014). The natural alkaloid sanguinarine promotes the expression of heat shock protein genes in Arabidopsis. Acta Physiol. Plant. 36 (12), 3337–3343. doi:10.1007/s11738-014-1681-y
He, F., Jiuqing, K. A. N. G., Zhou, X., Su, Z., Qu, L., and Gu, H. (2008). Variation at the transcriptional level among Chinese natural populations of Arabidopsis thaliana in response to cold stress. Chin. Sci. Bull. 19, 2989–2999. doi:10.1007/s11434-008-0403-5
Hecker, A., Brand, L. H., Peter, S., Simoncello, N., Kilian, J., Harter, K., et al. (2015). The Arabidopsis GAGA-binding factor BASIC PENTACYSTEINE6 recruits the POLYCOMB-REPRESSIVE COMPLEX1 component LIKE HETEROCHROMATIN PROTEIN1 to GAGA DNA motifs. Plant Physiol. 168 (3), 1013–1024. doi:10.1104/pp.15.00409
Hu, Y., Jiang, L., Wang, F., and Yu, D. (2013). Jasmonate regulates the inducer of cbf expression-C-repeat binding factor/DRE binding factor1 cascade and freezing tolerance in Arabidopsis. Plant Cell 25 (8), 2907–2924. doi:10.1105/tpc.113.112631
Hu, Z., Song, N., Zheng, M., Liu, X., Liu, Z., Xing, J., et al. (2015). Histone acetyltransferase GCN5 is essential for heat stress-responsive gene activation and thermotolerance in Arabidopsis. Plant J. 84 (6), 1178–1191. doi:10.1111/tpj.13076
Kilian, J., Whitehead, D., Horak, J., Wanke, D., Weinl, S., Batistic, O., et al. (2007). The AtGenExpress global stress expression data set: Protocols, evaluation and model data analysis of UV-B light, drought and cold stress responses. Plant J. 50 (2), 347–363. doi:10.1111/j.1365-313X.2007.03052.x
Meister, R. J., Williams, L. A., Monfared, M. M., Gallagher, T. L., Kraft, E. A., Nelson, C. G., et al. (2004). Definition and interactions of a positive regulatory element of the Arabidopsis INNER NO OUTER promoter. Plant J. 37 (3), 426–438. doi:10.1046/j.1365-313x.2003.01971.x
Mu, Y., Zou, M., Sun, X., He, B., Xu, X., Liu, Y., et al. (2017). BASIC PENTACYSTEINE proteins repress ABSCISIC ACID INSENSITIVE4 expression via direct recruitment of the polycomb-repressive complex 2 in Arabidopsis root development. Plant Cell Physiol. 58 (3), 607–621. doi:10.1093/pcp/pcx006
Ogneva, Z. V., Suprun, A. R., Dubrovina, A. S., and Kiselev, K. V. (2019). Effect of 5-azacytidine induced DNA demethylation on abiotic stress tolerance in Arabidopsis thaliana. Plant Prot. Sci. 55 (2), 73–80. doi:10.17221/94/2018-pps
Rosa-Tellez, S., Anoman, A. D., Alcantara-Enguidanos, A., Garza-Aguirre, R. A., Alseekh, S., and Ros, R. (2020). PGDH family genes differentially affect Arabidopsis tolerance to salt stress. Plant Sci. 290, 110284. doi:10.1016/j.plantsci.2019.110284
Roscoe, T. J., Vaissayre, V., Paszkiewicz, G., Clavijo, F., Kelemen, Z., Michaud, C., et al. (2019). Regulation of FUSCA3 expression during seed development in Arabidopsis. Plant Cell Physiol. 60 (2), 476–487. doi:10.1093/pcp/pcy224
Sabagh, A. E., Islam,, M. S., Skalicky, M., Raza, M. A., Singh, K., Hossain, M. A., et al. (2021). Salinity stress in wheat (Triticum aestivum L.) in the changing climate: Adaptation and management strategies [J]. Front. Agron. doi:10.3389/fagro.2021.661932
Santi, L., Wang, Y. M., Stile, M. R., Berendzen, K., Wanke, D., Roig, C., et al. (2003). The GA octodinucleotide repeat binding factor BBR participates in the transcriptional regulation of the homeobox gene Bkn3. Plant J. 34 (6), 813–826. doi:10.1046/j.1365-313x.2003.01767.x
Shanks, C. M., Hecker, A., Cheng, C. Y., Brand, L., Collani, S., Schmid, M., et al. (2018). Role of BASIC PENTACYSTEINE transcription factors in a subset of cytokinin signaling responses. Plant J. 95 (3), 458–473. doi:10.1111/tpj.13962
Shi, H., Wang, X., Ye, T., Chen, F., Deng, J., Yang, P., et al. (2014). The cysteine2/histidine2-type transcription factor zinc finger of arabidopsis THALIANA6 modulates biotic and abiotic stress responses by activating salicylic acid-related genes and C-REPEAT-BINDING factor genes in Arabidopsis. Plant Physiol. 165 (3), 1367–1379. doi:10.1104/pp.114.242404
Simonini, S., and Kater, M. M. (2014). Class I BASIC PENTACYSTEINE factors regulate HOMEOBOX genes involved in meristem size maintenance. J. Exp. Bot. 65 (6), 1455–1465. doi:10.1093/jxb/eru003
Simonini, S., Roig-Villanova, I., Gregis, V., Colombo, B., Colombo, L., and Kater, M. M. (2012). Basic pentacysteine proteins mediate MADS domain complex binding to the DNA for tissue-specific expression of target genes in Arabidopsis. Plant Cell 24 (10), 4163–4172. doi:10.1105/tpc.112.103952
Wan, X., Peng, L., Xiong, J., Li, X., Wang, J., Li, X., et al. (2019). AtSIBP1, a novel BTB domain-containing protein, positively regulates salt signaling in Arabidopsis thaliana. J. Plants (Basel) 8 (12), 573. doi:10.3390/plants8120573
Wu, J., Mohamed, D., Dowhanik, S., Petrella, R., Gregis, V., and Li, J. (2020). Spatiotemporal restriction of FUSCA3 expression by class I BPCs promotes ovule development and coordinates embryo and endosperm growth [J]. Plant Cell 32 (6), 1886–1887. doi:10.1111/head.13881
Keywords: arabidopsis, BPC, abiotic stress, transcription factor, enrichment of function
Citation: Zhang Z, Zhang T and Ma L (2023) Analysis of basic pentacysteine6 transcription factor involved in abiotic stress response in Arabidopsis thaliana. Front. Genet. 14:1097381. doi: 10.3389/fgene.2023.1097381
Received: 13 November 2022; Accepted: 06 April 2023;
Published: 17 April 2023.
Edited by:
Mallana Gowdra Mallikarjuna, Indian Agricultural Research Institute (ICAR), IndiaReviewed by:
Hou-Ling Wang, Beijing Forestry University, ChinaCopyright © 2023 Zhang, Zhang and Ma. This is an open-access article distributed under the terms of the Creative Commons Attribution License (CC BY). The use, distribution or reproduction in other forums is permitted, provided the original author(s) and the copyright owner(s) are credited and that the original publication in this journal is cited, in accordance with accepted academic practice. No use, distribution or reproduction is permitted which does not comply with these terms.
*Correspondence: Tingting Zhang, enRpbmdAc2h6dS5lZHUuY24=; Lei Ma, bWFsZWkxOTc5QGhvdG1haWwuY29t
Disclaimer: All claims expressed in this article are solely those of the authors and do not necessarily represent those of their affiliated organizations, or those of the publisher, the editors and the reviewers. Any product that may be evaluated in this article or claim that may be made by its manufacturer is not guaranteed or endorsed by the publisher.
Research integrity at Frontiers
Learn more about the work of our research integrity team to safeguard the quality of each article we publish.