 Habib Rainier Vihotogbe Whannou1
 Martin Spanoghe2
 Guiguigbaza-Kossigan Dayo3
 Dominique Demblon4
 Deborah Lanterbecq2
 Luc Hippolyte Dossa1*
- 1Ecole des Sciences et Techniques de Production Animale, Faculté des Sciences Agronomiques, Université d’Abomey-Calavi, Cotonou, Benin
- 2Laboratory of Biotechnology and Applied Biology, Haute Ecole Provinciale de Hainaut-Condorcet, Hainaut, Belgium
- 3Centre International de Recherche-Développement sur l’Elevage en Zone Subhumide (CIRDES), Bobo-Dioulasso, Burkina Faso
- 4Haute Ecole Provinciale de Hainaut-Condorcet, Hainaut, Belgium
Improved knowledge of the diversity within and among local animal populations is increasingly necessary for their sustainable management. Accordingly, this study assessed the genetic diversity and structure of the indigenous goat population of Benin. Nine hundred and fifty-four goats were sampled across the three vegetation zones of Benin [i.e., Guineo-Congolese zone (GCZ), Guineo-Sudanian zone (GSZ), and Sudanian zone (SZ)] and genotyped with 12 multiplexed microsatellite markers. The genetic diversity and structure of the indigenous goat population of Benin were examined using the usual genetic indices (number of alleles Na, expected and observed heterozygosities He and Ho, Fixation index FST, coefficient of genetic differentiation GST), and three different methods of structure assessment [Bayesian admixture model in STRUCTURE, self-organizing map (SOM), and discriminant analysis of principal components (DAPC)]. The mean values of Na (11.25), He (0.69), Ho (0.66), FST (0.012), and GST (0.012) estimated in the indigenous Beninese goat population highlighted great genetic diversity. STRUCTURE and SOM results showed the existence of two distinct goat groups (Djallonké and Sahelian) with high crossbreeding effects. Furthermore, DAPC distinguished four clusters within the goat population descending from the two ancestry groups. Clusters 1 and 3 (most individuals from GCZ) respectively showed a mean Djallonké ancestry proportion of 73.79% and 71.18%, whereas cluster 4 (mainly of goats from SZ and some goats of GSZ) showed a mean Sahelian ancestry proportion of 78.65%. Cluster 2, which grouped almost all animals from the three zones, was also of Sahelian ancestry but with a high level of interbreeding, as shown by the mean membership proportion of only 62.73%. It is therefore urgent to develop community management programs and selection schemes for the main goat types to ensure the sustainability of goat production in Benin.
1 Introduction
West African countries are characterized in general by high variability in farm animal genetic resources (Molina-Flores et al., 2020). Concerning goat species, Benin’s neighboring countries have remarkably diversified indigenous goat breeds, defined by different ecotypes of West African Dwarf goats (WAD, also named Djallonké goats) found in fifteen West and Central African countries including Togo, Burkina Faso, and Nigeria (Wilson, 1991; Awobajo et al., 2015); Red Sokoto goats in Niger and Nigeria, and a large population of Sahelian goat breeds in Mali, Niger, Burkina Faso and Nigeria (Wilson, 1991). In addition, some exotic goat breeds are also introduced into these countries such as the Boer and Kalahari goats imported into Niger (FAO, 2007). This pool of goat breeds from Benin’s neighboring countries certainly influences the genetic diversity of the indigenous Beninese goat population whose genetic diversity has not been documented to date, unlike that of other African countries like Nigeria (Awobajo et al., 2015; Ojo et al., 2018), Ghana (Ofori et al., 2021), and Burkina Faso (Traoré et al., 2009). Indeed, the previous characterization studies conducted on this species in Benin have been limited to documenting the existing between- and within-species morphological variability (Dossa et al., 2007; Kouato et al., 2021; Whannou et al., 2021) and, habitat suitability modeling of the goat population of Benin under climate change scenarios (Whannou et al., 2022). Thus, there remains a need to determine the genetic diversity within and among this indigenous goat population at the molecular level to optimize their management. Such a study is a response to the Food and Agriculture Organization of the United Nations (FAO, 2012) exhortation to document both phenotypic and molecular diversity of animal genetic resources for better knowledge and definition of policies for their sustainable management. Regarding molecular genetic characterization, different tools, including microsatellite markers, and single-nucleotide polymorphism (SNP) chips have been developed with advances in technology for a better exploration or analysis of the genome. However, although SNPs are highly informative and more nowadays recommended for population genetics studies, their accessibility remains limited, especially in developing countries due to the high costs associated with using this high-definition technology (e.g., cost of chips, high-level infrastructure, and equipment required, and continuous energy power) (Laoun et al., 2020). In contrast, microsatellite markers are less expensive, especially if they are multiplexed, and have demonstrated worldwide their ability to assess diversity in animal population genetics (Ben Sassi-Zaidy et al., 2022). This amply justifies their use in numerous genetic diversity studies conducted in the last years on different species including cattle (Msanga et al., 2012; Gororo et al., 2018; Demir and Balcioğlu, 2019), pigs (Djimènou et al., 2021) and small ruminants (Missohou et al., 2011; Mekuriaw, 2016; Ravimurugan, 2017; Ojo et al., 2018; Dayo et al., 2022). Therefore, microsatellite markers are still highly useful for preliminary studies of the diversity of populations that have never been characterized using molecular tools (Laoun et al., 2020). In such a context, the genetic diversity of the indigenous Beninese goat population could be better documented using microsatellite markers as only phenotype-related information has been reported so far. On the one hand, it should be noted that a review of previous knowledge on the diversity of goat breeds present in Benin has reported the cohabitation of a multitude of West African local breeds such as WAD/Djallonké, Red Sokoto or Maradi, Sahelian (Hounzangbe-Adode et al., 2011; Molina-Flores et al., 2020), and exotic breeds like Alpine and Saanen goats (Hounzangbe-Adode et al., 2011). On the other hand, the most recent study (Whannou et al., 2022) that addressed the phenotypic diversity of the local Beninese goat population revealed the existence of high diversity within and among this indigenous goat population. Moreover, two major groups of goats have been reported within the three vegetation zones (i.e., one group of small individuals mainly in the Guinean-Congolese zone in the South and another group of relatively large goats from the Guinean-Sudanese zone in central Benin to the Sudanese zone in northern Benin).
Hence, this study investigated the genetic diversity and structure of the indigenous goat population in Benin using microsatellite markers to allow a clear identification of breed groups or genetic types and to confirm or refute the phenotypic diversity aforementioned.
2 Materials and methods
2.1 Sampling procedure
To address the genetic base and structuring of the indigenous goat population of Benin, nine hundred and fifty-four (n = 954) randomly sampled goat hair from the three vegetation zones of Benin and used in a previous morphological characterization study (Whannou et al., 2022), were selected from a sample library (N = 2,114). These hair samples were selected from unrelated animals using the information provided by goat farmers on their animals. Some characteristics of these vegetation zones i.e., humidity index, soil characteristics, and predominant vegetation, can be found in Whannou et al. (2022). The vegetation zones are further subdivided into phytogeographic zones. The minimum sample size was about 286 individuals per vegetation zone and 92 individuals per phytogeographic zone. These samples were labeled, packaged, and transported to the laboratory in Belgium (CARAH, Ath, Hainaut) for DNA extraction and genotyping.
2.2 DNA extraction and genotyping
DNA was extracted from hair samples following the standard instructions described for the Qiagen DNeasy Blood and Tissue Kit used. Each DNA sample was then quantified using a NanoDrop ND-3300 fluorospectrometer device (Thermo Scientific; Waltham, MA, United States).
The genotyping analysis was performed with 15 μL of template DNA using the multiplex kit of 12 microsatellite markers and the PCR protocol developed by Spanoghe et al. (2022). The fragment lengths of the PCR products were estimated with the GeneMapper Software 6.0 (Applied Biosystems). They were then used to construct a genotypic dataset for statistical analyses.
2.3 Statistical analysis
2.3.1 Genetic diversity assessment
The number of alleles (Na), the effective number of alleles (Nae), observed (Ho) and expected (He) heterozygosities, and Polymorphic Information Content (PIC) of each microsatellite marker were first estimated from the dataset (n = 954) using the Cervus software v 3.0 (Kalinowski et al., 2007). These statistics were addressed to assess the performance of the loci and to describe the genetic diversity of the Beninese goat population. F-statistic indices (FIS, FST, FIT) (Wright, 1969; Weir and Cockerham, 1984), the coefficient of gene differentiation (GST), and Nei’s genetic distance (Nei, 1978) were then computed using the program SPAGeDi 1.5 days (Hardy and Vekemans, 2002) to assess the genetic variability existing within (intra-) and among (inter-) vegetation zones.
Additionally, an analysis of molecular variance (AMOVA) was performed to assess the partition of genetic variation between (inter-) and within (intra-) the goat groups (Excoffier et al., 1992; Paradis, 2010).
2.3.2 Genetic clustering analyses of the goat population under study
Three methods were used to estimate the genetic clustering of the goat samples of Benin and their genetic relationship.
First, the genetic structure of the indigenous goat population was analyzed using the Bayesian admixture approach in the STRUCTURE software 2.3.4 (Pritchard et al., 2000). The ancestry proportion was inferred from the genotypic dataset using correlated allele frequencies, a burn-in period of 50,000 iterations followed by 100,000 Markov Chain Monte Carlo (MCMC) for each number of possible clusters (K). As genotyping information for the assumed parent population was not available, we hypothesized K unknown populations of parents with k varying from 1 to 10, and three independent replicates (Negrini et al., 2012). The probable number K of ancestral populations and substructures was identified according to Evanno et al. (2005) and the obtained posterior probability values (Pritchard et al., 2000). The representation of the data was then performed using Structure Plot (Ramasamy et al., 2014), and the geographic distribution of the main genotype of goats across the vegetation and phytogeographic zones of Benin was mapped using the Q matrix out-put.
Second, the non-linear relationships of the genotypic data were estimated using the Self-Organizing Map (SOM) method (Kohonen, 1982; 2001) under unsupervised learning rules and based on the model of vegetation zones of Benin (See Spanoghe et al., 2020 for a full description of the method).
Third, Discriminant Analysis of Principal Components (DAPC) (Jombart, 2008; Jombart et al., 2010) was applied to the genotypic dataset to infer the relationship of goat individuals, while maximizing among-group variation and minimizing within-group variation. Unsupervised k-means clustering was first used through the “find.clusters” function of the R package adegenet version 2.1.1 (Jombart, 2008) to estimate the probable number of clusters existing in the Beninese goat population. The number of clusters (K) was then defined after a comparison of Bayesian Information Criterion (BIC) values (Jombart, 2008; Jombart and Ahmed, 2011). The resultant clusters were plotted in a scatterplot after the determination of the number of principal components (PCs) with associated linear discriminants (LD) using the cross-validation function “Xval.dapc” in the R package adegenet.
Finally, the genetic variation existing within and among the inferred goat groups from genetic clustering with DAPC was estimated using the genetic parameters previously calculated in the first section of Statistic analysis (i.e., Genetic diversity assessment).
3 Results
3.1 Genetic diversity of the indigenous goat population from Benin
The different genetic indices Na, He, Ho, PIC, FIS, FST, FIT, and GST estimated from the Beninese goat dataset are presented in Table 1. Overall, 135 alleles were identified in the dataset with the multiplex of 12 microsatellite markers, with an average of 11.25 alleles per locus. The lowest Na (4) was recorded for the ILSTS5 locus, and the highest Na (23) was detected for the MAF065 locus. The average values of He and Ho were 0.66 and 0.69, respectively. The PIC ranged from 0.14 (ILSTS5) to 0.80 (SCRSP9 and CSRD247) with an average value of 0.66. The mean values of FST, FIT, FIS, and GST were 0.012, 0.047, 0.035, and 0.012 respectively.
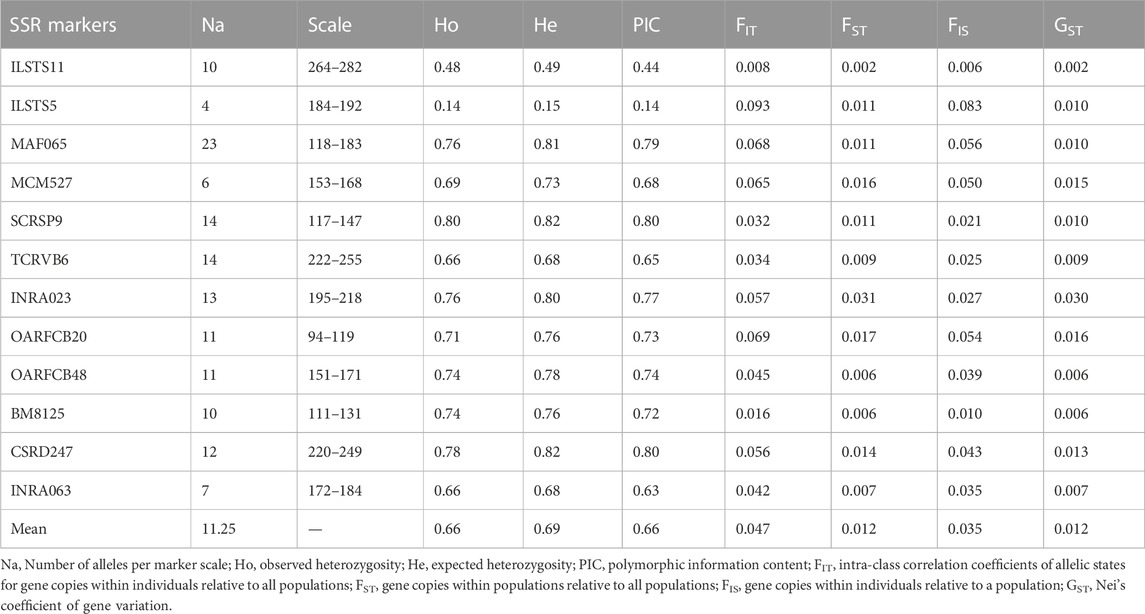
TABLE 1. Genetic diversity indices calculated for 12 SSR markers in 954 goat datasets sampled in the three vegetation zones of Benin.
The AMOVA results (Table 2) show that only 2.11% of the genetic variation of the Beninese goat population was observed between vegetation zones; the highest genetic variation (97.89%) resided within vegetation zones. Using the vegetation zones as a model of structuring (Table 3), Na ranged from 9.08 (GCZ) to 10.08 (GSZ), with a mean value of 9.55. SZ and GSZ showed the highest values of He (0.70 and 0.69, respectively) and Ho (0.67 for both vegetation zones) as well as the highest FIS values (0.05 and 0.04, respectively). The highest pairwise FST (0.021) and Nei’s genetic distance (0.047) were recorded between GCZ and SZ, whereas the lowest FST (0.006) and Nei’s genetic distance (0.013) were observed between GSZ and SZ (Table 3). However, the pairwise FST and Nei’s genetic distances estimated between GCZ and GSZ were also low and seemed less different from those recorded between GSZ and SZ (Table 3).
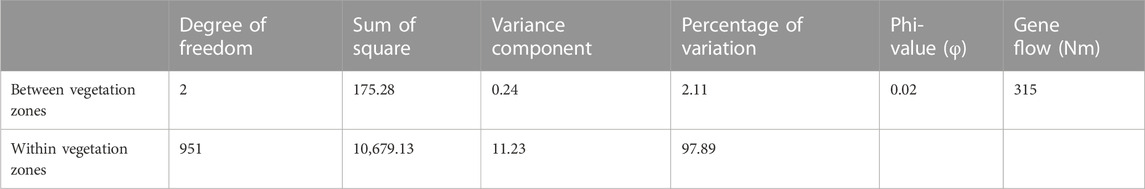
TABLE 2. Analysis of molecular variance (AMOVA) of the 954 goats within and among the three vegetation zones of Benin.
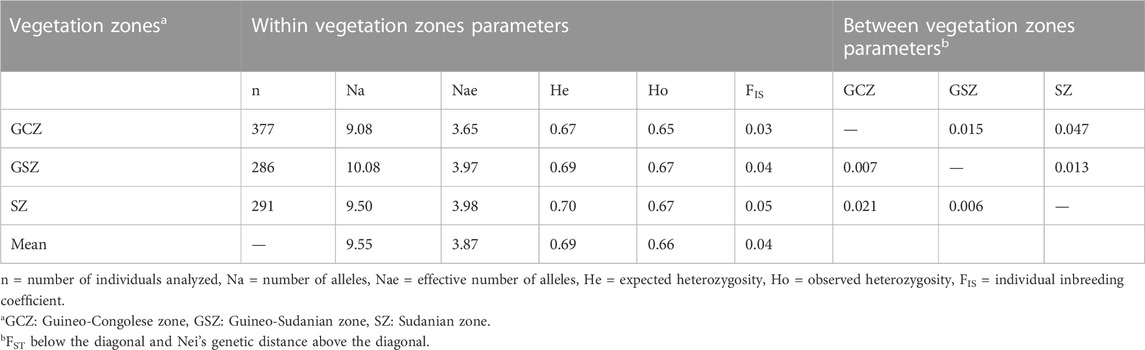
TABLE 3. Genetic diversity parameters of the 954 goats within and among the three vegetation zones of Benin.
3.2 Genetic structure of the indigenous goat population from Benin
The STRUCTURE results suggested the best grouping number (K = 2) based on the highest delta K value (53.17) resulting from the data (Supplementary Table S1; Supplementary Figure S1). The indigenous goat population of Benin was therefore composed of two ancestral genetic groups with different ancestry proportions of individuals. Overall, 50.20% of the population analyzed was estimated as Djallonké ancestry, whereas 49.80% was of Sahelian ancestry (Supplementary Table S2). The individuals’ membership proportion revealed some admixture, indicating that individuals share different proportions of the two distinct ancestral goat populations (i.e., Djallonké and Sahelian) (Figure 1). Considering that individuals presenting a membership proportion of more than 50% for ancestry population 1 (in green) were mainly ancestry of Djallonké and those that presented a membership proportion of more than 50% for ancestry population 2 (in blue) were mostly of Sahelian ancestry, it appeared that individuals from GCZ were predominantly of Djallonké ancestry, those of SZ were of Sahelian ancestry, whereas the GSZ predominantly included Sahelian genotypes (Figure 2). However, according to a smaller subdivision than vegetation zones i.e., the phytogeographic zones (Figure 3), a predominance of Djallonké ancestry was noted in the four phytogeographic zones of GCZ (i.e., CZ Coastal zone, PoZ Pobe zone, PlZ Plateau zone, and VOZ Oueme Valley zone), and the phytogeographic zone of the GSZ closest to the GCZ (i.e., ZZ Zou zone). In contrast, the two other phytogeographic zones of the GSZ (i.e., BZ Bassila zone, and BSZ Borgou-Sud zone) and the phytogeographic zones of the SZ (i.e., BNZ Borgou-Nord zone, CAZ Chaîne Atacora zone, and MPZ Mekrou-Pendjari zone) gathered mostly goats with predominant Sahelian ancestry (Figure 3).
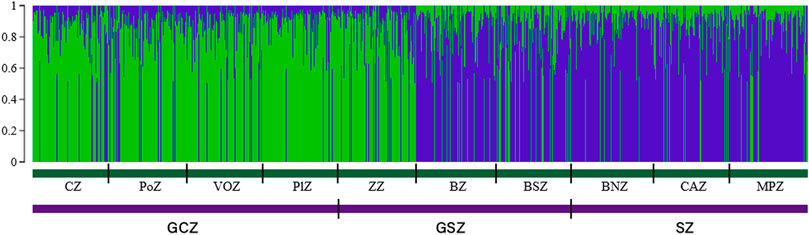
FIGURE 1. Goat population structure determined by STRUCTURE 2.3. Estimated histogram of the population structure with two ancestral populations (K = 2). Each vertical bar represents one individual in the population based on the percentage of group membership, into the 2 inferred subpopulations.
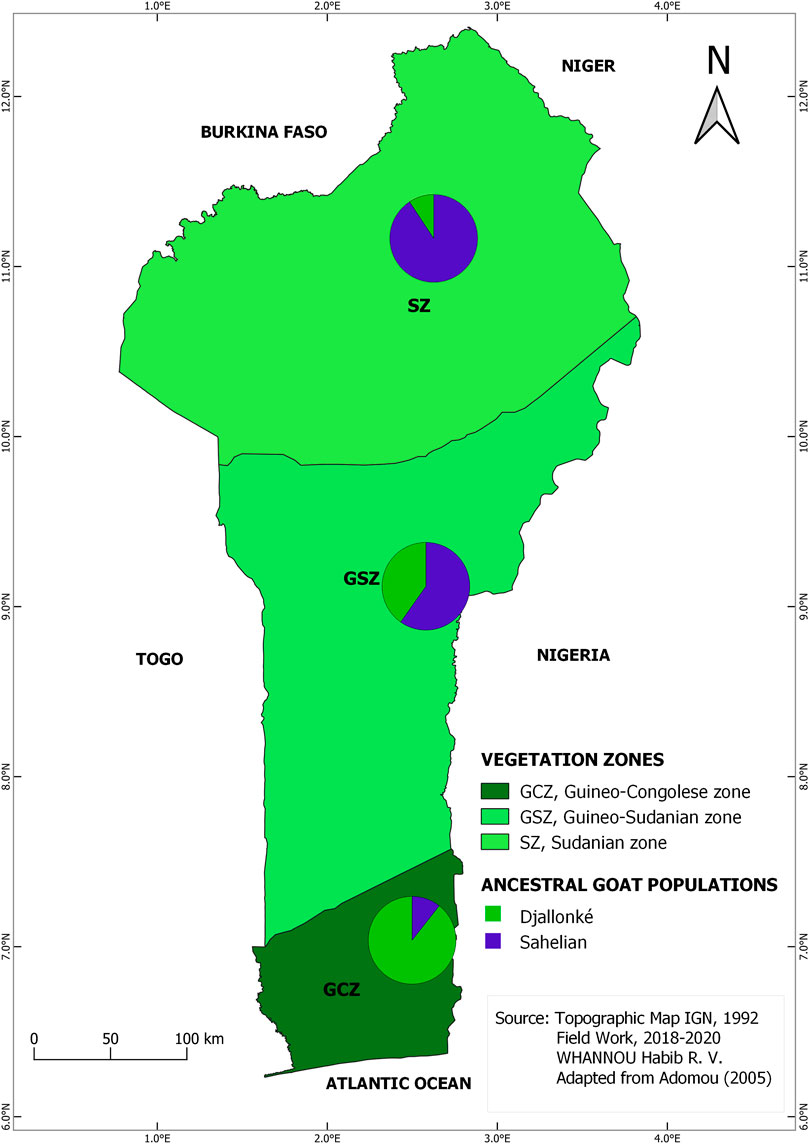
FIGURE 2. Map of the spatial distribution of the two inferred ancestral populations based on membership assignment from the population structure analysis following vegetation zones pattern.
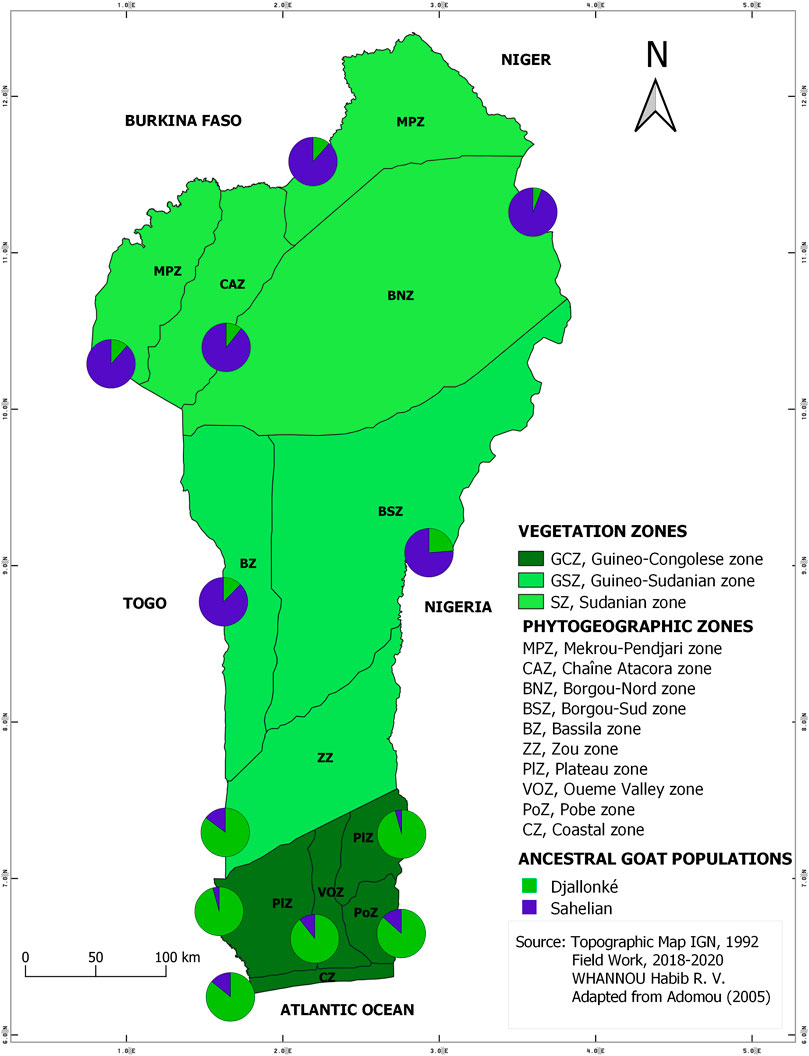
FIGURE 3. Map of the spatial distribution of the two inferred ancestral populations based on membership assignment from the population structure analysis following vegetation and phytogeographic zones patterns.
Furthermore, when the log-likelihood of the data Ln P(D) was plotted against K, the average log-likelihood of the data Ln P(D) increased up to K = 4, followed by a serrated decrease to K = 9 (Supplementary Figure S2). The run with the highest Ln P(D) was thus observed at K = 4 suggesting a structuration of the goat population under study into four subpopulations. The STRUCTURE plot for K = 4 (Figure 4) indicated the existence of two goat subpopulations of Djallonké distributed from the humid zone of South Benin (GCZ) to the first phytogeographic zone (i.e., ZZ) of the transitional vegetation zone in Central Benin (GSZ). Two other subpopulations of goats sharing mostly Sahelian ancestry were observed from the remaining two phytogeographic zones of the GSZ (i.e., BZ, and BSZ) to the drier Sudanian vegetation zone (SZ) in North Benin (Figure 4).
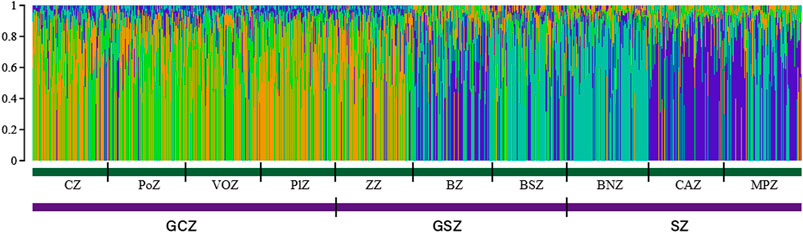
FIGURE 4. Goat population structure determined by STRUCTURE 2.3. Estimated histogram of the population structure with two ancestral populations (K = 4). Each vertical bar represents one individual in the population based on the percentage of group membership, into the 4 inferred subgroups.
SOM analysis showed the neural assignment of individuals on the network (Figure 5). The structuring of the goat population in the different vegetation zones seems rather diffuse and scattered since all neurons are occupied whatever the vegetation zones. Nevertheless, individuals from GCZ were mostly concentrated in left neurons in the network, while SZ individuals were mostly clustered in right neurons in the network. GSZ individuals, although widely distributed across grid neurons, appeared more concentrated in left and some upper right neurons.
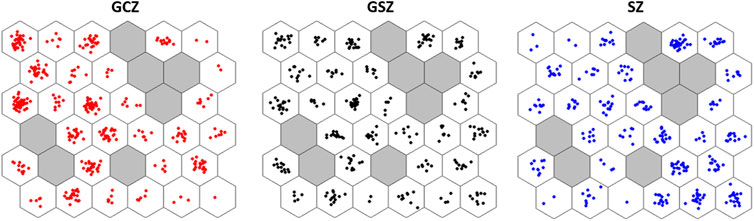
FIGURE 5. Distribution of the genotyped goats on the SOM network according to the assignment of each of the vegetation zone groups. Each colored dot corresponds to a goat individual. The plots express individual’s assignment by emphasizing vegetation zone models where GCZ: Guineo-Congolese zone, GSZ: Guineo-Sudanian zone, and SZ: Sudanian zone.
The results of the unsupervised K-means clustering applied to the dataset prior to DAPC showed BIC values that decreased between K = 2 and K = 8 where they reach the lowest value of BIC (Supplementary Figure S3). Thus, any K value between 2 and 8 could be considered as the number of clusters present in the Beninese goat population. However, when plotting each probable clustering from 2 to 8, a distinction of goat clusters was first observed at K = 4. Indeed, all the previous K (i.e., K = 5, K = 6, K = 7, and K = 8) showed many overlaps and representation of four probable goat groups in the dataset (Supplementary Figures S4–S7). Thus, four genetic clusters were considered the most probable groups fitting the structure of the indigenous goat population from Benin. DAPC analysis was carried out to assess the sub-clusters at K = 4. After the cross-validation step, the 45 first PCs (85% of variance conserved) of PCA and two discriminant eigenvalues were retained. The resulting scatterplot (Figure 6) showed the separation between clusters 1 and 3 (which consisted mainly of individuals from GCZ) and clusters 2 and 4 (which consisted mainly of individuals from SZ and GSZ) concerning LD1. Furthermore, clusters 1 and 3 were distinct from clusters 2 and 4, respectively, with respect to LD2. Table 4 presents the composition of the goat clusters identified within the three vegetation zones of Benin.
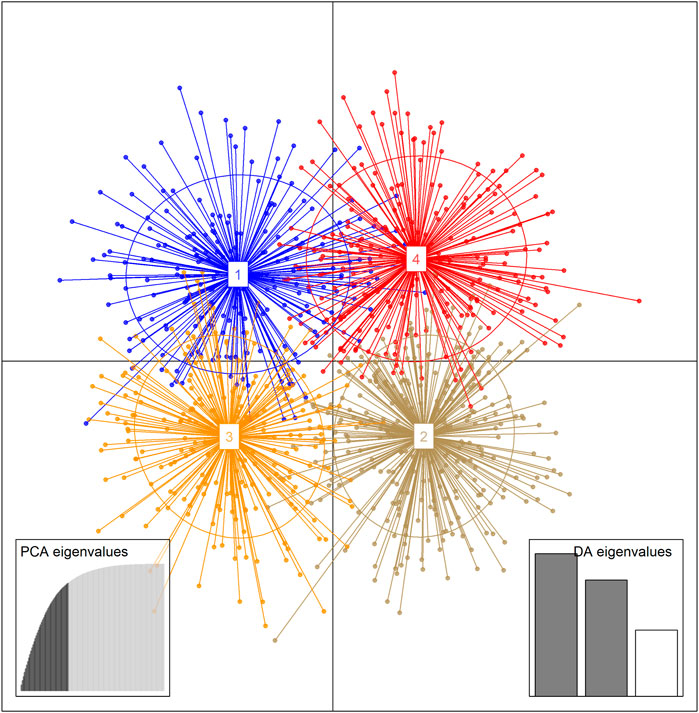
FIGURE 6. Scatterplot of the first two Linear Discriminants (LD) showing genetic clusters for 954 indigenous goat sampled in the three vegetation zones of Benin applying unsupervised Discriminant Analysis of Principal Components (DAPC). Each ellipse represents a priori cluster and each dot an individual.
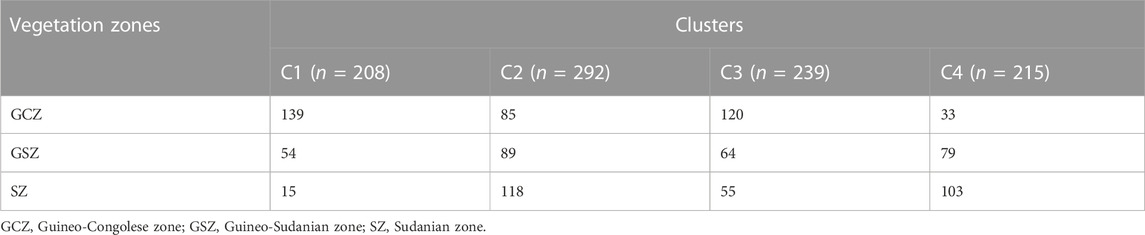
TABLE 4. Genetic clusters inferred for 954 goats from the three vegetation zones of Benin by applying the unsupervised discriminant analysis of principal components (DAPC).
Additionally, when comparing the individuals of inferred DAPC clusters with membership proportions of ancestral goat groups resulting from STRUCTURE (Table 5), it was estimated that individuals of cluster 1 (C1) and cluster 3 (C3) were mainly of Djallonké ancestry with the mean proportion of 73.79% and 71.18%, respectively, while goats of cluster 2 (C2) and cluster 4 (C4) were of Sahelian ancestry with a mean proportion of 62.73% and 78.65%, respectively.
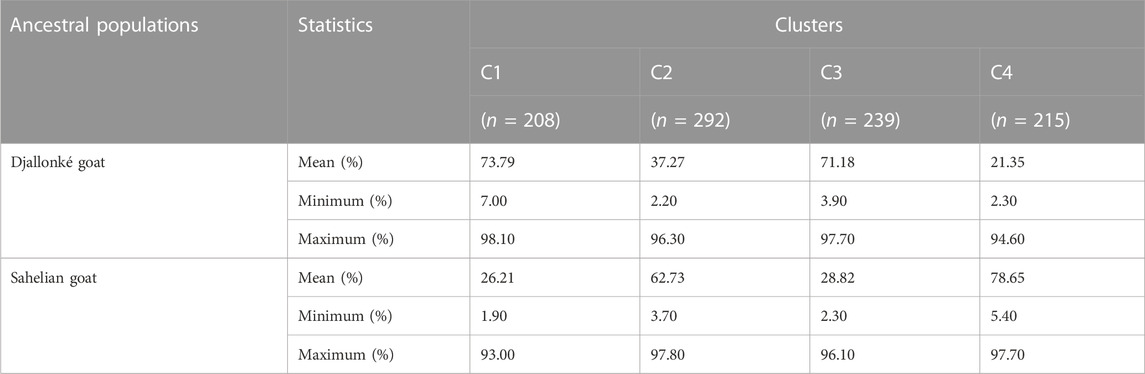
TABLE 5. Mean, minimum, and maximum of ancestral proportions (estimated in structure) for the clusters inferred with the unsupervised clustering in DAPC in the sampled goat population (N = 954).
3.3 Genetic diversity of the estimated DAPC clusters
Table 6 presents the genetic variation within and among the estimated DAPC clusters. Na within the four inferred DAPC clusters ranged between 8.92 (C1) and 10.08 (C2) with an average value of 11.25. Nae ranged between 3.43 (C1) and 3.77 (C2 and C4) with a mean value of 3.93. However, clusters C4 and C2 showed high degrees of He (0.69 and 0.68, respectively) and Ho (0.67 for both clusters) compared with C1 (He = 0.64, Ho = 0.65) and C3 (He = 0.65, Ho = 0.65) that recorded the lowest values. FIS recorded within the clusters ranged between −0.01 (C1) and 0.03 (C4) with a mean value of 0.04. Considering the FST values recorded between the inferred DAPC clusters, the highest FST value (0.06) was estimated between C3 and C4. A similar FST value (0.04) was recorded between the pairs (C1-C3, C1-C4, C2-C3, and C2-C4). Additionally, a low Nei’s genetic distance was recorded between C1 and C3, whereas a high distance was estimated between C3 and C4, but smaller than that recorded between C1 and C3.
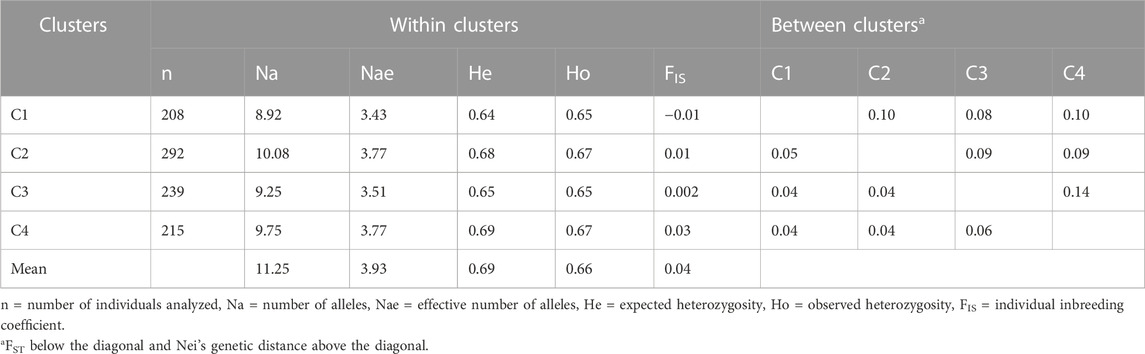
TABLE 6. Genetic diversity parameters of the inferred clusters from the Beninese goat population (N = 954).
4 Discussion
This study constitutes the first one performed on the genetic diversity within the goat population of Benin. All the microsatellite loci used in this study were informative because they recorded at least 4 alleles (Barker et al., 2001) and most of them obtained high PIC values (PIC>0.50) (Arora et al., 2010; Botstein et al., 1980). Regarding the genetic diversity indices estimated, the mean values of Na (11.25), He (0.69), Ho (0.66), and PIC (0.66) recorded in this study revealed a high genetic diversity within the goat population of Benin (Kumar et al., 2009; Jawasreh et al., 2018; Mihailova, 2021). The average Ho (0.66) obtained is higher than that reported for the Ardi goat from the Saudi Arabia Kingdom (0.55) (Aljumaah et al., 2012), the Nigerian West African Dwarf goat (0.60) (Awobajo et al., 2015), and the Nigerian indigenous goat population (0.61) (Ojo et al., 2018). However, it is lower than the mean Ho value (0.84) reported for four Algerian goat breeds (Tefiel et al., 2018). The mean value of PIC (0.66) obtained in this study was lower than values reported in Indian goat breeds (0.77) (Dixit et al., 2012), in Nigerian West African Dwarf goats (0.69) (Awobajo et al., 2015), and Algerian goat breeds (0.93) (Tefiel et al., 2018). Although the Beninese goat population appeared diverse, the low FIS (0.035) and FIT (0.047) values recorded suggest some inbreeding events in this population (Tolone et al., 2012). Indeed, a positive FIS value is generally considered as an indicator of heterozygosity deficit compared with Hardy-Weinberg equilibrium (Tefiel et al., 2018). Nevertheless, obtained values of FIS and FIT were lower than those (FIS = 0.090, FIT = 0.180) reported by Awobajo et al. (2015) (FIS = 0.105, FIT = 0.129) by Ojo et al. (2018) (FIS = 0.035, FIT = 0.063) by Traoré et al. (2009) in Burkina Faso goats, and to (FIS = 0.057, FIT = 0.102) reported by Tefiel et al. (2018) in the four Algerian goat breeds. This highlights the diversity of indigenous goat populations in Africa, and probably reflects the difference in the management of goat resources from one country to another.
The mean value of FST (0.012) obtained in this study was inferior to 0.05, indicating a very low genetic differentiation in the goat population of Benin. The coefficient of gene differentiation (GST) obtained with a mean value of 0.012 confirmed the limited genetic differentiation between vegetation zones. The result of the AMOVA applied to the dataset using vegetation zones as a like-effect of variation also confirmed this limited genetic differentiation. Therefore, the genetic differentiation of the Beninese goat population is intraspecific diversity, thus mainly due to the diversity between individuals within vegetation zones. The lack of genetic differentiation observed between vegetation zones is probably due to different factors including the proximity of production areas, similar extensive breeding practices in the different vegetation zones, but especially the gene flow that occurred between individuals of the main goat groups in the past. A similar finding has been reported by Tolone et al. (2012). The proximity of the breeding areas certainly favors the continuous exchange of breeds through the market system and other mechanisms developed by the different actors of the goat value chain, such as gifts. Moreover, the extensive breeding practices developed by goat breeders (notably the non-control of reproduction in most breeding areas) in all vegetation zones are probably also levers of diversity in the Beninese goat population and therefore favor the low genetic differentiation observed. In comparison to other studies, the average FST over loci (0.012) estimated in the Beninese goat population is lower than the value obtained in goat populations of Burkina Faso (0.035) (Traoré et al., 2009), Nigeria (0.10) (Awobajo et al., 2015) and (0.030) (Ojo et al., 2018), and Algeria (0.048) (Tefiel et al., 2018). Therefore, the indigenous goat population of Benin is less differentiated than those of other African countries.
The high mean values of Na, He, Ho, and FIS obtained in GSZ and SZ goat subpopulations when measuring the genetic diversity existing within and among the vegetation zones, underline that the goats of these vegetation zones are very diverse, but some individuals from these zones are also inbred. In a similar study, Tolone et al. (2012) also recorded high He and Na values within subpopulations or breed groups, with high FIS, and concluded a high genetic diversity within these subpopulations or breed groups. Furthermore, the highest values of pairwise FST and Nei’s genetic distance recorded between GCZ and SZ confirm that goats from these two vegetation zones are genetically different. In contrast, the lowest values of FST and Nei’s genetic distance obtained between GSZ and SZ suggest that goats from these zones are genetically close. However, some goats from GSZ would be also genetically closer to GCZ individuals, and their genetic proximity seems similar to that observed between GSZ and SZ, as shown by their near similarity between the indices of genetic differentiation and the genetic distance of Nei’s (Table 3). These results suggest that GSZ is an intermediate subpopulation of goats with a high gene flow. In a recent study of phenotypic diversity, Whannou et al. (2022) stated that GCZ grouped mainly small-size goats, namely, Djallonké, whereas large and intermediate goat types (i.e., Sahelian and crossbreed goats) predominated in SZ and GSZ. Moreover, these authors argued that GSZ may be considered an interbreeding zone. Therefore, the current genetic findings agree to some extent with previous results on phenotypic diversity.
The investigation of the genetic structure of the Beninese goat population using three different methods (STRUCTURE, SOM, and DAPC) confirmed the aforementioned results. First, the STRUCTURE results confirmed the widely accepted existence of two existing ancestral populations of goats in Benin (Meyer, 2002; Dossa et al., 2007; Hounzangbé-Adote et al., 2011) with gene flows between these populations, as suggested by the most probable value of K = 2 groups and proportions of individuals’ assignment. Moreover, the STRUCTURE results showed that goats in GCZ and SZ were genetically more distant than that observed between GSZ and SZ. Indeed, GSZ grouped the two distinct goat genotypes. Second, SOM results supported the lower genetic differentiation existing between individuals from vegetation zones and suggested a distinction between goats from GCZ and those from SZ, but the closeness of individuals from GSZ to those of the two other distinct zones. Finally, the DAPC results that reveal the existence of four goat genetic clusters (C) in Benin according to both vegetation and phytogeographic zones, confirm the geographic distribution of goat types in Benin as previously defined based on morphology (Whannou et al., 2022). These results also show that the two main ancestral goat populations are highly crossed, with a critical purity degree of only 70% for the purest subpopulations (i.e., C1, C3, and C4) (Table 5). Considering these results, there is a risk of losing part of genetic diversity if no breeding policy is defined to maintain some pure individuals of the main goat types. Moreover, there are no reliable updated data on the population size of the different goat genetic types identified due to the lack of organization in the goat farming sector in Benin. As a result, the sustainability of goat resources in Benin would be threatened if crossbreeding practices continue anarchically on farms without measures being taken to conserve the predominant genetic types. New management policies for goat keeping in Benin are therefore essential to ensure their sustainable use and to face the challenges of current and future climate and societal changes. To achieve this, an inventory of goat genetic resources should be organized at the national level together with the elicitation of goat farmers’ preferences for goat breeds and production objectives and will allow the establishment of guidelines for maintaining the existing diversity within the goat population in Benin.
5 Conclusion
This study provides valuable data on the genetic diversity and structure of the indigenous goat population of Benin and fairly confirms the phenotypic diversity observed within this population. Indeed, the results highlighted the presence of two ancestral genetic groups of goats in Benin with a high level of interbreeding, particularly in GSZ. However, although the indigenous goat population of Benin is highly diverse, the pressure of poorly planned and controlled crossbreeding might threaten the sustainability of goat farming systems. With the current pressure of climate and societal changes, any threat to local goat resources should be prevented more than ever. Measures for the conservation and sustainable management of indigenous goat resources need to be taken involving the farmers who are the owners of these animal genetic resources. For instance, sensitization and training sessions could be organized to raise the awareness of farmers on the need to maintain farm animal genetic resources, to show them the importance and necessity of monitoring and organizing reproduction in their herds, and to remind them or strengthen their knowledge of the qualities of local breeds such as the trypanotolerance and prolificacy of the Djallonké goats with a view to establishing purebred breeding. In addition, the Beninese government should, in the long term, introduce breeding laws and policies to control the movement of animals both at the borders and within Beninese localities. Finally, conservation programs for the local breeds should be urgently set up.
Data availability statement
The original contributions presented in the study are included in the article/Supplementary Materials, further inquiries can be directed to the corresponding author.
Ethics statement
As part of the Ph.D. study of the first author, the research protocol was approved by the Scientific Research Committee of the University of Abomey-Calavi (Benin). Data were collected in accordance with the FAO guidelines for the characterization of animal genetic resources (FAO, 2011, 2012). The management and husbandry of the animals followed the animal welfare assessment criteria as identified and defined by the Welfare Quality Project (WQP) (Vapnek and Chapman, 2011; FAO, 2012). However, there is no specific legislation for animal welfare and hair sampling in Benin (Gautier and Escobar, 2013). Hair sampling is a non-invasive method and therefore no approval was necessary. In addition, all goat farmers were aware of the study, gave their verbal consent through the decentralized government institution of Benin for the management of the agricultural sector in each survey municipality, and handled their animals during data collection.
Author contributions
HW and LD designed the study. HW collected the data. HW and MS performed statistical analyses and drafted the manuscript. MS, G-KD, DD, DL, and LD reviewed and edited the manuscript. All authors contributed to the article and approved the submitted version.
Funding
This work is financially supported by the Government of Belgium through the “Académie de Recherche et d’Enseignement Supérieur (ARES)”. ARES-PRD Project entitled “Amélioration des systèmes traditionnels d’élevage de petits ruminants (ovins et caprins) dans un contexte de mutation environnementale et sociétale au Bénin” https://www.ares-ac.be/fr/cooperation-au-developpement/pays-projets /projets-dans-le-monde/item/150-prd-amelioration-des-systemes-tradi tionnels-d-elevage-de-petits-ruminants-ovins-et-caprins-dans-un-cont exte-de-mutation-environnementale-et-societale-au-Benin.
Acknowledgments
The authors gratefully acknowledge the “Académie de Recherche et de l’Enseignement Supérieur” for the financial support through the project PRD/ARES/2018 research project on small ruminant, Claire Billion, and Claire Avril (Haute-Ecole CONDORCET) and Marcel Houinato (Université d’Abomey-Calavi) for coordinating the research actions and implementing the enriching collaboration between the different actors of the project. The authors are grateful to goat farmers from the different vegetation zones of Benin for their active participation in this study.
Conflict of interest
The authors declare that the research was conducted in the absence of any commercial or financial relationships that could be construed as a potential conflict of interest.
Publisher’s note
All claims expressed in this article are solely those of the authors and do not necessarily represent those of their affiliated organizations, or those of the publisher, the editors and the reviewers. Any product that may be evaluated in this article, or claim that may be made by its manufacturer, is not guaranteed or endorsed by the publisher.
Supplementary material
The Supplementary Material for this article can be found online at: https://www.frontiersin.org/articles/10.3389/fgene.2023.1079048/full#supplementary-material
References
Aljumaah, R. S., Musthafa, M. M., Al-Shaikh, M. A., Badri, O. M., and Hussein, M. F. (2012). Genetic diversity of Ardi goat based on microsatellite analysis. Afr. J. Biotechnol. 11, 16539–16545. doi:10.5897/AJB12.542
Arora, R., Bhatia, S., and Jain, A. (2010). Morphological and genetic characterization of Ganjam sheep. Anim. Genet. Resour. 46, 1–9. doi:10.1017/S2078633610000627
Awobajo, O. K., Salako, A. E., and Osaiyuwu, O. H. (2015). Analysis of genetic structure of Nigerian West African Dwarf goats by microsatellite markers. Small Rumin. Res. 133, 112–117. doi:10.1016/j.smallrumres.2015.09.006
Barker, J. S. F., Tan, S. G., Moore, S. S., Mukherjee, T. K., Matheson, J. L., and Selvaraj, O. S. (2001). Genetic variation within and relationships among populations of Asian goats (Capra hircus). J. Anim. Breed. Genet. 118, 213–233. doi:10.1046/j.1439-0388.2001.00296.x
Ben Sassi-Zaidy, Y., Mohamed-Brahmi, A., Nouairia, G., Charfi-Cheikhrouha, F., Djemali, M. N., and Cassandro, M. (2022). Genetic variability and population structure of the Tunisian sicilo-sarde dairy sheep breed inferred from microsatellites analysis. Genes 13, 304. doi:10.3390/genes13020304
Botstein, D., White, R. L., Skolnick, M., and Davis, R. W. (1980). Construction of a genetic linkage map in man using restriction fragment length polymorphisms. Am. J. Hum. Genet. 32, 314–331.
Dayo, G. K., Houaga, I., Linguelegue, A., Ira, M., Konkobo, M., Djassi, B., et al. (2022). Morphological and microsatellite DNA diversity of Djallonké sheep in Guinea-bissau. BMC Genomic Data 23, 3–17. doi:10.1186/s12863-021-01009-7
Demir, E., and Balcioğlu, M. S. (2019). Genetic diversity and population structure of four cattle breeds raised in Turkey using microsatellite markers. Czech J. Anim. Sci. 64, 411–419. doi:10.17221/62/2019-CJAS
Dixit, S. P., Verma, N. K., Aggarwal, R. A. K., Vyas, M. K., Rana, J., and Sharma, A. (2012). Genetic diversity and relationship among Indian goat breeds based on microsatellite markers. Small Rumin. Res. 105, 38–45. doi:10.1016/j.smallrumres.2011.11.026
Djimènou, D., Adoukonou-Sagbadja, H., Dayo, G.-K., Chrysostome, C. A. A. M., and Koudande, D. O. (2021). Genetic diversity and phylogenetic relationships within local pigs in southern Benin. Trop. Anim. Health Prod. 53, 434–514. doi:10.1007/s11250-021-02857-2
Dossa, L. H., Wollny, C., and Gauly, M. (2007). Spatial variation in goat populations from Benin as revealed by multivariate analysis of morphological traits. Small Rumin. Res. 73, 150–159. doi:10.1016/j.smallrumres.2007.01.003
Evanno, G., Regnaut, S., and Goudet, J. (2005). Detecting the number of clusters of individuals using the software STRUCTURE: A simulation study. Mol. Ecol. 14, 2611–2620. doi:10.1111/j.1365-294X.2005.02553.x
Excoffier, L., Smouse, P. E., and Quattro, J. M. (1992). Analysis of molecular variance inferred from metric distances among DNA haplotypes: Application to human mitochondrial DNA restriction data. Genetics 131, 479–491. doi:10.1093/genetics/131.2.479
FAO (2011). Molecular Genetic Characterization of Animal Genetic Resources. Rome, Italy: FAO Animal Production and Health Guidelines.
FAO (2012). Phenotypic characterization of animal genetic resources. Rome, Italy: Food and Agriculture Organization of the United Nations.
FAO (2007). The state of the world’s animal genetic resources for food and agriculture. Rome, Italy: Barbara Rischkowsky and Dafydd Pilling.
Gautier, P., and Escobar, S. L. (2013). Rapport de la mission de suivi de l’évaluation PVS des services vétérinaires du Bénin. Paris, France: OIE—World Organisation for Animal Health.
Gororo, E., Makuza, S. M., Chatiza, F. P., Chidzwondo, F., and Sanyika, T. W. (2018). Genetic diversity in Zimbabwean Sanga cattle breeds using microsatellite markers. S Afr. J. Anim. Sci. 48, 128. doi:10.4314/sajas.v48i1.15
Hardy, O. J., and Vekemans, X. (2002). spagedi: a versatile computer program to analyse spatial genetic structure at the individual or population levels. Mol. Ecol. Notes 2, 618–620. doi:10.1046/j.1471-8286.2002.00305.x
Hounzangbé-Adote, M. S., Azando, E., and Awohouedji, Y. (2011). “Biodiversité dans les zones d’élevage des petits ruminants Mammifères domestiques Benin,” in Atlas de la biodiversité de l'Afrique de l'Ouest. Editors B. Sinsin, and D. Kampmann (Cotonou, Benin and Frankfurt: Hardcover), 506–518. (Tome I).
Jawasreh, K. I., Ababneh, M. M., Ismail, Z. B., Younes, A. M. B., and Al Sukhni, I. (2018). Genetic diversity and population structure of local and exotic sheep breeds in Jordan using microsatellites markers. Vet. World 11, 778–781. doi:10.14202/vetworld.2018.778-781
Jombart, T. (2008). adegenet: a R package for the multivariate analysis of genetic markers. Bioinformatics 24, 1403–1405. doi:10.1093/bioinformatics/btn129
Jombart, T., and Ahmed, I. (2011). Adegenet 1.3-1: new tools for the analysis of genome-wide SNP data. Bioinformatics 27, 3070–3071. doi:10.1093/bioinformatics/btr521
Jombart, T., Devillard, S., and Balloux, F. (2010). Discriminant analysis of principal components: A new method for the analysis of genetically structured populations. BMC Genet. 11, 94. doi:10.1186/1471-2156-11-94
Kalinowski, S. T., Taper, M. L., and Marshall, T. C. (2007). Revising how the computer program CERVUS accommodates genotyping error increases success in paternity assignment. Mol. Ecol. 16, 1099–1106. doi:10.1111/j.1365-294X.2007.03089.x
Kohonen, T. (1982). Self-organized formation of topologically correct feature maps. Biol. Cybern. 43, 59–69. doi:10.1007/BF00337288
Kouato, O. G., Houndonougbo, V. P., Orounladji, B. M., Chabi Adjobo, M. A., Glele Kakaï, R., and Chrysostome, C. A. A. M. (2021). Comparative analysis of quantitative phenotypic parameters of Djallonke and hybrid (Djallonke × Sahelian) goats in Benin. J. Anim. Plant Sci. 47, 8472–8483. doi:10.35759/JAnmPlSci.v47-2.5
Kumar, S., Dixit, S. P., Verma, N. K., Singh, D. K., Pande, A., Kumar, S., et al. (2009). Genetic diversity analysis of the Gohilwari breed of Indian goat (Capra hircus) using microsatellite markers. Am. J. Anim. Vet. Sci. 4, 49–57. doi:10.3844/ajavsp.2009.49.57
Laoun, A., Harkat, S., Lafri, M., Gaouar, S. B. S., Belabdi, I., Ciani, E., et al. (2020). Inference of breed structure in farm animals: Empirical comparison between snp and microsatellite performance. Genes 11, 57. doi:10.3390/genes11010057
Mekuriaw, G. T. (2016). “Molecular characterization of Ethiopian indigenous goat populations: Genetic diversity and structure, demographic dynamics and assessment of the kisspeptin gene polymorphism,” ([Addis Abeba, Ethiopie]: Université d’Addis Abeba). [Thèse de doctorat en Philosophie et génétique appliquée].
Meyer, C. (2002). "Races d’ovins, de caprins et de camelins: Aires de répartition en afrique (breeds of sheep, goat and camelids. Geographic distribution in Africa)," in: CIRAD–GRET et Ministère des Affaires étrangères, Mémento de l’agronome, Cédérom principal, Zootechnie spéciale, Italy, Food and Agriculture Organization.
Mihailova, Y. (2021). Genetic diversity and structure of 2 indigenous sheep breeds (Kotel and Teteven) in Bulgaria using microsatellite markers. Biotechn. Biotechn. Equip. 35, 576–585. doi:10.1080/13102818.2021.1903339
Missohou, A., Poutya, M. R., Nenonene, A., Dayo, G. K., Ayssiwede, S. B., Talaki, E., et al. (2011). Genetic diversity and differentiation in nine West African local goat breeds assessed via microsatellite polymorphism. Small Rumin. Res. 99, 20–24. doi:10.1016/j.smallrumres.2011.04.005
Molina-Flores, B., Manzano-Baena, P., and Coulibaly, M. D. (2020). The role of livestock in food security, poverty reduction and wealth creation in West Africa. Accra, Ghana: FAO. doi:10.4060/ca8385en
Msanga, Y. N., Mwakilembe, P. L., and Sendalo, D. (2012). The indigenous cattle of the Southern Highlands of Tanzania: Distinct phenotypic features, performance and uses. Livest. Res. Rural. Dev. 110, 1–24.
Negrini, R., D’Andrea, M., Crepaldi, P., Colli, L., Nicoloso, L., Guastella, A. M., et al. (2012). Effect of microsatellite outliers on the genetic structure of eight Italian goat breeds. Small Rumin. Res. 103, 99–107. doi:10.1016/j.smallrumres.2011.08.006
Nei, M. (1978). Estimation of average heterozygosity and genetic distance from a small number of individuals. Genetics 89, 583–590. doi:10.1093/genetics/89.3.583
Ofori, S. A., Hagan, J. K., Kyei, F., and Etim, N. N. (2021). Phenotypic and genetic characterization of qualitative traits in the West African Dwarf goat of Ghana. Sci. Afr. 13, e00857. doi:10.1016/j.sciaf.2021.e00857
Ojo, O. A., Akpa, G. N., Orunmuyi, M., Adeyinka, I. A., Kabir, M., and Alphonsus, C. (2018). Genetic analysis of Nigerian indigenous goat populations using microsatellite markers. Iran. J. Appl. Anim. Sci. 8, 287–294.
Paradis, E. (2010). pegas: an R package for population genetics with an integrated-modular approach. Bioinformatics 26, 419–420. doi:10.1093/bioinformatics/btp696
Pritchard, J. K., Stephens, M., and Donnelly, P. (2000). Inference of population structure using multilocus genotype data. Genetics 155, 945–959. doi:10.1093/genetics/155.2.945
Ramasamy, R. K., Ramasamy, S., Bindroo, B. B., and Naik, V. (2014). Structure plot: A program for drawing elegant STRUCTURE bar plots in user friendly interface. SpringerPlus 3, 431. doi:10.1186/2193-1801-3-431
Ravimurugan, T. (2017). Genetic diversity analysis of Kilakarsal sheep by microsatellite markers. Int. J. Curr. Microbiol. Appl. Sci. 9, 573–577. doi:10.20546/ijcmas.2017.609.069
Spanoghe, M. C., Marique, T., Rivière, J., Moulin, M., Dekuijper, C., Nirsha, A., et al. (2020). Genetic patterns recognition in crop species using self-organizing map: The example of the highly heterozygous autotetraploid potato (Solanum tuberosum L.). Genet. Resour. Crop Evol. 67, 947–966. doi:10.1007/s10722-020-00894-8
Spanoghe, M. C., Whannou, H. R. V., Dekuijper, C., Dossa, L. H., and Lanterbecq, D. (2022). Development of a standardized multiplex SSR kit for genotyping both goats and sheep. Small Rumin. Res. 206, 106575. doi:10.1016/j.smallrumres.2021.106575
Tefiel, H., Ata, N., Chabbar, M., Benyarou, M., Fantazi, K., Yilmaz, O., et al. (2018). Genetic characterization of four Algerian goat breeds assessed by microsatellite markers. Small Rumin. Res. 160, 65–71. doi:10.1016/j.smallrumres.2018.01.021
Tolone, M., Mastrangelo, S., Rosa, A. J. M., and Portolano, B. (2012). Genetic diversity and population structure of Sicilian sheep breeds using microsatellite markers. Small Rumin. Res. 102, 18–25. doi:10.1016/j.smallrumres.2011.09.010
Traoré, A., Álvarez, I., Tambourá, H. H., Fernández, I., Kaboré, A., Royo, L. J., et al. (2009). Genetic characterisation of Burkina Faso goats using microsatellite polymorphism. Livest. Sci. 123, 322–328. doi:10.1016/j.livsci.2008.11.005
Vapnek, J., and Chapman, M. (2011). Legislative and regulatory options for animal welfare. Rome, Italy: Food and Agriculture Organization of the United Nations.
Weir, B. S., and Cockerham, C. C. (1984). Estimating F-statistics for the analysis of population structure. Evolution 38, 1358–1370. doi:10.1111/j.1558-5646.1984.tb05657.x
Whannou, H. R. V., Afatondji, C. U., Linsoussi, C. A., Favi, G. A., Nguyen, T. T., Houinato, M. R. B., et al. (2022). Morphological characterization and habitat suitability modeling of the goat population of Benin under climate change scenarios. Ecol. Process 11, 47. doi:10.1186/s13717-022-00392-y
Whannou, H. R. V., Afatondji, U. C., Demblon, D., Houinato, R. B. M., and Dossa, L. H. (2021). Morphological variability and geographical distribution of goat populations from Benin (West Africa). Genet. Resour. 2 (1). doi:10.46265/genresj.QULD1720.p46
Wilson, R. T. (1991). “Small ruminant production and the small ruminant genetic resource in tropical Africa,” in FAO Animal production and Health papers 88 (Rome, Italy: FAO Food and Agricultural Organization of the United Nations), 231.
Keywords: Capra hircus, molecular genetic characterization, genetic structure, indigenous farm animal genetic resources, phytogeographic zones
Citation: Whannou HRV, Spanoghe M, Dayo G-K, Demblon D, Lanterbecq D and Dossa LH (2023) Genetic diversity assessment of the indigenous goat population of Benin using microsatellite markers. Front. Genet. 14:1079048. doi: 10.3389/fgene.2023.1079048
Received: 24 October 2022; Accepted: 07 March 2023;
Published: 17 March 2023.
Edited by:
Ntanganedzeni Mapholi, University of South Africa, South AfricaReviewed by:
Federico Abel Ponce de León, University of Minnesota Twin Cities, United StatesJun Luo, Northwest A&F University, China
Copyright © 2023 Whannou, Spanoghe, Dayo, Demblon, Lanterbecq and Dossa. This is an open-access article distributed under the terms of the Creative Commons Attribution License (CC BY). The use, distribution or reproduction in other forums is permitted, provided the original author(s) and the copyright owner(s) are credited and that the original publication in this journal is cited, in accordance with accepted academic practice. No use, distribution or reproduction is permitted which does not comply with these terms.
*Correspondence: Luc Hippolyte Dossa, aGlwcG9seXRlLmRvc3NhQGZzYS51YWMuYmo=