 Sergio Vela-Avitúa1*
 Benjamin R. LaFrentz2
 Carlos A. Lozano1
 Craig A. Shoemaker2Jose Fernando Ospina-Arango3Benjamin H. Beck2Morten Rye1*
- 1Benchmark Genetics Norway AS, Bergen, Norway
- 2United States Department of Agriculture-Agricultural Research Service (USDA-ARS), Aquatic Animal Health Research Unit, Auburn, AL, United States
- 3Spring Genetics, Miami, FL, United States
Streptococcus iniae is a problematic gram-positive bacterium negatively affecting Nile tilapia (Oreochromis niloticus), one of the main aquacultural species produced worldwide. The aim of this study was to identify the genetic architecture of survival to S. iniae and identify single nucleotide polymorphism (SNPs) linked to quantitative trait loci (QTL) related to survival to S. iniae challenge. With this purpose, Nile tilapia from the Spring Genetics breeding program were sent to a controlled S. iniae challenge test where phenotypes were scored as dead for fish that died during challenge test and survivors for the fish alive at the termination of the test. Additionally, fin-clip samples from all fish in the test were collected for DNA extraction. Out of 1904 fish in the challenge test, tissue samples of 321 fish were sent for genotyping using double digest restriction site associated DNA sequencing (ddRADseq). After quality control and filtering, 9,085 SNPs were used to perform a genome-wide association study (GWAS). A significant signal in LG8 was observed indicating association with survival to S. iniae challenge, with SNPs explaining from 12% to 26% of the genetic variance. To demonstrate the usefulness of marker assisted selection (MAS) to selectively breed fish for survival to S. iniae, offspring of breeding candidates classified as “resistant” and “susceptible” based on haplotypes of the four most significant markers were sent to a controlled S. iniae challenge test. At the end of the test, the differences in mortality between the two groups were strikingly different with a final cumulative percent mortality of less than 1% and 73% for offspring from “resistant” and “susceptible” parents, respectively. These results demonstrate that MAS for improved resistance to S. iniae is feasible.
1 Introduction
Due to its high adaptability, Nile Tilapia (Oreochromis niloticus) is among the three most important cultured aquatic species with more than four and a half million tons produced worldwide in 2020 (FAO, 2022). Tilapia farming has grown at a faster rate than overall aquaculture in the past two decades, leading to more intensive production but also to an increase in occurrence of diseases (Xu and Ming, 2018; Miao and Wang, 2020). Streptococcal disease, caused by Streptococcus iniae, S. agalactiae and S. dysgalactiae, is a major bacterial disease affecting tilapia populations worldwide. Due high morbidity and mortality rates, this disease causes a substantial negative economic impact (estimated at US$ 1 billion) to the global tilapia industry (Shoemaker et al., 2017b). In 1997, the annual impact of S. iniae in the United States was estimated at US$ 10 million (Shoemaker et al., 2001). Selective breeding for disease resistance is a possible solution to overcome problems caused by bacterial diseases in tilapia, particularly since large additive genetic variation was recently found for S. iniae (LaFrentz et al., 2016; Shoemaker et al., 2017a) and selective breeding has shown to increase resistance in Nile tilapia (O. niloticus) populations (LaFrentz et al., 2020). In Nile tilapia, selective breeding programs has primarily been based on pedigree (Ponzoni et al., 2010; Thodesen Da-Yong Ma et al., 2011; Trong et al., 2013; Bentsen et al., 2017; Shoemaker et al., 2022). However, the development of new technologies facilitating marker assisted selection (MAS) and genomic selection (GS) may increase genetic gain through improved prediction accuracy and by allowing to capitalise on all the genetic variation when breeding candidates have not been recorded for the traits under selection (Houston, 2017). MAS can be used to improve disease resistance if quantitative trait loci (QTL) are found for the specific disease targeted and they explain a large amount of the genetic variation. In Atlantic salmon, a major QTL that explained 80%–98% of the genetic variation for infectious pancreatic necrosis (IPN) resistance was found and is currently widely used for disease control (Houston et al., 2008; Moen et al., 2009; Moen et al., 2015). QTL that affects disease resistance have been found for some fish species (Fuji et al., 2006; Gilbey et al., 2006; Moen et al., 2007; Vallejo et al., 2014; Gonen et al., 2015), but the use of MAS based on single QTL is not always successful in animal breeding due to the polygenic genetic architecture of most economically important traits (Meuwissen et al., 2013). To date, no major QTL for resistance to bacterial diseases has been reported in Nile tilapia. In a genome-wide association study (GWAS) for S. agalactiae capsular type 1a, Lu et al. (2020) identified seven trait-related SNPs on four different chromosomes that together explained 1% of the genetic variation and concluded that resistance to S. agalactiae 1a is polygenic. The objective of this study was to investigate the genetic architecture of and possibly identify molecular markers linked to resistance to S. iniae in Nile tilapia.
2 Materials and methods
2.1 Family production, challenge testing and training data selection
Fish from the fourth generation (G4) of the spring Genetics Nile tilapia breeding program were used for the GWAS. A total of 144 full sib families were produced by natural mating in single pair breeding units using a nested mating design (144 dam with 72 sires) and reared separately until tagging as previously described (LaFrentz et al., 2016; Shoemaker et al., 2017a; LaFrentz et al., 2020). At tagging, tissue samples from the pelvic fin of all fish destined to participate in the challenge tests were taken and stored in 97% ethanol in separate 1.5 mL Eppendorf tubes with individual identification and kept at −20°C. After tagging, representatives of all families were stocked at Spring Genetics’ Nile tilapia breeding program facilities in Homestead, Florida (FL) and reared as breeding candidates. Siblings of G4 breeding candidates representing all families were transported to the USDA-ARS Aquatic Animal Health Research Unit (AAHRU) in Auburn, Alabama and subjected to two separate controlled Streptococcus spp. challenge tests (S. iniae and S. agalactiae 1b). Results and details of these two challenge tests have been previously published by Shoemaker et al. (2017a). For S. iniae, fish from all families were challenged intraperitoneally with diluted S. iniae culture (see details from section 2.5 below).
After finalization of the challenge test a training population was constructed with a subsample of the fish that participated in the S. iniae challenge test. Families were grouped according to their genetic distances estimated from pedigree. From resulting groups, half-sib families that maximized phenotypic variation were selected and within each family individuals were randomly sampled. After this process, 321 individuals representing 39 families were selected to create the training population for S. iniae (Table 1). Survival recorded as alive at end of challenge test (scored 1) or dead during trial (scored 0) was used as the phenotype for statistical analysis.
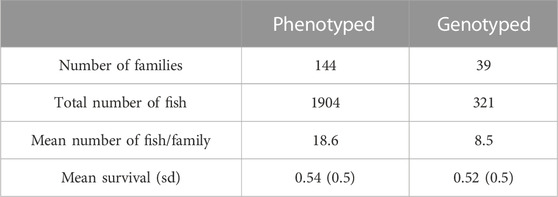
TABLE 1. Total number of families, average number of individuals per family, and total number of individuals phenotyped and genotyped of the first challenge test of S. iniae used for the GWAS.
2.2 Genotyping and variant calling
Tissue samples of 321 Nile tilapia challenged with S. iniae were genotyped together with 777 Nile tilapia from the same population using ddRADseq. Tissue samples were sent to LGC Genomics GmbH (Germany) for DNA extraction, library preparation and sequencing. In brief, DNA was extracted from fish fin clips (16–25 mm2) using sbeadex livestock kit (LGC Genomics GmbH, Germany). 100–200 ng of genomic DNA were digested with MsII (NEB) in NEB4 buffer. After inactivation of restriction enzyme, 10 µL of each restriction digest were transferred to a new 96 well PCR plate with one of 96 inline barcoded forward blunt adaptors, and ligation master mix. After ligation, all reactions were purified using Agencourt AMPure XP beads (Beckman Coulter, United States of America) and libraries eluted in Tris buffer. Ten µl of each of the 96 Libraries were separately amplified in 20 µL PCR reactions using MyTaq (Bioline GmbH, Germany) and standard Illumina TrueSeq amplification primers (Illumina Inc., United States) limiting the cycle number to 14 cycles. Five µl from each of the 96 amplified libraries were pooled, PCR primer and small amplicons were removed using Agencourt AMPure XP beads (Beckman Coulter, United States) and PCR enzyme removed by an additional purification on Qiagen MinElute Columns (Qiagen, United States). Pooled libraries were eluted in a final volume of 20 µL Tris Buffer (5 mM Tris/HCl pH:9). Normalisation was done using Evrogen Trimmer Kit (Evrogen, Russia). Normalized library pools were re-amplified in 100 µL PCR reactions using MyTaq (Bioline GmbH, Germany) and limiting cycle number to 14 cycles. For each pool a different i5-adaptor primer was used to include i5-indices into the libraries. Libraries were size selected on Blue Pippin and LMP-agarose gel, keeping fragments between two hundred and four hundred base pairs.
Sequencing was done on an Illumina NextSeq 500 V2 platform (Illumina Inc., United States), resulting in
The pre-processed reads for all samples were aligned against the Oreochromis niloticus reference genome from NCBI accession number GCA_001858045.1 ASM185804v2 (Conte et al., 2017) using BWA-MEM version 0.7.5a (Li and Durbin, 2010). All resulting BAM files were sorted and merged using Samtools (Danecek et al., 2021) and Picard2. Variant calling and genotyping was performed with Freebayes v1.0.2-16 (Garrison and Marth, 2012) filtered for minimum coverage (10 reads), minimum allele frequency (>2%) and minimum sample coverage (at least 600 samples). After processing,
2.3 SNP filtering
After allele calling, the 321 Nile tilapia samples from S. iniae challenge test were filtered using Plink v1.9 (Chang et al., 2015). SNPs were filtered for minimum allele frequency (MAF) larger than 0.05, allele call larger than 0.1 and Hardy Weinberg equilibrium p < 1e-6 resulting in 9,085 SNPs after filtering. Samples were filtered for genotype rate (>90%) and heterozygosity (<±3sd of population), after filtering no samples were removed.
2.4 Statistical analysis
GWAS was performed using the linear mixed animal model implemented in GCTA software (Yang et al., 2011) with the option of leaving one chromosome out (MLMA-LOCO). In MLMA-LOCO polygenic effect is estimated as accumulated effect of markers across all linkage groups (LG) except the LG where the candidate marker is located. The general model fitted was:
Where y is the vector of phenotypic records (i.e., survival score 0 or 1), μ was the overall mean, b was the vector of unknown additive effect of the evaluated SNP, a was the vector of additive polygenic effects with distribution
2.5 Assortative mating using haplotypes and S. iniae challenge test
From 2019 onwards, Spring Genetics has implemented genomic selection for resistance to S. agalactiae and from 2020 to Francisella oreintalis; thus, male breeding candidates are routinely genotyped using a custom BMK Genetics 50K SNP array developed in collaboration with Neogen (Neogen Corp., Lexington, KY) which includes the ten most significant markers for survival to S. iniae. Additionally, Spring Genetics in collaboration with Neogen, designed a panel with 222 SNPs for parental assignment and traceability including the ten most significant markers for survival to S. iniae and is routinely used to perform MAS on females to S. iniae. Thus, on generation seven (G7), genotypes of breeding candidates from the Spring Genetics population were available. In total 768 candidate males were genotyped with the 50K SNP array, and 800 candidate females were genotyped with the parental assignment panel. Five months after the production of generation eight (G8) of the Spring Genetics’ breeding nucleus, experimental groups were produced to probe the effectiveness of MAS for selection to survival to S. iniae. For this purpose, using available genotypes of breeders that remained alive, fish were classified into “resistant” and “susceptible” groups, based on haplotypes of the four most significant markers. Individual pairs of breeders were subsequently stocked in separate hapas according to their group. Five “resistant” hapas and five “susceptible” hapas were stocked, allowing single pair mating. Due to low percentage of spawning caused by cold water temperatures during this period, fry from one “resistant” female and two “susceptible” females were collected (Table 2). Offspring from “resistant” and “susceptible” matings were reared in separate tanks until tagging. A total of 298 fish from the “resistant” group and 304 fish from the “susceptible” group were PIT tagged, tissue samples were taken for DNA (as described in 2.1) and individual weight and group were recorded. The average weight at tagging was 14.2 g for the “susceptible” group and 14.6 g for the “resistant” group. Fish from both groups were pooled and transported by truck from Spring Genetics to the USDA-ARS AAHRU to be challenged with S. iniae. Upon arrival fish were acclimated in a common 5,500 L tank for 28 days that was supplied with de-chlorinated municipal water with average temperature and dissolved oxygen of 26.3°C ± 1.1°C and 7.2 ± 0.5 ppm, respectively. Pilot challenges were conducted with sibs from both groups previously sent to the AAHRU to determine the dose of S. iniae to be used in trial. An archived stock of S. iniae generated following passage through tilapia was cultured as previously described by LaFrentz et al. (2016); Shoemaker et al. (2017a). A total of 590 fish (average weight of ∼40 g) were challenged with S. iniae via intraperitoneal injection with a dose of 5 × 10⁶ cfu fish-1 and all fish were placed into a single 5500 L tank. The temperature and dissolved oxygen averaged 27.7°C ± 0.1°C and 6.4 ± 0.4 ppm, respectively, during the challenge test. Following the challenge, moribund and dead fish were removed at least twice daily, with PIT tag numbers and date of removal recorded for each fish. Brain tissue samples were collected from 20% of the daily mortalities and plated onto sheep blood agar to confirm the cause of morbidity. At the end of the challenge test, all surviving fish were humanely euthanized and PIT tag numbers were recorded. Fish that lost PIT tags during the trial were excluded from analysis. Time to death of the two groups were compared using the Kaplan-Meier estimator (censor status = 1 for dead fish, censor status = 0, for fish alive). The survival during trial (alive = 1 or dead = 0) was used as the phenotype. All challenge procedures utilizing fish were approved by the USDA-ARS, AAHRU Institutional Animal Care and Use Committee.

TABLE 2. Breeders selected and stocked in breeding hapas for the QTL validation experiment.
Tissue samples from all challenged fish were sent for genotyping using the custom SNP panel for parental assignment; offspring were assigned to their parents using hsphase package (Ferdosi et al., 2014) in R (R Core Team, 2013).
3 Results
3.1 Challenge test G4
Results of the challenge test for G4 were previously published (Shoemaker et al., 2017a). A brief summary is provided here for the reader. Most of the fish died on the first and second day after injection with S. iniae, and after day 5 daily mortalities were below 1%. Cumulative mortality reached 46% after 21 days. Brain tissue samples were collected from 265 fish that died during the trial and 99% of these samples yielded pure cultures of S. iniae confirming the cause of death. Heritability reported was high (h2 = 0.52 ± 0.12) (Shoemaker et al., 2017a).
3.2 Genome wide association study
The results of the GWAS analysis demonstrated a strong signal on LG8 indicating association with survival to S. iniae challenge test (Figure 1). Fourteen SNP markers overpassed the genome-wide threshold in a region comprising approximately 3.98 Mb on LG8, from position 5,545,222 to position 9,515,899. Details of significant markers are provided in Table 3, and these explained from 12% to 26% of the genetic variance. Genomic inflation factor
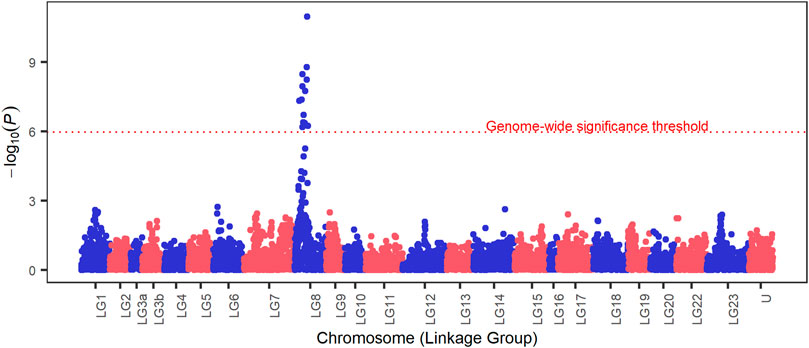
FIGURE 1. Manhattan plot for survival to S. iniae in Nile tilapia. On the y axis is the - log10(p-values) and the x axis is the chromosome (linkage group) position on the Oreochromis niloticus genome, U represents SNPs with unknown chromosome location. The dotted red line marks the genome-wide Bonferroni corrected threshold.
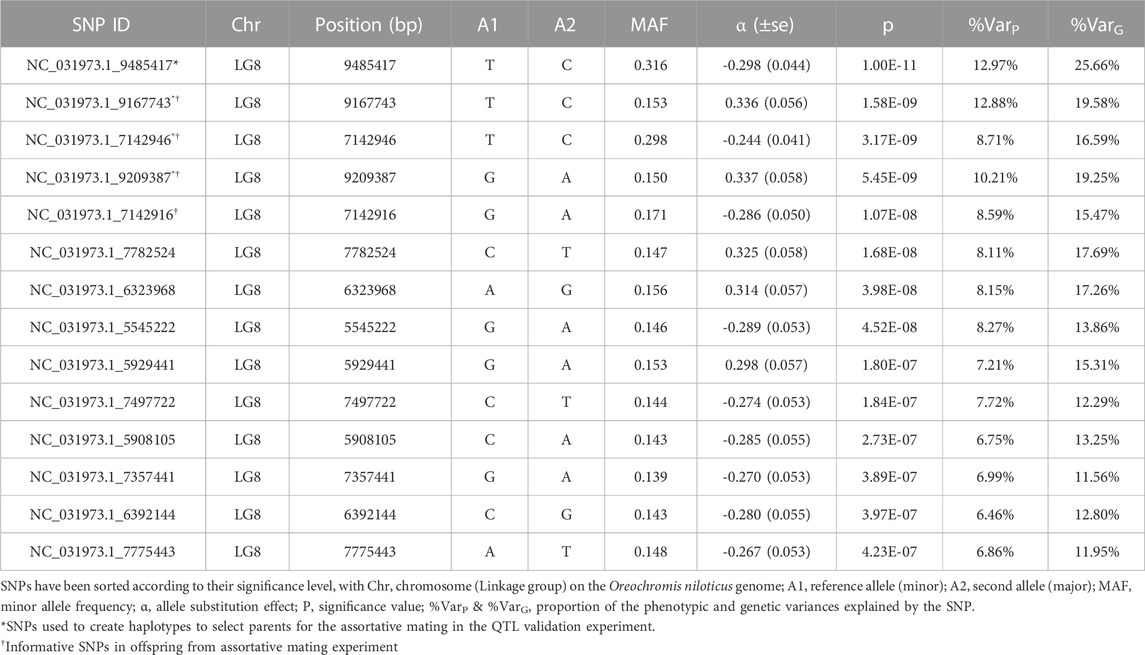
TABLE 3. List of significant markers ordered according to their significance.

FIGURE 2. Quantile-quantile plot with the distribution of observed vs. expected -log10(p).
Additionally, cross validation was performed using model 1 fitting the top four significant markers together with random polygenic effect to obtain predicted phenotypes and correlations between predicted phenotypes and observed phenotypes. The Pearson correlation value was 0.62 meaning that the four markers could predict the survival of fish with a medium reliability.
3.3 Challenge test of fish produced by MAS assortative mating using haplotypes
The overall cumulative percent mortality at the end of the S. iniae challenge was 39% (Figure 3). Mortality began the day after challenge, peaked on day 3, and most mortality occurred from days 1–4 (Figure 3). Analysis of the mortality data of the two groups yielded statistically significant (Chi-square test, p < 0.001) differences with a final CPM of 73% for the “susceptible” group and less than 1% for the “resistant” group. Survival curves (time to death) between the two groups were also significantly different (Log-Rank tests p < 0.001) (Figure 4). S. iniae was reisolated from 100% (44/44) of the sampled fish brain tissue.
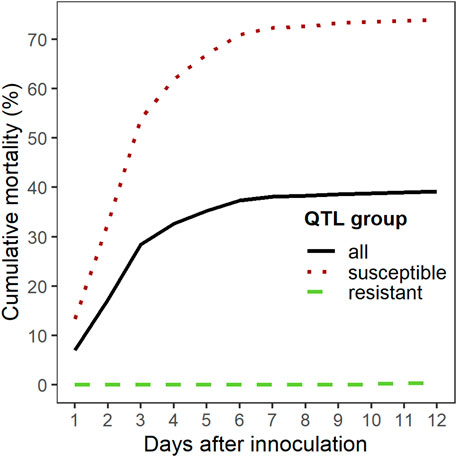
FIGURE 3. Cumulative mortality (%) for S. iniae in QTL validation experiment.
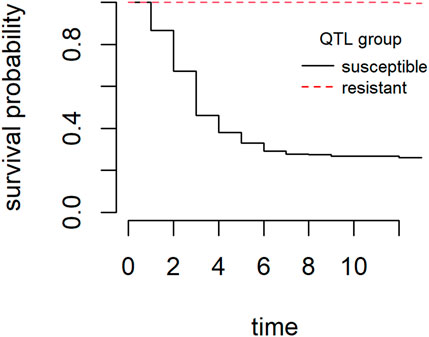
FIGURE 4. Kaplan-Meier survival curves for “resistant” group and “susceptible” group during the S. iniae QTL validation experiment.
After genotyping, parental assignment showed fish from “susceptible” group came from a single paternal half-sib family (i.e., one male mated to two females), and fish from the “resistant” group came from a single mating (Table 4). After QC assessment, the most significant marker for S. iniae resistance (NC_031973.1_9485417) was removed as it did not show polymorphism. Figure 5 shows haplotype survival of the four most significant markers which were used to select fish. Haplotypes results confirm the markers selected can predict survival for S. iniae accurately.
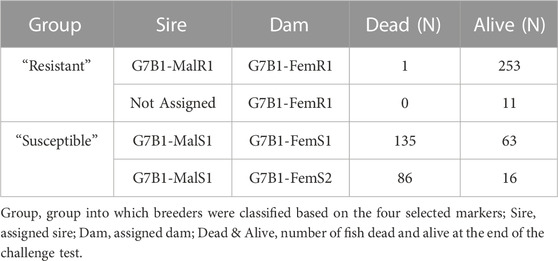
TABLE 4. Survival results of assortative mating for S. iniae QTL validation experiment (after parental assignment).
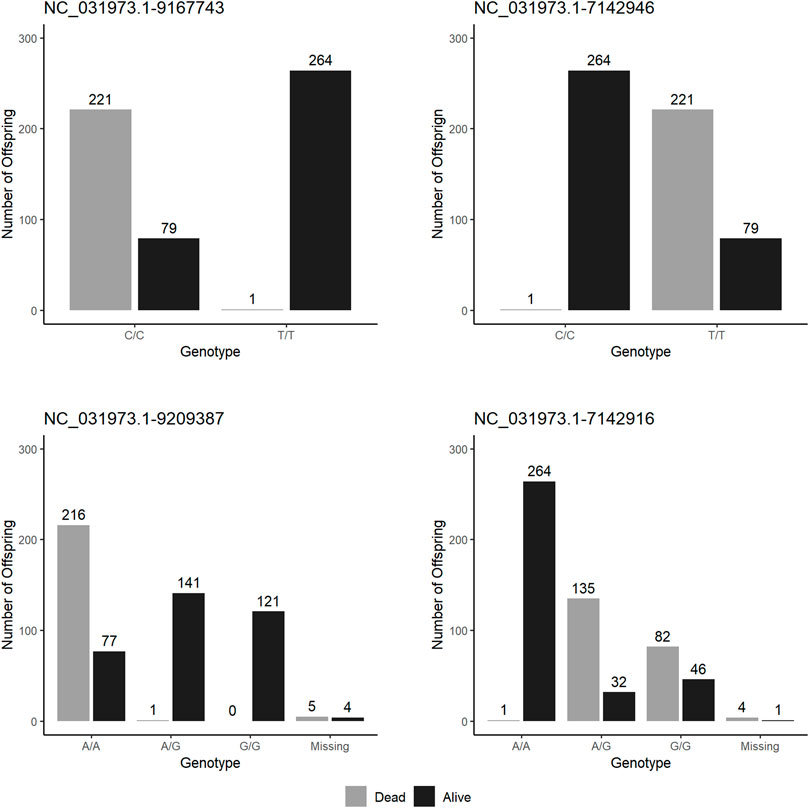
FIGURE 5. Survival to S. iniae at the end of test by haplotypes on the four top markers in QTL validation experiment.
4 Discussion
Results from GWAS analysis for S. iniae suggest the presence of a novel QTL area on linkage group 8 (LG8) explaining from 12% to 26% of the genetic variance. Estimates of percentage of genetic variance explained by the SNPs may be underestimated because of the dichotomous nature of the trait (Stringer et al., 2011) and sample size. Nonetheless, the use of four top SNP markers allowed prediction of the phenotype of individuals with an accuracy of approximately 60%, which we consider enough to justify implementation of MAS in the Spring Genetics breeding program. The assortative mating experiment confirmed the feasibility of MAS, since mortality was less than 1% in offspring of fish homozygous for resistant alleles and 73% of the offspring of parents whose haplotype was characterized with susceptible alleles died during challenge test. However, the most significant allele failed to pass the genotyping QC in the offspring; thus, it was not possible to relate survival to haplotypes of the offspring. Nonetheless, when exploring haplotypes for other markers (Figure 5) it was possible to observe that the use of the fifth most significant marker would accurately select parents with QTL favourable for survival (Figure 5).
Within the entire 3.98 Mb region comprising the positions of first and last significant SNPs, genes underlying the QTL were searched using the Nile tilapia genome (Conte et al., 2017). Sixty-two genes were identified with functions mainly related to catalytic, binding, transmembrane transport and signalling receptor activity (Supplemental Table S1). Among the genes identified within the significant region on LG8, some genes were considered as candidate genes behind the QTL, either because their participation in host-pathogen interaction or importance in neuronal activity given the tropism of S. iniae for the central nervous system. The gene ccr10 (chemokin receptor 10) is located about 100 kb downstream the first significant SNP, which has known chemotactic activity, and changes in expression of genes from the same family have been reported as part of the acute response of infection of S. iniae in Nile tilapia (Zhu et al., 2015). Gene exoc7 (exocyst complex component 7) was located about 20 kb downstream the ninth most significant SNP; exocyst complex is known to regulate entry of bacterium into host cells (Heider and Munson, 2012). Also, the seventh most significant SNP was placed in an intronic region of gene rnf213, which contains a RING finger domain; proteins with a RING finger domain are involved in different cellular functions including apoptosis and has antibacterial activity (Thery et al., 2021). Likewise, three of the significant SNPs were found in intronic regions within gene grid1b (glutamate receptor, ionotropic, delta 1b), including the third most significant SNP. Gene grid1b is known to play an important role in excitatory synaptic transmission in the central nervous system (Nenadic et al., 2012). Gene ebf3a is located downstream of the most significant SNP in humans, homologous genes have been found to be implicated in the function of mature B cells (Vilagos et al., 2012), B cells are central the fish’s adaptative immune response (Monir et al., 2022).
Here we report the first major QTL for resistance to a bacterial disease in Nile tilapia. For salmon, significant QTLs are widely used, for example, for selection to IPN resistance (Houston et al., 2008; Moen et al., 2009; Moen et al., 2015) and pancreas disease (PD) (Gonen et al., 2015). Also, a QTL explaining 6% of the variation was found for resistance to infectious salmon anemia virus (ISA) (Moen et al., 2007) in Atlantic salmon and more recently for resistance for Piscine myocarditis virus (CMS) (Boison et al., 2019; Hillestad et al., 2020) which are also used for MAS.
No significant correlation has been found between survival to S. iniae and harvest weight (LaFrentz et al., 2020), meaning selection for survival to S. iniae will likely not impact selection for harvest weight, probably the main trait under selection in Nile tilapia breeding programs.
5 Conclusion
This study confirms the presence of a QTL with a considerable effect on survival to S. iniae in Nile tilapia and demonstrates that MAS is an appropriate tool for improving resistance to S. iniae in this population to reduce incidence of this disease in the farms.
Data availability statement
The raw genotype data are not publicly available as it is the property of a commercial enterprise. Requests to access the raw genotype material should be directed to SV-A at c2VyZ2lvLnZlbGFAYm1rZ2VuZXRpY3MuY29t.
Ethics statement
The animal study was reviewed and approved by USDA-ARS, Aquatic Animal Health Research Unit Institutional Animal Care and Use Committee.
Author contributions
The analysis of data and drafting of the manuscript was jointly performed by SV-A, CL, BL, and CS. MR and BB were involved in generation of the idea and the design of the study. JO-A contributed by creating the populations and providing tissue sampling from the material. BL, and CS, perform the challenge test and record phenotypes. All authors read the manuscript, gave suggestions and comments for the improvement, and approved the final manuscript.
Funding
The Nile tilapia families and funding for this research were provided under a Material Transfer Agreement–Cooperative Research and Development Agreement (MTA-CRADA No. 58-6010-6-005) between Spring Genetics and USDA-ARS. This research was also supported by USDA-ARS CRIS Project No. 6010-32000-027-00D, Integrated Research to Improve Aquatic Animal Health in Warmwater Aquaculture. Mention of trade names or commercial products in this publication is solely for the purpose of providing specific information and does not imply recommendation or endorsement by the United States Department of Agriculture.
Acknowledgments
The authors acknowledge the excellent technical assistance provided by Hideyoshi Segovia Uno and Carlos Lopez (Spring Genetics) and Paige Mumma, Megan Justice, Troy Bader and Lee Collins (USDA-ARS).
Conflict of interest
Authors SV-A, CL, and MR were employed by Benchmark Genetics Norway AS. Author JO-A was employed by Spring Genetics.
The remaining authors declare that the research was conducted in the absence of any commercial or financial relationships that could be construed as a potential conflict of interest.
Publisher’s note
All claims expressed in this article are solely those of the authors and do not necessarily represent those of their affiliated organizations, or those of the publisher, the editors and the reviewers. Any product that may be evaluated in this article, or claim that may be made by its manufacturer, is not guaranteed or endorsed by the publisher.
Supplementary material
The Supplementary Material for this article can be found online at: https://www.frontiersin.org/articles/10.3389/fgene.2023.1078381/full#supplementary-material
Footnotes
1bcl2fastq Conversion Software https://support.illumina.com/sequencing/sequencing_software/bcl2fastq-conversion-software.html
2Picard software https://broadinstitute.github.io/picard/
References
Bentsen, H. B., Gjerde, B., Eknath, A. E., de Vera, M. S. P., Velasco, R. R., Danting, J. C., et al. (2017). Genetic improvement of farmed tilapias: Response to five generations of selection for increased body weight at harvest in Oreochromis niloticus and the further impact of the project. Aquaculture 468, 206–217. doi:10.1016/J.AQUACULTURE.2016.10.018
Boison, S., Ding, J., Leder, E., Gjerde, B., Bergtun, P. H., Norris, A., et al. (2019). QTLs associated with resistance to cardiomyopathy syndrome in atlantic salmon. J. Hered. 110, 727–737. doi:10.1093/JHERED/ESZ042
Chang, C. C., Chow, C. C., Tellier, L. C. A. M., Vattikuti, S., Purcell, S. M., and Lee, J. J. (2015). Second-generation PLINK: Rising to the challenge of larger and richer datasets. Gigascience 4, 7. doi:10.1186/s13742-015-0047-8
Conte, M. A., Gammerdinger, W. J., Bartie, K. L., Penman, D. J., and Kocher, T. D. (2017). A high quality assembly of the Nile Tilapia (Oreochromis niloticus) genome reveals the structure of two sex determination regions. BMC Genomics 18, 341. doi:10.1186/s12864-017-3723-5
Danecek, P., Bonfield, J. K., Liddle, J., Marshall, J., Ohan, V., Pollard, M. O., et al. (2021). Twelve years of SAMtools and BCFtools. Gigascience 10, giab008–4. doi:10.1093/GIGASCIENCE/GIAB008
FAO (2022). “Fishery and aquaculture statistics,” in Global aquaculture production 1950-2020 (Rome: Food and Agriculture Organization).
Ferdosi, M. H., Kinghorn, B. P., van der Werf, J. H. J., Lee, S. H., and Gondro, C. (2014). hsphase: An R package for pedigree reconstruction, detection of recombination events, phasing and imputation of half-sib family groups. BMC Bioinforma. 15, 172. doi:10.1186/1471-2105-15-172
Fuji, K., Kobayashi, K., Hasegawa, O., Coimbra, M. R. M., Sakamoto, T., and Okamoto, N. (2006). Identification of a single major genetic locus controlling the resistance to lymphocystis disease in Japanese flounder (Paralichthys olivaceus). Aquaculture 254, 203–210. doi:10.1016/J.AQUACULTURE.2005.11.024
Garrison, E., and Marth, G. (2012). Haplotype-based variant detection from short-read sequencing. Available at: https://arxiv.org/abs/1207.3907v2 (Accessed January 17, 2023).
Gilbey, J., Verspoor, E., Mo, T. A., Sterud, E., Olstad, K., Hytterod, S., et al. (2006). Identification of genetic markers associated with Gyrodactylus salaris resistance in Atlantic salmon Salmo salar. Dis. Aquat. Organ 71, 119–129. doi:10.3354/dao071119
Gonen, S., Baranski, M., Thorland, I., Norris, A., Grove, H., Arnesen, P., et al. (2015). Mapping and validation of a major QTL affecting resistance to pancreas disease (salmonid alphavirus) in Atlantic salmon (Salmo salar). Hered. (Edinb) 115, 405–414. doi:10.1038/HDY.2015.37
Heider, M. R., and Munson, M. (2012). Exorcising the exocyst complex. Traffic 13, 898–907. doi:10.1111/J.1600-0854.2012.01353.X
Hillestad, B., Kristjánsson, Ó. H., Makvandi-Nejad, S., and Moghadam, H. K. (2020). Genome-wide association study confirms previous findings of major loci affecting resistance to piscine myocarditis virus in atlantic salmon (Salmo salar L.). Genes (Basel) 11, 608. doi:10.3390/GENES11060608
Houston, R. D. (2017). Future directions in breeding for disease resistance in aquaculture species. Rev. Bras. Zootec. 46, 545–551. doi:10.1590/S1806-92902017000600010
Houston, R. D., Haley, C. S., Hamilton, A., Guy, D. R., Tinch, A. E., Taggart, J. B., et al. (2008). Major quantitative trait loci affect resistance to infectious pancreatic necrosis in atlantic salmon (Salmo salar). Genetics 178, 1109–1115. doi:10.1534/GENETICS.107.082974
LaFrentz, B. R., Lozano, C. A., Shoemaker, C. A., García, J. C., Ospina-Arango, J. F., and Rye, M. (2020). Genetic (co)variation between harvest weight and resistance to both Streptococcus iniae and S. agalactiae capsular type Ib in Nile tilapia (Oreochromis niloticus). Aquaculture 529, 735726. doi:10.1016/J.AQUACULTURE.2020.735726
LaFrentz, B. R., Lozano, C. A., Shoemaker, C. A., García, J. C., Xu, D. H., Løvoll, M., et al. (2016). Controlled challenge experiment demonstrates substantial additive genetic variation in resistance of Nile tilapia (Oreochromis niloticus) to Streptococcus iniae. Aquaculture 458, 134–139. doi:10.1016/J.AQUACULTURE.2016.02.034
Li, H., and Durbin, R. (2010). Fast and accurate long-read alignment with Burrows-Wheeler transform. Bioinformatics 26, 589–595. doi:10.1093/BIOINFORMATICS/BTP698
Lu, S., Zhu, J., Du, X., Sun, S., Meng, L., Liu, S., et al. (2020). Genomic selection for resistance to Streptococcus agalactiae in GIFT strain of Oreochromis niloticus by GBLUP, wGBLUP, and BayesCπ. Aquaculture 523, 735212. doi:10.1016/J.AQUACULTURE.2020.735212
Martin, M. (2011). Cutadapt removes adapter sequences from high-throughput sequencing reads. EMBnet J. 17, 10–12. doi:10.14806/EJ.17.1.200
Meuwissen, T., Hayes, B., and Goddard, M. (2013). Accelerating improvement of livestock with genomic selection. Annu. Rev. Anim. Biosci. 1, 221–237. doi:10.1146/ANNUREV-ANIMAL-031412-103705
Miao, W., and Wang, W. (2020). Trends of aquaculture production and trade: Carp, Tilapia, and shrimp. Asian Fish. Sci. 33, 1–10. doi:10.33997/j.afs.2020.33.S1.001
Moen, T., Baranski, M., Sonesson, A. K., and Kjøglum, S. (2009). Confirmation and fine-mapping of a major QTL for resistance to infectious pancreatic necrosis in atlantic salmon (Salmo salar): Population-level associations between markers and trait. BMC Genomics 10, 368. doi:10.1186/1471-2164-10-368
Moen, T., Sonesson, A. K., Hayes, B., Lien, S., Munck, H., and Meuwissen, T. H. E. (2007). Mapping of a quantitative trait locus for resistance against infectious salmon anaemia in atlantic salmon (Salmo salar): Comparing survival analysis with analysis on affected/resistant data. BMC Genet. 8, 53. doi:10.1186/1471-2156-8-53
Moen, T., Torgersen, J., Santi, N., Davidson, W. S., Baranski, M., Ødegård, J., et al. (2015). Epithelial cadherin determines resistance to infectious pancreatic necrosis virus in Atlantic salmon. Genetics 200, 1313–1326. doi:10.1534/genetics.115.175406
Monir, M. S., Yusoff, M. S. M., Zamri-Saad, M., Amal, M. N. A., Mohamad, A., Azzam-Sayuti, M., et al. (2022). Effect of an oral bivalent vaccine on immune response and immune gene profiling in vaccinated red tilapia (oreochromis spp.) during infections with streptococcus iniae and aeromonas hydrophila. Biology 11, 1268. doi:10.3390/BIOLOGY11091268
Nenadic, I., Maitra, R., Scherpiet, S., Gaser, C., Schultz, C. C., Schachtzabel, C., et al. (2012). Glutamate receptor δ 1 (GRID1) genetic variation and brain structure in schizophrenia. J. Psychiatr. Res. 46, 1531–1539. doi:10.1016/J.JPSYCHIRES.2012.08.026
Ponzoni, R. W., Khaw, H. L., Nguyen, N. H., and Hamzah, A. (2010). Inbreeding and effective population size in the Malaysian nucleus of the GIFT strain of Nile tilapia (Oreochromis niloticus). Aquaculture 302, 42–48. doi:10.1016/J.AQUACULTURE.2010.02.009
R Core Team (2013). R: A language and environment for statistical computing. Available at: http://www.r-project.org/.
Shoemaker, C. A., Klesius, P. H., and Evans, J. J. (2001). Prevalence of Streptococcus iniae in tilapia, hybrid striped bass, and channel catfish on commercial fish farms in the United States. Am. J. Vet. Res. 62, 174–177. doi:10.2460/AJVR.2001.62.174
Shoemaker, C. A., Lozano, C. A., LaFrentz, B. R., García, J. C., Soto, E., Xu, D. H., et al. (2017a). Additive genetic variation in resistance of Nile tilapia (Oreochromis niloticus) to Streptococcus iniae and S. agalactiae capsular type Ib: Is genetic resistance correlated? Aquaculture 468, 193–198. doi:10.1016/J.AQUACULTURE.2016.10.022
Shoemaker, C. A., Lozano, C. A., LaFrentz, B. R., Mumma, P., Vela-Avitúa, S., Ospina-Arango, J. F., et al. (2022). Additive genetic variation in resistance of Nile tilapia (Oreochromis niloticus) to Francisella orientalis and its genetic (co)variation to both harvest weight and resistance to Streptococcus agalactiae Ib. Aquaculture 561, 738736. doi:10.1016/J.AQUACULTURE.2022.738736
Shoemaker, C. A., Xu DeHai, X. D., and Soto, E. (2017b). “Streptococcus iniae and S. agalactiae,” in Fish viruses and bacteria: Pathobiology and protection. Editors P. T. K. Woo, and R. C. Cipriano (Wallingford: CABI), 298–313. doi:10.1079/9781780647784.0298
Stringer, S., Wray, N. R., Kahn, R. S., and Derks, E. M. (2011). Underestimated effect sizes in GWAS: Fundamental limitations of single SNP analysis for dichotomous phenotypes. PLoS One 6, e27964. doi:10.1371/JOURNAL.PONE.0027964
Thery, F., Martina, L., Asselman, C., Zhang, Y., Vessely, M., Repo, H., et al. (2021). Ring finger protein 213 assembles into a sensor for ISGylated proteins with antimicrobial activity. Nat. Commun. 12 (1), 5772. doi:10.1038/s41467-021-26061-w
Thodesen Da-Yong Ma, J., Rye, M., Wang, Y. X., Yang, K. S., Bentsen, H. B., and Gjedrem, T. (2011). Genetic improvement of tilapias in China: Genetic parameters and selection responses in growth of Nile tilapia (Oreochromis niloticus) after six generations of multi-trait selection for growth and fillet yield. Aquaculture 322 (323), 51–64. doi:10.1016/J.AQUACULTURE.2011.10.010
Trong, T. Q., Mulder, H. A., van Arendonk, J. A. M., and Komen, H. (2013). Heritability and genotype by environment interaction estimates for harvest weight, growth rate, and shape of Nile tilapia (Oreochromis niloticus) grown in river cage and VAC in Vietnam. Aquaculture 384–387, 119–127. doi:10.1016/J.AQUACULTURE.2012.12.022
Vallejo, R. L., Palti, Y., Liu, S., Evenhuis, J. P., Gao, G., Rexroad, C. E., et al. (2014). Detection of QTL in rainbow trout affecting survival when challenged with Flavobacterium psychrophilum. Mar. Biotechnol. (NY) 16, 349–360. doi:10.1007/S10126-013-9553-9
VanRaden, P. M. (2008). Efficient methods to compute genomic predictions. J. Dairy Sci. 91, 4414–4423. doi:10.3168/jds.2007-0980
Vilagos, B., Hoffmann, M., Souabni, A., Sun, Q., Werner, B., Medvedovic, J., et al. (2012). Essential role of EBF1 in the generation and function of distinct mature B cell types. J. Exp. Med. 209, 775–792. doi:10.1084/JEM.20112422
Xu, P., and Ming, J. (2018). “Status and trends of the Tilapia farming industry development,” in Aquaculture in China: Success stories and modern trends, eds. by J-F. Gui, Q. Tang, Z. J. LiLiu, and S. S. de Silva (Chichester: John Wiley & Sons), 404–420. doi:10.1002/9781119120759.CH4_4
Yang, J., Lee, S. H., Goddard, M. E., and Visscher, P. M. (2011). Gcta: A tool for genome-wide complex trait analysis. Am. J. Hum. Genet. 88, 76–82. doi:10.1016/J.AJHG.2010.11.011
Keywords: genome-wide association study (GWAS), Streptococcus iniae, Nile tilapia, survival, quantitative trait loci (QTL), marker assisted selection (MAS)
Citation: Vela-Avitúa S, LaFrentz BR, Lozano CA, Shoemaker CA, Ospina-Arango JF, Beck BH and Rye M (2023) Genome-wide association study for Streptococcus iniae in Nile tilapia (Oreochromis niloticus) identifies a significant QTL for disease resistance. Front. Genet. 14:1078381. doi: 10.3389/fgene.2023.1078381
Received: 24 October 2022; Accepted: 23 January 2023;
Published: 02 March 2023.
Edited by:
Jordan Poley, Scientist at the Center for Aquaculture Technologies in Canada, CanadaReviewed by:
Xinhui Zhang, Beijing Genomics Institute (BGI), ChinaRajesh Joshi, Genomar, Norway
Robert Mukiibi, University of Edinburgh, United Kingdom
Copyright © 2023 Vela-Avitúa, LaFrentz, Lozano, Shoemaker, Ospina-Arango, Beck and Rye. This is an open-access article distributed under the terms of the Creative Commons Attribution License (CC BY). The use, distribution or reproduction in other forums is permitted, provided the original author(s) and the copyright owner(s) are credited and that the original publication in this journal is cited, in accordance with accepted academic practice. No use, distribution or reproduction is permitted which does not comply with these terms.
*Correspondence: Sergio Vela-Avitúa, c2VyZ2lvLnZlbGFAYm1rZ2VuZXRpY3MuY29t; Morten Rye, bW9ydGVuLnJ5ZUBibWtnZW5ldGljcy5jb20=