
94% of researchers rate our articles as excellent or good
Learn more about the work of our research integrity team to safeguard the quality of each article we publish.
Find out more
ORIGINAL RESEARCH article
Front. Genet. , 23 February 2023
Sec. Genomics of Plants and the Phytoecosystem
Volume 14 - 2023 | https://doi.org/10.3389/fgene.2023.1015599
This article is part of the Research Topic Genetic Mechanisms of Stress Tolerance in Crops View all 7 articles
 Jianfeng Li†
 Xin Gao†Xunji Chen*Zheru FanYueqiang ZhangZhong WangJia ShiChunsheng WangHongzhi ZhangLihong WangQi Zhao
Background: Salinity stress is a major adverse environmental factor that can limit crop yield and restrict normal land use. The selection of salt-tolerant strains and elucidation of the underlying mechanisms by plant breeding scientists are urgently needed to increase agricultural production in arid and semi-arid regions.
Results: In this study, we selected the salt-tolerant wheat (Triticum aestivum) strain ST9644 as a model to study differences in expression patterns between salt-tolerant and salt-sensitive strains. High-throughput RNA sequencing resulted in more than 359.10 Gb of clean data from 54 samples, with an average of 6.65 Gb per sample. Compared to the IWGSC reference annotation, we identified 50,096 new genes, 32,923 of which have functional annotations. Comparisons of abundances between salt-tolerant and salt-sensitive strains revealed 3,755, 5,504, and 4,344 genes that were differentially expressed at 0, 6, and 24 h, respectively, in root tissue under salt stress. KEGG pathway analysis of these genes showed that they were enriched for phenylpropanoid biosynthesis (ko00940), cysteine and methionine metabolism (ko00270), and glutathione metabolism (ko00480). We also applied weighted gene co-expression network analysis (WGCNA) analysis to determine the time course of root tissue response to salt stress and found that the acute response lasts >6 h and ends before 12 h. We also identified key alternative splicing factors showing different splicing patterns in salt-sensitive and salt-tolerant strains; however, only few of them were differentially expressed in the two groups.
Conclusion: Our results offer a better understanding of wheat salt tolerance and improve wheat breeding.
Soil salinization is one of the harshest environmental factors and reduces the annual production of various plants. More than 6% of the world’s total agricultural land is affected by high salinity, a proportion that continues to increase (Parihar et al., 2015). Salt accumulation in soils of arid and half-arid regions mainly occurs due to water with trace amounts of NaCl (Tester and Davenport, 2003), which generally impairs the ability of the root to absorb water, leading to the disruption of metabolic processes and reduced photosynthetic efficiency (Maser et al., 2002). However, plants also develop mechanisms to relieve osmotic stress caused by ion cytotoxicity, including decreasing water loss and increasing water uptake (Deinlein et al., 2014). Additionally, many plants reduce Na+ ion cytotoxicity by excreting it from their leaves or compartmentalizing it into vacuoles (Blumwald, 2000).
The environment has constantly shaped plant genomes; however, the underlying genetic mechanisms of how plants adapt to environmental influences remain largely unknown. Identifying the corresponding genes and/or mechanisms involved in salinity tolerance provides opportunities to improve crop resistance to soil salinization. Previous studies reported that sulfur (S) assimilation plays an important role in salt stress metabolism. Increased S increased salt tolerance in different plants (Mehar Fatma et al., 2016). Moreover, S-adenosyl methionine (SAM) is the precursor of polyamines (PAs), which also have close relationships with plant resistance to salinity stress (Zhang et al., 2014). Except for these genes, many transcriptional factor (TF) families are involved in response to salt stress, including AP2/ERF, bHLH, bZIP, MYB, NAC, and WRKY(Serra et al., 2013; Yu et al., 2016; Mao et al., 2017). The AP2/ERF superfamily comprises ERF, AP2, RAV, and the Soloist family based on AP2 domains. A total of 26 RAV genes have been identified in wheat (Karami et al., 2022). The NAC family is one of the largest families of plant-specific TFs; its members were derived from three genes containing domains of no apical meristem (NAM), Arabidopsis transcription activation factor (ATAF), and cup-shaped cotyledon (CUC) (Aida et al., 1997). NAC1 overexpression in rice led to high salt tolerance (Saad et al., 2013; Chen et al., 2014).
Wheat (Triticum aestivum) is one of the most important edible crops globally; however, its yields are seriously threatened by land salinization (Colmer et al., 2006). Wild wheat (Triticum aestivum L.) shows potential for improving its raw yield, quality, and tolerance to both biotic and abiotic stresses (Wani et al., 2022). Although wheat currently provides approximately 20% of the world’s caloric intake, significant wheat breeding efforts are needed for this crop to feed the estimated world population of 9 billion by 2050. Using high-throughput RNA-Seq data, many studies have assessed genes involved in wheat salt stress. Zhang Y. et al. (2016) reported that genes including histone-lysine N-methyltransferase, NAC TF, MYB TF, and TaRSL4 are necessary for salt stress tolerance in the root tissue of bread wheat. Goyal et al. (2016) reported that other genes were responsible for salt tolerance in the root transcriptome of the Kharchia variety, including genes involved in energy supply (like ATP citrate synthase), signaling genes (like Cbl-interacting protein kinase), and ROS scavengers. Xiong et al. (2017) compared expression patterns of shoot between a salt-sensitive wild type and a salt-tolerant mutant bread wheat and found that genes associated with sodium ion transport might be vital for salt tolerance. Moreover, genes encoding arginine decarboxylase, polyamine oxidase, and hormones showed higher expression levels in the salt-tolerant mutant compared to that in the wild type. Amirbakhtiar et al. (2019) compared the transcriptome of root tissue from salt-tolerant bread wheat in Iran, Arg, under salt stress and normal conditions and observed upregulation of genes coding for Ca2+ transporters, including Ta.ANN4, Ta.ACA7, and Ta.NCL2.
Previous studies on wheat salt tolerance evaluated single tissues; thus, their results offered limited knowledge about the mechanisms of salt tolerance. In this study, we selected a salt-tolerant wheat strain and conducted a comparative transcriptome analysis of leaf and root tissues. Our results offer a comprehensive understanding of the reactions in salt tolerance.
To better understand the mechanisms underlying acute salt stress of wheat at the transcription level, we used the ST9644 strain. At the seedling stage, samples of almost the same size were chosen and divided into the control and salt-tolerant group. Root samples were collected and sequenced on the Illumina platform at 0, 1, 3, 6, 12, 24, and 48 h, respectively. In total, >1,199.23 million reads were generated, and 359.10 Gb clean reads were kept after data filtering (Supplementary Table S1). The number of reads for each sample ranged from 38 million to 58 million. Among these filtered reads, >92.61% had base quality >Q30 (an error rate of about 0.1%). These values indicated that the quality of filtered data was sufficiently high for the subsequent analyses.
Wheat genome-based transcriptome analysis was performed using the Hisat2-Stringtie pipeline (Kim et al., 2019). The alignment results indicated that 75.25%–93.83% of the total reads mapped to the reference genome, among which 71.62%–89.43% were uniquely mapped (Supplementary Table S2). To further assess the quality of libraries, we used whole-genome coverage as an indicator. Our results showed that all libraries demonstrated an even distribution across the wheat genome (Figure 1A). We also visualized the distributions of gene regions for all reads in each sample and found that approximately 82% of reads mapped to the exon region (Figure 1B). With the high-throughput sequencing of the Illumina, we also identified 50,096 new genes in our updated annotation. The annotation results of these new genes showed that 32,923 genes had at least one positive result in annotation databases, including GO, eggNOG, and Swiss-Prot (Table 1).
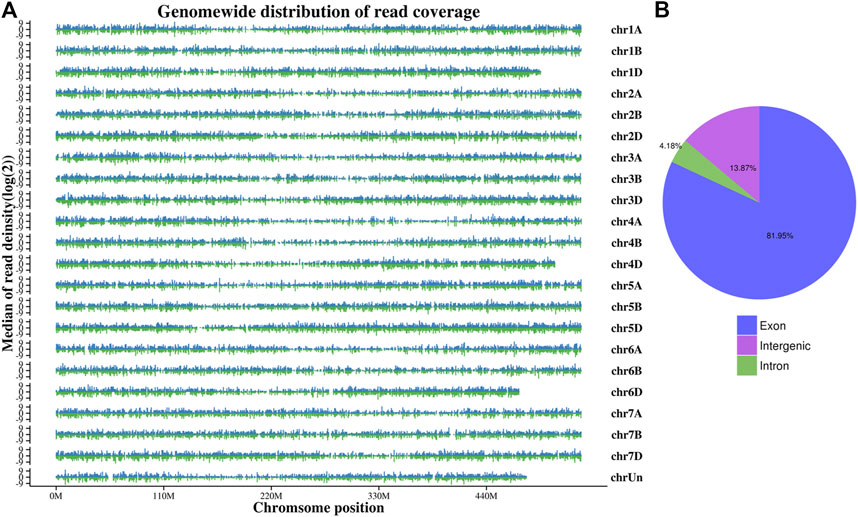
FIGURE 1. Whole-genome coverage (A) and gene read distributions (B) for K6G.
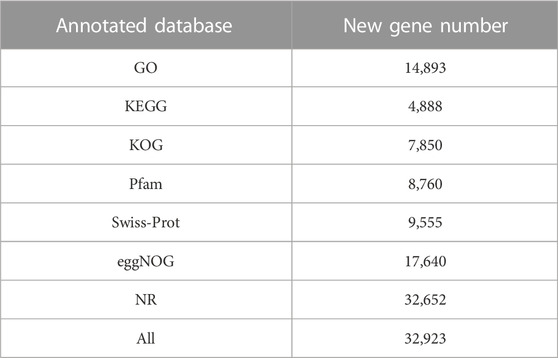
TABLE 1. Functional annotation of all new genes identified in RNA-Seq.
To determine the sample distances in each tissue, we used Spearman’s correlation coefficients to assess the quality of the RNA-Seq data, which showed that samples from leaves and roots clustered together, as expected (Figure 2). As root tissue is the main organ with direct contact with high salt ion concentrations, we first focused on DEGs at different time points in root tissue between salt-tolerant and salt-sensitive strains. Before the salt stress, we identified 3,755 DEGs between salt-tolerant and salt-sensitive strains, which showed significant enrichment in eight KEGG pathways (Supplementary Table S3; Supplementary Figure S1). Many of these were typical salt-related pathways, including phenylalanine metabolism (ko00360); phenylpropanoid biosynthesis (ko00940); cysteine and methionine metabolism (ko00270); glutathione metabolism (ko00480); and phenylalanine, tyrosine, and tryptophan biosynthesis (ko00400) (Panda et al., 2021). At 6 h after salt stress in root tissue, we identified 5,504 DEGs, including 2,637 upregulated and 2,867 downregulated genes. KEGG enrichment analysis of these DEGs showed significant enrichment of six pathways (Table 2). Among these enriched pathways, phenylpropanoid biosynthesis (ko00940, Supplementary Figure S2) was correlated with salt stress in Sophora alopecuroides and barley (Ho et al., 2020; Zhu et al., 2021). Many genes involved in glutathione metabolism and flavonoid biosynthesis were upregulated in the transcriptome of a spaceflight-induced salt-tolerant wheat mutant (Xiong et al., 2017). We also identified many TFs in these DEGs, including NAC, FAR1, MYB, bHLH, bZIP, and WRKY, which were involved in the salt-tolerant strain (Supplementary Figure S3) (Yu et al., 2016; Mao et al., 2017). At 24 h after salt stress in root tissue, we identified 4,344 DEGs between salt-sensitive and salt-tolerant strains, including 1,928 upregulated genes and 2,416 downregulated genes. Six pathways were significantly enriched (Table 3). Among them, glycolysis/gluconeogenesis (ko00010) was stimulated at <50 mM NaCl in the salt-tolerant desert plant Zygophyllum xanthoxylum (Chai et al., 2019). Glutathione metabolism (ko00480) and cysteine and methionine metabolism (ko00270) were both involved in eliminating reactive oxygen and were upregulated under salt-tolerant conditions (Xiong et al., 2017; Chai et al., 2019).
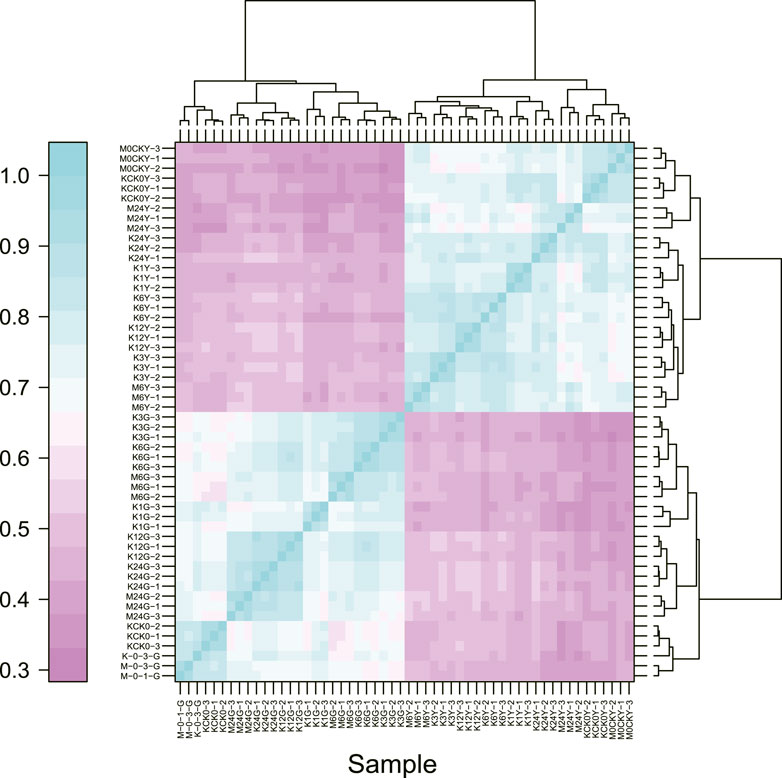
FIGURE 2. Spearman correlations for all samples based on gene expression.
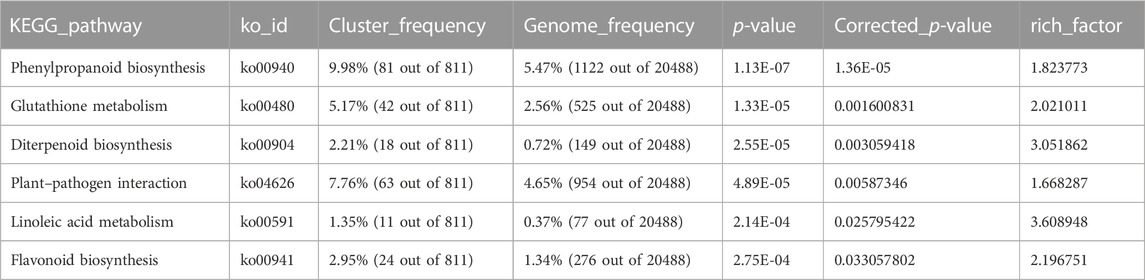
TABLE 2. KEGG enrichment analysis of 5,504 DEGs in root tissue at 6 h after salt stress.
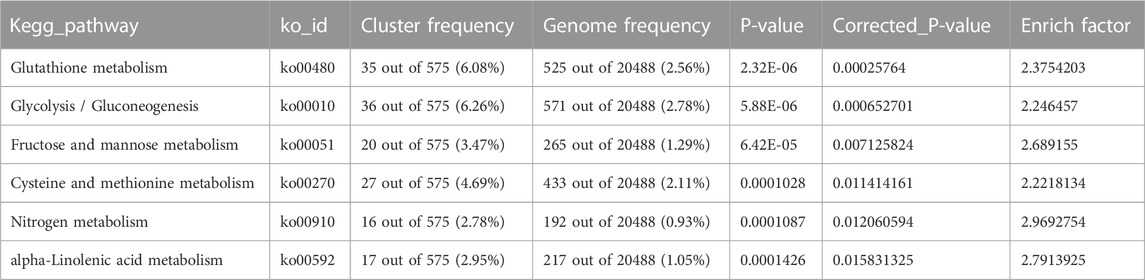
TABLE 3. Enriched KEGG pathways for DEGs in 24 h root tissue.
Among the three time points, we identified 2,331 DEGs with overlap at 6 and 24 h, while few genes overlapped at the other two comparisons (Figure 3A). The reason for this phenomenon might be that salinity caused long-lasting stress to root tissue and reshaped the expression pattern to alleviate the toxicity of high ion concentrations. Among the 2,331 DEGs, 251 were present at all three time points, suggesting their role as housekeeping salt-tolerant proteins. Nine genes were related to phenylpropanoid biosynthesis (ko00940), which showed the largest number of enriched genes (Figure 3B).
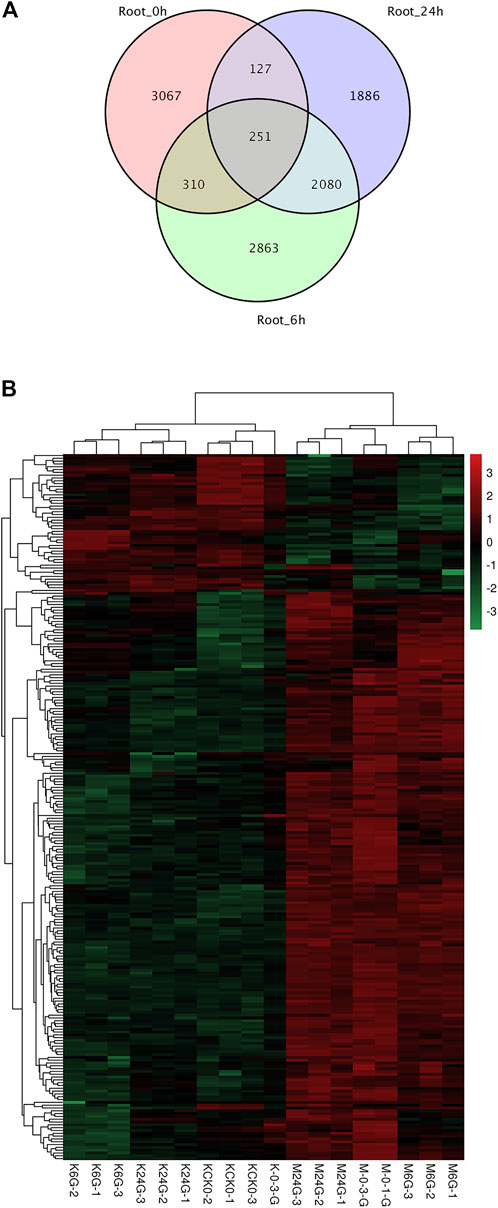
FIGURE 3. DEG overlap and heatmap at 0, 6, and 24 h in root tissue. (A) Overlap of DEGs at three time points. (B) Heatmap of 251 DEGs for all three time points.
In leaf tissue, we identified 5,476 DEGs between salt-sensitive and salt-tolerant strains. At 6 h after salt stress, among 4,447 DEGs, 2,546 were upregulated and the rest were downregulated (Figure 4A). KEGG enrichment analysis revealed significant enrichment of three pathways, including phenylalanine metabolism (ko00360), alpha-linolenic acid metabolism (ko00592), and phenylpropanoid biosynthesis (ko00940). Previous studies reported alpha-linolenic acid metabolism among the pathways of salt-responsive proteins in sesame and purslane (Zaman et al., 2019; Zhang et al., 2019). At 24 h after salt stress, among 4,715 DEGs, 2,018 were upregulated and 2,697 were downregulated (Figure 4B). Four KEGG pathways were significantly enriched, including the MAPK signaling pathway (ko04016), plant hormone signal transduction (ko04075), and ribosome (ko03010) and carotenoid (ko00906) biosynthesis. Many different plant hormone signals are responsible for counteracting the toxicity of high ion concentrations (Ryu and Cho, 2015). Among 9,221 DEGs in leaf tissue, 1,639 were observed in all three time points (Supplementary Figure S4). A total of 1,978, 1,272, and 2,193 DEGs were specific to each time point. The overlapping DEGs showed a minor transcription difference compared to root tissue.
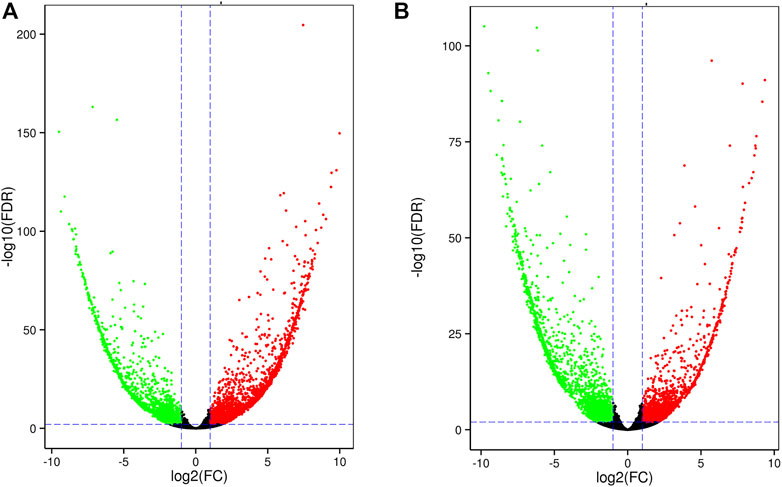
FIGURE 4. Volcano plot of DEGs in leaf tissue at 6 h (A) and 24 h (B).
To study the expression patterns at different time points in root tissue, we applied WGCNA to identify the relationships between salt stress and differences in gene expression. After merging modules with a minimum height of 0.25 and a minimum module size of 30 genes, we obtained five modules (Figure 5A), which corresponded to six different root stages. The brown module corresponded to the untreated status. KEGG phase analysis showed that phenylpropanoid biosynthesis and cysteine and methionine metabolism were the most highly enriched pathways (Figure 5C). The light yellow module showed the most significantly changed genes 1 h after salt stress. After the acute change, the green-yellow module contained genes appearing within 1 h and 3 h after salt stress. KEGG analysis revealed 23 genes in environmental information processing, 17 of which were involved in plant hormone signal transduction (Figure 5C). We also identified three ABC transporter genes in the pathway. These genes were identified as upregulated DEGs in a previous salt stress experiment in wheat (Amirbakhtiar et al., 2019). The red module showed a similar pattern for genes within 3 and 6 h. Finally, the black module contained genes between 12 and 24 h, which showed no overlap with other stages. This pattern showed that the acute reaction of root tissue to salt stress lasted >6 h. At 12h, the gene expression patterns showed minor differences (Figure 5B).

FIGURE 5. WGCNA analysis of root tissue with salt tolerance. (A) Cluster dendrogram of all 15 libraries at five time points in root tissue. (B) Module–trait relationships for different modules with salt tolerance. (C) KEGG enrichment analysis of the green-yellow module.
Alternative splicing (AS) is a common phenomenon in multi-exon eukaryotic genes, through which multiple transcripts can be generated. Many mechanisms have been reported, including mutually exclusive exons (MXEs), alternative exon (AE) ends, skipped exons (SEs), alternative 3′/5′ splicing sites (TTS/TSS), and retained introns (RIs) (Jin et al., 2018). RIs are the most common type of AS in plants and usually result in transcripts with premature termination codons (PTCs), which further lead to non-sense mRNA decay (NMD) (Monteuuis et al., 2019). In this study, root and leaf tissues shared similar patterns of AS at the same time points (Figure 6). Moreover, TSS and TTS were the most common AS types in all the samples, at approximately 40.79% and 40.07%, respectively. However, this pattern is contrary to that in cotton, in which the most common AS under salt stress is intron retention (35.73%) (Zhu et al., 2018). Although the two plants have distinct AS patterns, they both have increased AS events under salt stress in both roots and leaves. This phenomenon may increase broader plasticity for different plants to adapt to various stresses (Zhu et al., 2018).
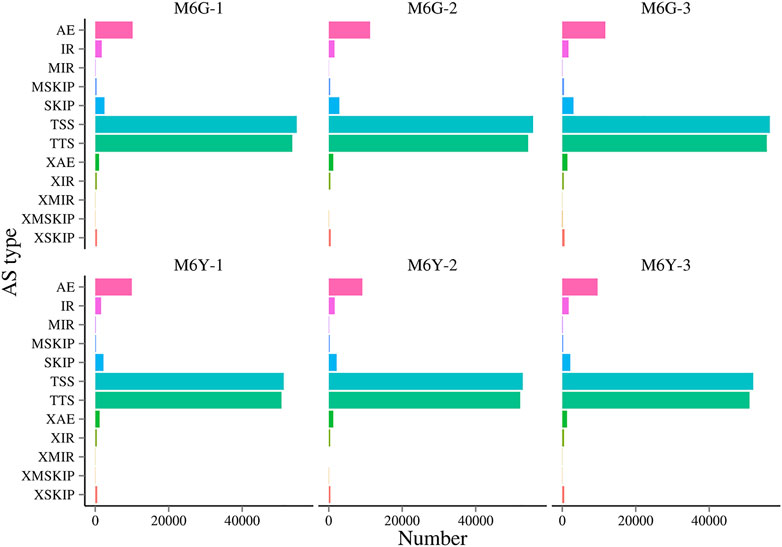
FIGURE 6. Different alternative splicing types in M6Y and M6G samples.
Previous studies have reported many splicing regulators in plant responses to abiotic stress (Zhan et al., 2015; Zhang F. et al., 2016). The cap-binding protein CBP20 modulated salt stress response in Arabidopsis (Kong et al., 2014) and is part of a subunit of dimeric nuclear cap-binding complex (CBC) which combines with the cap structure of RNA polymerase II to influence AS of first introns (Raczynska et al., 2010). In the root tissue in the present study, we identified TSS and TTS at 6 and 24 h in the salt-tolerant strain for Ta.CBP20. However, this gene neither show AS in the salt-sensitive strain at the same time point nor was differentially expressed at the two time points. Another large protein family involved in splicing is the serine/arginine (SR) family (Carvalho et al., 2013). Previous studies found that SR overexpression increased plant tolerance to salt or other abiotic stress (Palusa et al., 2007; Duque, 2011; Feng et al., 2015). Moreover, the AS of most SRs was identified under stress conditions (Ding et al., 2014). In this study, we identified 26 SR ortholog genes among wheat annotations. Among them, 10 showed differential alternative splicing under salt stress while only two were differentially expressed under salt stress. This pattern was like that in cotton under salt stress, indicating that splicing regulators in plants preferred to be regulated at the post-transcriptional level rather than the transcriptional level.
To validate the RNA-Seq expression at different time points, nine genes related to salt tolerance were selected for further validation by qRT-PCR (Figure 7). The qRT-PCR results were consistent with those from RNA-Seq (R2 = 0.96, Supplementary Figure S5), indicating the high accuracy of the DEGs identified in this study. Many of these genes, such as ABC transporters, are reportedly involved in salt tolerance (Amirbakhtiar et al., 2019).
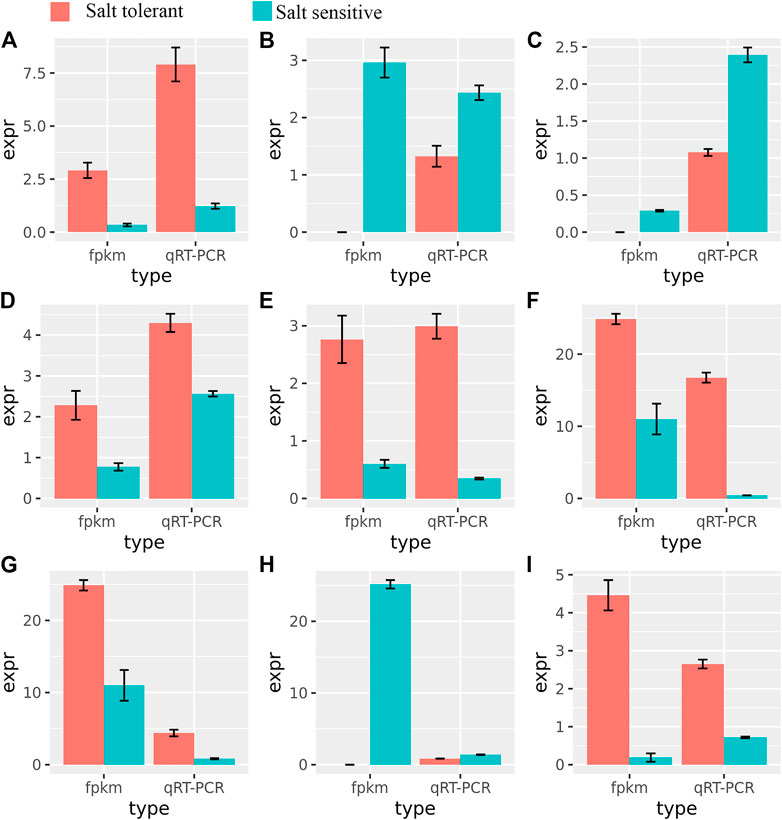
FIGURE 7. Relationships between FPMK and qRT-PCR validation of nine differentially expressed genes. The expression values (mean ± SE) were used in comparison to those of RNA-Seq. (A): TraesCS6B02G205900; (B): TraesCS5A02G391700; (C): TraesCS5A02G391700; (D): TraesCS4A02G425300; (E): TraesCS5D02G452500; (F): TraesCS2A02G483300; (G): TraesCS5B02G449500; (H): TraesCS2D02G567100; (I): TraesCS6A02G243200.
In this study, high-throughput RNA-Seq of 54 samples from root and leaf tissues in wheat strains with different tolerance on salt stress revealed different expression patterns between the two groups at different time points. Our results showed that the expression pattern of root tissue changed dramatically after salt stress and that the acute reaction lasted for >6 h and ended before 12 h. From that time on, the expression pattern remained relatively consistent for >24 h. KEGG enrichment analysis showed that the DEGs in this study were enriched in phenylpropanoid biosynthesis (ko00940), cysteine and methionine metabolism (ko00270), and glutathione metabolism (ko00480), which have also been identified in other plants under salt stress. Finally, we predicted that different plants shared pathways and mechanisms to cope with salt stress. Our results offer new knowledge for an improved understanding of the mechanisms of salt tolerance in wheat.
All samples used in this study were obtained from the 71 strains generated for the Global Challenges Programme (GCP), whose salt tolerances were tested according to the technical specifications for the identification and evaluation of salt tolerance in wheat (NY/PZT001-2002) from the Chinese Ministry of Agriculture. Among these 71 strains, salt-tolerant 9644 (ST9644) showed the best appearance and was chosen as the target in this study. Seeds were placed in a germinating box to the seedling stage and then grown hydroponically in the greenhouse until the two-leaf and one-heart stages. Next, similarly sized plants were divided into the control and salt stress groups. The control group was treated with pure water, while the salt stress group was treated with a 2% NaCl solution. Leaf and root tissues were collected after the treatment begin for 0, 1, 3, 6, 12, 24, and 48 h (Supplementary Figure S6). At each time point, three biological replicates were taken for both groups. All samples were immediately frozen in liquid nitrogen until further analysis.
Total RNA was extracted from all aforementioned samples using an RNeasy Plant Mini Kit (QIAGEN) according to the manufacturer’s instructions. The RNA purity and concentration were checked using the NanoDrop 2000 and Qubit 2.0 instruments. Samples with RIN values >8.0 were used for library construction and Illumina sequencing. The libraries were constructed using Illumina TruSeq RNA Sample Preparation Kit v2 (Illumina, San Diego, CA, United States) according to the manufacturer’s instructions. Sequencing was performed by Biomarker Ltd. (Beijing, China) on NovaSeq 6000 instruments (Illumina, San Diego, United States) with PE150. To remove low-quality reads or base pairs, reads with adapters, poly-N homopolymers, and very low quality reads were removed from the raw sequencing data. Finally, the Q20 and Q30 values were calculated to further assess the quality of the filtered reads.
Quality-controlled reads were mapped to the wheat genome sequence (https://www.ncbi.nlm.nih.gov/assembly/GCA_900519105.1wgsc_refseqv1.0) by Hisat2 (Kim et al., 2015). Gene expression was quantified as fragments per kilobase of transcript per million (FPKM). Differential expression analysis between the control and salt stress groups was performed using DESeq2, which used a model based on a negative binomial distribution to identify DEGs from the whole gene set (Love et al., 2014). The p-values were adjusted using the Benjamini–Hochberg method, and the corresponding false discovery rate (FDR) was determined (Anders and Huber, 2010). Genes with FDR<0.01 and fold-change>2 were assigned as DEGs (Fu et al., 2019). GO and KEGG enrichment analyses were carried out using clusterProfiler (version 3.10.1) (Yu et al., 2012) in R software. Venn graphs of the overlaps of DEGs at different time points were generated using BMKCloud (www.biocloud.net).
To identify similarities in gene expression patterns among all the samples, we input the log2-normalized FPKM values for all genes into the WGCNA package (Langfelder and Horvath, 2008) in R to generate gene networks. The standard process was used to minimize noise. The gene networks were identified using a dynamic tree-cut algorithm with a minimum cluster size of 25 and merging a threshold of 0.25 (Li et al., 2021). Hub genes were also identified based on eigengene connectivity (KME) (Peter Langfelder and Horvath, 2013).
rMATS was used to identify different AS in transcripts from the same gene in RNA-Seq data (Shen et al., 2014). The statistical model was used to quantify the amounts of alternative splicing events in different samples. The p-value was calculated based on the likelihood-ratio test to determine whether these two groups of samples met the inclusion level for which the Benjamini–Hochberg algorithm was used to correct the false discovery rate.
Three replicates for each sample were for qRT-PCR. cDNA was synthesized using a SuperScript IV CellsDirect cDNA Synthesis Kit (ThermoFisher, United States) according to the manufacturer’s instructions. qRT-PCR was performed on a LightCycler 480 Real-time PCR (Roche Life Science, Germany) with the SYBR Green Master Mix (ThermoFisher, United States) according to the manual. Normalization of all genes was performed with TUBB as an internal control. The primers for each gene are listed in Supplementary Table S4. The expression level for each gene was calculated from the cycle threshold using the 2−ΔΔCT method.
The datasets presented in this study can be found in online repositories. The names of the repository/repositories and accession number(s) can be found in the article/Supplementary Material.
JL and XG performed the experiments, analyzed the data, and reviewed drafts of the paper. XC conceived and designed the experiments, wrote the paper, and modified the paper. ZF conceived and designed the experiments, analyzed the data, wrote the paper, arranged the figures and tables, and reviewed drafts of the paper. YZ collected wheat germplasm resources and reviewed drafts of the paper. ZW, JS, CW, HZ, LW, and QZ analyzed the data and reviewed drafts of the paper. All authors contributed to the manuscript and approved the submitted version.
This study was funded by the Special Cultivation Program for Scientific and Technological Innovation of the Xinjiang Academy of Agricultural Sciences (xjkcpy-005), the Project of Public Welfare Scientific Research Institutes of the Autonomous Region (“Salt Tolerance Identification and Genome-wide Association study of Wheat RIL Population,” 2021.2-2023.12, kj2021133), and an Open Project of the Key Laboratory of Crop Biotechnology of Xinjiang Uygur Autonomous Region (“Transcriptome Study of Root and Leaf Response to NaCl Stress in Wheat Seedling,” 2020–2022) Major scientific and technological special project of Xinjiang Uygur Autonomous Region "Wheat Biological Breeding Innovation Project" (2021A02001-1).
The authors declare that the research was conducted in the absence of any commercial or financial relationships that could be construed as a potential conflict of interest.
All claims expressed in this article are solely those of the authors and do not necessarily represent those of their affiliated organizations, or those of the publisher, the editors, and the reviewers. Any product that may be evaluated in this article, or claim that may be made by its manufacturer, is not guaranteed or endorsed by the publisher.
The Supplementary Material for this article can be found online at: https://www.frontiersin.org/articles/10.3389/fgene.2023.1015599/full#supplementary-material
SUPPLEMENTARY FIGURE S1 | Enriched KEGG analysis of 3,855 DEGs between salt-sensitive and salt-tolerant wheat root tissues at 0 h.
SUPPLEMENTARY FIGURE S2 | KEGG pathway for genes enriched in phenylpropanoid biosynthesis (ko00940) between salt-sensitive and salt-tolerant wheat root tissues at 6 h.
SUPPLEMENTARY FIGURE S3 | Salt tolerance-related transcription factors in DEGs 6 h after salt stress in root tissue.
SUPPLEMENTARY FIGURE S4 | In total, 1,639 DEGs were present in leaf tissue at all three time points (0, 6, and 24 h).
SUPPLEMENTARY FIGURE S5 | Correlations between RNA-Seq and qRT-PCR results.
SUPPLEMENTARY FIGURE S6 | Workflow of the salt-stressed experiment for the wheat strain ST9644.
Aida, M., Ishida, T., Fukaki, H., Fujisawa, H., and Tasaka, M. (1997). Genes involved in organ separation in arabidopsis: An analysis of the cup-shaped cotyledon mutant. Plant Cell 9 (6), 841–857. doi:10.1105/tpc.9.6.841
Amirbakhtiar, N., Ismaili, A., Ghaffari, M. R., Nazarian Firouzabadi, F., and Shobbar, Z. S. (2019). Transcriptome response of roots to salt stress in a salinity-tolerant bread wheat cultivar. PLoS One 14 (3), e0213305. doi:10.1371/journal.pone.0213305
Anders, S., and Huber, W. (2010). Differential expression analysis for sequence count data. Genome Biol. 11 (10), R106. doi:10.1186/gb-2010-11-10-r106
Blumwald, E. (2000). Sodium transport and salt tolerance in plants. Curr. Opin. Cell Biol. 12 (4), 431–434. doi:10.1016/s0955-0674(00)00112-5
Carvalho, R. F., Feijao, C. V., and Duque, P. (2013). On the physiological significance of alternative splicing events in higher plants. Protoplasma 250 (3), 639–650. doi:10.1007/s00709-012-0448-9
Chai, W. W., Wang, W. Y., Ma, Q., Yin, H. J., Hepworth, S. R., and Wang, S. M. (2019). Comparative transcriptome analysis reveals unique genetic adaptations conferring salt tolerance in a xerohalophyte. Funct. Plant Biol. 46 (7), 670–683. doi:10.1071/FP18295
Chen, X., Wang, Y., Lv, B., Li, J., Luo, L., Lu, S., et al. (2014). The NAC family transcription factor OsNAP confers abiotic stress response through the ABA pathway. Plant Cell Physiol. 55 (3), 604–619. doi:10.1093/pcp/pct204
Colmer, T. D., Flowers, T. J., and Munns, R. (2006). Use of wild relatives to improve salt tolerance in wheat. J. Exp. Bot. 57 (5), 1059–1078. doi:10.1093/jxb/erj124
Deinlein, U., Stephan, A. B., Horie, T., Luo, W., Xu, G., and Schroeder, J. I. (2014). Plant salt-tolerance mechanisms. Trends Plant Sci. 19 (6), 371–379. doi:10.1016/j.tplants.2014.02.001
Ding, F., Cui, P., Wang, Z., Zhang, S., Ali, S., and Xiong, L. (2014). Genome-wide analysis of alternative splicing of pre-mRNA under salt stress in Arabidopsis. BMC Genomics 15, 431. doi:10.1186/1471-2164-15-431
Duque, P. (2011). A role for SR proteins in plant stress responses. Plant Signal Behav. 6 (1), 49–54. doi:10.4161/psb.6.1.14063
Feng, J., Li, J., Gao, Z., Lu, Y., Yu, J., Zheng, Q., et al. (2015). SKIP confers osmotic tolerance during salt stress by controlling alternative gene splicing in arabidopsis. Mol. Plant 8 (7), 1038–1052. doi:10.1016/j.molp.2015.01.011
Fu, B., Yu, X., Tong, J., Pang, M., Zhou, Y., Liu, Q., et al. (2019). Comparative transcriptomic analysis of hypothalamus-pituitary-liver axis in bighead carp (Hypophthalmichthys nobilis) with differential growth rate. BMC Genomics 20 (1), 328. doi:10.1186/s12864-019-5691-4
Goyal, E., Amit, S. K., Singh, R. S., Mahato, A. K., Chand, S., and Kanika, K. (2016). Transcriptome profiling of the salt-stress response in Triticum aestivum cv. Kharchia Local. Sci. Rep. 6, 27752. doi:10.1038/srep27752
Ho, W. W. H., Hill, C. B., Doblin, M. S., Shelden, M. C., van de Meene, A., Rupasinghe, T., et al. (2020). Integrative multi-omics analyses of barley rootzones under salinity stress reveal two distinctive salt tolerance mechanisms. Plant Commun. 1 (3), 100031. doi:10.1016/j.xplc.2020.100031
Jin, Y., Dong, H., Shi, Y., and Bian, L. (2018). Mutually exclusive alternative splicing of pre-mRNAs. Wiley Interdiscip. Rev. RNA 9 (3), e1468. doi:10.1002/wrna.1468
Karami, M., Fatahi, N., Lohrasebi, T., and Razavi, K. (2022). RAV transcription factor regulatory function in response to salt stress in two Iranian wheat landraces. J. Plant Res. 135 (1), 121–136. doi:10.1007/s10265-021-01356-7
Kim, D., Langmead, B., and Salzberg, S. L. (2015). Hisat: A fast spliced aligner with low memory requirements. Nat. Methods 12 (4), 357–360. doi:10.1038/nmeth.3317
Kim, D., Paggi, J. M., Park, C., Bennett, C., and Salzberg, S. L. (2019). Graph-based genome alignment and genotyping with HISAT2 and HISAT-genotype. Nat. Biotechnol. 37 (8), 907–915. doi:10.1038/s41587-019-0201-4
Kong, X., Ma, L., Yang, L., Chen, Q., Xiang, N., Yang, Y., et al. (2014). Quantitative proteomics analysis reveals that the nuclear cap-binding complex proteins arabidopsis CBP20 and CBP80 modulate the salt stress response. J. Proteome Res. 13 (5), 2495–2510. doi:10.1021/pr4012624
Langfelder, P., and Horvath, S. (2008). Wgcna: an R package for weighted correlation network analysis. BMC Bioinforma. 9, 559. doi:10.1186/1471-2105-9-559
Li, F., Hu, Q., Chen, F., and Jiang, J. F. (2021). Transcriptome analysis reveals Vernalization is independent of cold acclimation in Arabidopsis. BMC Genomics 22 (1), 462. doi:10.1186/s12864-021-07763-3
Love, M. I., Huber, W., and Anders, S. (2014). Moderated estimation of fold change and dispersion for RNA-seq data with DESeq2. Genome Biol. 15 (12), 550. doi:10.1186/s13059-014-0550-8
Mao, K., Dong, Q., Li, C., Liu, C., and Ma, F. (2017). Genome wide identification and characterization of apple bHLH transcription factors and expression analysis in response to drought and salt stress. Front. Plant Sci. 8, 480. doi:10.3389/fpls.2017.00480
Maser, P., Eckelman, B., Vaidyanathan, R., Horie, T., Fairbairn, D. J., Kubo, M., et al. (2002). Altered shoot/root Na+ distribution and bifurcating salt sensitivity in Arabidopsis by genetic disruption of the Na+ transporter AtHKT1. FEBS Lett. 531 (2), 157–161. doi:10.1016/s0014-5793(02)03488-9
Mehar Fatma, A. M., Per, Tasir S., Rasheed, Faisal, Khan, Nafees A., and Khan, N. A. (2016). Interplay between nitric oxide and sulfur assimilation in salt tolerance in plants. Crop J. 4 (3), 153–161. doi:10.1016/j.cj.2016.01.009
Monteuuis, G., Wong, J. J. L., Bailey, C. G., Schmitz, U., and Rasko, J. E. J. (2019). The changing paradigm of intron retention: Regulation, ramifications and recipes. Nucleic Acids Res. 47 (22), 11497–11513. doi:10.1093/nar/gkz1068
Palusa, S. G., Ali, G. S., and Reddy, A. S. (2007). Alternative splicing of pre-mRNAs of arabidopsis serine/arginine-rich proteins: Regulation by hormones and stresses. Plant J. 49 (6), 1091–1107. doi:10.1111/j.1365-313X.2006.03020.x
Panda, A., Rangani, J., and Parida, A. K. (2021). Unraveling salt responsive metabolites and metabolic pathways using non-targeted metabolomics approach and elucidation of salt tolerance mechanisms in the xero-halophyte Haloxylon salicornicum. Plant Physiology Biochem. 158, 284–296. doi:10.1016/j.plaphy.2020.11.012
Parihar, P., Singh, S., Singh, R., Singh, V. P., and Prasad, S. M. (2015). Effect of salinity stress on plants and its tolerance strategies: A review. Environ. Sci. Pollut. Res. Int. 22 (6), 4056–4075. doi:10.1007/s11356-014-3739-1
Peter Langfelder, P. S. M., Horvath, S., and Horvath, S. (2013). When is hub gene selection better than standard meta-analysis? plos one 8, e61505. doi:10.1371/journal.pone.0061505
Raczynska, K. D., Simpson, C. G., Ciesiolka, A., Szewc, L., Lewandowska, D., McNicol, J., et al. (2010). Involvement of the nuclear cap-binding protein complex in alternative splicing in Arabidopsis thaliana. Nucleic Acids Res. 38 (1), 265–278. doi:10.1093/nar/gkp869
Ryu, H., and Cho, Y.-G. (2015). Plant hormones in salt stress tolerance. J. Plant Biol. 58 (3), 147–155. doi:10.1007/s12374-015-0103-z
Saad, A. S., Li, X., Li, H. P., Huang, T., Gao, C. S., Guo, M. W., et al. (2013). A rice stress-responsive NAC gene enhances tolerance of transgenic wheat to drought and salt stresses. Plant Sci. 203-204, 33–40. doi:10.1016/j.plantsci.2012.12.016
Serra, T. S., Figueiredo, D. D., Cordeiro, A. M., Almeida, D. M., Lourenco, T., Abreu, I. A., et al. (2013). OsRMC, a negative regulator of salt stress response in rice, is regulated by two AP2/ERF transcription factors. Plant Mol. Biol. 82 (4-5), 439–455. doi:10.1007/s11103-013-0073-9
Shen, S., Park, J. W., Lu, Z. X., Lin, L., Henry, M. D., Wu, Y. N., et al. (2014). rMATS: robust and flexible detection of differential alternative splicing from replicate RNA-Seq data. Proc. Natl. Acad. Sci. U. S. A. 111 (51), E5593–E5601. doi:10.1073/pnas.1419161111
Tester, M., and Davenport, R. (2003). Na+ tolerance and Na+ transport in higher plants. Ann. Bot. 91 (5), 503–527. doi:10.1093/aob/mcg058
Wani, S. H., Khan, H., Riaz, A., Joshi, D. C., Hussain, W., Rana, M., et al. (2022). Chapter Six - genetic diversity for developing climate-resilient wheats to achieve food security goals. Adv. Agron. 171, 255–303. D. L. Sparks, Academic Press.
Xiong, H., Guo, H., Xie, Y., Zhao, L., Gu, J., Zhao, S., et al. (2017). RNAseq analysis reveals pathways and candidate genes associated with salinity tolerance in a spaceflight-induced wheat mutant. Sci. Rep. 7 (1), 2731. doi:10.1038/s41598-017-03024-0
Yu, G., Wang, L. G., Han, Y., and He, Q. Y. (2012). clusterProfiler: an R package for comparing biological themes among gene clusters. OMICS 16 (5), 284–287. doi:10.1089/omi.2011.0118
Yu, Y., Wang, N., Hu, R., and Xiang, F. (2016). Genome-wide identification of soybean WRKY transcription factors in response to salt stress. Springerplus 5 (1), 920. doi:10.1186/s40064-016-2647-x
Zaman, S., Hu, S., Alam, M. A., Du, H., and Che, S. (2019). The accumulation of fatty acids in different organs of purslane under salt stress. Sci. Hortic. 250, 236–242. doi:10.1016/j.scienta.2019.02.051
Zhan, X., Qian, B., Cao, F., Wu, W., Yang, L., Guan, Q., et al. (2015). An Arabidopsis PWI and RRM motif-containing protein is critical for pre-mRNA splicing and ABA responses. Nat. Commun. 6 (1), 8139. doi:10.1038/ncomms9139
Zhang, F., Zhu, G., Du, L., Shang, X., Cheng, C., Yang, B., et al. (2016a). Genetic regulation of salt stress tolerance revealed by RNA-Seq in cotton diploid wild species, Gossypium davidsonii. Sci. Rep. 6, 20582. doi:10.1038/srep20582
Zhang, G.-w., Xu, S.-c., Hu, Q.-z., Mao, W.-h., and Gong, Y.-m. (2014). Putrescine plays a positive role in salt-tolerance mechanisms by reducing oxidative damage in roots of vegetable soybean. J. Integr. Agric. 13 (2), 349–357. doi:10.1016/s2095-3119(13)60405-0
Zhang, Y., Liu, Z., Khan, A. A., Lin, Q., Han, Y., Mu, P., et al. (2016b). Expression partitioning of homeologs and tandem duplications contribute to salt tolerance in wheat (Triticum aestivum L.). Sci. Rep. 6, 21476. doi:10.1038/srep21476
Zhang, Y., Wei, M., Liu, A., Zhou, R., Li, D., Dossa, K., et al. (2019). Comparative proteomic analysis of two sesame genotypes with contrasting salinity tolerance in response to salt stress. J. Proteomics 201, 73–83. doi:10.1016/j.jprot.2019.04.017
Zhu, G., Li, W., Zhang, F., and Guo, W. (2018). RNA-seq analysis reveals alternative splicing under salt stress in cotton, Gossypium davidsonii. BMC Genomics 19 (1), 73. doi:10.1186/s12864-018-4449-8
Keywords: salt-tolerant, wheat, transcriptome, WGCNA, alternative splicing, DEGs
Citation: Li J, Gao X, Chen X, Fan Z, Zhang Y, Wang Z, Shi J, Wang C, Zhang H, Wang L and Zhao Q (2023) Comparative transcriptome responses of leaf and root tissues to salt stress in wheat strains with different salinity tolerances. Front. Genet. 14:1015599. doi: 10.3389/fgene.2023.1015599
Received: 09 August 2022; Accepted: 07 February 2023;
Published: 23 February 2023.
Edited by:
Dezhi Wu, Hunan Agricultural University, ChinaCopyright © 2023 Li, Gao, Chen, Fan, Zhang, Wang, Shi, Wang, Zhang, Wang and Zhao. This is an open-access article distributed under the terms of the Creative Commons Attribution License (CC BY). The use, distribution or reproduction in other forums is permitted, provided the original author(s) and the copyright owner(s) are credited and that the original publication in this journal is cited, in accordance with accepted academic practice. No use, distribution or reproduction is permitted which does not comply with these terms.
*Correspondence: Xunji Chen, MzAzMDUzMDY2QHFxLmNvbQ==
†These authors have contributed equally to this work
Disclaimer: All claims expressed in this article are solely those of the authors and do not necessarily represent those of their affiliated organizations, or those of the publisher, the editors and the reviewers. Any product that may be evaluated in this article or claim that may be made by its manufacturer is not guaranteed or endorsed by the publisher.
Research integrity at Frontiers
Learn more about the work of our research integrity team to safeguard the quality of each article we publish.