 Azam Yazdani
 Akram Yazdani2
- 1Center of Perioperative Genetics and Genomics, Brigham Women’s Hospital, Harvard Medical School, Boston, MA, United States
- 2Health Science Center at Houston, McGovern Medical School, Division of Clinical and Translational Sciences, University of Texas, Houston, TX, United States
- 3Biostatistics and Computational Biology Branch, National Institute of Environmental Health Sciences, Durham, NC, United States
- 4Division of Pulmonary Medicine, Boston Children’s Hospital, Boston, MA, United States
- 5Department of Biostatistics, University of North Carolina at Chapel Hill, Chapel Hill, NC, United States
- 6Department of Quantitative Health Sciences, Mayo Clinic, Rochester, MN, United States
The number of studies with information at multiple biological levels of granularity, such as genomics, proteomics, and metabolomics, is increasing each year, and a biomedical questaion is how to systematically integrate these data to discover new biological mechanisms that have the potential to elucidate the processes of health and disease. Causal frameworks, such as Mendelian randomization (MR), provide a foundation to begin integrating data for new biological discoveries. Despite the growing number of MR applications in a wide variety of biomedical studies, there are few approaches for the systematic analysis of omic data. The large number and diverse types of molecular components involved in complex diseases interact through complex networks, and classical MR approaches targeting individual components do not consider the underlying relationships. In contrast, causal network models established in the principles of MR offer significant improvements to the classical MR framework for understanding omic data. Integration of these mostly distinct branches of statistics is a recent development, and we here review the current progress. To set the stage for causal network models, we review some recent progress in the classical MR framework. We then explain how to transition from the classical MR framework to causal networks. We discuss the identification of causal networks and evaluate the underlying assumptions. We also introduce some tests for sensitivity analysis and stability assessment of causal networks. We then review practical details to perform real data analysis and identify causal networks and highlight some of the utility of causal networks. The utilities with validated novel findings reveal the full potential of causal networks as a systems approach that will become necessary to integrate large-scale omic data.
Introduction
Due to recent technological advances, data acquisition of molecular components on large scales and in multiple omics capacities has been realized. Yet, advanced analytic methods are desperately needed to systematically integrate these data to facilitate discoveries and improved understanding of the biological process that impacts omics health and disease. Systematic analysis refers to the simultaneous analysis of all data in the study while considering their interconnectivity/dependency. Identifying the underlying relationships among molecular entities as a network provides insights into complex processes that would not be revealed by focusing on individual entities in isolation (Barabasi and Oltvai, 2004; Bebek et al., 2012). Such an analysis requires the incorporation of further relevant biological information (Ainsworth et al., 2017).
Causal networks, as a systematic analysis of data, are ideally suited for analyzing multi-omics and heterogeneous data sets to reveal the role of entities individually or as a module in a system (e.g., an omic, such as metabolomics). Using the principles of MR on a genome-wide scale and integrating genetics with other omic data allow researchers to relate information at different levels of omic data in a cohesive analytic framework and possibly uncover the underlying relationships that represent molecular networks (Badsha and Fu, 2019a; Ahangaran et al., 2019). Causal networks not only represent the connectivity among observations but also facilitate extracting causality from observational data (Holmes et al., 2017; Dorvash et al., 2020; Hackett et al., 2020; Khan et al., 2020).
Identifying causality through classical MR has received attention in biomedical research. The characteristic of this framework is hypothesis-driven with a focus on a small set of entities with known underlying relationships (known causal diagram) (Richmond et al., 2016). In modern biomedical research, i.e., large-scale omic data, however, there are several hundred or thousands of entities, and there is limited knowledge about interconnectivity among them. Causal networks are pragmatic to address the challenges of large-scale omics.
We here review the integration of classical MR and causal networks which seem mostly as two distinct branches of statistics. Here, we first briefly review some recent developments in the classical MR framework then, we discuss the identification of causal networks, evaluation of the underlying assumptions, and introduce some tests to assess the stability of the networks. We also review practical steps to identify causal networks on real data and review some utilities of causal networks, such as the identification of molecular regulatory sub-networks and the identification of molecules with an essential role in the system under study.
An overview of mendelian randomization
To estimate causal relationships when experiments cannot be controlled or randomized, which is often the case for biomedical studies, statistical regression models are frequently used by regressing a response variable on an explanatory variable. However, regression models can give biased results when an explanatory variable is correlated with the regression model’s error term. To overcome this limitation, instrumental variables (IV) can be used, but with strong assumptions. A valid IV induces changes in the explanatory variable but not the response of interest other than through the explanatory variable, hence allowing identification of the causal effect of the explanatory variable on the response variable. The basis of MR is the use of IVs, as discussed extensively in the literature (Sanderson et al., 2022). In biomedical studies, genetic variants are frequently used as IVs because of assumptions of Mendelian genetics: random mating of parents and random transmission of alleles from parents to offspring. An IV is valid under the following assumptions (Bowden et al., 2015):
1. IV is associated with an explanatory variable conditional on other covariates in the model.
2. IV is not associated with unmeasured confounders.
3. IV is not associated with response conditional on the explanatory variable and unmeasured confounders.
In MR applications, when a genetic variant affects response via a different biological pathway from the explanatory variable,
Some recent progress in the classical MR framework
One of the recent MR developments in the classical MR framework includes applications with several explanatory variables, called multivariable MR. Multivariable MR enables estimating the effects of multiple individual explanatory variables (primary and secondary explanatory variables) on one response to avoid violation of MR assumptions due to secondary explanatory variables being the confounders of the primary explanatory variable and response relationship (Porcu et al., 2019), Figure 1A. One approach to estimate the effects is the following. First, regress each explanatory variable (X) on the
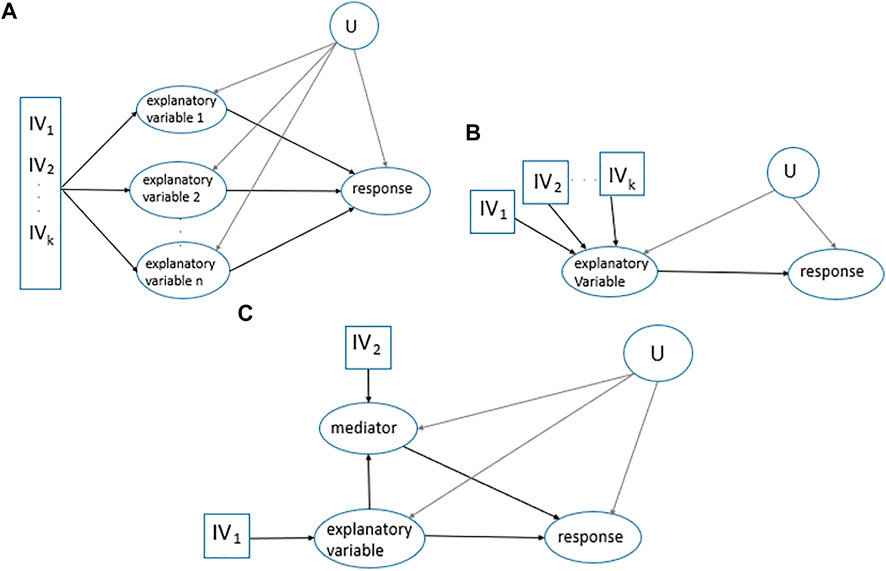
FIGURE 1. MR applications. (A). Multivariable MR. Multiple
In Eqs 1 and 2 with the assumption of additive effects,
The application of multiple uncorrelated
Since the instruments are uncorrelated, the variation explained by each of the instruments is independent from the other.
In mediation analysis, the interest is in the contribution of variables that lie on the causal pathway from an explanatory variable to a response, Figure 1C. In this case, two-step MR is often applied which is a combination of two univariate MRs, estimating the causal effect of the explanatory variable on the mediator and then estimating the causal effect of the mediator on the response (Sanderson et al., 2019). Different causal effects including direct, indirect, and total effects in Figure 1C are as follows:
Due to high measurement costs or lack of appropriate biospecimens, data on
where
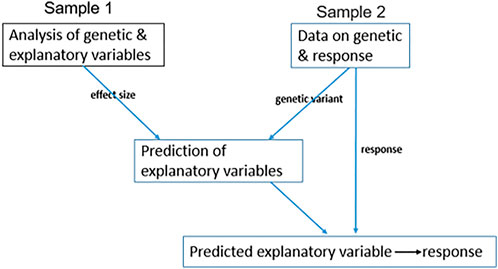
FIGURE 2. Two-sample MR. A diagram representing the application of two-sample MR when data on IV, explanatory variable, and response are not available for all samples. Sample 1 has genetic and explanatory variable records; therefore, we measure the effect size of genetic variants on the explanatory variable. Sample 2 has genetic variant and response records and not explanatory variable measurements, therefore, to estimate the genetic variation of any explanatory variable, we use the effect size from sample 1. Then, we estimate the causal relationship between the genetically estimated explanatory variable and response.
This approach can also be applied to summary statistics of both samples without having the individual levels (Lawlor, 2016; Zhu et al., 2016). In this setting, the causal effect of the explanatory variable on response is estimated by the effect of genetic variants on response in sample two divided by the effect of genetic variants on the explanatory variable in sample 1.
The application of summary statistics and two-sample studies are common for wide association studies, such as transcriptomic/phenotypic wide association studies, where the association of the predicted-explanatory variable and the response of interest is tested. Two-sample studies based on summary statistics are also used in colocalization, where we estimate the probability of the same signal for GWAS and the study of quantitative trait loci (QTL), such as expression or metabolite QTL. However, in these studies, the MR assumptions, especially the lack of pleiotropic effect, are not assessed. Otherwise, these studies will be the same as MR studies, see (Barfield et al., 2018).
The transition from the classical MR framework
The applications above assume that a causal diagram is specified, i.e., the role of each component such as being a mediator, explanatory variable, or response is specified in a priori in a small set of variables, and the interest is finding an individual cause of a specific response. Even in multivariable MR when multiple explanatory variables are considered, the interest is in finding the individual causes of a response and not revealing the underlying relationships among the entities in the study. Therefore, the classical MR framework is hypothesis-driven (Richmond et al., 2016), which is a major limitation of the classical MR framework to address questions in modern biomedical studies where we have limited knowledge about relationships among entities, we do not know which entity is the response variable and which is the explanatory variable. In other words, in modern biomedical studies, the causal diagrams are unknown.
To overcome this limitation of the classical MR framework, one of the early proposals was to consider all possible causal diagrams for the set of entities in the study, then, investigate each one independently using a statistical method, and finally, select the most likely causal diagram, Figure 3A, (Shin et al., 2014; Wittenbecher et al., 2022).
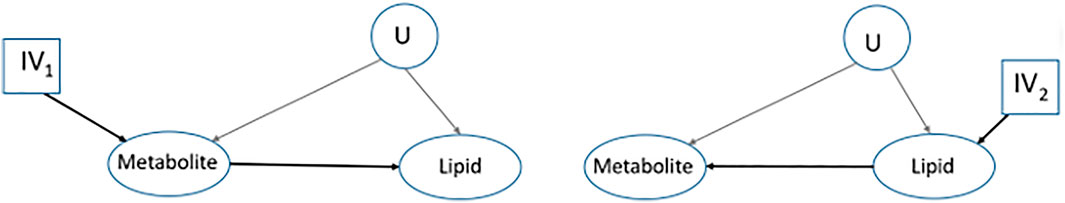
FIGURE 3. A transition from the classical MR framework. Interest is in finding the causal relationship between a metabolite and a lipid where we do not know which one is the response. Two of the possible causal diagrams are represented and each one will be assessed separately to select the most likely causal diagram.
This approach is challenging computationally and statistically because when the number of entities in the study increases, the number of possible causal diagrams grows exponentially.
Causal networks
Unlike classical MR framework, systems approaches such as causal networks deal with all entities under study at the same time. Causal networks are systematic analyses of data where connections among entities (nodes in the network) are essential to the conclusions. In this framework, each entity can be an explanatory variable, mediator, confounder, as well as a response at the same time. The key feature of causal networks is being discovery-based, and suitable for handling large-scale data, where we have limited knowledge about the underlying interconnectivity. There are different applications of systematic analysis of omics including causal networks (Zhu et al., 2012; Franzén et al., 2016; Broumand and Dadaneh, 2018; Ahangaran et al., 2019; Ahangaran et al., 2020; Yazdani et al., 2020; Gerring et al., 2021). For instance one of the early applications is the integration of genetic variants, metabolites, gene expressions, and proteins on yeast data to identify the underlying molecular networks (Zhu et al., 2012). Another example is the identification of different patterns of gene expression for patients with coronary artery disease (Franzén et al., 2016). More recently, the causal network successfully identified genes that are differentially regulated in schizophrenia-cases versus controls and found essential genes for human brain functions (Yazdani et al., 2020).
Causal networks can be based on Bayesian networks augmented with the principles of MR (Aten et al., 2008; Yazdani et al., 2016a; Badsha and Fu, 2019b; Howey et al., 2020). For details of the causal-network identification, see Supplementary, for a recent review of methods see (Ainsworth et al., 2017; Ghassami et al., 2017; Hu et al., 2018; Glymour et al., 2019), and for a comparison of MR performance and causal networks in both real and simulated data see (Howey et al., 2020). The MR approaches for causal network identification can be different for different data types (e.g., different omics). For entities whose levels are controlled by one or two local single nucleotide polymorphisms, we can use the related QTLs as
Causal networks and the evaluation of the IV assumptions
Causal networks are in the framework of Causality and the underlying assumptions to infer causality are the same as classical MR. The application of invalid
In the constraint-based algorithms, causal networks are built upon conditional independence and simultaneous assessment of the lack of pleiotropic effect (the effect of
i.e.,
And the deterministic representation of (7) is
where all factors that affect variable
If this property is not satisfied, the variable used as
As reviewed above, the validity of
We here introduce some tests to assess the stability of an identified causal network. Understanding the tests requires some background in basic concepts for causal network exploration, such as the “graphically” identification of cofounders using the “back-door” criterion, see Supplementary or (Pearl, 2011; Yazdani A, 2015). Due to some technical notations, the formal descriptions are provided in Supplementary.
Confounding-equivalent Test. Assume we are interested in the effect of
This equality guarantees that, adjusting for either set
The confounding equivalent property was introduced previously in (Pearl, 2011). Here, we are introducing it as a test to assess if the underlying assumptions are satisfied. Assume a causal network of five variables
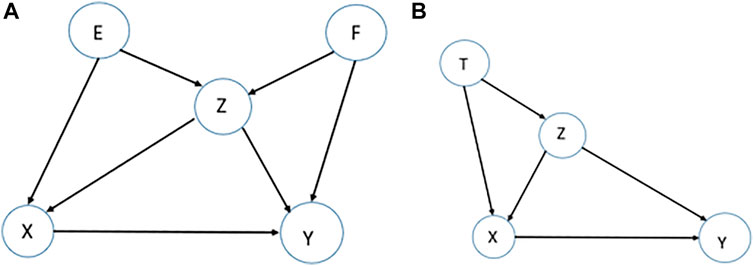
FIGURE 4. Examples for stability tests. (A). To assess the effect of
Variable-Reduction Test. In an identified causal network, consider a node that has only a role as a response/receptor. The property of this node is no arrows out but arrows in, such as node
To quantify this in practice, we can use the receiver operating characteristic (ROC) curve for a different number of nodes having only a role as a response/receptor in the network (Yazdani et al., 2020). If this test leads to an unstable result, the underlying MR assumptions, while identifying the causal network, are violated.
Variable-Increment test. Assume we are interested in the effect of
Considering Figure 4B, and the additive assumption to estimate the effect of
Permutation Test. Permutation analysis can be performed to examine the stability of an identified causal network. Since the implementation of the permutation test for causal networks is not straightforward, here, we review how to perform a permutation test to assess the stability of a causal network (Yazdani et al., 2020): the sets of randomly selected nodes for permutation must be entirely from the receptors (no arrows out but arrows in) or broadcasters (no arrows in but arrows out) since the impact of receptors and broadcasters in the network are different. For each permutation, we may select different numbers of nodes for permutation depending on the size of the network, e.g., 10 nodes, that all have the same number of arrows out (out-degree) and the same number of arrows in (in-degree). Then, permute the nodes and after that, assess the stability of the identified connections using the ROC curve.
Identification of causal networks in real data
In this section, we review an application to identify a causal network in real data. We review a study of systematic integration of genetics and metabolomics to identify the metabolomic-causal network (Yazdani et al., 2016b). Metabolomic and genomic data were available for 2,479 individuals. First, we adjusted metabolites for the set of covariates in the study, such as age, sex, and body mass index. Second, we selected a set of
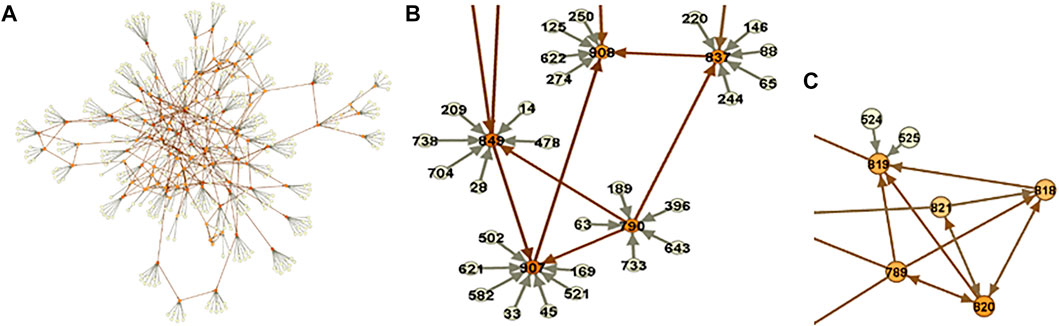
FIGURE 5. Metabolomic-causal network. (A). In total, 325 polygenic factors satisfied MR assumptions/valid IVs (pale nodes) and were used to facilitate the identification of the causal network of 122 metabolites (orange nodes). (B). A close-up of the network. (C). A part of the network with no genome
A close-up of the network is depicted in Figure 5B. We see that using
We may not be able to identify causal relationships between metabolites with no, however, having them in the analysis provides us with an opportunity to reveal the relationship with other modules or metabolites in the network (Figure 6A). Extracting information from the metabolomic-causal network and further applications are briefly reviewed in the next section as utilities of causal networks.
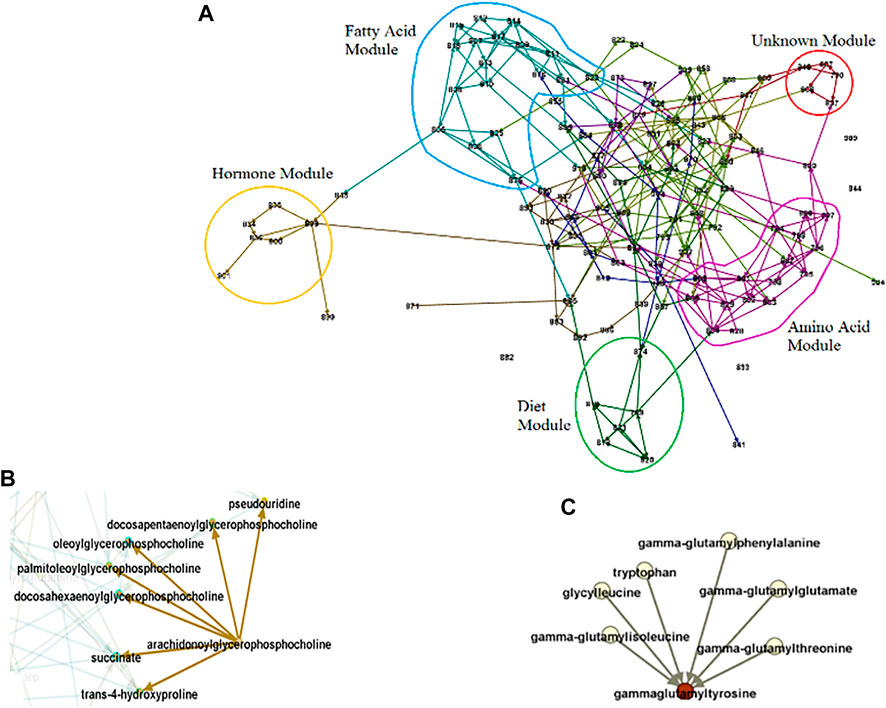
FIGURE 6. Causal Network Parameters. Numbers stand for metabolites, edges for conditional dependence properties, and arrows for causal relationships. (A). Modules. The set of entities that highly interact. The identified modules generally coincide with known pathways. For example, the blue and pink circles consist of related fatty acid and amino acid molecules respectively. (B). Example of a broadcaster. Intervention in broadcasters may change the level in the entire system since they directly or indirectly influence multiple other entities in system. (C). Example of a receptor. The level of receptors may predict the level of the entire system since they capture the effect of multiple other entities.
The utilities of causal networks
The utilities of causal networks are multiple and flourishing, such as revealing principles governing omics under study and understanding them as a system, understanding functional links, explaining the results of perturbations, as well as facilitating efficient experimental/clinical designs. We here review the utilities by exploring the metabolomic-causal network identified in the previous section as well as using the network for downstream analysis.
In addition to effect size and significance level for each entity, using causal networks, we can reveal the role of entities in the system under study. Through exploring the network, we can identify modules/sub-networks, a set of entities that interact with each other to control a specific function (Figure 6A). The border of each module is determined using causal effect size and the in-degree and out-degree of nodes (Yazdani et al., 2016b). Each of the modules in a network can be explored to understand the module as a sub-network and reveal the metabolites with essential roles. For example, for exploring the fatty acid module in Figure 6, and the dietary hypotheses made by exploring the module see (Yazdani et al., 2016c). In addition to the property of entities as a group, we can also extract information about individual entities. For example, in a causal network, we are able to identify if a hub (a highly connected node) is an entity that significantly influences the system (a broadcaster) or is significantly influenced by the system (a receptor), or is a combination of both (Yazdani et al., 2016b; Yazdani et al., 2019; Yazdani et al., 2020). Broadcasters can be seen as targets for intervention to change the level of entities in the system. On the other hand, receptors can be seen as targets to predict the level of the whole system under study (Figures 6B,C). Note that the identification of the role of a hub in the system and distinguishing between receptors and broadcasters are possible only through causal networks. Other causal network parameters can be measured to better understand the system under study, such as the effect blocking steps and the strength. Interested readers are referred to (Yazdani et al., 2016b).
The causal networks do not only lead to a deeper understanding of how the metabolites affect each other, but also serve as the basis for downstream analyses. We explain this utility with the systematic integration of the metabolomic-causal network with triglycerides, a known risk factor for cardiovascular disease (Yazdani et al., 2016d): In total, nine out of 122 metabolites in the study were identified with a direct effect on triglyceride levels (Figure 7A). Some of the novel findings of this study were against common beliefs, such as the positive and the largest effect of arachidonate on triglycerides, which was later validated clinically (Yazdani et al., 2018) (Figure 7B). Revealing the underlying relationships facilitated efficient experimental/clinical designs. For example, in Figure 7B, we see that four metabolites exert an effect on arachidonate, and the latter has the largest effect on triglycerides. Another example is the effect of choline on triglycerides that is through glycine therefore, no need to know about the levels of choline if we know about glycine levels.
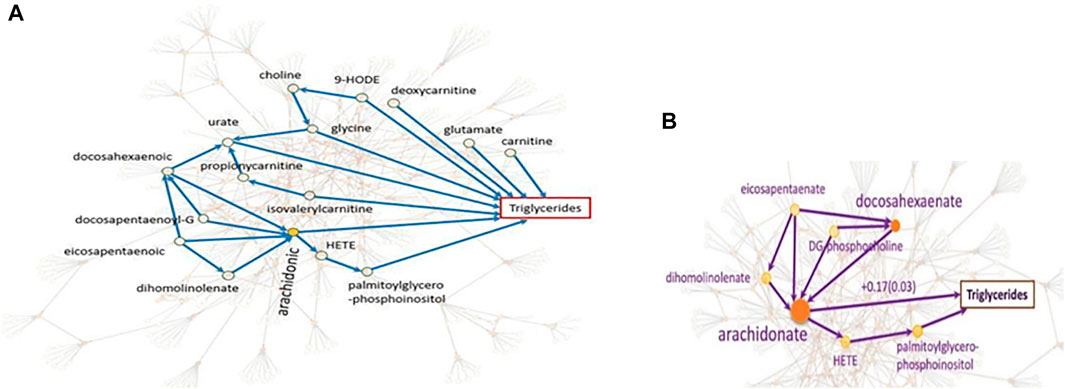
FIGURE 7. Systematic integration of genetics, metabolomics, and triglycerides. (A). The focus is on the nine metabolites with direct effects on triglycerides as well as some of the indirect effects. For example, no need to know about the levels of choline if we know about glycine levels since the effect of choline on triglycerides is only through glycine. (B). We see that the effect of four metabolites on triglycerides is through arachidonate with the largest effect on triglycerides (Yazdani et al., 2016d).
The other utility of causal networks is improving biological understanding of the GWAS pathways leading to disease (Ainsworth et al., 2017). The gene/protein KIAA1755 with an unknown function is identified with a strong relationship with metabolite eicosapentaenoate which affects essential hypertension with no known cause (Yazdani et al., 2019). Mapping the GWAS finding on the metabolomic-causal network revealed that this metabolite was among four metabolites with a high impact on arachidonic acid with the greatest positive impact on triglyceride levels. This finding has been clinically validated (Yazdani et al., 2018). The relationship between triglycerides and essential hypertension has also been validated in a clinical study (Turak et al., 2016; Catanzaro et al., 2021). These findings may reveal new avenues into gene functional annotation and the understanding of the disease etiology.
The last utility of causal networks that we will review here is assessing GWAS findings hypothesized with pleiotropy. Causal networks reveal the underlying relationships, therefore, providing an opportunity to satisfy the assumptions of structural equation modeling and assess if a GWAS finding affects two entities independently or if it is just an indirect effect (Yazdani et al., 2019).
Discussions
A key challenge for elucidating disease mechanisms in the 21st Century is understanding the topology and dynamics of molecules (Kim et al., 2010). Systematic integration of multi-omic data enables us to illuminate the underlying molecular networks. Despite this potential, the dominant approach is studying individual components one at a time. Complex mechanisms that use multiple omics cannot be understood by finding one causal factor. While finding one causal relationship is one step further in association studies and we achieve some understanding in this way, progress is limited because it does not provide a complete context to interpret the findings (Zhu et al., 2012). Developing systems approaches are required to bridge data analysis to the mechanistic understanding of diseases.
Identification of causal networks, as a systematic analysis of data, is established in the recognition of the hierarchical structure of the biological systems and reflects the underlying patterns (Barabási and Oltvai, 2004). The application of causal networks provides a path to uncover the role of each entity in a system, as well as providing global insights that give us a deep understanding for discovery. By mining causal networks, we can identify the role of each entity and distinguish intervention targets from prediction (Pearl, 2011). In addition, using causal networks, we can uncover groups of entities that work together to perform a certain function.
MR techniques can be modulated for systematic analysis of large-scale omics and identification of molecular networks. Some recent discussions toward this goal can be found in (Ainsworth et al., 2017; Howey et al., 2020). Opposite to classical MR approaches that are hypothesis-based, causal networks are discovery-based which makes them suitable for omic data integration where we face a large set of entities and have little knowledge about underlying relationships. Extracting information from genetic variants to generate polygenic factors and utilize them as IVs facilitates the identification of causal networks on large scale. Although there is an increasing number of applications of causal networks, more innovative approaches are required to modulate MR for integrating omics systematically, such as the identification of causal networks based on summary statistics. In addition, the research on the identification of causal networks can be extended to the integration of multiple intermediate omics.
Author contributions
AzY designed the work and wrote the manuscript All authors contributed to completing the review manuscript and significant edition.
Acknowledgments
The first author appreciates the comments from Dr. Heather Cordell on an early draft of this manuscript and the comments from Dr. Jian Yang.
Conflict of interest
The authors declare that the research was conducted in the absence of any commercial or financial relationships that could be construed as a potential conflict of interest.
Publisher’s note
All claims expressed in this article are solely those of the authors and do not necessarily represent those of their affiliated organizations, or those of the publisher, the editors and the reviewers. Any product that may be evaluated in this article, or claim that may be made by its manufacturer, is not guaranteed or endorsed by the publisher.
Supplementary Material
The Supplementary Material for this article can be found online at: https://www.frontiersin.org/articles/10.3389/fgene.2022.990486/full#supplementary-material
References
Ahangaran, M., Jahed-Motlagh, M. R., and Minaei-Bidgoli, B. (2020). A novel method for predicting the progression rate of ALS disease based on automatic generation of probabilistic causal chains. Artif. Intell. Med. 107, 101879. doi:10.1016/j.artmed.2020.101879 | |
Ahangaran, M., Jahed-Motlagh, M. R., and Minaei-Bidgoli, B. (2019). Causal discovery from sequential data in ALS disease based on entropy criteria. J. Biomed. Inf. 89, 41–55. doi:10.1016/j.jbi.2018.10.004 | |
Ainsworth, H. F., Shin, S. Y., and Cordell, H. J. (2017). A comparison of methods for inferring causal relationships between genotype and phenotype using additional biological measurements. Genet. Epidemiol. 41 (7), 577–586. doi:10.1002/gepi.22061 | |
Aten, J. E., Fuller, T. F., Lusis, A. J., and Horvath, S. (2008). Using genetic markers to orient the edges in quantitative trait networks: The NEO software. BMC Syst. Biol. 2, 34. doi:10.1186/1752-0509-2-34 | |
Badsha, B., and Fu, A. Q., Learning causal biological networks with the principle of Mendelian randomization, in Frontiers in Genetics. 2019.10, 460, doi:10.3389/fgene.2019.00460 | |
Badsha, M., and Fu, A. Q. (2019). Learning causal biological networks with the principle of Mendelian randomization. Front. Genet. 10, 460. doi:10.3389/fgene.2019.00460 | |
Barabasi, A.-L., and Oltvai, Z. N. (2004). Network biology: Understanding the cell's functional organization. Nat. Rev. Genet. 5 (2), 101–113. doi:10.1038/nrg1272 | |
Barfield, R., Feng, H., Gusev, A., Wu, L., Zheng, W., Pasaniuc, B., et al. (2018). Transcriptome‐wide association studies accounting for colocalization using Egger regression. Genet. Epidemiol. 42 (5), 418–433. | |
Barabási, A. L., and Oltvai, Z. N. (2004). Network biology: Understanding the cell's functional organization. Nat. Rev. Genet. 5, 101. doi:10.1038/nrg1272 | |
Bebek, G., Koyuturk, M., Price, N. D., and Chance, M. R. (2012). Network biology methods integrating biological data for translational science. Brief. Bioinform. 13 (4), 446–459. doi:10.1093/bib/bbr075 | |
Bowden, J., Davey Smith, G., and Burgess, S. (2015). Mendelian randomization with invalid instruments: Effect estimation and bias detection through egger regression. Int. J. Epidemiol. 44 (2), 512–525. doi:10.1093/ije/dyv080 | |
Broumand, A., and Dadaneh, Siamak Zamani (2018). Sequential sampling for optimal bayesian classification of sequencing count data, in 52nd asilomar conference on signals, systems, and computers, Pacific Grove, CA, USA. p. pp. 1357–1361. doi:10.1109/ACSSC.2018.8645518 |
Burgess, S., Zuber, V., Valdes-Marquez, E., Sun, B. B., and Hopewell, J. C. (2017). Mendelian randomization with fine‐mapped genetic data: Choosing from large numbers of correlated instrumental variables. Genet. Epidemiol. 41 (8), 714–725. doi:10.1002/gepi.22077 | |
Catanzaro, R., Selvaggio, Federica, Sciuto, Morena, Zanoli, Luca, Yazdani, Azam, He, Fang, et al. (2021). Triglycerides to high-density lipoprotein cholesterol ratio for diagnosing nonalcoholic fatty liver disease. Minerva Gastroenterol. doi:10.23736/S2724-5985.21.02818-X |
Dorvash, M., Farahmandnia, M., and Tavassoly, I. (2020). A systems biology roadmap to decode mTOR control system in cancer. Interdiscip. Sci. 12 (1), 1–11. doi:10.1007/s12539-019-00347-6 | |
Franzén, O., Ermel, R., Cohain, A., Akers, N. K., Di Narzo, A., Talukdar, H. A., et al. (2016). Cardiometabolic risk loci share downstream cis-and trans-gene regulation across tissues and diseases. Science 353 (6301), 827–830. doi:10.1126/science.aad6970 | |
Gao, C., Patel, C. J., Michailidou, K., Peters, U., Gong, J., Schildkraut, J., et al. (2016). Mendelian randomization study of adiposity-related traits and risk of breast, ovarian, prostate, lung and colorectal cancer. Int. J. Epidemiol. 45, 896–908. doi:10.1093/ije/dyw129 | |
Gerring, Z. F., Vargas, A. M., Gamazon, E. R., and Derks, E. M. (2021). An integrative systems‐based analysis of substance use: eQTL‐informed gene‐based tests, gene networks, and biological mechanisms. Am. J. Med. Genet. B Neuropsychiatr. Genet. 186 (3), 162–172. doi:10.1002/ajmg.b.32829 | |
Ghassami, A., Salehkaleybar, S., and Kiyavash, N. (2017). Optimal experiment design for causal discovery from fixed number of experiments. arXiv preprint arXiv:1702.08567.
Glymour, C., Zhang, K., and Spirtes, P. (2019). Review of causal discovery methods based on graphical models. Front. Genet. 10, 524. doi:10.3389/fgene.2019.00524 | |
Hackett, S. R., Baltz, E. A., Coram, M., Wranik, B. J., Kim, G., Baker, A., et al. (2020). Learning causal networks using inducible transcription factors and transcriptome‐wide time series. Mol. Syst. Biol. 16 (3), e9174. doi:10.15252/msb.20199174 | |
Holmes, M. V., Ala-Korpela, M., and Smith, G. D. (2017). Mendelian randomization in cardiometabolic disease: Challenges in evaluating causality. Nat. Rev. Cardiol. 14 (10), 577–590. doi:10.1038/nrcardio.2017.78 | |
Howey, R., Shin, S. Y., Relton, C., Davey Smith, G., and Cordell, H. J. (2020). Bayesian network analysis incorporating genetic anchors complements conventional Mendelian randomization approaches for exploratory analysis of causal relationships in complex data. PLoS Genet. 16 (3), e1008198. doi:10.1371/journal.pgen.1008198 | |
Hu, P., Jiao, R., Jin, L., and Xiong, M. (2018). Application of causal inference to genomic analysis: Advances in methodology. Front. Genet. 9, 238. doi:10.3389/fgene.2018.00238 | |
Hu, X., Zhao, J., Lin, Z., Wang, Y., Peng, H., Zhao, H., et al. (2022). Mendelian randomization for causal inference accounting for pleiotropy and sample structure using genome-wide summary statistics. Proc. Natl. Acad. Sci. U. S. A. 119 (28), e2106858119. doi:10.1073/pnas.2106858119 | |
Khan, A., Rehman, Z., Hashmi, H. F., Khan, A. A., Junaid, M., Sayaf, A. M., et al. (2020). An integrated systems biology and network-based approaches to identify novel biomarkers in breast cancer cell lines using gene expression data. Interdiscip. Sci. 12, 155–168. doi:10.1007/s12539-020-00360-0 | |
Kim, D.-C., Wang, X., Yang, C-R., and Gao, J. (2010). Learning biological network using mutual information and conditional independence. Bmc Bioinforma. 11, s9. doi:10.1186/1471-2105-11-S3-S9 | |
Lawlor, D. A. (2016). Commentary: Two-sample mendelian randomization: Opportunities and challenges. Int. J. Epidemiol. 45, 908–915. doi:10.1093/ije/dyw127 | |
Morrison, J., Knoblauch, N., Marcus, J. H., Stephens, M., and He, X. (2020). Mendelian randomization accounting for correlated and uncorrelated pleiotropic effects using genome-wide summary statistics. Nat. Genet. 52 (7), 740–747. doi:10.1038/s41588-020-0631-4 | |
Norouzi, M., Fleet, D. J., and Salakhutdinov, R. R. (2012). “Hamming distance metric learning,” in Advances in neural information processing systems 25, 1–9.
Pearl, J. (2011). “Causality: Models, reasoning, and inference,” in Causality: Models, reasoning, and inference. second editionSecond Edition.
Pierce, B. L., Ahsan, H., and VanderWeele, T. J. (2011). Power and instrument strength requirements for Mendelian randomization studies using multiple genetic variants. Int. J. Epidemiol. 40 (3), 740–752. doi:10.1093/ije/dyq151 | |
Porcu, E., Rueger, S., Lepik, K., Santoni, F. A., Reymond, A., and Kutalik, Z. (2019). Mendelian randomization integrating GWAS and eQTL data reveals genetic determinants of complex and clinical traits. Nat. Commun. 10, 3300. doi:10.1038/s41467-019-10936-0 | |
Qi, G., and Chatterjee, N. (2019). Mendelian randomization analysis using mixture models for robust and efficient estimation of causal effects. Nat. Commun. 10 (1), 1–10. doi:10.1038/s41467-019-09432-2 | |
Richmond, R. C., Hemani, G., Tilling, K., Smith, G. Davey, and Relton, C. L. (2016). Challenges and novel approaches for investigating molecular mediation. Hum. Mol. Genet. 25, R149. doi:10.1093/hmg/ddw197 | |
Sanderson, E., Davey Smith, G., Windmeijer, F., and Bowden, J. (2019). An examination of multivariable Mendelian randomization in the single-sample and two-sample summary data settings. Int. J. Epidemiol. 48 (3), 713–727. doi:10.1093/ije/dyy262 | |
Sanderson, E., Glymour, M. M., Holmes, M. V., Kang, H., Morrison, J., Munafo, M. R., et al. (2022). Mendelian randomization. Nat. Rev. Methods Prim. 2 (1), 6–21. doi:10.1038/s43586-021-00092-5 |
Shin, S. Y., Small, Kerrin S., Döring, Angela, Kato, Bernet S., Peters, Annette, Grundberg, Elin, et al. (2014). Interrogating causal pathways linking genetic variants, small molecule metabolites, and circulating lipids. Genome Med. 6 (3), 1–16. doi:10.1186/gm542 | |
Tsamardinos, I., Brown, L. E., and Aliferis, C. F. (2006). The max-min hill-climbing Bayesian network structure learning algorithm. Mach. Learn. 65 (1), 31–78. doi:10.1007/s10994-006-6889-7 |
Turak, O., Afsar, B., Ozcan, F., Oksuz, F., Mendi, M. A., Yayla, C., et al. (2016). The role of plasma triglyceride/high‐density lipoprotein cholesterol ratio to predict new cardiovascular events in essential hypertensive patients. J. Clin. Hypertens. 18 (8), 772–777. doi:10.1111/jch.12758 |
Wittenbecher, C., Cuadrat, R., Johnston, L., Eichelmann, F., Jager, S., Kuxhaus, O., et al. (2022). Dihydroceramide-and ceramide-profiling provides insights into human cardiometabolic disease etiology. Nat. Commun. 13 (1), 1–13. doi:10.1038/s41467-022-28496-1 | |
Xue, H., Shen, X., and Pan, W. (2021). Constrained maximum likelihood-based Mendelian randomization robust to both correlated and uncorrelated pleiotropic effects. Am. J. Hum. Genet. 108 (7), 1251–1269. doi:10.1016/j.ajhg.2021.05.014 | |
Yazdani A, B. E. (2015). Causal inference in the age of decision medicine. J. Data Min. Genomics & Proteomics 6, 163. doi:10.4172/2153-0602.1000163 |
Yazdani, A., Bowman, T. A., Marotta, F., Cooke, J. P., and Samiei, A. (2018). Arachidonic acid as a target for treating hypertriglyceridemia reproduced by a causal network analysis and an intervention study. Metabolomics 14 (6), 78–85. doi:10.1007/s11306-018-1368-2 | |
Yazdani, A., Elsea, S. H., Schaid, D. J., Kosorok, M. R., Dangol, G., and Samiei, A. (2019). Genome analysis and pleiotropy assessment using causal networks with loss of function mutation and metabolomics. BMC Genomics 20 (1), 395. doi:10.1186/s12864-019-5772-4 | |
Yazdani, A., Mendez-Giraldez, R., Kosorok, M. R., and Roussos, P. (2020). Differential gene regulatory pattern in the human brain from schizophrenia using transcriptomic-causal network. BMC Bioinforma. 21 (1), 15–26. doi:10.1186/s12859-020-03753-6 | |
Yazdani, A., Samiei, A., and Boerwinkle, E. (2016). Generating a robust statistical causal structure over 13 cardiovascular disease risk factors using genomics data. J. Biomed. Inf. 60, 114–119. doi:10.1016/j.jbi.2016.01.012 | |
Yazdani, A., Samiei, A., and Boerwinkle, E. (2016). Identification, analysis, and interpretation of a human serum metabolomics causal network in an observational study. J. Biomed. Inf. 63, 337–343. doi:10.1016/j.jbi.2016.08.017 | |
Yazdani, A., Yazdani, A., and Boerwinkle, E. (2016). A causal network analysis of the fatty acid metabolome in African-Americans reveals a critical role for palmitoleate and margarate. Omics a J. Integr. Biol. 20 (8), 480–484. doi:10.1089/omi.2016.0071 | |
Yazdani, A., Yazdani, Akram, Samiei, Ahmad, Boerwinkle, Eric, et al. (2016). Identification, analysis, and interpretation of a human serum metabolomics causal network in an observational study. J. Biomed. Inf. 63, 337–343. doi:10.1016/j.jbi.2016.08.017 | |
Zhu, J., Sova, P., Xu, Q., Dombek, K. M., Xu, E. Y., Vu, H., et al. (2012). Stitching together multiple data dimensions reveals interacting metabolomic and transcriptomic networks that modulate cell regulation. PLoS Biol. 10, e1001301. doi:10.1371/journal.pbio.1001301 | |
Keywords: systems biology, causal networks, stability of causal networks, principles of mendelian randomization, classical MR, systems approach, multiomic integration
Citation: Yazdani A, Yazdani A, Mendez-Giraldez R, Samiei A, Kosorok MR and Schaid DJ (2022) From classical mendelian randomization to causal networks for systematic integration of multi-omics. Front. Genet. 13:990486. doi: 10.3389/fgene.2022.990486
Received: 10 July 2022; Accepted: 17 August 2022;
Published: 15 September 2022.
Edited by:
Can Yang, Hong Kong University of Science and Technology, Hong Kong SAR, ChinaReviewed by:
Xianghong Hu, Hong Kong University of Science and Technology, Hong Kong SAR, ChinaYiming Hu, Yale University, United States
Copyright © 2022 Yazdani, Yazdani, Mendez-Giraldez, Samiei, Kosorok and Schaid. This is an open-access article distributed under the terms of the Creative Commons Attribution License (CC BY). The use, distribution or reproduction in other forums is permitted, provided the original author(s) and the copyright owner(s) are credited and that the original publication in this journal is cited, in accordance with accepted academic practice. No use, distribution or reproduction is permitted which does not comply with these terms.
*Correspondence: Azam Yazdani, YXlhemRhbmlAYndoLmhhcnZhcmQuZWR1