
94% of researchers rate our articles as excellent or good
Learn more about the work of our research integrity team to safeguard the quality of each article we publish.
Find out more
ORIGINAL RESEARCH article
Front. Genet., 30 November 2022
Sec. Cancer Genetics and Oncogenomics
Volume 13 - 2022 | https://doi.org/10.3389/fgene.2022.981145
This article is part of the Research TopicComputational Methods for Multi-Omics Data Analysis in Cancer Precision MedicineView all 27 articles
 Tingjie Wang1
 Chuanrui Xu2
 Dan Xu3
 Xiaofei Yang4,5,6Yaxin Liu3Xiujuan Li7Zihang Li3
 Ningxin Dang5Yi Lv1Zhijing Zhang2Lei Li2
 Kai Ye1,3,5,6,7,8*
Objective: The efficacy of immunotherapy for cholangiocarcinoma (CCA) is blocked by a high degree of tumor heterogeneity. Cell communication contributes to heterogeneity in the tumor microenvironment. This study aimed to explore critical cell signaling and biomarkers induced via cell communication during immune exhaustion in CCA.
Methods: We constructed empirical Bayes and Markov random field models eLBP to determine transcription factors, interacting genes, and associated signaling pathways involved in cell-cell communication using single-cell RNAseq data. We then analyzed the mechanism of immune exhaustion during CCA progression.
Results: We found that VEGFA-positive macrophages with high levels of LGALS9 could interact with HAVCR2 to promote the exhaustion of CD8+ T cells in CCA. Transcription factors SPI1 and IRF1 can upregulate the expression of LGALS9 in VEGFA-positive macrophages. Subsequently, we obtained a panel containing 54 genes through the model, which identified subtype S2 with high expression of immune checkpoint genes that are suitable for immunotherapy. Moreover, we found that patients with subtype S2 with a higher mutation ratio of MUC16 had immune-exhausted genes, such as HAVCR2 and TIGIT. Finally, we constructed a nine-gene eLBP-LASSO-COX risk model, which was designated the tumor microenvironment risk score (TMRS).
Conclusion: Cell communication-related genes can be used as important markers for predicting patient prognosis and immunotherapy responses. The TMRS panel is a reliable tool for prognostic prediction and chemotherapeutic decision-making in CCA.
Cholangiocarcinoma (CCA) is the second most common form of liver malignancy with increasing diagnostic incidence and mortality rates (Banales et al., 2020). Patients with CCA are divided into two subtypes depending on their anatomical site of origin: intrahepatic (iCCA or ICC), perihilar (pCCA), and distal (dCCA) CCA (Bridgewater et al., 2014). Most patients with CCA have lost the opportunity to undergo surgical resection upon diagnosis (Brandi et al., 2020). Recent studies have revealed that immunotherapies can protect against tumor development and metastasis. Immune checkpoint inhibitors (ICIs), chimeric antigen receptor T-cells, and tumor vaccines are the main immunotherapies used in clinical practice.
Tumor heterogeneity and stromal/immune cells in the tumor immune microenvironment (TME) significantly influence the effect of the immunotherapy (Tang et al., 2021). Tumors can be categorized into inflamed, immune desert, or immune-excluded phenotypes based on the spatial localization of immune cells in the tumor and stromal compartments (Hegde and Chen, 2020). Inflamed tumors are typically associated with a response to ICIs, particularly PD-L1- and PD-1-directed antibodies (Jiang et al., 2020). The clinical efficacy of PD-1/PD-L1 ICIs enhance the cytotoxicity of CD8+ T cells. However, clinical experience has shown that a large percentage of CCAs (>50%) do not respond to ICIs (e.g., high tumor PD-L1 expression) (Hegde and Chen, 2020). Therefore, it is necessary to investigate the components of TME to identify other immune checkpoints during CCA immunotherapy.
Interactions between ligands and receptors in the TME and tumor cells play a crucial role in tumor progression (Zhang et al., 2020). It has been revealed that cancer-associated fibroblasts (CAF) in ICC induced significant epigenetic alterations in ICC cells via IL-6 secretion and subsequent upregulation of EZH2 through STAT3 activation (Zhang et al., 2020). In addition, PD-L1+ TAMs in the TME facilitate CCA progression (Rizzo et al., 2021a). However, the mechanism of cell interaction and upstream and downstream signal transduction elements influencing the CCA immunotherapy of remains unclear.
In the present study, we developed an eLBP algorithm by integrating empirical Bayes with Markov random fields to infer the intact intercellular communication pattern, including interacting cell types and critical TFs that could promote cell interactions simultaneously. We revealed a unique signaling transduction model between tumor-associated macrophages and exhausted CD8+ T cells that could influence immunotherapy and novel immune checkpoint genes in CCA patients. We also constructed a gene classifier to distinguish inflamed tissue with high expression of immune checkpoint genes (ICGs) from the immune desert subtype and predict the immunotherapeutic effect in the two CCA subtypes.
CCA sequencing data were retrieved from the Gene Expression Omnibus (GEO) database (https://www.ncbi.nlm.nih.gov/). All the datasets used in this study are listed in Supplementary Table S1.
The single-cell datasets were downloaded from the GEO database (Supplementary Table S1). The raw gene expression matrix was imported and processed using the Seurat R package (version 3.1.5) (Butler et al., 2018). Cells with unique molecular identifier counts below 200 or mitochondrial content above 35% were removed. Normalization and dimension-reduction processes were performed using Seurat R package (3.1.5). Clusters were computed using the FindClusters function (resolution = 0.8) and visualized using uniform manifold approximation and projection (UMAP), as implemented in Seurat. Differential expression between clusters was calculated using a likelihood-ratio test for single-cell gene expression implemented in Seurat, with a family-wise error rate of 5%. Cell types were defined according to lineage-specific marker genes.
Interactions are frequent among TME cells depending on the ligand and receptor pairs. We evaluated the contribution of cell-interaction genes to cell communication by measuring the importance of their participant-enriched pathways in each cell type. Meanwhile, transcription factors can enhance cell signaling by promoting the expression of interacting genes. The importance and critical TF regulons were calculated using empirical Bayes loopy belief propagation (eLBP). The cell clustering results and differential genes in each cell type were used as the input data for eLBP. The algorithm consists of the following five steps based on cell interaction genes (CIGs).
We first identified the differentially expressed genes (DEGs) for each cell type. The pathways that were significantly enriched (P.adj <0.05) in the KEGG, GO, and REACTOME datasets for each cell type were selected. We obtained all potential interaction gene pairs during cell communication from the CellChat database (Jin et al., 2021). Next, we extracted the pathways containing cell-communication genes in each cell type. Subsequently, we conducted the protein interaction (Tohonen et al., 2015) analysis of these pathway genes to produce a potential gene interaction undirected graph for each cell type.
After constructing the gene interaction undirected graph for each cell type, we adopted an empirical Bayes Markov random field (MRF) network to calculate the importance of communication-related genes in each cell type. The network was represented by
To construct a complete MRF model, we specified the node potentials of the class labels of node
where, Z is the normalization constant. Next, we obtained the eLBP, a widely adopted approximate inference algorithm for the MRF. When the eLBP converges, the final belief node
where Z2 is the normalization constant, and Ni denotes the neighbor nodes connected with node Vi in cell type k.
The prior probabilities in Eqs 1, 2 are calculated using the empirical Bayes method. The prior probability of node
We then assumed that genes in the cell type k followed a Poisson distribution with the parameter θ (Eq. 3).
where θ has a Gamma prior with unknown parameters α and β (Eq. 4).
Based on this assumption, under the observation vector XCN, we calculated the posterior values of α and β via Eq. 5 by randomly sampling 50% of the cells in XCN.
Subsequently, we calculated the posterior mean of
where L denotes the cells from the positive (+1) or negative datasets (−1). Next, we calculated the prior probability of node
Finally, we calculated the probability of occurrence of gene nodes in the eLBP network using Eq. 2.
After obtaining the posterior probability of each gene node, we obtained a simplified interaction network by trimming the gene nodes whose posterior probability obtained from Eq. 2 was <0.7. We then calculated the connection strength among the CIG pairs between cell types Ki and Kj (CGscore) using Eq. 8.
And the cell type interaction strength CT score was calculated using Eq. 9.
where Ki and Kj indicate different cell types. The highest CT score indicates potentially interacting cell types.
In addition to the cell interaction community, we calculated the transcription factor (TF) regulons that could enhance the critical cell-interaction genes in the eLBP model. To achieve this, we first obtained the potential regulatory networks of TFs by collating three transcription factor databases: ENCODE, ChEA3, and TRANSFAC. Next, we obtained the TFs whose target genes were significantly enriched in the trimmed eLBP network obtained from step 4 in the three TF datasets (ChEA3, ENCODE, and TRANSFAC, p < 0.05). Subsequently, we calculated the contribution score of each TF using Eq. 10:
where
Human leukemia monocytic THP-1 cells were cultured in Gibco™ RPMI 1640 medium supplemented with 10% fetal bovine serum (FBS), 100 units/ml penicillin, and 100 g/ml streptomycin. THP-1 cells were seeded at a density of 6 × 10⁵ cells/well into 24-well plates and treated with 200 ng/ml phorbol12-myristate13-acetate (PMA; Sigma-Aldrich, St. Louis, MO, United States) for 48 h. The cells were cultured at 37°C in a humidified atmosphere with 5% CO2, where THP-1 monocytes were differentiated into macrophages.
Small interfering RNA (siRNAs) against IRF1 and SPI1 were used to validate the regulation of the expression of LAGLS9 in THP-1 cells. IRF1 and SPI1 siRNAs were designed and synthesized by GenePharma (Shanghai, China). THP-1 cells were transfected with GP-transfect-Mate, according to the manufacturer’s instructions. Briefly, THP-1 cells were seeded at a density of 6 × 10⁵ cells/well in 24-well plates and treated with 200 ng/ml for 48 h. GP-transfect-Mate was diluted in Opti-MEM (50 ml; Invitrogen, Waltham, MA, United States) for 5 min before mixing with an equal volume of Opti-MEM containing siRNA (40 pmol). After 20 min of incubation, 100 μL of the resulting GP-transfect-Mate/siRNA mixture was added directly to the cells. After 24 h of incubation at 37°C in a 5% CO2 atmosphere, cells were harvested for real-time PCR. The sequences of the primers used were as follows: SPI1-siRNA: CAGGCAGCAAGAAGAAGAUTT and AUCUUCUUCUUGCUGCCUT. IRF1-siRNA: GGGCUCAUCUGGAUUAAUATT, UAUUAAUCCAGAUGAGCCCTT.
Total RNA was isolated using TRIzol reagent (Sigma-Aldrich), according to the manufacturer’s instructions. cDNA was synthesized using 5× All-in-One RT-Master Mix (Abm, Canada). Real-time PCR was performed in a LightCycler 96 using 2× chemQSYBR QPCR Master Mix (Vezyme, China), according to the manufacturer’s instructions, in a total volume of 10 μL. The sequences of the primers used were SPI1-Fw and GCGTGCAAAATGGAAG GGTTT. SPI1-Rev: GGTATCGAGGACGTGCATCT. IRF1-Fw, GCTGGGACATCAACAAGGAT. IRF1-Rev: CCTGCTCTGGTCTTTCACCT; LGALS9-Fw: AAGGTGATGGTGAACGGGAT. LGALS9-Rev: ACTGTCTGGGTAATGGGAGC; CD68-Fw: TCCAGGGAAGCTGTGAGGGT. CD68-Rev: AGCCGAGAATGTCCACTGTGC. CD163-Fw: TTTGTCAACTTGAGTCCCTTCAC. CD163-Rev: TCCCGCTACACTTGTTTTCAC. VEGFA-Fw: TCCTCACACCATTGAAACCA. VEGFA-Rev: TTTTCTCTGCCTCCACAATG.
Genes from eLBP were selected for consistent clustering using the R software package ConsensusClusterPlus to sort the immune molecular CCA subtypes (Wilkerson & Hayes, 2010). Correlations between subtypes, clinical features, immunity, and prognosis were analyzed.
The somatic mutation data of all patients with CCA was obtained from the International Cancer Genome Consortium (ICGC, https://dcc.icgc.org/). Mutations were analyzed and visualized using maftools (Mayakonda et al., 2018). The enrichment scores of the hallmark genes were evaluated through single-sample GSEA (ssGSEA) using the “GSVA” R package (Hänzelmann et al., 2013). Hallmark gene sets were obtained from MSigDB (https://www.gsea-msigdb.org/gsea/msigdb/).
The “limma” package was used to perform differentially expressed gene (DEG) analysis. An empirical Bayesian method was applied to estimate the DEGs between two clusters, which were identified using a consistent clustering method based on moderated t-tests (Ritchie et al., 2015). The adjusted p-value for multiple testing was calculated using the Benjamini-Hochberg correction. Genes with an absolute log2 (fold change) greater than one and false discovery rate (FDR) < 0.05 were identified as DEGs between the two subtypes.
We downloaded the “CIBERSORT” scripts (https://cibersort.stanford.edu/) to estimate the immune composition of patients with CCA using a normalized express matrix (Chen et al., 2018). Immune, stromal, and tumor purity scores were calculated using the “estimate” R package (Yoshihara et al., 2013).
Differential DNA methylation analysis was conducted on both normal and tumor tissues, as well as on the two tumor subtypes. Data were pre-processed using the “minfi” package (Aryee et al., 2014). Hypomethylation probes with β < 0.5 hypo-methylation probes were used to conduct the analysis. We considered CpG probes to be hypo-methylated if they met the following criteria (Song You et al., 2018): β < 0.5 (Tirosh et al., 2016); M-value was significantly different between the two subtypes (q-value < 0.05); and (Stuart et al., 2019) mean β-value difference (Δβ) of >0.2 between the two groups. Copy number profiles were derived from the signal intensity values of methylated and unmethylated probes using the “conumee” package in R (http://bioconductor.org/packages/conumee). Copy number variations (CNVs) were derived from the log2-ratios of the tumor samples to the average value of matched normal tissues.
All computational and statistical analyses were performed using R software (https://www.r-project.org/). The unpaired Student’s t-test was used to compare two groups with normally distributed variables, while the Mann-Whitney U-test was used to compare two groups with non-normally distributed variables. Survival analysis was performed using the Kaplan–Meier “survival” R package. The log-rank test was used to determine whether the survival curves were significantly different. A p-value < 0.05 was considered statistically significant.
We used the least absolute shrinkage and selection operator (LASSO) method with 10-fold cross-validation and the Cox proportional hazards model with Akaike information criterion (AIC) selection criteria to build a nine-gene prognostic risk model based on the 54 TF-CIGs using the “glmnet” R package. The tumor mutation-burden-related signature (TMBRS) was calculated using Eq. 11:
where βi can be derived from multivariate Cox analysis. The prognostic accuracy of the classifiers in the training and testing sets was evaluated using the Kaplan–Meier curve and log-rank test.
We predicted the IC50 values for the CCAs in GSE89749 via OncoPredict software using the 54 genes obtained from the eLBP algorithm (Maeser et al., 2021). In this step, we adopted the gene expression matrix from Genomics of Drug Sensitivity in Cancer (https://www.cancerrxgene.org/) and acquired drug sensitivity scores for the two subtypes. Next, we conducted a differential analysis of drugs between the two subtypes using the Wilcoxon rank-sum test. Drugs with p-values < 0.001 and drug sensitivity scores <1 were considered potential candidates.
A schematic of the study design is shown in Figure 1A. To investigate the composition of the TME in CCA, we reanalyzed the single-cell data from GSE138709 (Zhang et al., 2020). We deconstructed the cell types in tumors and adjacent tissues. We observed evident differences between the two tissues. We obtained 16 cell types in the adjacent tissues, including CD8_GZMA, CD8_MKI67, and CD69-positive T cells, M1-like macrophage subtypes (CD68_C1QC, CD68_S100A9), and two DC subtypes (Figure 1B; Supplementary Figure S1A). GSEA showed that cytokine production and inflammatory responses were enriched in M1-like macrophage subtypes (CD68_C1QC and CD68_S100A9). Additionally, T cell activation and T cell-mediated immunity pathways were enriched in CD8_GZMA cells (Figure 1B). In tumor tissues, we obtained three T cell subtypes, including memory-like T cells (CCR7+ and CCR7_T) and exhausted CD8 (TIGIT+ and TIGIT_CD8). We also obtained M2-like macrophages (VEGFA+ and VEGFA_MACRO; Figure 1C; Supplementary Figure S1A). GSEA results showed that pathways including cell communication, cell motility, and response to stimulus were enriched in VEGFA_MACRO, while leukocyte activation and T cell differentiation were enriched in the TIGIT_CD8 subtype (Figure 1C). Interestingly, the sample distribution results showed that T cells and macrophages were mostly from samples 23T and 24T. In contrast, the cells from 18T to 20T samples were almost all epithelial cells (Methods; Supplementary Table S2). On this basis, the tumor samples in this dataset were divided into high- and low-TIL tumor subtypes. These results indicate that T cells and macrophages perform different functions in tumor and para-cancerous tissues.
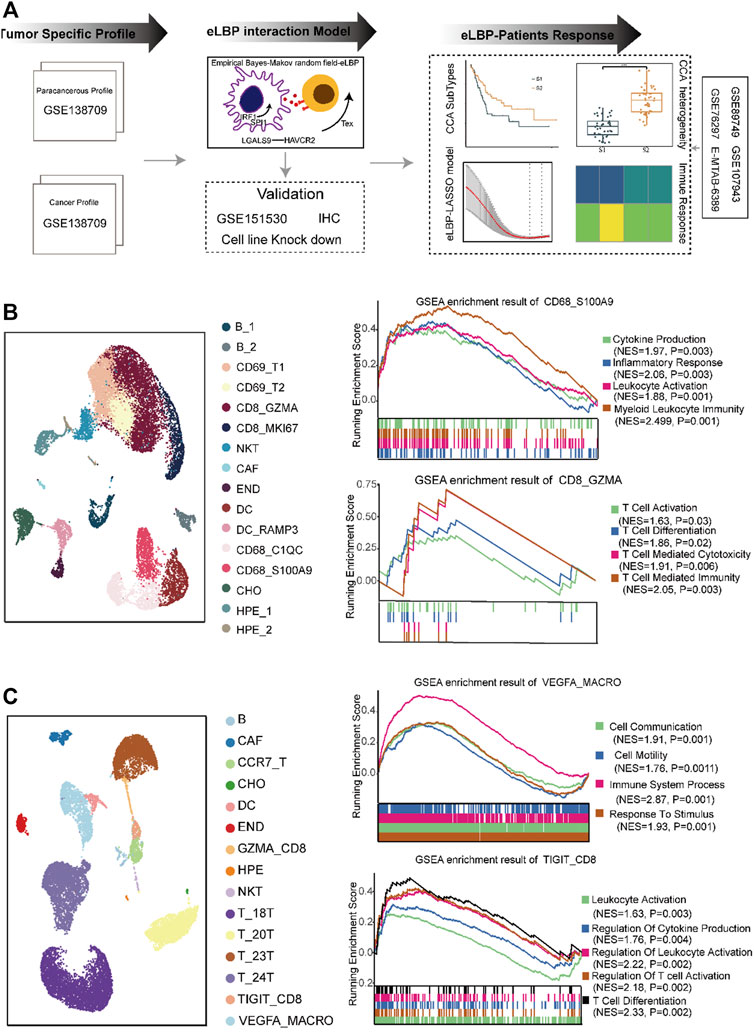
FIGURE 1. The distinct composition and function of cell types in the tumor microenvironment of cholangiocarcinoma. (A) Overview of the study design. We first analyzed distinct cell composition and function of the normal and cancer tissue in cholangiocarcinoma (CCA) single-cell RNAseq dataset (GSE138709). Next, we developed a method integrating empirical Bayes and Markov random field models (eLBP) which could simultaneously calculate transcription factors, interaction genes, and associated signaling pathways involved in cell-cell communication. We found that TFs IRF1/SPI1 in VEGFA-positive macrophages could enhance the expression of LGALS9 and induce the exhaustion of CD8 T cells via LGALS9/HAVCR2 axis by eLBP method. Meanwhile, we obtained 54 genes involved in cell communication. The 54-gene panel could also group the CCA patients into two subtypes, in which patients in S2 showed high expression level of immune related genes and had better prognosis. Finally, we constructed a nine-gene eLBP-LASSO-COX risk model which was designated as tumor microenvironment risk score (TMRS). The TMRS panel was revealed to be a reliable tool for prognostic prediction and chemotherapeutic decision-making in CCA. (B) Uniform manifold approximation and projection (UMAP) plot showing the cell composition in normal. GSEA enrichment plot showing the function of macrophage subtypes CD68_S100A9 and CD8 T cell subtype CD8_GZMA. NES: Normalized enrichment score. (C) UAMP plot showing the cell composition in cancer. GSEA enrichment plot showing the function of macrophage subtypes VEGFA_MACRO and CD8 T cell subtype TIGIT_CD8. NES: Normalized enrichment scores.
To explore the mechanisms that induce the establishment of different immune states between normal and tumor tissues, we developed the eLBP algorithm to evaluate the correlation among immune-infiltrating, storm, and epithelial cells in normal and tumor single-cell data by calculating the intensity scores among the cell types (Figure 2A; Methods). First, we analyzed 7,071 activated cell type-specific pathways in normal tissues and 8,096 pathways in tumor tissues, in which 813 ligand or receptor genes in tumor tissues and 559 in normal tissues were computed based on the CellChat dataset (Supplementary Table S3). Second, we constructed protein-protein interaction (PPI) networks and calculated the cosine similarity between the PPI genes in each cell type. The degree of ligand/receptor (L/R) genes in the network is shown in Supplementary Figure S2A. The expression of ligand and receptor genes in CAF, CD68_C1QC, DC_RAMP3, and END was higher in normal tissues. T, 24T, TIGIT-CD8, and VEGFA_MACRO had higher degrees in the tumor tissues, indicating these cell types were in hyperactive status in cell communication among the TME (Supplementary Figure S2B). The levels of ligand and receptor genes indicate that macrophages with high levels of VEGFA play an important role in tumor tissues. Next, we used the eLBP algorithm to calculate the interaction probability of each ligand and receptor (Supplementary Table S3). Using this probability, we obtained the interaction intensity scores for each L/R pair among the cell types in the TME (Supplementary Tables S4, S5). The results demonstrated significantly different communities in tumors and normal tissues. In normal tissue, cells from DC_RAM3 and CD68_C1QC interacted with activated CD8 cells from CD8_GZMA according to NAMPT and chemokines, respectively (Figure 2B). In contrast, there were high levels of TIL infiltration in the tumor tissues. In addition, CAF could interact with memory-like T cells in CCR7_T, tumor cells in T_24T, and macrophages from VEGFA_MACRO. Moreover, VEGFA_MACRO interacted with exhausted CD8 + cells from TIGIT_CD8 (Figure 2C). The interaction genes between CAF and others are mainly related to cell adhesion, such as glycoprotein CD44 and collagen genes (Figure 2C). Meanwhile, VEGFA_MACRO, with a high level of LGALS9, interacted with TIGIT and HAVCR2 (Figure 2C). These results illustrate that VEGFA_MACRO plays an important role in CD8 exhaustion.
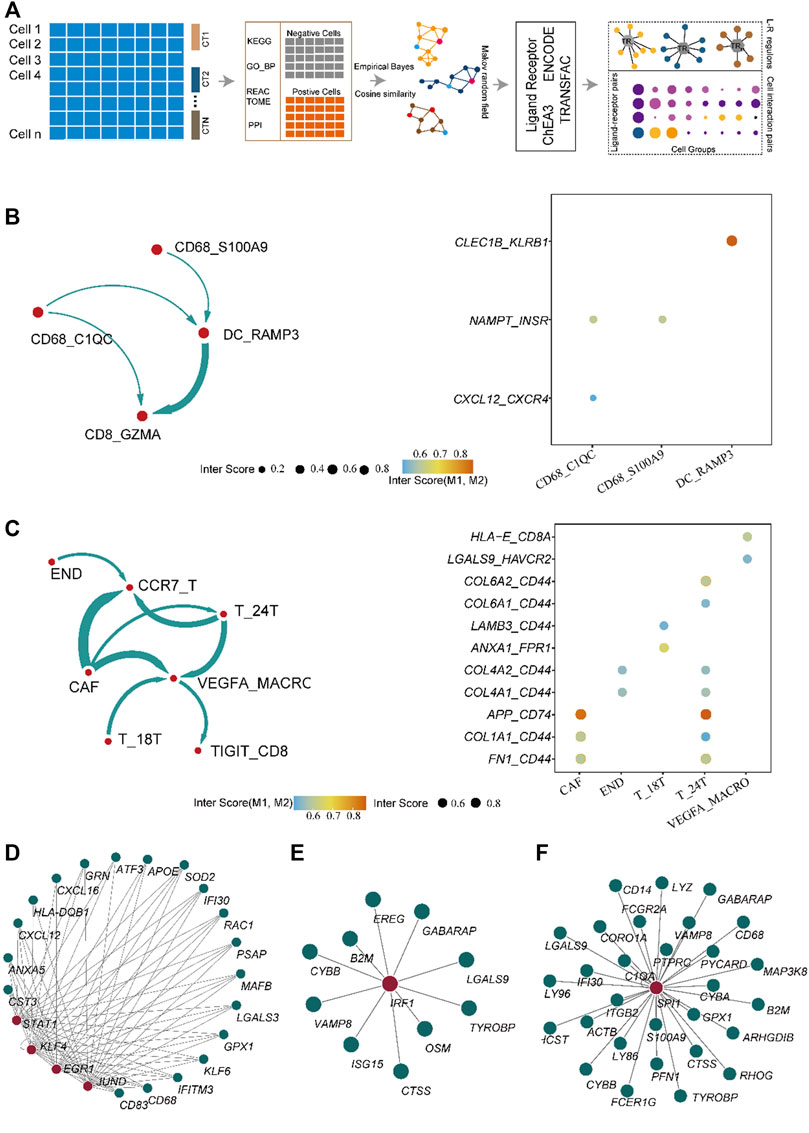
FIGURE 2. Algorithm framework of eLBP and the result calculated by eLBP. (A) Workflow of eLBP. Cell communication profile in the normal (B) (left) and cancer tissue (C), in which line width was positive correlation with the cell interaction strength. Dot plot showing the interaction genes in the normal (B) and cancer tissue (C), in which the row showing the interaction genes and the column showing the interaction cell types. The network showing the critical transcription factor (TF) regulons in normal (D) and cancer tissue (E,F), in which red nodes were TFs and the other nodes were target genes.
Subsequently, we analyzed the key TFs that promote the expression of ligand genes in normal and cancerous tissues using the eLBP algorithm (Methods). In normal tissues, CD68_C1QC cells interacted with CD8_GZMA via CXCL12/CXCR4 (Figure 2B). We next obtained seven TFs (STAT1, EGR1, KLF4, and JUND; Figure 2D; Supplementary Table S6) from ENCODE and one TF (KLF2; Supplementary Table S6) from ChEA3. Moreover, KLF4 and STAT1 regulated the ligand gene CXCL12 (Figure 2D), which may promote the expression of ligand genes and influence cell signaling. In addition, cells in DC_RAMP3 interact with those in CD8_GZMA via CLEC1B/KLRB1 and TF STAT3 in DC_RAMP3 could regulate CLEC1B (Supplementary Table S6). Notably, in the tumor tissues, we found that only the cells in VEGFA_MACRO interacted with those in TIGIT_CD8 via LGALS9/HAVCR2 (Figure 2B). We then obtained 18 TF regulons from the three datasets, in which IRF1 was enriched in both ENCODE and TRANSFAC, and SPI1 was enriched in both ENCODE and ChEA3 (Supplementary Table S6). Moreover, these two TFs also regulated the ligand gene LGALS9 (Figures 2E,F). In addition, the profiles of LGALS9, HAVCR2, IRF1, and SPI1 in CCA patients from another single-cell dataset GSE151530 also verified their functions related to TAM and exhausted T cells (Supplementary Figure S3) (Ma et al., 2021). Moreover, immunohistochemical analysis further confirmed the high expression of HAVCR2 in human CCA patients and the co-expression of LGALS9 and these two genes (Figure 3A). The significantly low expression of LGALS9 in siRNA-IRF1/SPI1 VEGFA-positive macrophages further validated the transcript regulon of SPI1/IRF1-LGALS9 (Figures 3B,C). Finally, we derived the gene trimmed-PPI network from the mutually connected cell types in which L/R genes participate in normal and tumor tissues via eLBP (Supplementary Figure S4).
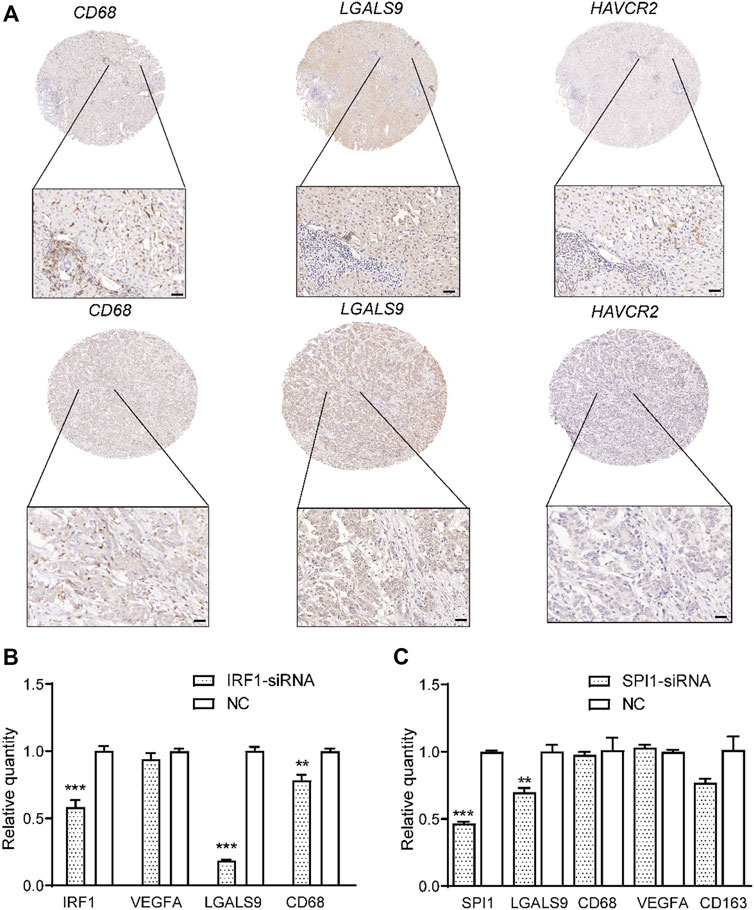
FIGURE 3. Validation of co-expression of LGALS9 and HAVCR2 and function of transcription factors IRF1/SPI1. (A) Immunohistochemical plot showing the co-expression of LGALS9 and HAVCR2 in two CCA patients. Scale bars represent 50 μm. Bar plot showing that TFs IRF1 (B) and SPI1 (C) could regulate the expression level of LGALS9 (***p < 0.001; **p < 0.01, t-test).
Concerning the potential function of VEGFA_MACRO to induce the expression of exhausted genes such as HAVCR2, we further overlapped the genes in TF regulons with those in ligand or receptor-interaction trimmed-networks from eLBP from VEGFA_MACRO and obtained 54 genes (Supplementary Figure S4C; Supplementary Table S7). We then investigated the clinical features of patients with CCA using these genes. We grouped patients into different subtypes in two bulk RNA datasets using consistent clustering (Methods; GSE89749; GSE76297; Supplementary Table S1) (Chaisaingmongkol et al., 2017; Jusakul et al., 2017). Patients in GSE89749 were grouped into two subtypes (S1 and S2; Figure 4A; Supplementary Figure S5). Moreover, we found that the samples from the S2 group had a significantly better prognosis (p = 0.027; Figure 4A). Notably, the tumor purity results showed that patients in S2 had higher infiltrative immune and stromal scores, but lower tumor purity (Figure 4B). The immune infiltration results showed that patients in S2 had a higher ratio of CD8, activated memory CD4, S1, and M2-like macrophage subtypes (Figure 4C). In particular, CD8A, CD8B, CD68, HAVCR2, and LGALS9 were highly expressed in S2 (Figure 4D). On this basis, S2 was classified as the inflammatory “hot tumor” subtype and S1 as the “cold tumor”. We further identified the clustering results from other RNA sequencing datasets (GSE76297). The patients in S2 from GSE76297 had higher expression levels of LGALS9, IRF1, SPI1, and immune genes and similar TIL profiles with the GSE89749 data (Supplementary Figure S6). These results further confirmed the existence of high-TIL tumor subtypes in CCA and indicated the exhaustion of CD8 cells.
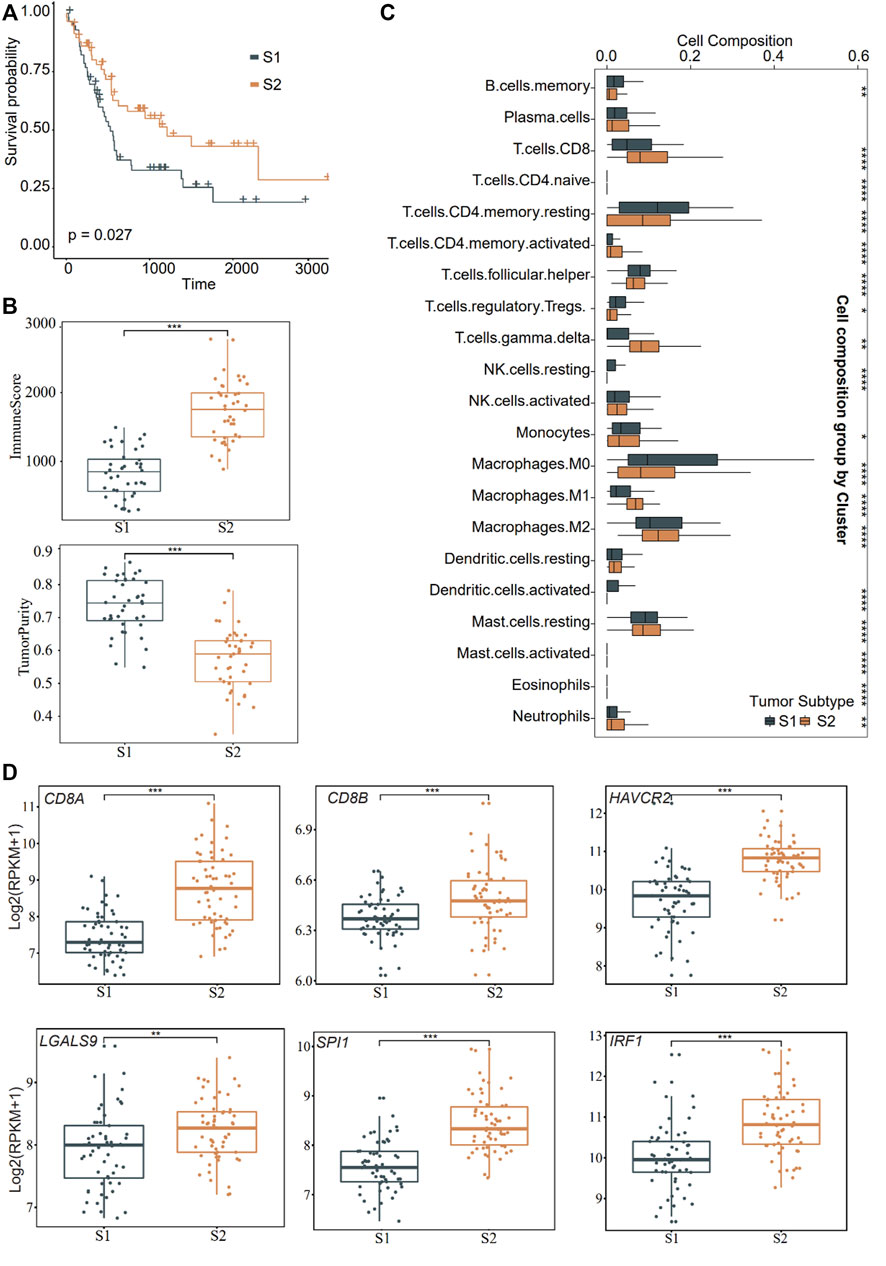
FIGURE 4. Distinct function in the two subtypes of CCA. (A) Overall survival curves showing the prognosis result of the two subtypes (S1 and S2) obtained from consensus clustering in CCA cohort (GSE89749) using the genes obtained from eLBP. Statistical significance was calculated using the log-rank test. (B) Box plots showing the immune and tumor purity scores in the two distinct malignant subtypes (***p < 0.001). Pairwise comparison was conducted by Wilcoxon rank sum test. (C) Box plots showing the 22 immune cell infiltrates ratio in the two distinct malignant subtypes in the significant enrich patients. (*p < 0.05; **p < 0.01; ***p < 0.001; Wilcoxon rank sum test). (D) Comparisons of gene expression level of immune genes in the two distinct malignant subtypes (**p < 0.01; ***p < 0.001; Wilcoxon rank sum test). For the boxplot, the centerline, median; box limits, upper and lower quartiles. Each dot represents a sample.
Next, we analyzed the heterogeneity of somatic frequencies across the two CCA subtypes. The results showed that the cell replication genes TP53 and genes in the PI3K/Akt pathway, such as BAP1, KRAS, EPHA2, ARID1A, and SMAD4, exhibited high mutation ratios in the two subtypes (Figure 4A). S1 had high ratios of ADAMTS20, KMT2C, and APC (Figure 5A, 13%, 13%, and 11%, respectively). S2 had a higher mutation frequency of IDH1 and MUC16 (Figure 5A, 14% and 12%, respectively). Tumor cells with TP53 mutations are generally identified as being more immunogenic (Chasov et al., 2020), and we found that immune genes, such as CD3D and HAVCR2, were highly expressed in the MUC16 mutated group. Subsequently, we investigated the heterogeneity of methylation profiles between normal tissues and tumors. We obtained 15,520 differential probes between normal and tumor tissues, including 5,219 downregulated and 10, 321 upregulated probes (Methods, Figure 5B). In normal tissues, hypomethylated genes were mainly enriched in pathways such as T cell differentiation, cell adhesion, and inflammatory response, which were also enriched in normal single-cell datasets (Figure 5B). This indicated a high immune infiltration and activated immune status of the normal. Among the two CCA subtypes, we obtained 697 downregulated probes and 1,115 upregulated probes in S2. In addition, there were 684 downregulated hypomethylated probes enriched in 271 genes in S2. These genes were enriched in MAPK, CAMP, cGMP-PKG, and PI3K-AKT pathways (Figure 5C). We then conducted CNV analysis using the methylation data. The results showed that significant CNV signaling occurred across chromosomes 1, 6, and 8 in both subtypes (Figure 5D). Interestingly, we found that S2 had more CNV regions on chromosomes 6 and 8 (Figure 5D). We then analyzed the hypomethylated genes on chromosomes 6 and 8 in S2. These genes were enriched in antigen presentation and immune-toxic suppression, as well as T cell differentiation and G protein-coupled receptor-associated signaling pathways (Figure 5E).
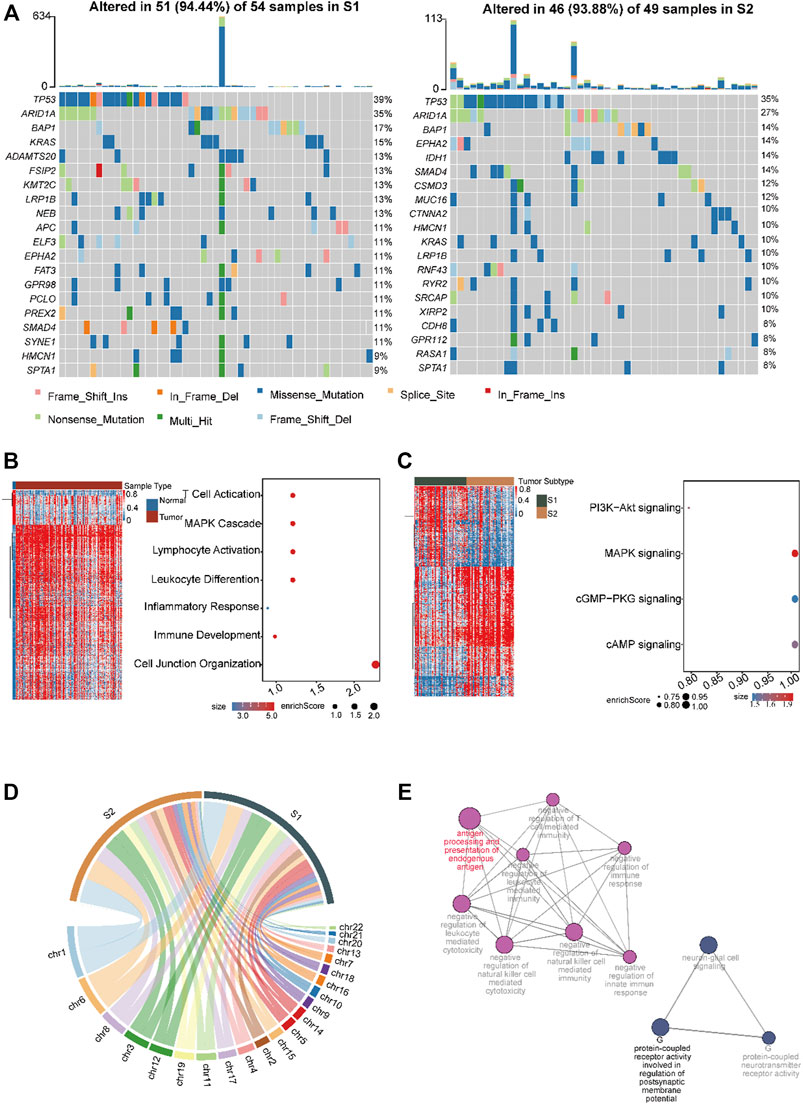
FIGURE 5. Investigation of the mutation profile inter-tumor heterogeneity profiles in the two CCA subtypes. (A) The top ten mutated genes across the two subtypes. The colors of rectangles in the body of the heat map indicate different types of somatic mutations and the key identifying each mutation type is shown at the bottom below the color bar. The bar plot on the top shows the counts of mutations for each patient and the colors in the bar plots correspond to the colors showing mutation types in the body of the heat map. The title of the heat map showing the mutation sample number in each subtype including amplification, missense mutations, and deep deletions. The left number showing the gene mutation frequency in the two subtypes. Heatmap and dot plot showing the differentially expressed genes and the significantly enriched pathways in normal (B) and cancer tissue (C) in CCA. Color gradient blue to red indicates relative expression levels from low to high. Dot size represent enrichment scores. (D) Circos plot showing the amplification and deletion regions in the two subtypes. The width of the plot indicated the CNV mutation regions numbers in each subtype across the chromosomes. (E) Network showing enriched pathways of hypo-methylated genes that occur on chromosomes 6 and 8 in S2. Dot size represents the enrichment scores.
LASSO-COX regression was used to construct the eLBP-COX TME risk score (TMRS) using the following formula in dataset GSE89749: TMRS = −0.03085 × IRF1 − 1.03491 × RHOA + 0.5868 × PLAUR − 0.2188 × NCF2 − 0.2273×CXCR4 − 0.1201 × HCK − 0.1773 × LYZ − 0.1244 × RGS1 + 0.2259 × VCAN (Methods; Supplementary Figure S7). We found that patients with low TMRS had a better prognosis with higher immune scores and presented with IRF1, LGALS9, and other immune genes in GSE89749 (Figures 6A,B), indicating an effective indicator of RS score in prognostic risk prediction. Furthermore, we verified the RS model in two other datasets (EMTAB-6389; GSE107943 Supplementary Table S1; Methods; Figure 6A) (Ahn et al., 2019). Meanwhile, a nomogram was drawn to visualize the results of the eLBP-COX regression analysis (Figure 6C). Subsequently, we conducted drug susceptibility analysis and explored seven drugs (AZD7762, BI 2536, CDK9 5576, gemcitabine, mitoxantrone, teniposide, and topotecan) with IC50 values that were significantly lower in S2 than in S1 (Methods; Figure 6D). Specifically, BI 2536, teniposide, and mitoxantrone were used as potential therapeutic drugs for HCC that could be used in the treatment of CCA.
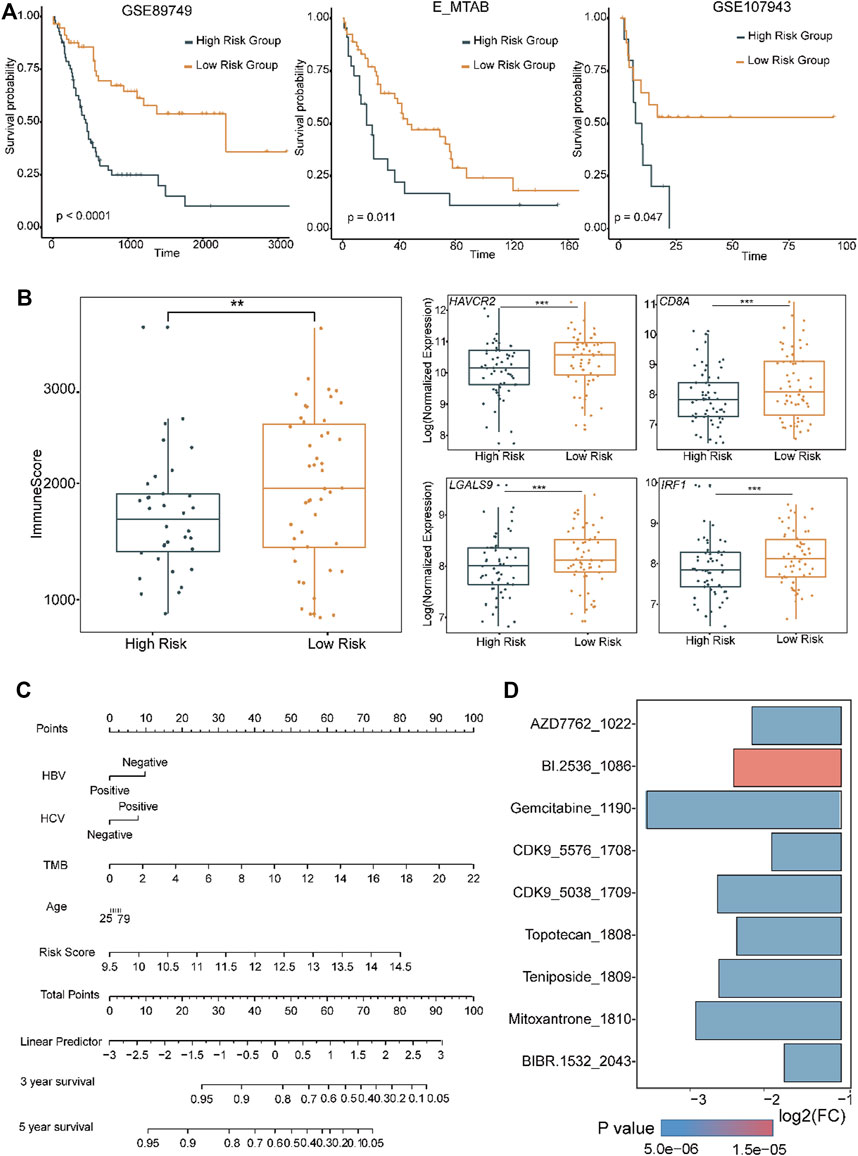
FIGURE 6. Distinct functions in different level of tumor microenvironment risk scores. (A) Overall survival curves showing the prognosis results with different level of tumor microenvironment risk score (TMRS) in the two CCA cohorts using the genes obtained from eLBP-LASSO. Statistical significance was calculated using the log-rank test. (B) Box plots showing the immune and the exhausted related genes in high and low risk group (**p < 0.01; ***p < 0.001; Wilcoxon rank sum test). (C) Nomogram plot showing the predicted 3- and 5-year survival possibilities of individual CCA patients. (D) Bar plot showing the drug sensitivity in S2 subtype.
Most patients with CCA are usually diagnosed at advanced stages and are not eligible for curative resection, with an overall survival (OS) of less than 1 year from the time of diagnosis. In the last decade, several novel therapeutic interventions and agents have improved the clinical outcomes of patients with CCAs. For example, radiofrequency ablation and mFOLFOX plus active symptom control (ASC) could significantly improve OS after progression on cisplatin-gemcitabine combination therapy compared to ASC alone (Rizzo et al., 2020). Multi-omics studies have revealed that FGFR2 fusions and rearrangements, IDH-1 mutations, and BRAF mutations are frequently found in patients with CCA. Targeted therapies such as the FGFR2 inhibitor pemigatinib and IDH1 inhibitor ivosidenib potentiate the treatment of CCAs harboring these mutations (Brandi et al., 2020). However, polyclonal mutations can also induce resistance to target drugs. Novel therapeutic strategies, such as immunotherapy, are needed, and immunotherapy is emerging as an important approach to cancer treatment. However, its efficacy varies greatly among cancer patients (Murciano-Goroff et al., 2020). CCA possesses a special TME that can be classified as either immune “hot” or “cold”. Of these, immune “hot” tumors have a better response to immunotherapies (Loeuillard et al., 2019). ICIs represent a revolutionary milestone in the field of immuno-oncology (Darvin et al., 2018). The most common ICIs currently in clinical trials are PD-1/PD-L1 and CTLA4 (Rizzo et al., 2021b). The response rates to ICIs vary owing to the complex composition of the TME (Yao and Gong, 2021). Therefore, we systematically investigated the composition of the TME to explore the critical interactions between cell types and signal transduction in CCAs.
First, we analyzed the TME composition of patients with CCAs using single-cell sequencing data. We found that activated CD8 cells and M1-like macrophages infiltrated normal tissues but exhausted CD8 cells in tumors. We further explored the critical elements in the signaling transduction pathways among CCA TMEs, such as the most frequently interacting cell types, the corresponding activated interaction gene pairs, the key transcription factors, and the gene regulons, by integrating L/R interactions with intracellular signaling via the Markov Random Fields model and developed an eLBP algorithm. We adopted the algorithm and found that macrophages with high expression levels of LGALS9 could interact with exhausted CD8 T cells expressing high levels of HAVCR2 in tumor tissues in CCAs. It is reported that galectin-9 (LGALS9) could interact with PD-1 and TIM-3 (HAVCR2) to regulate T cell death in multi-cell lines (Yang et al., 2021). Meanwhile, we first found that TFs, such as IRF1 and SPI1, may promote the expression of LGALS9 and verified their expression through multiple datasets and immunohistochemical staining in CCA tissues. It has been reported to IRF1 inhibits antitumor immunity through upregulation of PD-L1 in MC38 and CT26 colon cancer and B16 melanoma mouse models (Shao et al., 2019). It has been demonstrated that Spi1 is required for myeloid-specific expression of Lgals9 in zebrafish (Zakrzewska et al., 2010). However, their function in CCAs merits further investigation.
Second, eLBP provided a gene classifier consisting of 54 genes that dominated the signal transduction between macrophages and exhausted CD8 T cells. This classifier can group CCA patients into replicated subtypes S1 and S2. Interestingly, patients with the inflammatory subtype S2 with high levels of LGALS9 and HAVCR2 had a better prognosis. Meanwhile, a higher mutation ratio of MUC16 in S2 was positive for immune-exhausted genes, such as HAVCR2 and TIGIT. Recent studies have demonstrated that MUC16 mutations are associated with better survival outcomes and immune responses in gastric and endometrial cancers (Wang et al., 2020).
Pathological confirmation of the diagnosis is necessary before any nonsurgical treatment but is challenging in CCA therapy. Endoscopic imaging and tissue sampling are useful; however, biopsy samples are often inadequate for molecular profiling. Tissue sampling is reported to be highly specific but has low sensitivity in the diagnosis of malignant biliary strictures. Liquid biopsy can capture and monitor the tumor genetic profile or response to therapy in real time. For example, high mutation rates of AR1D1A, FGFR2, PIK3CA, and TP53 proteins, high levels of microRNAs such as miR-21, and high levels of proteins and cytokines such as CK-19, MMP-7, osteopontin, periostin, and IL-6 have been found in CCA patient serum (Rompianesi, et al., 2021). These protein and microRNA markers can serve as prognostic and therapeutic markers. In this study, we set up a 54-gene panel to screen or predict patients that are suitable for immunotherapy and finally constructed a nine-gene eLBP-LASSO-COX risk model. From this model, we found that IRF1 was positively associated with low risk, while PLAUR and VCAN were positively associated with a high-risk score in tumorigenesis of CCAs. It has been reported that PLAUR overexpression correlates with poor prognosis in HCC (Woo et al., 2008). Glioma patients with higher PLAUR expression are infiltrated with fewer CD8 T cells (Zeng et al., 2021). VCAN has been used as an immune exclusion marker (Emmerich et al., 2020). To facilitate clinical application, we will further investigate their expression levels in serum and exosomes and their capacity for the early screening of CCAs.
Figures, tables, and images will be published under a Creative Commons CC-BY licence and permission must be obtained for use of copyrighted material from other sources (including re-published/adapted/modified/partial figures and images from the internet). It is the responsibility of the authors to acquire the licenses, to follow any citation instructions requested by third-party rights holders, and cover any supplementary charges.
To take part in the Resource Identification Initiative, the corresponding catalogue numbers were listed in Table 1.
TABLE 1. Resource identification initiative information.
The original contributions presented in the study are included in the article/Supplementary Material, further inquiries can be directed to the corresponding author.
KY designed the study, and TW performed the data analysis. TW wrote the manuscript. CX, DX, YL, XL, ZL, LL, and ZZ performed the immunohistochemical and cell culture experiments, ND modified the pictures, and KY, CX and YL revised the manuscript.
This work was supported by the National Key R&D Program of China (2022YFC3400300), National Natural Science Foundation of China grant (32125009 and 32070663 for KY, 32070134 for DX, 61702406 for XY, 82273059 and 82073091 for CX, 81872253 for LL), and by Key Construction Program of the National “985” Project, by the Fundamental Research Funds for the Central Universities (xzy012020012).
We would like to thank the comments from Mengyun Ke and other colleagues in the lab.
The authors declare that the research was conducted in the absence of any commercial or financial relationships that could be construed as a potential conflict of interest.
All claims expressed in this article are solely those of the authors and do not necessarily represent those of their affiliated organizations, or those of the publisher, the editors and the reviewers. Any product that may be evaluated in this article, or claim that may be made by its manufacturer, is not guaranteed or endorsed by the publisher.
The Supplementary Material for this article can be found online at: https://www.frontiersin.org/articles/10.3389/fgene.2022.981145/full#supplementary-material
CAF, cancer-associated fibroblasts; CCA, cholangiocarcinoma; CP1, checkpoint inhibitors; DC, dendritic cells; DEGs, differential genes; eLBP, empirical Bayes loopy belief propagation; iCCA, intrahepatic; ICIs, immune checkpoint inhibitors; ICGs, mimmune checkpoint genes; LASSO, least absolute shrinkage and selection operator; MRF, Markov random field; TF, transcription factors; TMRS, tumor microenvironment risk score; TMEs, Tumor microenvironments; UMAP, uniform manifold approximation and projection.
Ahn, K. S., O'Brien, D., Kang, Y. N., Mounajjed, T., Kim, Y. H., Kim, T. S., et al. (2019). Prognostic subclass of intrahepatic cholangiocarcinoma by integrative molecular-clinical analysis and potential targeted approach. Hepatol. Int. 13 (4), 490–500. doi:10.1007/s12072-019-09954-3
Aryee, M. J., Jaffe, A. E., Corrada-Bravo, H., Ladd-Acosta, C., Feinberg, A. P., Hansen, K. D., et al. (2014). Minfi: A flexible and comprehensive bioconductor package for the analysis of infinium DNA methylation microarrays. Bioinformatics 30 (10), 1363–1369. doi:10.1093/bioinformatics/btu049
Banales, J. M., Marin, J. J. G., Lamarca, A., Rodrigues, P. M., Khan, S. A., Roberts, L. R., et al. (2020). Cholangiocarcinoma 2020: The next horizon in mechanisms and management. Nat. Rev. Gastroenterol. Hepatol. 17 (9), 557–588. doi:10.1038/s41575-020-0310-z
Brandi, G., Rizzo, A., Dall’Olio, F. G., Felicani, C., Ercolani, G., Cescon, M., et al. (2020). Percutaneous radiofrequency ablation in intrahepatic cholangiocarcinoma: A retrospective single-center experience. Int. J. Hyperth. 37 (1), 479–485. doi:10.1080/02656736.2020.1763484
Bridgewater, J., Galle, P. R., Khan, S. A., Llovet, J. M., Park, J. W., Patel, T., et al. (2014). Guidelines for the diagnosis and management of intrahepatic cholangiocarcinoma. J. Hepatol. 60 (6), 1268–1289. doi:10.1016/j.jhep.2014.01.021
Butler, A., Hoffman, P., Smibert, P., Papalexi, E., and Satija, R. (2018). Integrating single-cell transcriptomic data across different conditions, technologies, and species. Nat. Biotechnol. 36 (5), 411–420. doi:10.1038/nbt.4096
Chaisaingmongkol, J., Budhu, A., Dang, H., Rabibhadana, S., Pupacdi, B., Kwon, S. M., et al. (2017). Common molecular subtypes among asian hepatocellular carcinoma and cholangiocarcinoma. Cancer Cell 32 (1), 57–70. e53. doi:10.1016/j.ccell.2017.05.009
Chasov, V., Mirgayazova, R., Zmievskaya, E., Khadiullina, R., Valiullina, A., Stephenson Clarke, J., et al. (2020). Key players in the mutant p53 team: Small molecules, gene editing, immunotherapy. Front. Oncol. 10, 1460. doi:10.3389/fonc.2020.01460
Chen, B., Khodadoust, M. S., Liu, C. L., Newman, A. M., and Alizadeh, A. A. (2018). Profiling tumor infiltrating immune cells with CIBERSORT. Methods Mol. Biol. 1711, 243–259. doi:10.1007/978-1-4939-7493-1_12
Darvin, P., Toor, S. M., Sasidharan Nair, V., and Elkord, E. (2018). Immune checkpoint inhibitors: Recent progress and potential biomarkers. Exp. Mol. Med. 50 (12), 1–11. doi:10.1038/s12276-018-0191-1
Emmerich, P., Matkowskyj, K. A., McGregor, S., Kraus, S., Bischel, K., Qyli, T., et al. (2020). VCAN accumulation and proteolysis as predictors of T lymphocyte-excluded and permissive tumor microenvironments. J. Clin. Oncol. 38 (15), 3127. doi:10.1200/JCO.2020.38.15_suppl.3127
Hänzelmann, S., Castelo, R., and Guinney, J. (2013). Gsva: Gene set variation analysis for microarray and RNA-seq data. BMC Bioinforma. 14 (1), 7–15. doi:10.1186/1471-2105-14-7
Hegde, P. S., and Chen, D. S. (2020). Top 10 challenges in cancer immunotherapy. Immunity 52 (1), 17–35. doi:10.1016/j.immuni.2019.12.011
Jiang, Y., Zhao, X., Fu, J., and Wang, H. (2020). Progress and challenges in precise treatment of tumors with PD-1/PD-L1 blockade. Front. Immunol. 11, 339. doi:10.3389/fimmu.2020.00339
Jin, S., Guerrero-Juarez, C. F., Zhang, L., Chang, I., Ramos, R., Kuan, C. H., et al. (2021). Inference and analysis of cell-cell communication using CellChat. Nat. Commun. 12 (1), 1088. doi:10.1038/s41467-021-21246-9
Jusakul, A., Cutcutache, I., Yong, C. H., Lim, J. Q., Huang, M. N., Padmanabhan, N., et al. (2017). Whole-genome and epigenomic landscapes of etiologically distinct subtypes of cholangiocarcinoma. Cancer Discov. 7 (10), 1116–1135. doi:10.1158/2159-8290.CD-17-0368
Loeuillard, E., Conboy, C. B., Gores, G. J., and Rizvi, S. (2019). Immunobiology of cholangiocarcinoma. JHEP Rep. 1 (4), 297–311. doi:10.1016/j.jhepr.2019.06.003
Ma, L., Wang, L., Khatib, S. A., Chang, C. W., Heinrich, S., Dominguez, D. A., et al. (2021). Single-cell atlas of tumor cell evolution in response to therapy in hepatocellular carcinoma and intrahepatic cholangiocarcinoma. J. Hepatol. 75, 1397–1408. doi:10.1016/j.jhep.2021.06.028
Maeser, D., Gruener, R. F., and Huang, R. S. (2021). oncoPredict: an R package for predicting in vivo or cancer patient drug response and biomarkers from cell line screening data. Brief. Bioinform. 22, bbab260. doi:10.1093/bib/bbab260
Mayakonda, A., Lin, D. C., Assenov, Y., Plass, C., and Koeffler, H. P. (2018). Maftools: Efficient and comprehensive analysis of somatic variants in cancer. Genome Res. 28 (11), 1747–1756. doi:10.1101/gr.239244.118
Murciano-Goroff, Y. R., Warner, A. B., and Wolchok, J. D. (2020). The future of cancer immunotherapy: Microenvironment-targeting combinations. Cell Res. 30 (6), 507–519. doi:10.1038/s41422-020-0337-2
Ritchie, M. E., Phipson, B., Wu, D., Hu, Y., Law, C. W., Shi, W., et al. (2015). Limma powers differential expression analyses for RNA-sequencing and microarray studies. Nucleic Acids Res. 43 (7), e47. doi:10.1093/nar/gkv007
Rizzo, A., Ricci, A. D., and Brandi, G. (2021a). Durvalumab: An investigational anti-PD-L1 antibody for the treatment of biliary tract cancer. Expert Opin. Investig. Drugs 30 (4), 343–350. doi:10.1080/13543784.2021.1897102
Rizzo, A., Ricci, A. D., and Brandi, G. (2021b). Pemigatinib: Hot topics behind the first approval of a targeted therapy in cholangiocarcinoma. Cancer Treat. Res. Commun. 27, 100337. doi:10.1016/j.ctarc.2021.100337
Rizzo, A., Ricci, A. D., Tober, N., Nigro, M. C., Mosca, M., Palloni, A., et al. (2020). Second-line treatment in advanced biliary tract cancer: Today and tomorrow. Anticancer Res. 40 (6), 3013–3030. doi:10.21873/anticanres.14282
Rompianesi, G., Di Martino, M., Gordon-Weeks, A., Montalti, R., and Troisi, R. (2021). Liquid biopsy in cholangiocarcinoma: Current status and future perspectives. World J. Gastrointest. Oncol. 13 (5), 332–350. doi:10.4251/wjgo.v13.i5.332
Shao, L., Hou, W., Scharping, N. E., Vendetti, F. P., Srivastava, R., Roy, C. N., et al. (2019). IRF1 inhibits antitumor immunity through the upregulation of PD-L1 in the tumor cell. Cancer Immunol. Res. 7 (8), 1258–1266. doi:10.1158/2326-6066.CIR-18-0711
Song You, F. W., Hu, Q., Li, P., Zhang, C., Yu, Y., Zhang, Y., et al. (2018). Abnormal expression of YEATS4 associates with poor prognosis and promotes cell proliferation of hepatic carcinoma cell by regulation the TCEA1/DDX3 axis. Am. J. Cancer Res. 8 (10), 2076–2087.
Stuart, T., Butler, A., Hoffman, P., Hafemeister, C., Papalexi, E., Mauck, W. M., et al. (2019). Comprehensive integration of single-cell data. Cell 177 (7), 1888–1902. doi:10.1016/j.cell.2019.05.031
Tang, T., Huang, X., Zhang, G., Hong, Z., Bai, X., and Liang, T. (2021). Advantages of targeting the tumor immune microenvironment over blocking immune checkpoint in cancer immunotherapy. Signal Transduct. Target. Ther. 6 (1), 72. doi:10.1038/s41392-020-00449-4
Tirosh, I., Izar, B., Prakadan, S. M., Wadsworth, M. H., Treacy, D., Trombetta, J. J., et al. (2016). Dissecting the multicellular ecosystem of metastatic melanoma by single-cell RNA-seq. Science 352 (6282), 189–196. doi:10.1126/science.aad0501
Tohonen, V., Katayama, S., Vesterlund, L., Jouhilahti, E. M., Sheikhi, M., Madissoon, E., et al. (2015). Novel PRD-like homeodomain transcription factors and retrotransposon elements in early human development. Nat. Commun. 6, 8207. doi:10.1038/ncomms9207
Wang, H., Yan, C., and Ye, H. (2020). Overexpression of MUC16 predicts favourable prognosis in MUC16-mutant cervical cancer related to immune response. Exp. Ther. Med. 20 (2), 1725–1733. doi:10.3892/etm.2020.8836
Wilkerson, M. D., and Hayes, D. N. (2010). ConsensusClusterPlus: A class discovery tool with confidence assessments and item tracking. Bioinformatics 26 (12), 1572–1573. doi:10.1093/bioinformatics/btq170
Woo, H. G., Park, E. S., Cheon, J. H., Kim, J. H., Lee, J. S., Park, B. J., et al. (2008). Gene expression-based recurrence prediction of Hepatitis B virus-related human hepatocellular carcinoma. Clin. Cancer Res. 14 (7), 2056–2064. doi:10.1158/1078-0432.CCR-07-1473
Yang, R., Sun, L., Li, C. F., Wang, Y. H., Yao, J., Li, H., et al. (2021). Galectin-9 interacts with PD-1 and TIM-3 to regulate T cell death and is a target for cancer immunotherapy. Nat. Commun. 12 (1), 832. doi:10.1038/s41467-021-21099-2
Yao, W.-Y., and Gong, W. (2021). Immunotherapy in cholangiocarcinoma: From concept to clinical trials. Surg. Pract. Sci. 5, 100028. doi:10.1016/j.sipas.2021.100028
Yoshihara, K., Shahmoradgoli, M., Martinez, E., Vegesna, R., Kim, H., Torres-Garcia, W., et al. (2013). Inferring tumour purity and stromal and immune cell admixture from expression data. Nat. Commun. 4, 2612. doi:10.1038/ncomms3612
Zakrzewska, A., Cui, C., Stockhammer, O. W., Benard, E. L., Spaink, H. P., and Meijer, A. H. (2010). Macrophage-specific gene functions in Spi1-directed innate immunity. Blood 116 (3), e1–e11. doi:10.1182/blood-2010-01-262873
Zeng, F., Li, G., Liu, X., Zhang, K., Huang, H., Jiang, T., et al. (2021). Plasminogen activator urokinase receptor implies immunosuppressive features and acts as an unfavorable prognostic biomarker in glioma. Oncologist 26 (8), e1460–e1469. doi:10.1002/onco.13750
Keywords: cell communication, single cell RNAseq, transcript factor, cholangiocarcinoma, immunotherapy
Citation: Wang T, Xu C, Xu D, Yang X, Liu Y, Li X, Li Z, Dang N, Lv Y, Zhang Z, Li L and Ye K (2022) Integrating cell interaction with transcription factors to obtain a robust gene panel for prognostic prediction and therapies in cholangiocarcinoma. Front. Genet. 13:981145. doi: 10.3389/fgene.2022.981145
Received: 29 June 2022; Accepted: 24 October 2022;
Published: 30 November 2022.
Edited by:
Ehsan Nazemalhosseini-Mojarad, Shahid Beheshti University of Medical Sciences, IranReviewed by:
Emil Bulatov, Kazan Federal University, RussiaCopyright © 2022 Wang, Xu, Xu, Yang, Liu, Li, Li, Dang, Lv, Zhang, Li and Ye. This is an open-access article distributed under the terms of the Creative Commons Attribution License (CC BY). The use, distribution or reproduction in other forums is permitted, provided the original author(s) and the copyright owner(s) are credited and that the original publication in this journal is cited, in accordance with accepted academic practice. No use, distribution or reproduction is permitted which does not comply with these terms.
*Correspondence: Kai Ye, a2FpeWVAeGp0dS5lZHUuY24=
Disclaimer: All claims expressed in this article are solely those of the authors and do not necessarily represent those of their affiliated organizations, or those of the publisher, the editors and the reviewers. Any product that may be evaluated in this article or claim that may be made by its manufacturer is not guaranteed or endorsed by the publisher.
Research integrity at Frontiers
Learn more about the work of our research integrity team to safeguard the quality of each article we publish.