 Yan Zhao1
 Di Wang1
 Cheng-Yu Zhang1
 Yan-Ju Liu1Xiao-Hui Wang1Meng-Ying Shi1
 Wei Wang2Xu-Liang Shen3*
 Xiao-Feng He4,5*
- 1Heping Hospital Affiliated to Changzhi Medical College, Changzhi, Shanxi, China
- 2Beijing Zhendong Guangming Pharmaceutical Research Institute, Beijing, China
- 3Department of Hematology, Heping Hospital Affiliated to Changzhi Medical College, Changzhi, Shanxi, China
- 4Institute of Evidence-Based Medicine, Heping Hospital Affiliated to Changzhi Medical College, Changzhi, Shanxi, China
- 5Department of Epidemiology, School of Public Health to Southern Medical University, Guangzhou, China
Background: Several meta-analyses have analyzed the association of GSTM1 present/null, GSTT1 present/null, and GSTP1 IIe105Val polymorphisms with leukemia risk. However, the results of these meta-analyses have been conflicting. Moreover, they did not evaluate the combined effects of the three aforementioned gene polymorphisms. Furthermore, they did not appraise the credibility of the positive results. Finally, many new studies have been published. Therefore, an updated meta-analysis was conducted.
Objectives: To further explore the relationship of the three aforementioned gene polymorphisms with leukemia risk.
Methods: The crude odds ratios (ORs) and 95% confidence intervals (CIs) were applied to evaluate the association of the individual and combined effects of the three aforementioned genes. Moreover, the false-positive report probability (FPRP) and Bayesian false discovery probability (BFDP) were applied to verify the credibility of these statistically significant associations.
Results: Overall, the individual GSTM1, GSTT1, and GSTP1 IIe105Val polymorphisms added leukemia risk. On combining GSTM1 and GSTT1, GSTM1 and GSTP1, and GSTT1 and GSTP1 polymorphisms, positive results were also observed. However, no significant association was observed between the combined effects of these three polymorphisms with leukemia risk in the overall analysis. Moreover, when only selecting Hardy–Weinberg equilibrium (HWE) and medium- and high-quality studies, we came to similar results. However, when the FPRP and BFDP values were applied to evaluate the credibility of positive results, the significant association was only observed for the GSTT1 null genotype with leukemia risk in Asians (BFDP = 0.367, FPRP = 0.009).
Conclusion: This study strongly suggests a significant increase in the risk of leukemia in Asians for the GSTT1 null genotype.
Introduction
Leukemia is a cancer of hematology, characterized by abnormal hematopoietic function and malignant cloning of white blood cells. Leukemia includes acute myeloid leukemia (AML), acute lymphoblastic leukemia (ALL), chronic myeloid leukemia (CML), and chronic lymphoblastic leukemia (CLL) (Ouerhani et al., 2011). Over the past few decades, we have made giant progress in the early diagnosis of diseases and treatment, yet the number of new cases of leukemia are still increasing, and the death cases also continue to increase. Therefore, leukemia has become one huge threat to human health (Ferlay et al., 2015). As we all know, leukemia is deemed to be a complex disease, which is determined by hereditary and environmental factors (Arruda et al., 2001; Krajinovic et al., 2001). Although previous studies showed that chemicals, ionizing radiation, and viral infections were the potential pathogenic factors of leukemia (Maia Rda and Wünsch Filho, 2013; Schüz and Erdmann, 2016), there were great individual differences in disease susceptibility when these patients were exposed to the aforementioned carcinogenic agents. Therefore, research studies on hereditary factors that affect leukemia may improve our further understanding of the pathogenesis of leukemia; in addition, they might provide new evidence for the treatment of leukemia.
Glutathione S-transferase (GST) is a kind of phase II enzyme which includes M1, P1, and T1; the main functions of the three aforementioned genes were the metabolism of xenobiotics, reactive oxygen species, and carcinogens for detoxification and metabolism (Strange et al., 2001). A partial gene deletion of GSTM1 and GSTT1 (null genotypes) can result in the complete absence of GSTM1 and GSTT1 enzyme activities; the former is located on chromosome 1 (1p13.3) and the latter is situated at chromosome 22 (22q11.2) (Pearson et al., 1993; Webb et al., 1996; Strange and Fryer, 1999). GSTP1 gene polymorphism is a single-nucleotide polymorphism, whose polymorphism lies in exon 5 codon 105, when substitution of A with G leads to change in isoleucine (IIe) to valine (Val), thereby giving rise to decreased enzymatic activity (Harries et al., 1997; Ryberg et al., 1997). Previous research studies have indicated that the complete deletion of GSTM1, GSTT1, or GSTP1 polymorphisms can bring about diminished gene expression and enzymatic activity (Strange et al., 1998; Strange et al., 2001; Hollman et al., 2016). The GSTM1 and GSTT1 showed a high degree of polymorphism, one of the polymorphisms being the entire deletion of the gene that results in the lapse of enzymatic activity (Alves et al., 2002).
Several meta-analyses analyzed the association of GSTM1 present/null, GSTT1 present/null, and GSTP1 IIe105Val polymorphisms with leukemia risk. However, results of these meta-analyses were conflicting. Moreover, they did not evaluate the combined effects of the three aforementioned gene polymorphisms. Furthermore, they did not appraise the credibility of the positive results. Finally, many new studies have been published. Therefore, an updated meta-analysis was conducted.
Materials and methods
Search strategy
Five databases including PubMed, Embase, Web of Science, CNKI, and WanFang were applied to search the literature (deadline, 26 May 2022). The following retrieval strategy was employed: (glutathione S-transferase M1 OR GSTM1 OR glutathione S-transferase T1 OR GSTT1 OR glutathione S-transferase P1 OR GSTP1) AND (polymorphism OR genotype OR mutation OR variant OR allele) AND (leukemia OR leukaemia). Furthermore, if necessary, we contacted the corresponding authors by e-mail.
Inclusion and exclusion criteria
The studies that met the following criteria were included: 1) case-control or cohort study, 2) genotype data or odds ratio (OR) with 95% confidence interval (CI) provided, and 3) investigation of the association of the three aforementioned gene polymorphisms with the risk of leukemia. Studies such as overlapping data, case reports, editorials, reviews, letters, and meta-analyses were excluded.
Data extraction and quality assessment
Information was extracted and checked by two researchers from all selected studies. Any disagreement was solved through discussion. Extracted information in shown in Supplementary Tables S1–S3. Quality assessment was conducted by two authors independently (Supplementary Table S4). For GSTM1 and GSTT1 null genotypes, we considered studies that scored ≥10 as high quality; for GSTP1 IIe105Val, studies scoring ≥12 were deemed as high quality.
Statistical analysis
We used crude ORs and 95% CIs to estimate the associations between GST (M1, T1, and P1 IIe105Val) polymorphisms and leukemia risk. The Q statistic and I2 value were carried out to evaluate heterogeneity (Higgins et al., 2003). Only a random-effect model was used because the pooled results were same when I2 = 0% using random-effect and fixed-effect models (Der Simonian and Laird, 2015). We performed ORs with the corresponding 95% CIs following the genetic models. In GSTM1 and GSTT1 null genotypes, we used null vs. present model to calculate the pooled ORs with their 95% CIs. In GSTP1 IIe105Val, five genetic models were used (Val/Val vs. IIe/IIe, IIe/Val vs. IIe/IIe, Val/Val vs. IIe/IIe + IIe/Val, Val/Val + IIe/Val vs. IIe/IIe, and Val vs. IIe). In the combination of GSTM1 present/null and GSTT1 present/null, we applied the following six genetic models: model 1: M1 present/T1 null vs. M1 present/T1 present, model 2: M1 null/T1 present vs. M1 present/T1 present, model 3: M1 null/T1 null vs. M1 present/T1 present, model 4: All one risk genotypes vs. M1 present/T1 present, model 5: All risk genotypes vs. M1 present/T1 present, and model 6: M1 null/T1 null vs. M1 present/T1 present + M1 present/T1 null + M1 null/T1 present in the analysis of the data. The combination of GSTM1 present/null and GSTP1 IIe105Val was also used for the six genetic models, model 1: M1 null/P1 IIe/IIe vs. M1 present/P1 IIe/IIe, model 2: M1 present/P1 Val* vs. M1 present/P1 IIe/IIe, model 3: (M1 null/P1 IIe/IIe + M1 present/P1 Val*) vs. M1 present/P1 IIe/IIe, model 4: M1 null/P1 Val* vs. M1 present/P1 IIe/IIe, model 5: All risk genotypes vs. M1 present/P1 IIe/IIe, and model 6: M1 null/P1 Val* vs. (M1 present/P1 IIe/IIe + M1 null/P1 IIe/IIe + M1 Present/P1 Val*). There were six genetic models used in the combination of GSTT1 present/null and GSTP1 IIe105Val: model 1: T1 null/P1 IIe/IIe vs. T1 present/P1 IIe/IIe, model 2: T1 present/P1 Val* vs. T1 present/P1 IIe/IIe, model 3: = (T1 null/P1 IIe/IIe + T1 present/P1 Val*) vs. T1 present/P1 IIe/IIe, model 4: T1 null/P1 Val* vs. T1 present/P1 IIe/IIe, model 5: All risk genotypes vs. T1 present/P1 IIe/IIe, and model 6: T1 null/P1 Val* vs. (T1 present/P1 IIe/IIe + T1 null/P1 IIe/IIe + T1 Present/P1 Val*). In the combination of GSTM1 present/null, GSTT1 present/null, and GSTP1 IIe105Val, the following genetic models were employed: model 1: M1 null/T1 present/P1 IIe/IIe vs. M1 present/T1 present/P1 IIe/IIe, model 2: M1 present/T1 null/P1 IIe/IIe vs. M1 present/T1 present/P1 IIe/IIe, model 3: M1 present/T1 present/P1 Val 1 vs. M1 present/T1 present/P1 IIe/IIe, model 4: all one high-risk genotype vs. M1 present/T1 present/P1 IIe/IIe, model 5: M1 null/T1 null/P1 IIe/IIe vs. M1 present/T1 present/P1 IIe/IIe, model 6: M1 null/T1 present/P1 Val 1 vs. M1 present/T1 present/P1 IIe/IIe, model 7: M1 present/T1 null/P1 Val1 vs. M1 present/T1 present/P1 IIe/IIe, model 8: all two high-risk genotype vs. M1 present/T1 present/P1 IIe/IIe, model 9: M1 null/T1 null/P1 Val 1 vs. M1 present/T1 present/P1 IIe/IIe, and model 10: M1 null/T1 null/P1 Val 1 vs. M1 present/T1 present/P1 IIe/IIe + all one high-risk genotype + all two high-risk genotypes. Moreover, a metaregression analysis was used to explore sources of heterogeneity (Baker et al., 2009). Sensitivity analysis was conducted by excluding low-quality and Hardy–Weinberg disequilibrium (HWD) in control studies. The Hardy–Weinberg equilibrium (HWE) was checked using Chi-square goodness-of-fit test, which was deemed as HWE in controls if p ≥ 0.05. Begg’s funnel plot (Begg and Mazumdar, 1994) and Egger’s test (Egger et al., 1997) were carried out to verify publication bias. Furthermore, we applied the FPRP (Wacholder et al., 2004), BFDP (Wakefield, 2007), and Venice criteria (Ioannidis et al., 2008) to appraise the credibility of statistically significant associations. All statistical analyses were performed using Stata 12.0 software in the current study.
Results
Search results and study characteristics
Overall, 91 articles (Supplemental References 1–91) were eligible (Figure 1), and Supplementary Tables S1–S3 show the characteristics and scores of each study. Multiple eligible studies were included in one article. Therefore, there were 98 eligible studies (13,477 leukemia cases and 22,523 controls, Table 1) on the GSTM1 present/null polymorphism, 89 eligible studies (12,357 leukemia cases and 20,636 controls, Table 2) on the GSTT1 present/null polymorphism, 34 studies (5,391 leukemia cases and 8,729 controls, Table 3) on the GSTP1 IIe105Val polymorphism, 25 studies (3,522 leukemia cases and 4,974 controls, Table 4) belonging to the combined effects of the GSTM1 and GSTT1 polymorphisms, six studies (737 leukemia cases and 995 controls, Table 5) describing the combined GSTM1 and GSTP1 effects, five studies (645 leukemia cases and 845 controls, Table 6) on the combined GSTT1 and GSTP1 effects, and seven studies (1,036 leukemia cases and 1,418 controls, Table 7) belonging to the combined effects of the three aforementioned polymorphisms with leukemia risk.
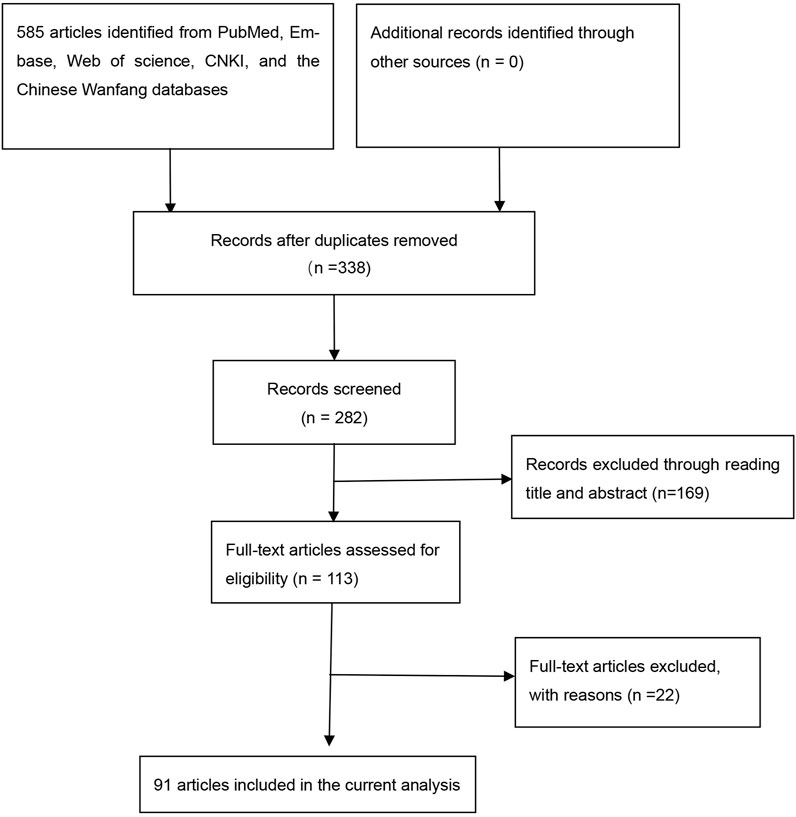
FIGURE 1. Flow diagram for the literature search.
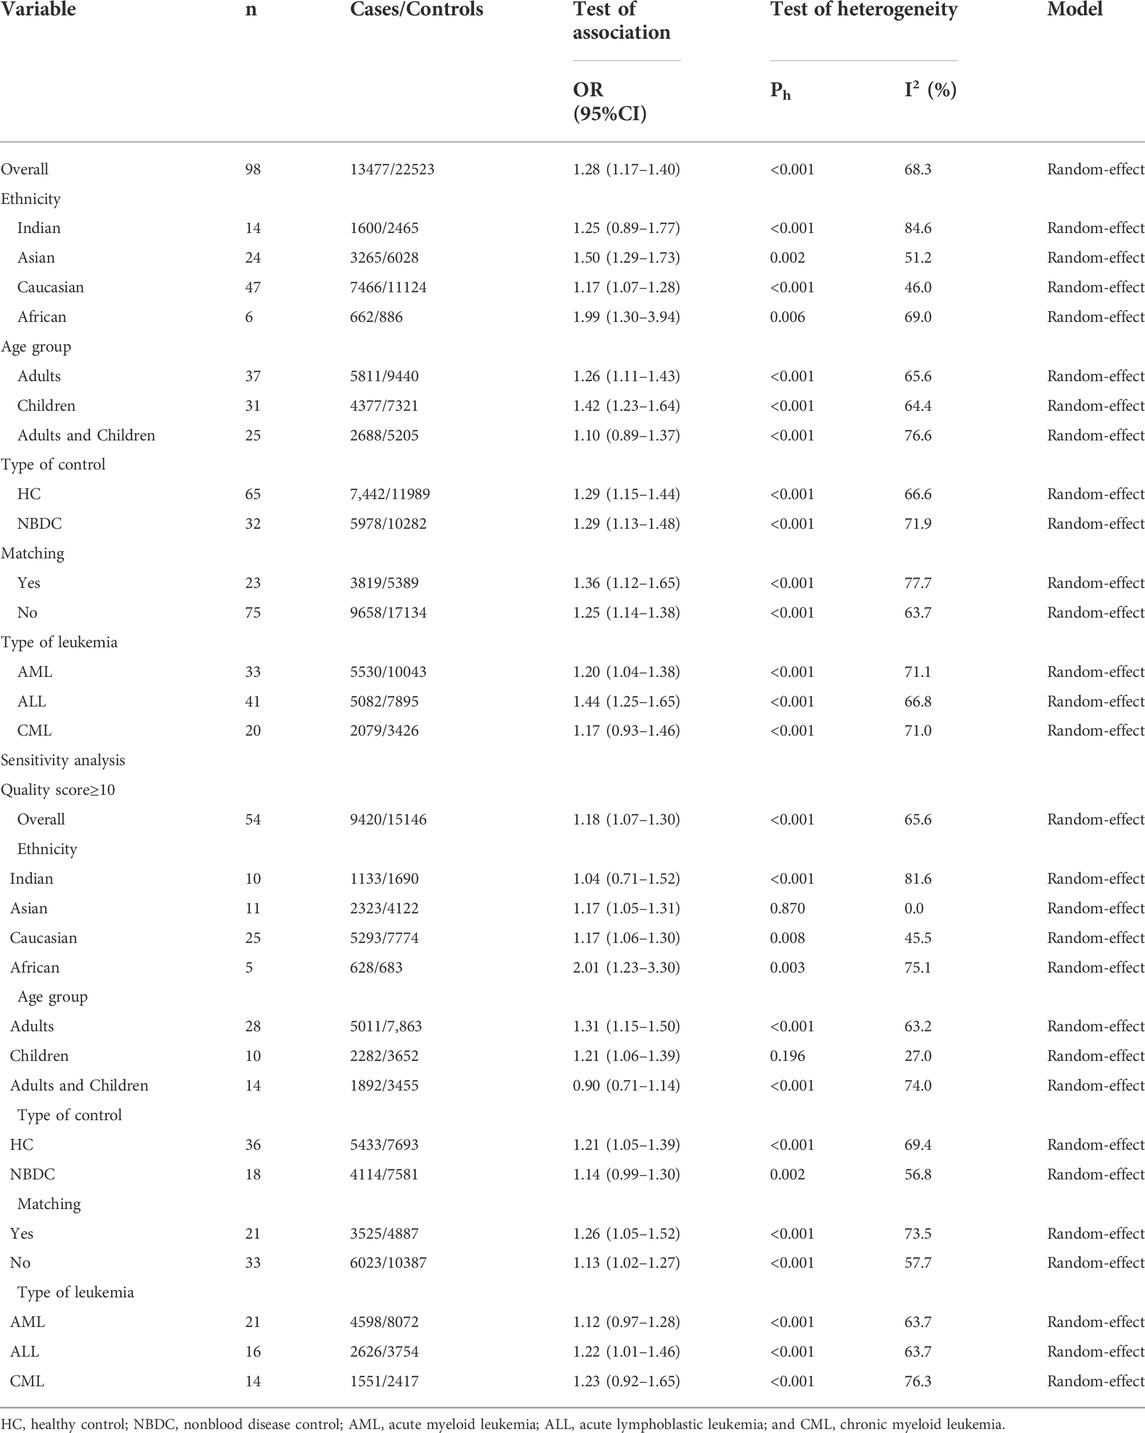
TABLE 1. Meta-analysis of the association of GSTM1 polymorphism with risk of leukemia.
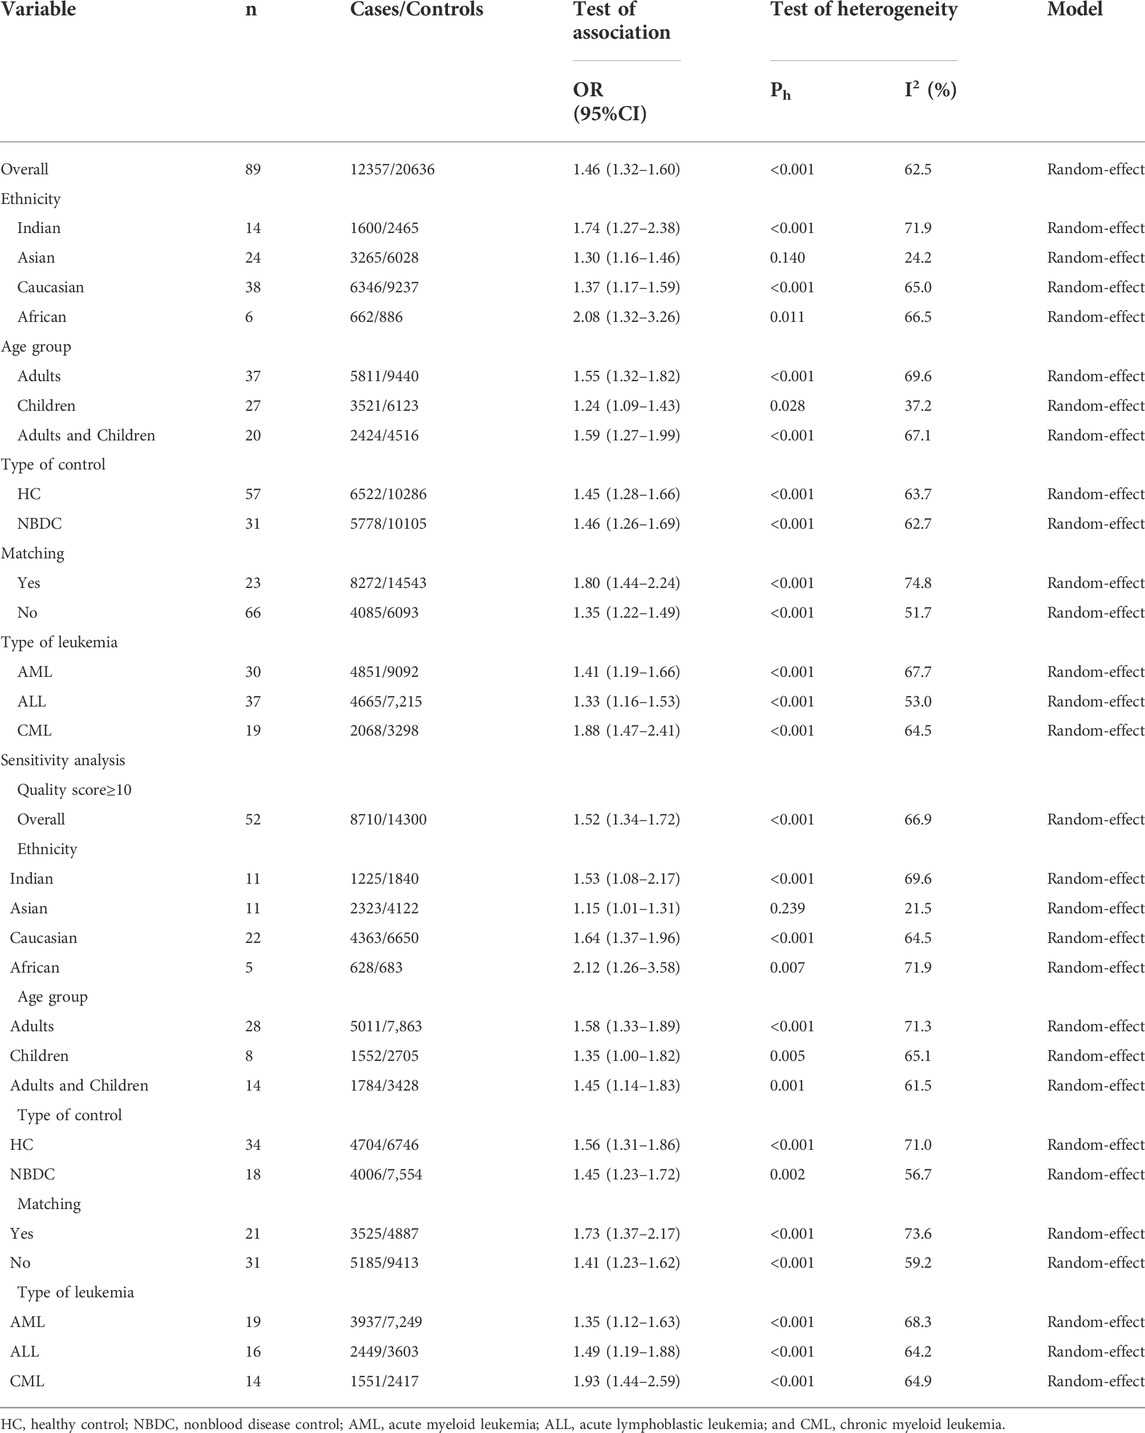
TABLE 2. Meta-analysis of the association of GSTT1 polymorphism with -risk of leukemia.
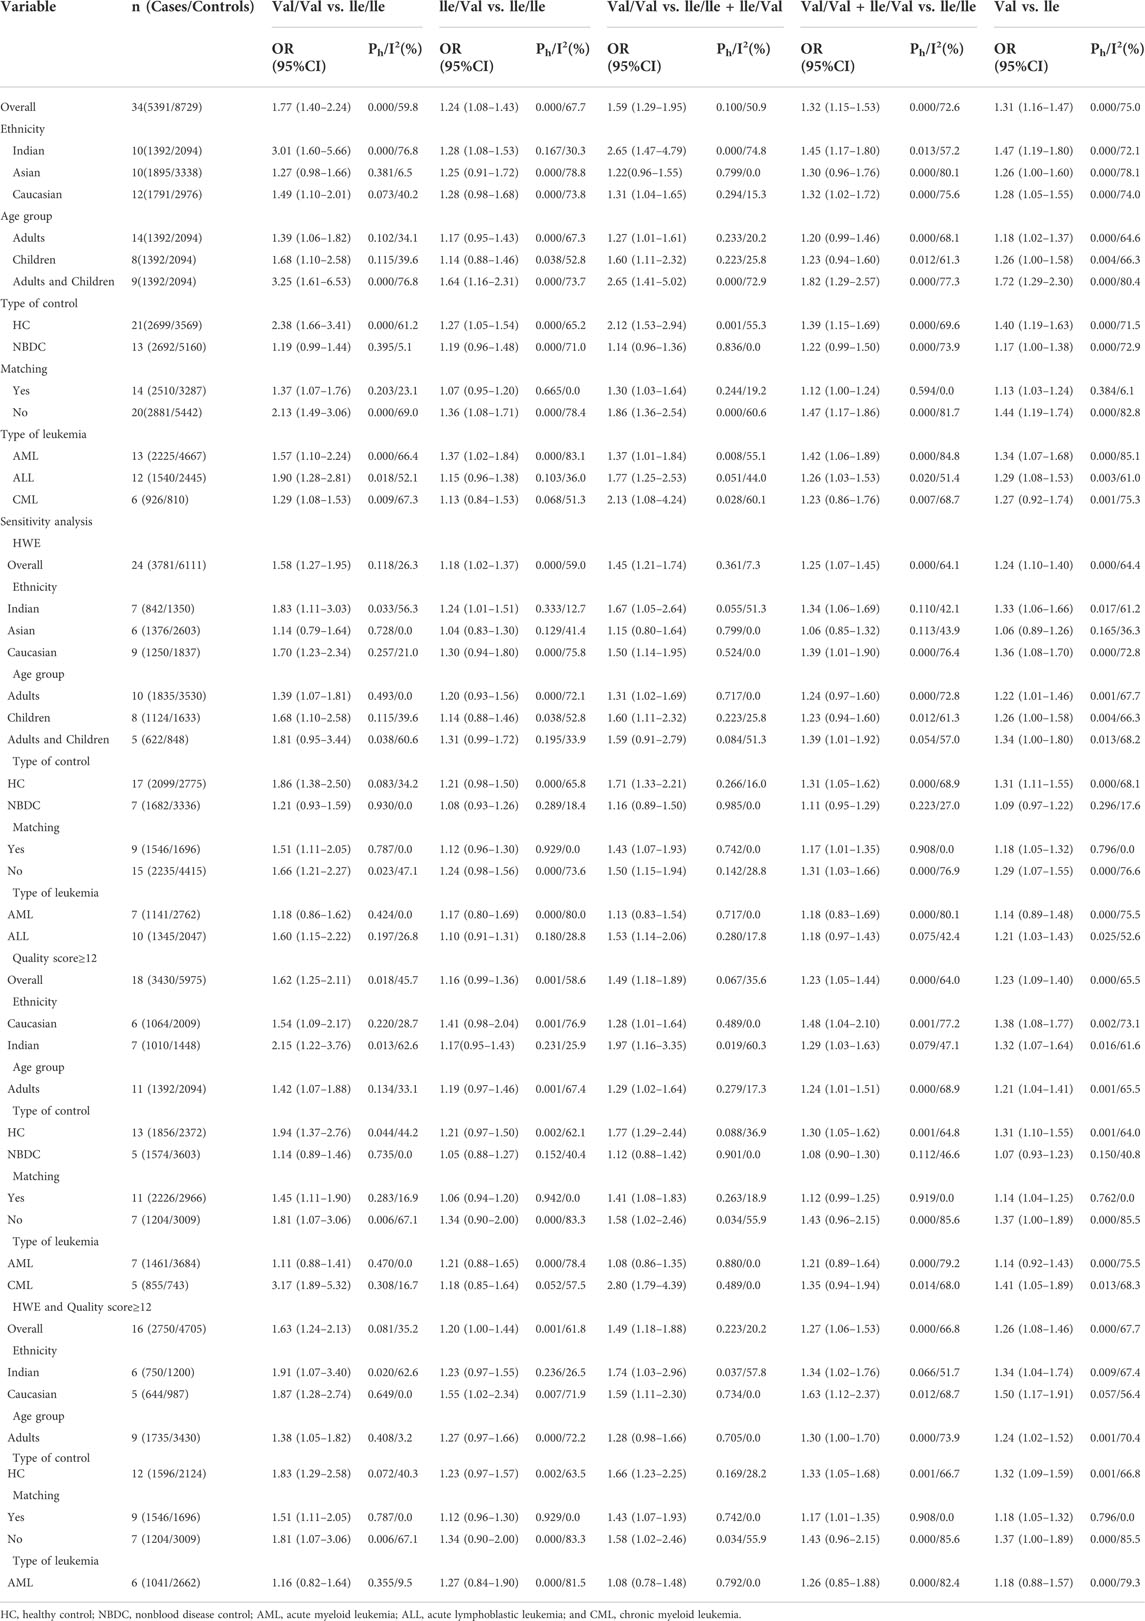
TABLE 3. Meta-analysis of the association of GSTP1 polymorphism with risk of leukemia.
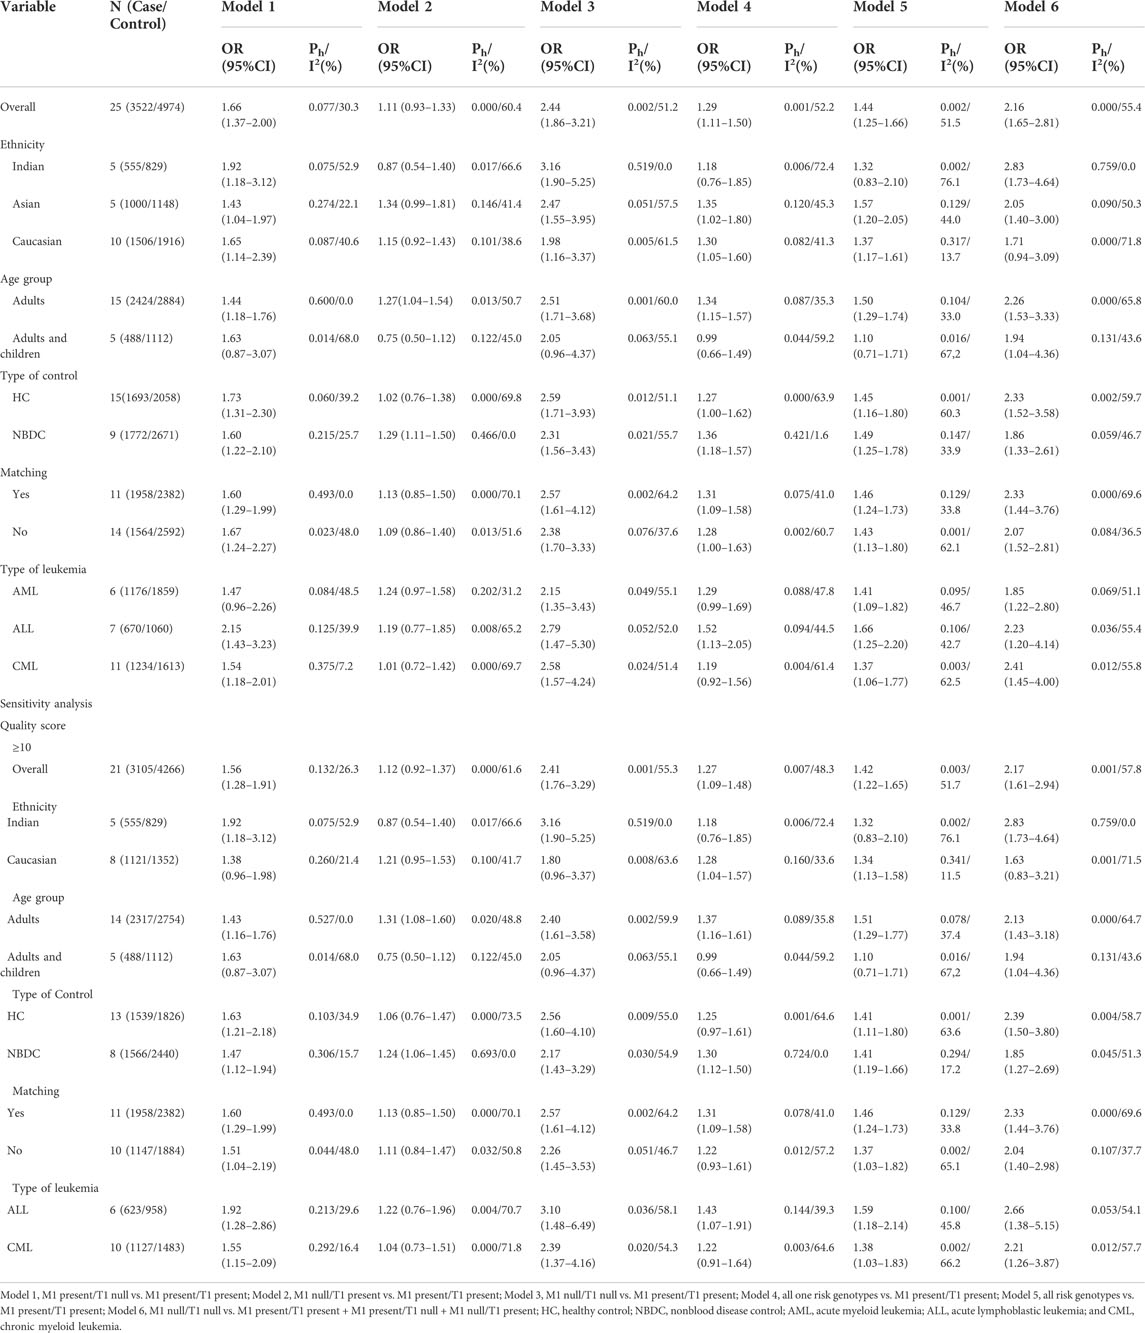
TABLE 4. Meta-analysis of the combined effects of GSTM1 present/null and GSTT1 present/null on leukemia risk.
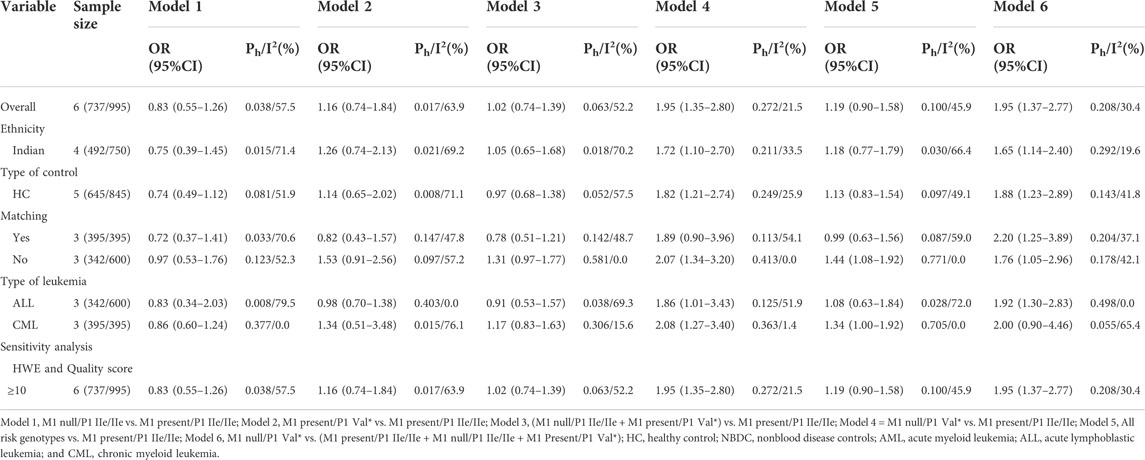
TABLE 5. Meta-analysis of the combined effects of GSTM1 present/null and GSTP1 IIe105Val on leukemia risk.
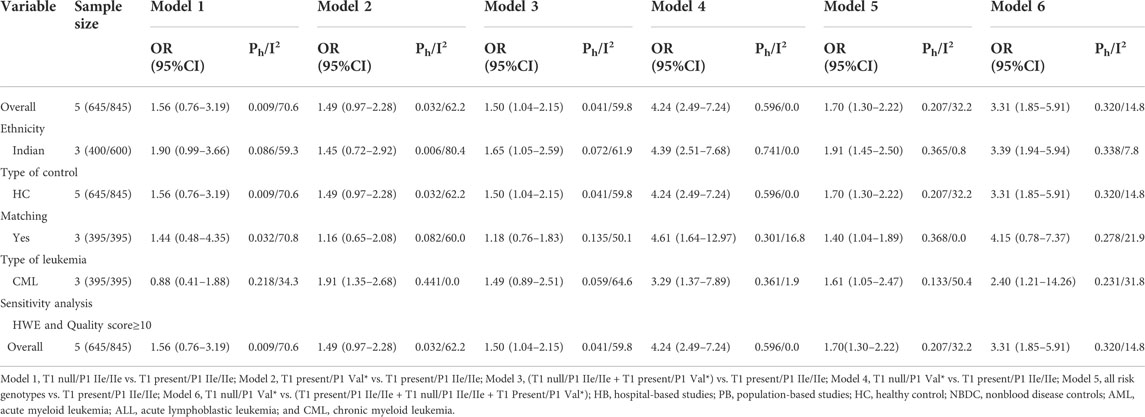
TABLE 6. Meta-analysis of the combined effects of GSTT1 present/null and GSTP1 IIe105Val on leukemia risk.
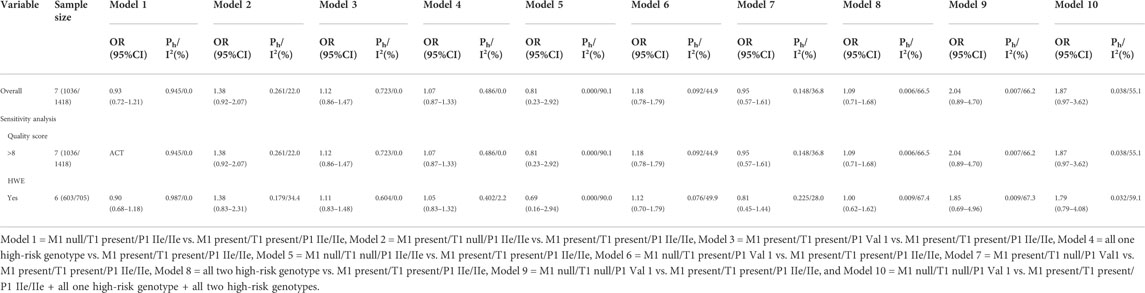
TABLE 7. Meta-analysis of the combined effects of GSTM1 present/null, GSTT1 present/null, and GSTP1 IIe105Val on leukemia risk.
Quantitative synthesis
The GSTM1 null genotype significantly added leukemia risk in the overall analysis (OR = 1.28, 95% CI: 1.17–1.40, Table 1 and Figure 2) of Asians (OR = 1.50, 95% CI: 1.29–1.73), Caucasians (OR = 1.17, 95% CI: 1.07–1.28), and Africans (OR = 1.99, 95% CI: 1.30–3.94). However, it showed that the GSTM1 null genotype did not affect leukemia risk in Indians (OR = 1.25, 95% CI: 0.89–1.77). Moreover, similar association was also found in other subgroup analyses, such as in adult leukemia, child leukemia, AML, ALL, and so on (Table 1).
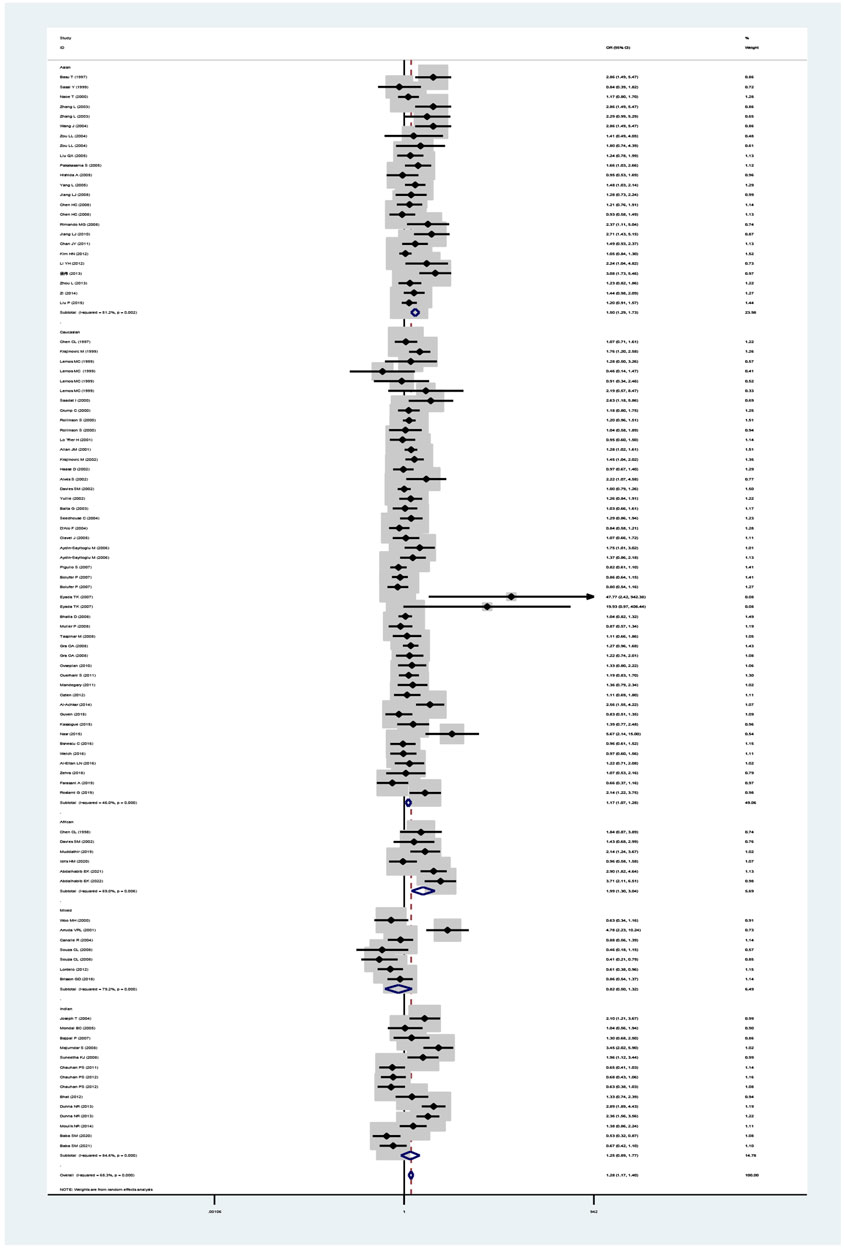
FIGURE 2. Forest plot for the association between GSTM1 polymorphism and leukemia risk in ethnicity subgroup analysis.
The GSTT1 null genotype added leukemia risk in the overall population (OR = 1.46, 95% CI: 1.32–1.60, Table 2 and Figure 3). Moreover, an increased risk of leukemia was also found in Indians (OR = 1.74, 95% CI: 1.27–2.38), Asians (OR = 1.30, 95% CI: 1.16–1.46), Caucasians (OR = 1.37, 95% CI: 1.17–1.59), and Africans (OR = 2.08, 95% CI: 1.32–3.26) (Table 2; Figure 3). Similarly, the significantly increased risk of leukemia was also observed in adult leukemia, child leukemia, AML, ALL, and CML, and so on (Table 2).
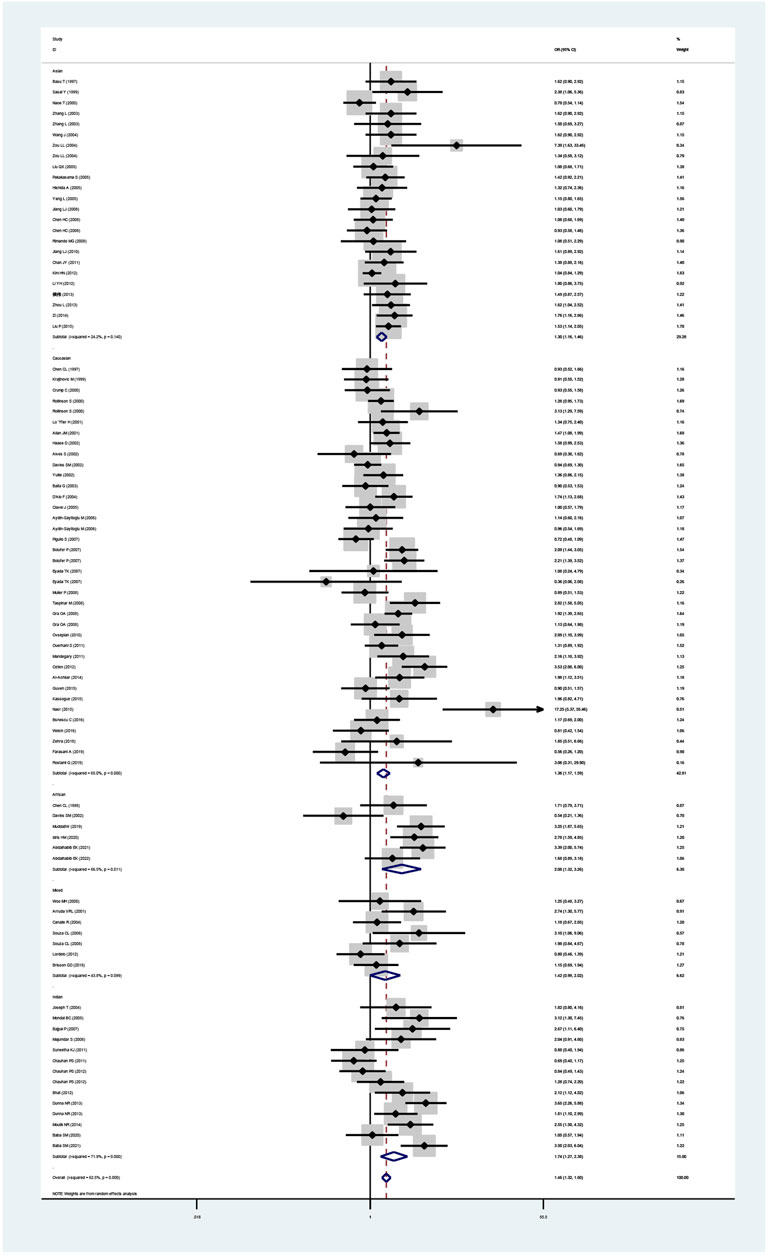
FIGURE 3. Forest plot for the association between GSTT1 polymorphism and leukemia risk in ethnicity subgroup analysis.
The GSTP1 IIe105Val polymorphism yielded a significantly increased leukemia risk in overall population (Val/Val vs. IIe/IIe: OR = 1.77, 95% CI = 1.40–2.24; IIe/Val vs. IIe/IIe: OR = 1.24, 95% CI = 1.08–1.43; Val/Val vs. IIe/IIe + IIe/Val: OR = 1.59, 95% CI = 1.29–1.95; Val/Val + IIe/Val vs. IIe/IIe: OR = 1.32, 95% CI = 1.15–1.53; and Val vs. IIe: OR = 1.31, 95% CI = 1.16–1.47, Table 3 and Figure 4). Moreover, the GSTP1 IIe105Val polymorphism was associated with increased leukemia risk in Indians (Val/Val vs. IIe/IIe: OR = 3.01, 95% CI = 1.60–5.66; IIe/Val vs. IIe/IIe: OR = 1.28, 95% CI = 1.08–1.53; Val/Val vs. IIe/IIe + IIe/Val: OR = 2.65, 95% CI = 1.47–4.79; Val/Val + IIe/Val vs. IIe/IIe: OR = 1.45, 95% CI = 1.17–1.80; and Val vs. IIe: OR = 1.47, 95% CI = 1.19–1.80) and in Caucasians (Val/Val vs. IIe/IIe: OR = 1.49, 95% CI = 1.10–2.01; Val/Val vs. IIe/IIe + IIe/Val: OR = 1.31, 95% CI = 1.04–1.65; Val/Val + IIe/Val vs. IIe/IIe: OR = 1.32, 95% CI = 1.02–1.72; and Val vs. IIe: OR = 1.28, 95% CI = 1.05–1.55). Similarly, the significantly increased risk of leukemia was also observed in adult leukemia, child leukemia, AML, ALL, CML, etc. (Table 3).
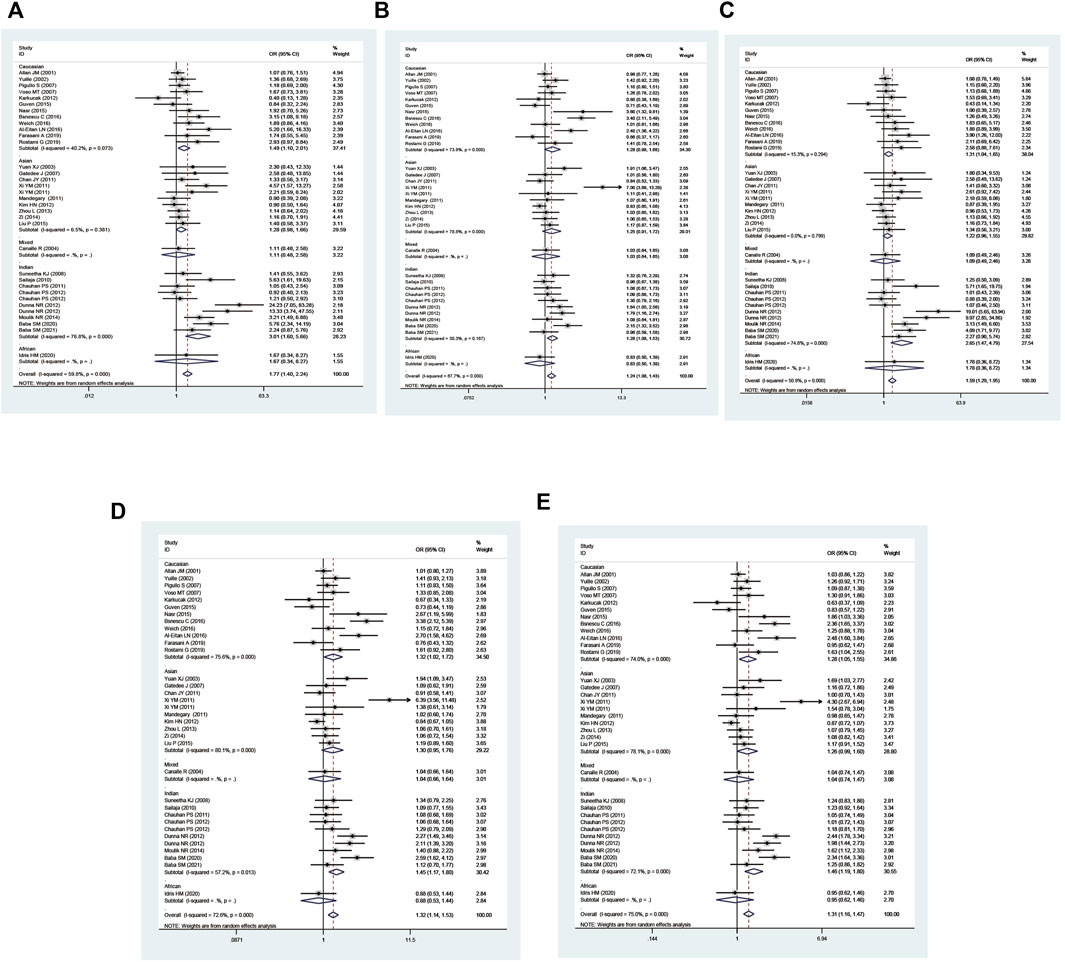
FIGURE 4. Forest plot for the association between GSTP1 polymorphism and leukemia risk in ethnicity subgroup analysis [(A): Val/Val vs. Ile/Ile; (B) Ile/Val vs. Ile/Ile; (C) Val/Val vs. Ile/Ile + Ile/Val; (D) Val/Val + Ile/Val vs. Ile/Ile; and (E) Val vs. Ile].
Combined GSTM1 and GSTT1 null genotypes were found to significantly increase leukemia risk in the overall analysis (M1 present/T1 null vs. M1 present/T1 present: OR = 1.66, 95% CI = 1.37–2.00; M1 null/T1 null vs. M1 present/T1 present: OR = 2.44, 95% CI = 1.86–3.21; all one risk genotypes vs. M1 present/T1 present: OR = 1.29, 95% CI = 1.11–1.50; all risk genotypes vs. M1 present/T1 present: OR = 1.44, 95% CI = 1.25–1.66; and M1 null/T1 null vs. M1 present/T1 present + M1 present/T1 null + M1 null/T1 present: OR = 2.16, 95% CI = 1.65–2.81; Table 4 and Figure 5). Moreover, there was a significantly increased leukemia risk in Indians (M1 present/T1 null vs. M1 present/T1 present: OR = 1.92, 95% CI = 1.18–3.12; M1 null/T1 null vs. M1 present/T1 present: OR = 3.16, 95% CI = 1.90–5.25; M1 null/T1 null vs. M1 present/T1 present + M1 present/T1 null + M1 null/T1 present: OR = 2.83, 95% CI = 1.73–4.64), Asians (M1 present/T1 null vs. M1 present/T1 present: OR = 1.43, 95% CI = 1.04–1.97; M1 null/T1 null vs. M1 present/T1 present: OR = 2.47, 95% CI = 1.55–3.95; all one risk genotypes vs. M1 present/T1 present: OR = 1.35, 95% CI = 1.02–1.80; all risk genotypes vs. M1 present/T1 present: OR = 1.57, 95% CI = 1.20–2.05; M1 null/T1 null vs. M1 present/T1 present + M1 present/T1 null + M1 null/T1 present: OR = 2.05, 95% CI = 1.40–3.00), and Caucasians (M1 present/T1 null vs. M1 present/T1 present: OR = 1.65, 95% CI = 1.14–2.39; M1 null/T1 null vs. M1 present/T1 present: OR = 1.98, 95% CI = 1.16–3.37; all one risk genotypes vs. M1 present/T1 present: OR = 1.30, 95% CI = 1.05–1.60; all risk genotypes vs. M1 present/T1 present: OR = 1.37, 95% CI = 1.17–1.61). Similar results were found in adult leukemia, AML, ALL, CML, and so on (Table 4).
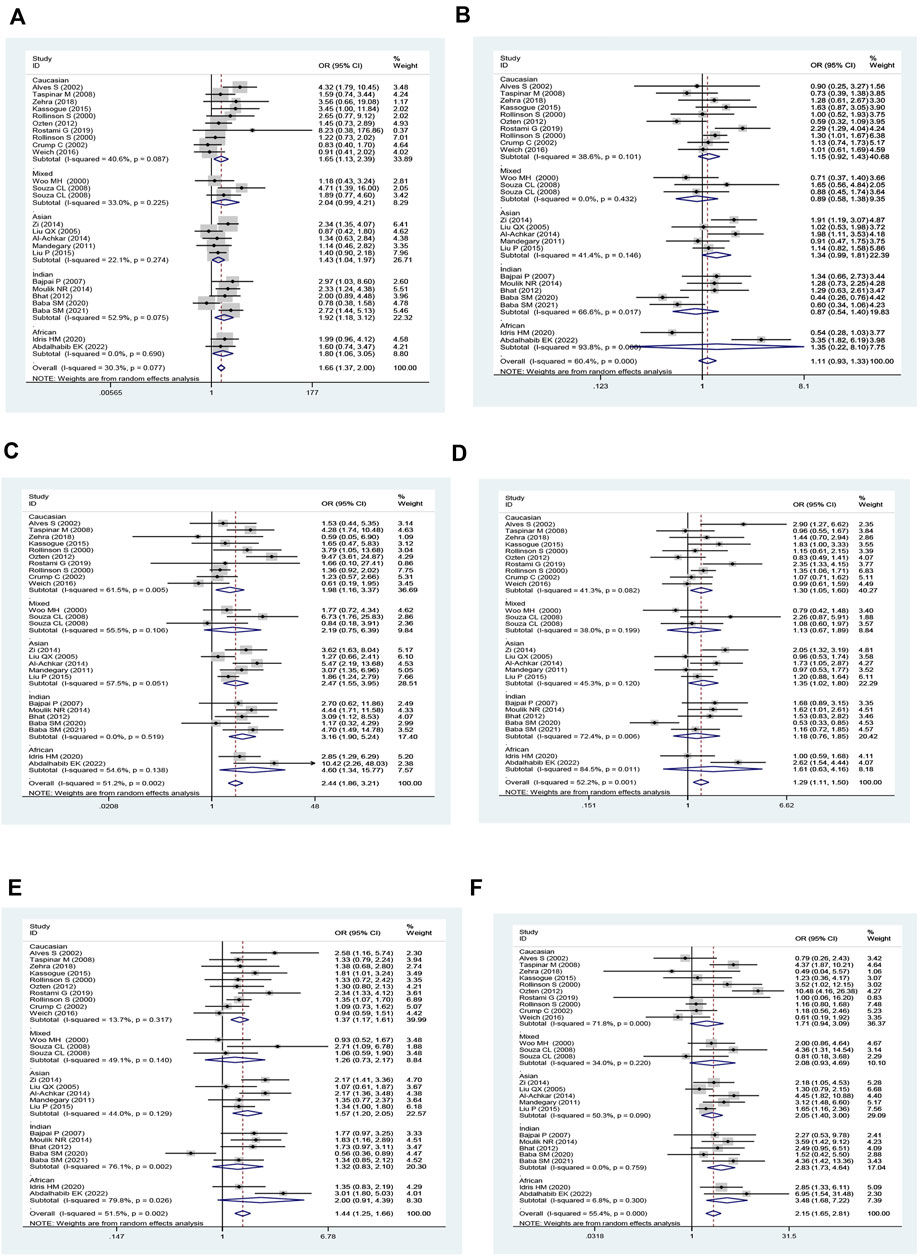
FIGURE 5. Forest plot of the association between combined effects of GSTM1 present/null and GSTT1 present/null polymorphisms and leukemia risk in ethnicity subgroup analysis [(A): Model 1; (B) Model 2; (C) Model 3; (D) Model 4; (E) Model 5; and (F) Model 6].
An increased risk of leukemia was yielded on the combined GSTM1 and GSTP1 polymorphisms (M1 null/P1 Val* vs. M1 present/P1 IIe/IIe: OR = 1.95, 95% CI = 1.35–2.80; M1 null/P1 Val* vs. M1 present/P1 IIe/IIe + M1 null/P1 IIe/IIe + M1 Present/P1 Val*: OR = 1.95, 95% CI = 1.37–2.77; Table 5 and Figure 6) in overall analysis. Moreover, increased leukemia risk was also demonstrated in Indians (M1 null/P1 Val* vs. M1 present/P1 IIe/IIe: OR = 1.72, 95% CI = 1.10–2.70, M1 null/P1 Val* vs. M1 present/P1 IIe/IIe + M1 null/P1 IIe/IIe + M1 Present/P1 Val*: OR = 1.65, 95% CI = 1.14–2.40). Furthermore, a similar connection was also found in ALL, CML, and so on (Table 5).
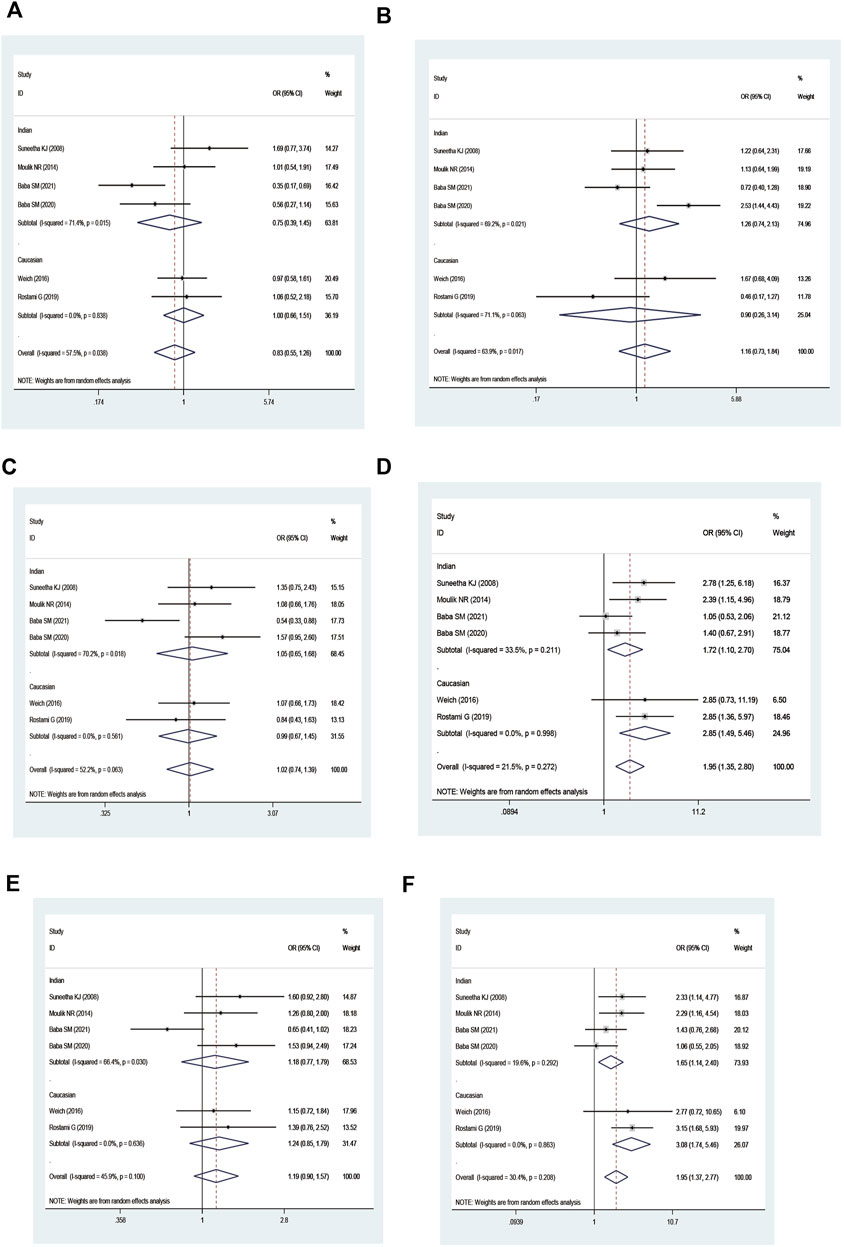
FIGURE 6. Forest plot of the association between combined effects of GSTM1 present/null and GSTP1 11e105Val polymorphisms and leukemia risk in ethnicity subgroup analysis [(A): Model 1; (B) Model 2; (C) Model 3; (D) Model 4; (E) Model 5; and (F) Model 6].
On combining GSTT1 and GSTP1 polymorphisms, there was a strong connection with leukemia risk in the overall analysis ((T1 null/P1 IIe/IIe + T1 present/P1 Val*) vs. T1 present/P1 IIe/IIe: OR = 1.50, 95% CI = 1.04–2.15; T1 null/P1 Val* vs. T1 present/P1 IIe/IIe: OR = 4.24, 95% CI = 2.49–7.24; all risk genotypes vs. T1 present/P1 IIe/IIe: OR = 1.70, 95% CI = 1.30–2.22; and T1 null/P1 Val* vs. (T1 present/P1 IIe/IIe + T1 null/P1 IIe/IIe + T1 Present/P1 Val*): OR = 3.31, 95% CI = 1.85–5.91) and increased risk of leukemia among Indians ((T1 null/P1 IIe/IIe + T1 present/P1 Val*) vs. T1 present/P1 IIe/IIe: OR = 1.65, 95% CI = 1.05–2.59; T1 null/P1 Val* vs. T1 present/P1 IIe/IIe: OR = 4.39, 95% CI = 2.51–7.68; all risk genotypes vs. T1 present/P1 IIe/IIe: OR = 1.91, 95% CI = 1.45–2.50; T1 null/P1 Val* vs. (T1 present/P1 IIe/IIe + T1 null/P1 IIe/IIe + T1 Present/P1 Val*): OR = 3.39, 95% CI = 1.94–5.94; Table 6 and Figure 7).

FIGURE 7. Forest plot of the association between the combined effects of GSTT1 present/null and GSTP1 11e105Val polymorphisms and leukemia risk in ethnicity subgroup analysis [(A): Model 1; (B) Model 2; (C) Model 3; (D) Model 4; (E) Model 5; and (F) Model 6].
No significantly increased leukemia risk was observed in the three combined polymorphisms in the overall populations (Table 7; Figure 8).
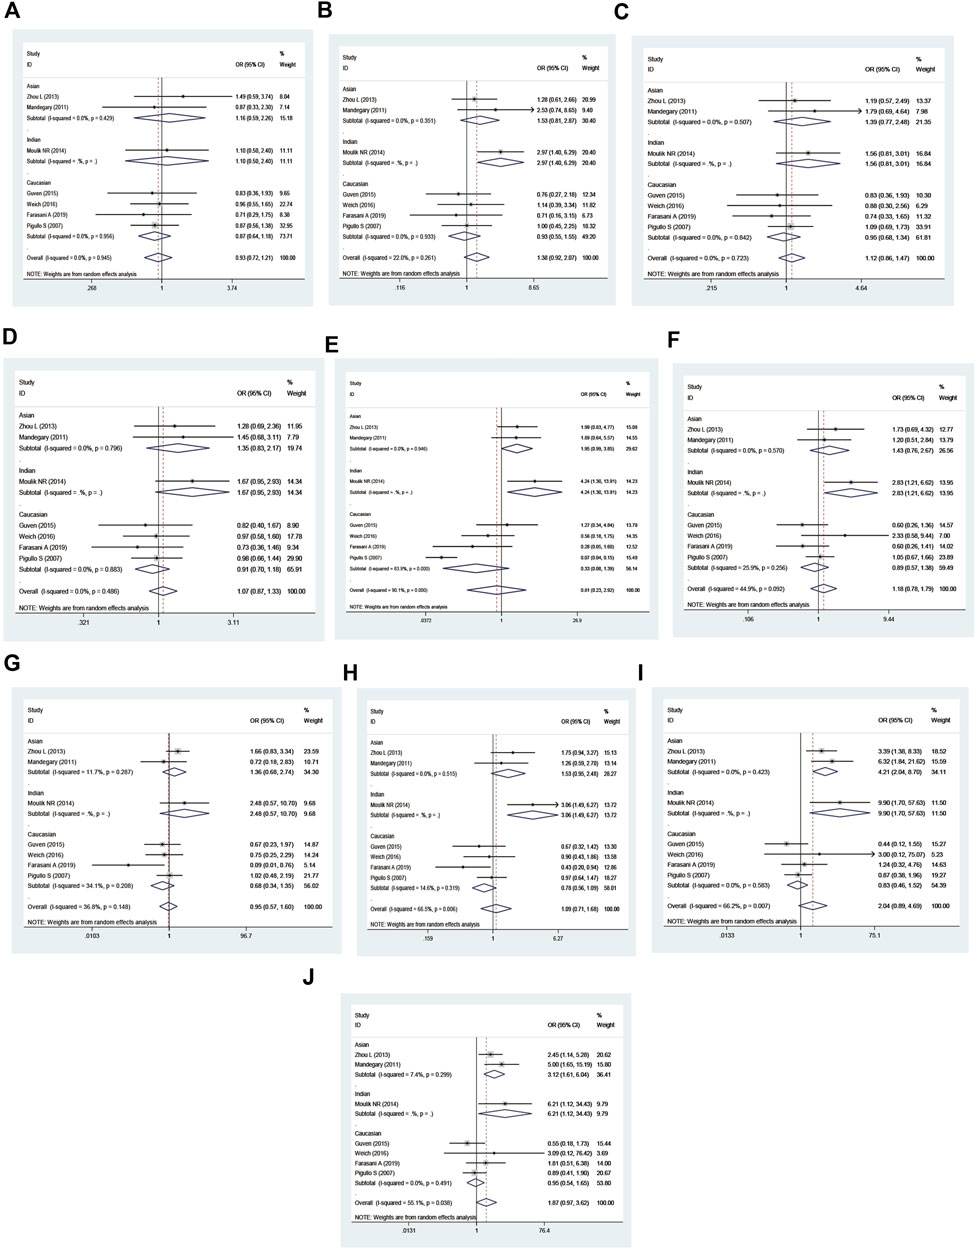
FIGURE 8. Forest plot of the association between the combined effects of GSTM1 present/null, GSTT1 present/null, and GSTP111e105Val polymorphisms and leukemia risk in the ethnicity subgroup analysis [(A): Model 1; (B) Model 2; (C) Model 3; (D) Model 4; (E) Model 5; (F) Model 6; (G) Model 7; (H) Model 8; (I) Model 9; and (J) Model 10].
Heterogeneity and sensitivity analyses
The metaregression analysis showed that race (p = 0.000) and quality score (p = 0.038) were sources of heterogeneity for the GSTM1 null genotype. For GSTP1 IIe105Val polymorphism, in Val/Val vs. IIe/IIe + IIe/Val, type of controls (p = 0.002), matching studies (p = 0.023), and HWE (p = 0.005) were the heterogeneity sources. Similar results were observed in Val/Val vs. lle/lle + lle/Val where type of controls (p = 0.001), matching studies (p = 0.037), and HWE (p = 0.007) were the sources of heterogeneity. For the combined GSTM1 and GSTT1 polymorphisms, the sample size (model 1: p = 0.015) was the source of heterogeneity (Table 8). Three methods were performed to appraise the sensitivity analysis, and all results did not change (Tables 1–7), indicating that the present study was stable.
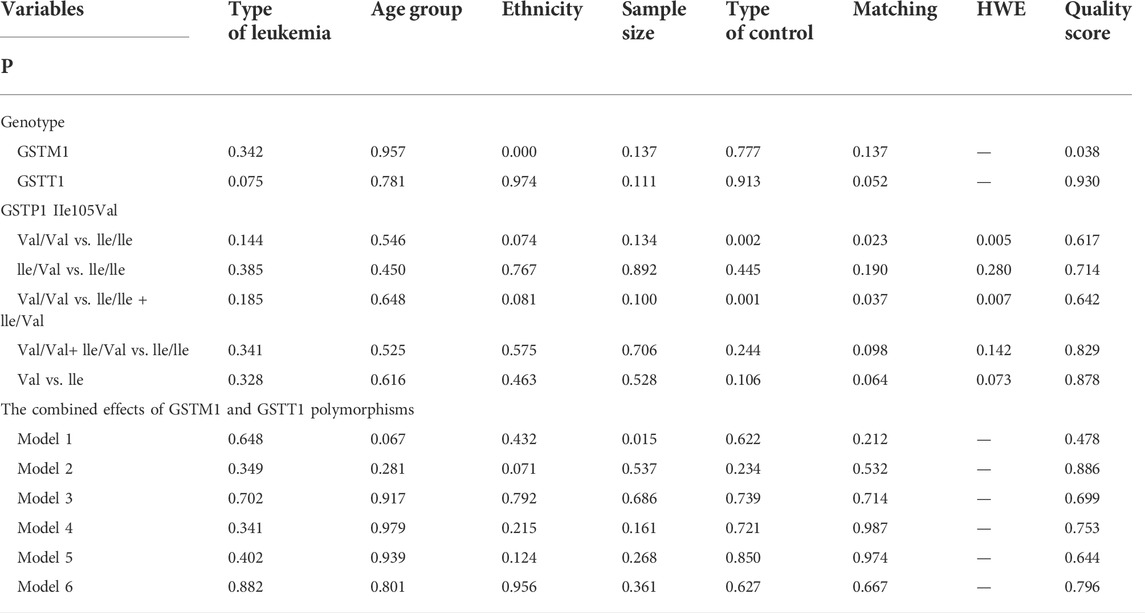
TABLE 8. Heterogeneity analysis in current meta-analysis.
Publication bias
Publication bias was found for the GSTM1 null genotype (p = 0.003, Figure 9), GSTT1 null genotype (p = 0.041, Figure 10), and GSTP1 IIe105Val (Val/Val vs. IIe/IIe: p = 0.001, IIe/Val vs. IIe/IIe: p = 0.030, Val/Val vs. IIe/IIe + IIe/Val: p = 0.020, Val/Val + IIe/Val vs. IIe/IIe: p = 0.022, Val vs. IIe: p = 0.033, Figure 11). Then, we used nonparametric “trim and fill” to adjust publication bias, and the results did not change (data not shown).
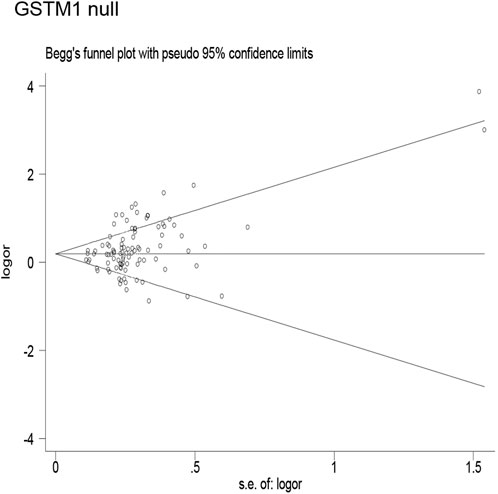
FIGURE 9. Begg’s funnel plot to assess publication bias.
FIGURE 10. Begg’s funnel plot to assess publication bias.
FIGURE 11. Begg’s funnel plot to assess publication bias.
Credibility of the positive results
The “reliable results” was defined as the positive results that met the following criteria (Theodoratou et al., 2012). First, these positive results were observed in at least two of the genetic models (exclude individual GSTM1 and GSTT1 polymorphisms with the risk of leukemia), second, FPRP <0.2 and BFDP <0.8, third, I2 < 50%, and fourth, statistical power >80%. Table 9 lists the credibility of the present meta-analysis on the individual and the composite effects of GSTM1, GSTT1, and GSTP1 IIe105Val polymorphisms with the risk of leukemia. Only the GSTT1 null genotype with leukemia risk in Asians was considered as “positive” results (OR = 1.30, 95% CI = 1.16–1.46, I2 = 24.2%, statistical power = 0.992, FPRP = 0.009, and BFDP = 0.367). All other important connections were regarded as less-credible results, also shown in Table 9.
TABLE 9. Credibility of the current meta-analysis.
Discussion
Leukemia is characterized by abnormal hematopoietic function and malignant cloning of white blood cells (Ouerhani et al., 2011). Gene polymorphisms play a significant role in the development of leukemia, and GST null has been studied by many scholars. Studies demonstrated that complete deletion of GSTM1, GSTT1, or GSTP1 polymorphisms brought about diminished gene expression and enzymatic activity (Strange et al., 1998; Strange et al., 2001; Hollman et al., 2016). Thus, it is significant to study the connection between GST polymorphisms and leukemia risk. Many studies have analyzed the roles of M1, T1, and P1 polymorphisms in leukemia risk. Regrettably, no reliable testimony has been obtained to show whether there is an association between them. This may be due to heterogeneities such as ethnicity, small sample size, matching, type of leukemia, etc. Therefore, an updated meta-analysis was generated to explore these issues. At this point, totally 91 articles were finally selected to provide proof for the association between GST polymorphisms and leukemia risk.
Overall, the present study showed that the GSTM1, GSTT1, and GSTP1 polymorphisms significantly added the risk of leukemia in the overall and several subgroups. Moreover, with the combined GSTM1 and GSTT1, GSTM1 and GSTP1, and GSTT1 and GSTP1 polymorphisms, there were six gene models to explore the association with leukemia risk, and positive results were observed in partial gene models. However, there was no significant contact between the composite effects of these three polymorphisms with leukemia in overall analysis. Furthermore, in sensitivity analysis, when selecting Hardy–Weinberg equilibrium (HWE) and medium and high-quality studies, we had come to a similar conclusion. Finally, in view of the quantities of genomic data being produced currently, we used a more exact Bayesian measure of false-positive found in genetic epidemiological studies in the present study. Using FPRP and BFDP to correct the positive results, in all of these positive results we found previously, only the association between GSTT1 null and leukemia risk was watched in ethnicity (BFDP = 0.367, FPRP = 0.009). Our results indicated that the false-positive associations were common between SNP and disease risk. Moreover, these results further confirmed that the occurrence of leukemia was the result of multiple genes.
Thirteen previous meta-analyses analyzed the links between GSTM1, GSTT1, and GSTP1 polymorphisms and the risk of leukemia. Tang et al. (2014), Ye and Song (2005), Wang et al. (2019), Zhang et al. (2017), Das et al. (2009), and He et al. (2014) discussed the association between GSTM1 and GSTT1 null genotypes and the risk of leukemia, and their results suggested that there was a significant association between GSTM1 and GSTT1 polymorphisms and leukemia risk. The studies of Ma et al. (2014) and Tang et al. (2013) showed that GSTM1 null genotypes increased the risk of acute leukemia. The results of Moulik et al. (2014) demonstrated that there was a significant connection between GSTP1 polymorphism with the risk of leukemia; however, Huang et al. (2013) discussed the association between GSTP1 polymorphism and the risk of leukemia, and the results showed that there was no significant connection. The number of studies and sample sizes in the current study were larger than the published meta-analyses. When comparing to the present meta-analysis, previous studies had several defects. First, none of the previous studies performed quality assessments. Second, HWE was not reported in any published meta-analysis. Third, all previous meta-analyses did not adjust the positive results for multiple comparisons, and only five previous meta-analyses (Ye and Song, 2005; Huang et al., 2013; Tang et al., 2013; Tang et al., 2014; Zhang et al., 2017) conducted subgroup analysis. Fourth, there were no published meta-analyses that performed sensitivity analysis. Moreover, previous meta-analyses had a small sample size; most eligible studies were not assessed for quality assessment; and the reliability of positive results was not evaluated using FPRP, BFDP, and Venice criteria. In addition, they failed to establish a more complete genetic model. Thus, their meta-analyses might have lower credibility.
The current meta-analysis had some advantages over previously published meta-analyses. 1) We explored the credibility by applying the Venice criteria, FPRP, and BFDP. 2) The qualified studies were evaluated for quality. 3) The sample size was larger and the data collected were more detailed over the previous meta-analyses. 4) We conducted more subunit analyses, such as ethnicity, age group, type of control, matching or not, type of leukemia, quality score, and HWE. 5) We established a more complete genetic model. 6) Our study is the first one to explore the combined effects of GSTM1, GSTT1, and GSTP1 polymorphisms with leukemia risk. Nonetheless, there are still some potential limitations for this current study. First, in this study, we only studied published research studies, and as we all know, the positive results are more likely to be published than the negative ones. Second, the mechanism of leading to leukemia is greatly sophisticated, and thus a single-gene mutation is not likely to generate remarkably to its development. Third, no consideration was given to if the genotype distribution of GSTM1 and GSTT1 polymorphisms in control group was in HWE because we could not calculate the HWE on these two genes. Fourth, the heterogeneity of GSTM1, GSTT1, and GSTP1 was large; therefore, the random-effect model was selected, and after subgroup and sensitivity analysis, no source of heterogeneity was found. Hence, the current meta-analysis with a large sample size and enough subgroups will be conducive to confirm our discoveries.
This meta-analysis strongly suggests that only a minority of meaningful associations are credible results. Hence, larger-scale investigations of this topic should be performed in the future to verify or rebut our findings.
Data availability statement
The original contributions presented in the study are included in the article/Supplementary Materials, further inquiries can be directed to the corresponding authors.
Author contributions
YZ: research design and performance, data collection, data analysis, and manuscript-writing; DW and C-YZ: data collection; Y-JL, X-HW, M-YS, and WW: data recheck; and X-LS and X-FH: research design and manuscript review.
Acknowledgments
We would like to sincerely thank the authors of the original research studies included in this study.
Conflict of interest
Author WW was employed by the company Beijing Zhendong Guangming Pharmaceutical Research Institute.
The remaining authors declare that the research was conducted in the absence of any commercial or financial relationships that could be construed as a potential conflict of interest.
Publisher’s note
All claims expressed in this article are solely those of the authors and do not necessarily represent those of their affiliated organizations, or those of the publisher, the editors, and the reviewers. Any product that may be evaluated in this article, or claim that may be made by its manufacturer, is not guaranteed or endorsed by the publisher.
Supplementary material
The Supplementary Material for this article can be found online at: https://www.frontiersin.org/articles/10.3389/fgene.2022.976673/full#supplementary-material
Abbreviations
GSTs, glutathione S-transferases; GSTM1, glutathione S-transferase M1; GSTT1, glutathione S-transferase T1; GSTP1, glutathione S-transferase P1; AML, acute myeloid leukemia; ALL, acute lymphoblastic leukemia; CML, chronic myeloid leukemia; CLL, chronic lymphoblastic leukemia; HC, healthy controls; NBDC, Nonblood disease controls; BFDP, Bayesian false discovery probability; FPRP, false-positive report probability; HWE, Hardy–Weinberg equilibrium; ORs, odds ratios; CIs, confidence intervals.
References
Alves, S., Amorim, A., Ferreira, F., Norton, L., and Prata, M. J. (2002)., 16. PubMed, 15651565–15651567. doi:10.1038/sj.leu.2402543The GSTM1 and GSTT1 genetic polymorphisms and susceptibility to acute lymphoblastic leukemia in children from north PortugalLeukemia
Arruda, V. R., Lima, C. S. P., Grignoli, C. R. E., de Melo, M. B., Lorand-Metze, I., Alberto, F. L., et al. (2001). Increased risk for acute myeloid leukaemia in individuals with glutathione S-transferase mu 1 (GSTM1) and theta 1 (GSTT1) gene defects. Eur. J. Haematol. 66, 383–388. doi:10.1034/j.1600-0609.2001.066006383.x
Baker, W. L., White, C. M., Cappelleri, J. C., Kluger, J., Coleman, C. I., and Health, O (2009). Understanding heterogeneity in meta-analysis: The role of meta-regression. Int. J. Clin. Pract. 63 (10), 1426–1434. doi:10.1111/j.1742-1241.2009.02168.x
Begg, C. B., and Mazumdar, M. (1994). Operating characteristics of a rank correlation test for publication bias. Biometrics 50 (4), 1088–1101. doi:10.2307/2533446
Das, P., Shaik, A. P., and Bammidi, V. K. (2009). Meta-analysis study of glutathione-S-transferases (GSTM1, GSTP1, and GSTT1) gene polymorphisms and risk of acute myeloid leukemia. Leuk. Lymphoma 50 (8), 1345–1351. doi:10.1080/10428190903003236
Der Simonian, R., and Laird, N. (2015). Meta-analysis in clinical trials revisited. Contemp. Clin. Trials 45, 139–145. doi:10.1016/j.cct.2015.09.002
Egger, M., Davey Smith, G., Schneider, M., and Minder, C. (1997). Bias in meta-analysis detected by a simple, graphical test. BMJ 315 (7109), 629–634. doi:10.1136/bmj.315.7109.629
Ferlay, J., Soerjomataram, I., Dikshit, R., Eser, S., Mathers, C., Rebelo, M., et al. (2015). Cancer incidence and mortality worldwide: Sources, methods and major patterns in GLOBOCAN 2012. Int. J. Cancer 136, E359–E386. doi:10.1002/ijc.29210
Harries, L. W., Stubbins, M. J., Forman, D., Howard, G. C., and Wolf, C. R. (1997). Identification of genetic polymorphisms at the glutathione S-transferase Pi locus and association with susceptibility to bladder, testicular and prostate cancer. Carcinogenesis 18, 641–644. doi:10.1093/carcin/18.4.641
He, H. R., You, H. S., Sun, J. Y., Hu, S. S., Ma, Y., Dong, Y. L., et al. (2014). Glutathione S-transferase gene polymorphisms and susceptibility to acute myeloid leukemia: meta-analyses. Jpn. J. Clin. Oncol. 44 (11), 1070–1081. doi:10.1093/jjco/hyu121
Higgins, J. P., Thompson, S. G., Deeks, J. J., and Altman, D. G. (2003). Measuring inconsistency in meta-analyses. BMJ 327 (7414), 557–560. doi:10.1136/bmj.327.7414.557
Hollman, A. L., Tchounwou, P. B., and Huang, H. C. (2016). The association between gene-environment interactions and diseases involving the human GST superfamily with SNP variants. Int. J. Environ. Res. Public Health 13, 379. doi:10.3390/ijerph13040379
Huang, G. Z., Shan, W., Zeng, L., and Huang, L. G. (2013). The GSTP1 A1578G polymorphism and the risk of childhood acute lymphoblastic leukemia: Results from an updated meta-analysis. Genet. Mol. Res. 12 (3), 2481–2491. doi:10.4238/2013.July.24.3
Ioannidis, J. P., Boffetta, P., Little, J., O'Brien, T. R., Uitterlinden, A. G., Vineis, P., et al. (2008). Assessment of cumulative evidence on genetic associations: Interim guidelines. Int. J. Epidemiol. 37 (1), 120–132. doi:10.1093/ije/dym159
Krajinovic, M., Labuda, D., and Sinnett, D. (2001). Childhood acute lympho-blastic leukemia: Genetic determinants of susceptibility and disease outcome. Rev. Environ. Health 16, 263–279. doi:10.1515/reveh.2001.16.4.263
Ma, Y., Sui, Y., Wang, L., and Li, H. (2014). Effect of GSTM1 null genotype on risk of childhood acute leukemia: A meta-analysis. Tumour Biol. 35 (1), 397–402. doi:10.1007/s13277-013-1055-x
Maia Rda, R., and Wünsch Filho, V. (2013). Infection and childhood leukemia: Review of evidence. Rev. Saude Publica 47, 1172–1185. doi:10.1590/s0034-8910.2013047004753
Moulik, N. R., Parveen, F., Kumar, A., and Agrawal, S. (2014). Glutathione-S-transferase polymorphism and acute lymphoblastic leukemia (ALL) in north Indian children: A case-control study and meta-analysis. J. Hum. Genet. 59 (9), 529–535. doi:10.1038/jhg.2014.66
Ouerhani, S., Nefzi, M. A., Menif, S., Safra, I., Douzi, K., Fouzai, C., et al. (2011). Influence of genetic polymorphisms of xenobiotic metabolizing enzymes on the risk of developing leukemia in a Tunisian population. Bull. Cancer 98 (12), 95–106. doi:10.1684/bdc.2011.1502
Pearson, W. R., Vorachek, W. R., Xu, S. J., Berger, R., Hart, I., Vannais, D., et al. (1993). Identification of class-mu glutathione transferase genes GSTM1-GSTM5 on human chromosome 1p13. Am. J. Hum. Genet. 53, 220–233.
Ryberg, D., Skaug, V., Hewer, A., Phillips, D. H., Wolf, C. R., Ogreid, D, et al. (1997). Genotypes of glutathione transferase M1 and P1 and their significance for lung DNA adduct levels and cancer risk. Carcinogenesis 18, 1285–1289. doi:10.1093/carcin/18.7.1285
Schüz, J., and Erdmann, F. (2016). Environmental exposure and risk of childhood leukemia: An overview. Arch. Med. Res. 47, 607–614. doi:10.1016/j.arcmed.2016.11.017
Strange, R. C., and Fryer, A. A. (1999). The glutathione S-transferases: Influence of polymorphism on cancer susceptibility. IARC Sci. Pub, 231–249.
Strange, R. C., Lear, J. T., and Fryer, A. A. (1998). Polymorphism in glutathione S-transferase loci as a risk factor for common cancers. Arch. Toxicol. Suppl. 20, 419–428. doi:10.1007/978-3-642-46856-8_37
Strange, R. C., Spiteri, M. A., Ramachandran, S., and Fryer, A. A. (2001). Glutathione-S-transferase family of enzymes. Mutat. Res. 482, 21–26. doi:10.1016/s0027-5107(01)00206-8
Tang, Q., Li, J., Zhang, S., Yuan, B., Sun, H., Wu, D., et al. (2013). GSTM1 and GSTT1 null polymorphisms and childhood acute leukemia risk: Evidence from 26 case-control studies. PLoS One 8 (10), e78810. doi:10.1371/journal.pone.0078810
Tang, Z. H., Zhang, C., Cheng, P., Sun, H. M., Jin, Y., Chen, Y. J., et al. (2014). Glutathione-S-transferase polymorphisms (GSTM1, GSTT1 and GSTP1) and acute leukemia risk in Asians: A meta-analysis. Asian pac. J. Cancer Prev. 15 (5), 2075–2081. doi:10.7314/apjcp.2014.15.5.2075
Theodoratou, E., Montazeri, Z., Hawken, S., Allum, G. C., Gong, J., Tait, V., et al. (2012). Systematic meta-analyses and field synopsis of genetic association studies in colorectal cancer. J. Natl. Cancer Inst. 104 (19), 1433–1457. doi:10.1093/jnci/djs369
Wacholder, S., Chanock, S., Garcia-Closas, M., El Ghormli, L., and Rothman, N. (2004). Assessing the probability that a positive report is false: An approach for molecular epidemiology studies. J. Natl. Cancer Inst. 96 (6), 434–442. doi:10.1093/jnci/djh075
Wakefield, J. (2007). A Bayesian measure of the probability of false discovery in genetic epidemiology studies. Am. J. Hum. Genet. 81 (32), 208–227. doi:10.1086/519024
Wang, J., Wu, D., and Sun, A. (2019). Effects of GST null genotypes on individual susceptibility to leukemia: A meta-analysis. Exp. Mol. Pathol. 108, 137–142. doi:10.1016/j.yexmp.2019.01.004
Webb, G., Vaska, V., Coggan, M., and Board, P. (1996). Chromosomal localization of the gene for the human theta class glutathione transferase (GSTT1). Genomics 33, 121–123. doi:10.1006/geno.1996.0167
Ye, Z., and Song, H. (2005). Glutathione s-transferase polymorphisms (GSTM1, GSTP1 and GSTT1) and the risk of acute leukaemia: A systematic review and meta-analysis. Eur. J. Cancer 41 (7), 980–989. doi:10.1016/j.ejca.2005.01.014
Keywords: glutathione S-transferases, GSTM1, GSTT1, GSTP1, leukemia
Citation: Zhao Y, Wang D, Zhang C-Y, Liu Y-J, Wang X-H, Shi M-Y, Wang W, Shen X-L and He X-F (2022) Individual and combined effects of the GSTM1, GSTT1, and GSTP1 polymorphisms on leukemia risk: An updated meta-analysis. Front. Genet. 13:976673. doi: 10.3389/fgene.2022.976673
Received: 23 June 2022; Accepted: 13 October 2022;
Published: 31 October 2022.
Edited by:
Anton A. Buzdin, European Organisation for Research and Treatment of Cancer, BelgiumReviewed by:
Salvador F. Aliño, University of Valencia, SpainClaudia Banescu, University of Medicine, Pharmacy, Sciences and Technology of TârguMureş, Romania
Copyright © 2022 Zhao, Wang, Zhang, Liu, Wang, Shi, Wang, Shen and He. This is an open-access article distributed under the terms of the Creative Commons Attribution License (CC BY). The use, distribution or reproduction in other forums is permitted, provided the original author(s) and the copyright owner(s) are credited and that the original publication in this journal is cited, in accordance with accepted academic practice. No use, distribution or reproduction is permitted which does not comply with these terms.
*Correspondence: Xu-Liang Shen, c2hlbnhsY3lwQHNvaHUuY29t; Xiao-Feng He, MzkzMTIwODIzQHFxLmNvbQ==