 Lingying Chen1†
 Yonggui Han
95% of researchers rate our articles as excellent or good
Learn more about the work of our research integrity team to safeguard the quality of each article we publish.
Find out more
ORIGINAL RESEARCH article
Front. Genet. , 17 August 2022
Sec. Computational Genomics
Volume 13 - 2022 | https://doi.org/10.3389/fgene.2022.958092
This article is part of the Research Topic Medical Knowledge-Assisted Machine Learning Technologies in Individualized Medicine View all 31 articles
Background: Ovarian cancer (OC) is a highly heterogeneous disease, of which the mesenchymal subtype has the worst prognosis, is the most aggressive, and has the highest drug resistance. The cell cycle pathway plays a vital role in ovarian cancer development and progression. We aimed to screen the key cell cycle genes that regulated the mesenchymal subtype and construct a robust signature for ovarian cancer risk stratification.
Methods: Network inference was conducted by integrating the differentially expressed cell cycle signature genes and target genes between the mesenchymal and non-mesenchymal subtypes of ovarian cancer and identifying the dominant cell cycle signature genes.
Results: Network analysis revealed that two cell cycle signature genes (POLA2 and KIF20B) predominantly regulated the mesenchymal modalities of OC and used to construct a prognostic model, termed the Cell Cycle Prognostic Signature of Ovarian Cancer (CCPOC). The CCPOC-high patients showed an unfavorable prognosis in the GSE26712 cohort, consistent with the results in the seven public validation cohorts and one independent internal cohort (BL-OC cohort, qRT-PCR, n = 51). Functional analysis, drug-sensitive analysis, and survival analysis showed that CCPOC-low patients were related to strengthened tumor immunogenicity and sensitive to the anti-PD-1/PD-L1 response rate in pan-cancer (r = −0.47, OC excluded), which indicated that CCPOC-low patients may be more sensitive to anti-PD-1/PD-L1.
Conclusion: We constructed and validated a subtype-specific, cell cycle-based prognostic signature for ovarian cancer, which has great potential for predicting the response of anti-PD-1/PD-L1.
Ovarian cancer (OC) is the leading cause of cancer death in women (Siegel et al., 2019). Due to lack of effective early screening methods and lack of obvious symptoms, most of the patients were diagnosed at an advanced stage, resulting in an overall 5-year survival rate of less than 50% (Lheureux et al., 2019). Clinical risk assessment factors include tumor stage, tumor grade, histopathological classification, de-bulking status, etc. Despite the good initial treatment effect, most ovarian cancer patients still suffer from tumor recurrence and eventually develop drug resistance to chemotherapy (Coleman et al., 2013). Currently, serum CA-125 level is a clinical biomarker for risk assessment of ovarian cancer. Due to its low specificity, the overall assessment effect is not as expected (Bottoni and Scatena, 2015). The high degree of heterogeneity and aggressiveness of OC often leads to treatment failure (Cancer Genome Atlas Research Network, 2011; Konecny et al., 2014). Therefore, there is a need to integrate tumor heterogeneity to identify novel prognostic predictors for OC.
Gene expression-based biomarkers for cancer risk assessment have been extensively explored (Mo et al., 2020). Several studies have established OC prognostic biomarkers based on gene expression (Pan and Ma, 2020; Yang et al., 2021). However, due to the heterogeneity of OC, most of the biomarkers have low prognostic efficacy and cannot be directly used in clinical practice. Recently, four ovarian cancer molecular subtypes with distinct molecular and clinical characteristics were found (Cancer Genome Atlas Research Network, 2011), among which, the mesenchymal subtype had the poorest prognosis. Afterward, the mesenchymal subtype is consistent in several other subtyping systems (Konecny et al., 2014; Chen et al., 2018). Importantly, the mesenchymal subtype of OC shows poor clinical outcomes, indicating the need to integrate the intrinsic modalities of this malignant subtype for risk management in OC.
Cancer manifests itself as an infinite proliferation of cells, the main reason for which is related to improper cell cycle regulation (Williams and Stoeber, 2012). The cell cycle is precisely regulated by cyclin-dependent kinases (CDKs) (Bertoli et al., 2013). However, relevant cell cycle-based biomarkers are rare and still lacking in ovarian cancer. Considering the highly heterogeneous nature of OC, by integrating mesenchymal modalities and the cell cycle signature underlying the mesenchymal subtype, a network-based approach was adopted to identify the dominant cell cycle signature, which regulates the most aggressive OC subtype. Subsequently, we established a prognostic model, termed Cell Cycle Prognostic Signature of Ovarian Cancer (CCPOC), and exploration of the prognosis capacity of CCPOC in OC. Our signature incorporates cell cycle system and tumor heterogeneity and would be used to screen OC patients who may benefit from a more precise treatment.
We obtained 1,798 OC samples from eight publicly available datasets. The training dataset was the GSE26712 (Bonome et al., 2008) cohort (n = 182). Validation cohorts were the TCGA(Cancer Genome Atlas Research Network, 2011) (n = 578), GSE9891 (Tothill et al., 2008) (n = 285), ICGC-AU (Patch et al., 2015) (n = 111), GSE138866 (Hu et al., 2020) (n = 130), GSE32062 (Yoshihara et al., 2012) (n = 260), GSE14764 (Denkert et al., 2009) (n = 80), and GSE51088 (Karlan et al., 2014) (n = 172) datasets. Together with the corresponding clinical information, the normalized expression datasets sourced from the GEO database were downloaded via the GEOquery package (version 2.58.0). The transcription data (Affymetrix U133A) and relevant clinical information on TCGA were retrieved from the Firebrowse (http://firebrowse.org/) database. The standardized expression profile and clinical information of ICGC-AU were downloaded from the International Cancer Genome Consortium (ICGC, https://icgc.org) OV-AU (Ovarian cancer-Australia) database. For the microarray data, the gene expression data probe IDs were transformed into gene symbols; if multiple probe IDs were mapped to the same gene symbol, the one with the highest average value was selected. The molecular subtyping information was retrieved from Verhaak’s study (Verhaak et al., 2010). The detailed clinical parameters of all cohorts are listed in Table 1.
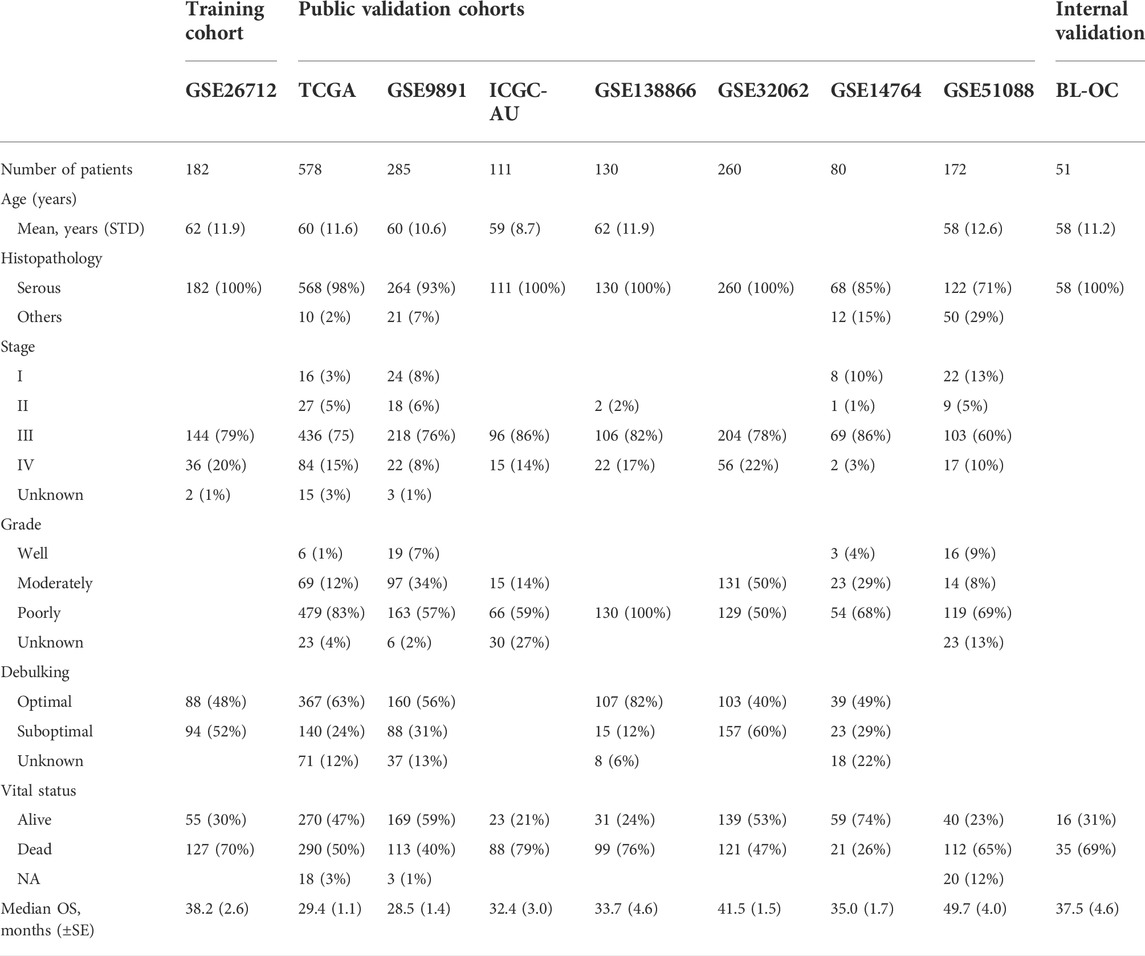
TABLE 1. Overview of the clinical and pathologic characteristics of all the datasets.
For the independent internal validation cohort (BL-OC cohort), we retrospectively collected 51 formalin-fixed paraffin-embedded (FFPE) blocks from patients who underwent surgery in Beilun People’s Hospital (from 1st January, 2015 to 1st January, 2021), Ningbo, China. Criteria for patient sample selection: longer follow-up (> 5 years) and had evaluation of adjuvant chemotherapy efficacy and no history of cancer other than ovarian cancer. This study was approved by the Ethics Committee of the Beilun People’s Hospital.
We obtained 313 cell cycle-related genes (CRGs) through the concatenation of the cycle-related genes from the MSigDB database (Version 7.2; KEGG cell cycle pathway, HALLMARK G2M pathway) and Cuzick’s study (Cuzick et al., 2011). CRGs with expression in all datasets were retained for subsequent analysis. We integrated differentially expressed target genes and cell cycle genes between the mesenchymal subtype and other subtypes and performed a network analysis by using the RTN package (version 2.10.0) to infer and investigate the relationship between cell cycle genes and potential target genes. Specifically, the network analysis consists of three parts: first, the mutual information (MI) between a cell cycle signature gene and all potential target genes is calculated, and insignificant associations are removed by permutation analysis; second, unstable interactions are removed by bootstrapping; and finally, the ARACNe algorithm is applied to reduce redundant indirect regulations. Together, the GSE26712 dataset was used as the training cohort. Univariate Cox regression analysis screened 34 cell cycle genes (p <0.1) for a subsequent analysis. Subsequently, 12 cell cycle genes (|log2 FC| > 0.25, BH-adjusted p < 0.05) and 1,704 target genes (log2 FC > 0.25, BH-adjusted p < 0.05) were determined differentially expressed in the mesenchymal subtype compared with non-mesenchymal subtypes. Then, a master regulator analysis (Fletcher et al., 2013) (MRA) was performed to examine the overrepresentation of the mesenchymal signature in the regulation of each cell cycle gene by a hypergeometric test. After the hypergeometric test results for all cell cycle signature genes, adjusted p-values were calculated using the Benjamini–Hochberg procedure. Two cell cycle signature genes of top significance (Benjamini–Hochberg-adjusted p-value < 0.05) were selected as master regulators. For detailed calculation steps and calculation code, please refer to the Vignettes of the RTN package (bioconductor.org/packages/release/bioc/vignettes/RTN/inst/doc/RTN.html).
Network analysis revealed that two cell cycle genes (POLA2 and KIF20B) were the key regulators of the mesenchymal subtype, which is the most aggressive subtype of ovarian cancer. Subsequently, the multivariable Cox regression model was used to construct a prognostic signature, termed Cell Cycle Prognostic Signature of Ovarian Cancer (CCPOC), in the GSE26172 cohort with these two signature genes. The risk score formula was constructed based on a linear combination of the expression levels weighted with the regression coefficients: CCPOC = (−0.6527 × POLA2) + (0.4975 × KIF20B). Based on the upper quantile score of each cohort calculated by the risk score formula, patients were divided into CCPOC-high and CCPOC-low subgroups. The prognostic relevance of CCPOC was evaluated in seven public independent validation datasets (TCGA, GSE9891, ICGC-AU, GSE138866, GSE32062, GSE14764, and GSE51088) with the Kaplan–Meier analysis. Univariate and multivariate analyses were performed with other clinical factors to test whether the CCPOC can be considered an independent prognostic predictor.
Fifty-one OC tissues were obtained from Beilun People’s Hospital. This study was approved by the Ethics Committee of Beilun People’s Hospital. Total RNA was extracted by using the High Pure RNA paraffin kit (Roche Applied Science, Indianapolis, IN) from FFPE tissues of the BL-OC cohort. Reverse transcription was performed with High Capacity cDNA (Thermo Scientific). qRT-PCR was performed with the QuantStudio™ 12 K Flex Real-Time PCR System (Thermo Scientific) according to the manufacturer’s recommended operating conditions. β-Actin was tested for data normalization. The primers of each gene are listed as follows: POLA2: F CACCACATCTGACAGCATCACG, R CCACCTGTTCATGCTTAGCATCC; KIF20B: F GCTGACTTTAAGGAGACTCTGCT, R GTGGCACAAATGTCTTTCGCTGC; and β-Actin: F CACCATTGGCAATGAGCGGTTC, R AGGTCTTTGCGGATGTCCACGT. The expression of each gene was calculated using the log2 (2–ΔΔCT) method.
Gene Set Enrichment Analysis (GSEA) was carried out to test the dysregulated pathways in different CCPOC risk groups by using the HTSanalyzeR package (Wang et al., 2011) (version 2.3.5) with 1,000 permutations. Hallmark (h.all.v7.2.symbols.gmt) and KEGG (c2.cp.kegg.v7.2.symbols.gmt) gene sets were downloaded from MSigDB (https://www.gsea-msigdb.org/gsea/msigdb/). Only gene sets with >five genes were included in the analyses. To evaluate the immunobiological difference between different CCPOC risk groups, CIBERSORT (Newman et al., 2015), a de-convolution algorithm, was used to characterize 22 types of immune cell abundance for each sample. For the TCGA-OV mutation, data were downloaded from the cBioPortal database (https://www.cbioportal.org/).
GSE146965 (Jiménez-Sánchez et al., 2020) and PMID17290060 (Dressman et al., 2007) containing chemotherapy response information were used for chemotherapy sensitivity analysis. Two immunotherapeutic cohorts: the IMvigor210 cohort (Mariathasan et al., 2018) was an advanced urothelial cancer with the intervention of atezolizumab, an anti-PD-L1 antibody; the GSE78220 cohort (Hugo et al., 2016) was metastatic melanoma treated with pembrolizumab, an anti-PD-1 antibody. For the IMvigor210 cohort, expression data and clinical data were downloaded from https://github.com/SiYangming/IMvigor210CoreBiologies. The TCGA PanCancer Atlas gene expression profiles and clinical information were downloaded by the TCGAbiolinks package (version 2.18.0). The infiltration status of different immune cell populations in the TCGA PanCancer Atlas was downloaded from Tamborero’s study (Tamborero et al., 2018). The marker genes of MHC, immunoinhibitory, and immunostimulatory molecules were reported by Charoentong et al. (2017). DNA damage response (DDR) signature genes were extracted from the study of Theo et al. (Knijnenburg et al., 2018). The expression of the proteins encoded by the signature genes was validated in the Human Protein Profiles (http://www.proteinatlas.org) database. The objective response rate (ORR) was obtained from public research (listed in Supplementary Table S6).
The immune genes and potential target genes between the mesenchymal and non-mesenchymal subtypes underwent differential analysis with the R limma package (version 3.42.2). Kaplan–Meier analysis was performed to test survival differences between different groups with the log-rank test using the R survival package (version 2.41.3). The prognostic value of the selected cell cycle signature was shown using the univariate Cox regression analysis. The independent prognostic effect of CCPOC was tested using univariate and multivariate Cox regression analyses. The survival prediction was assessed by the concordance indices (C-index) and the robust hazard ratio (D-index), which were calculated using the survcomp package. Student’s t-tests and Kruskal–Wallis tests were used to conduct difference comparisons of three or more groups. The correlations between the CCPOC scores and the ORR were evaluated using Pearson’s correlation. p < 0.05 was considered significant. All statistical analyses were performed in R (version 3.6.1, *p < 0.05, **p < 0.01, ***p < 0.001).
The mesenchymal subtype has the worst prognosis and shortest overall survival (Supplementary Figure S1). We intended to integrate the molecular modalities under this subtype to improve the OC risk assessment thereafter. Focusing on the mesenchymal subtype, we applied a network-based approach to investigate the regulatory role of the cell cycle, which is important in the progression of OC. Eight public datasets and one independent internal cohort with a total sample of 1,849 OC cases were included in this study (Table 1). 313 cell cycle-related genes (CRGs) (Supplementary Table S1) were downloaded from the MSigDB database and Cuzick’s study (Cuzick et al., 2011). Based on the GSE26712 cohort, we performed an initial screening of the cell cycle genes by the univariate Cox regression analysis, and a total of 34 cell cycle genes (p <0.1) were screened for subsequent analysis. Subsequently, we conducted a differential analysis of the selected cell cycle genes and potential target genes between the mesenchymal and non-mesenchymal subtypes (Figure 1A). Twelve cell cycle genes (|log2 FC| > 0.25, BH-adjusted p < 0.05) and 1,704 target genes (log2 FC > 0.25, BH-adjusted p < 0.05) were determined to be differentially expressed in the mesenchymal subtype (Figure 1B). Based on the expression profiles of these prioritized cell cycle genes and target genes, we constructed a regulatory network by calculating the mutual information between a cell cycle gene signature and its potential targets (Figure 1C). Based on hypergeometric tests, a master regulator analysis (MRA) was performed to screen core regulators for the mesenchymal subtype (Supplementary Table S2). We identified 19 and 22 EMT genes enriched in the regulons of POLA2 (BH-adjusted p = 0.013) and KIF20B (BH-adjusted p = 0.045) (Figure 1D), respectively. Compared to the non-mesenchymal subtypes (immunoreactive, proliferative, and differentiated), the two candidate genes were significantly lower expressed in the mesenchymal subtype (Supplementary Figures S2A, B).
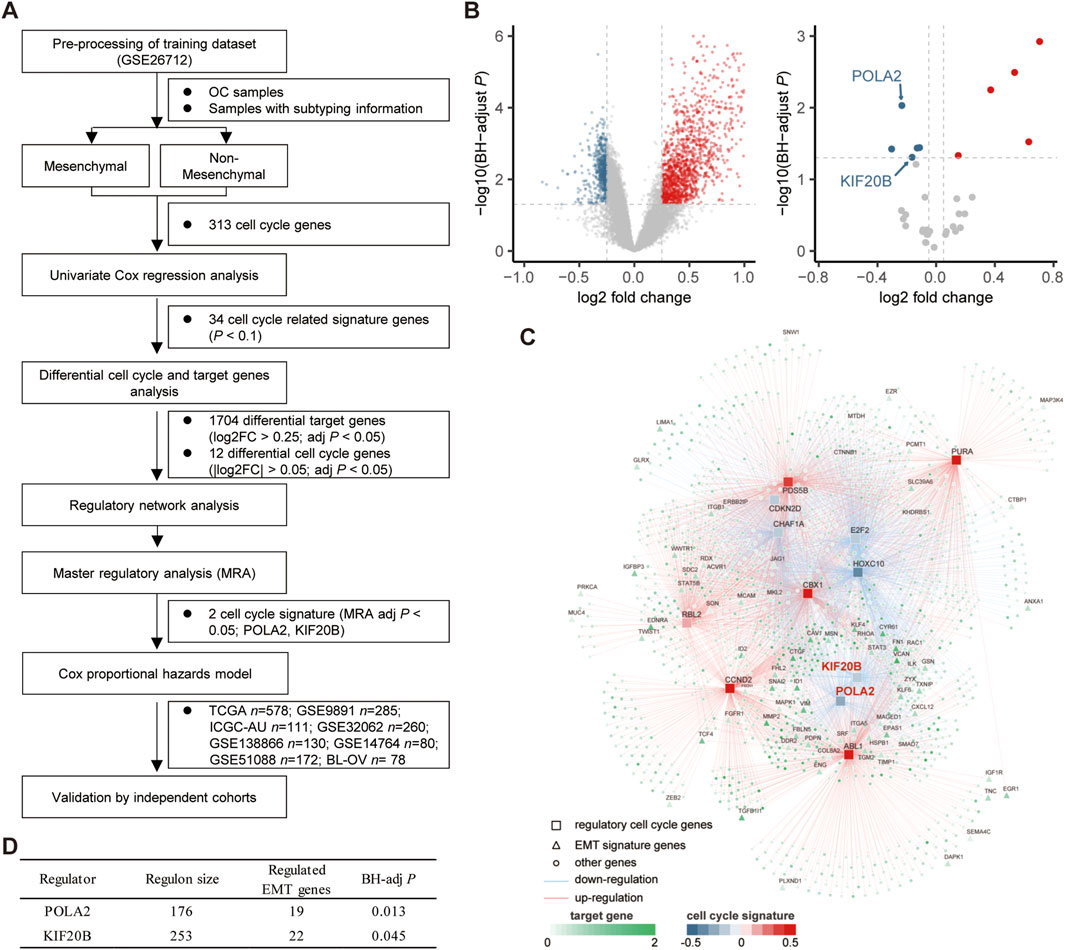
FIGURE 1. Network inference identified two cycle signature genes (POLA2 and KIF20B) as the key regulators in the mesenchymal subtype of OC. (A) Study design of the present work. (B) Volcano plot of the differentially expressed target genes and cell cycle signature genes in the mesenchymal subtype. (C) Integrated network showing the relationships between the expression data of the cell cycle signature genes and target genes. (D) Master regulator analysis results.
Compared to normal tissues, these two candidate cell cycle genes were all significantly highly expressed in OC tissues in the TCGA cohort (Figure 2A). Moreover, we checked the protein levels encoded by these two genes in the Human Protein Profiles database. POLA2 and KIF20B were moderately positive detected in OC clinical specimens when compared to their expression levels in normal samples (Figure 2B). Therefore, in the future, it is possible to evaluate the prognosis of OC patients by detecting the expression of these two genes on clinical specimens by IHC. Furthermore, the survival analysis revealed a prognostic association with overall survival in the public cohorts (Figure 2C) and the BL-OC cohort (Figure 2D). Together, the network-based approach identified two cell cycle genes, with a prognostic value, as key regulators in the mesenchymal subtype.
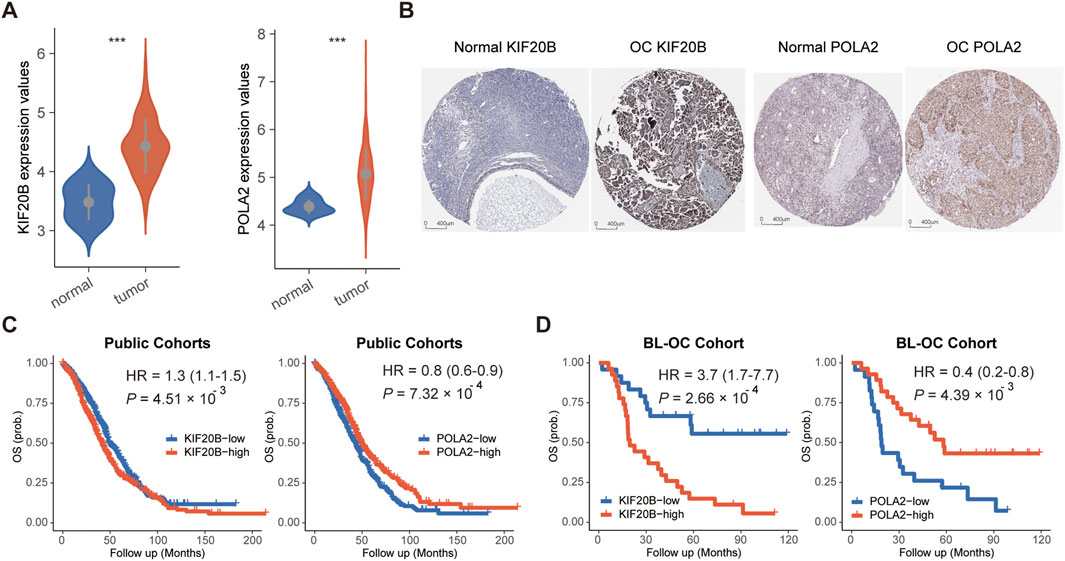
FIGURE 2. Expression and survival analyses for POLA2 and KIF20B in OC. (A) Expression levels of POLA2 and KIF20B in OC and normal tissues. (B) Protein levels encoded by POLA2 and KIF20B in normal and OC using clinical samples from the Human Protein Profiles. Survival analysis of POLA2 and KIF20B in public cohorts (C) and the BL-OC cohort (D).
Based on the GSE26172 cohort, the risk model called “Cell Cycle Prognostic Signature of Ovarian Cancer” (CCPOC) was constructed based on a linear combination of the expression levels weighted with the regression coefficients of these two cell cycle genes derived from the multivariate Cox regression analysis. Risk score = (−0.6527 × POLA2) + (0.4975 × KIF20B). Subsequently, risk scores were calculated for all patients in the public cohorts and our in-house validation BL-OC cohort (Supplementary Tables S3–S4). The CCPOC score showed prognostic efficiency with an AUC of 0.77 at 2 years and 0.79 at 5 years in the BL-OC cohort (Supplementary Figure S3). Based on the upper quantile score of each cohort calculated by the risk score formula, patients were divided into CCPOC-high and CCPOC-low subgroups. Suboptimal samples were enriched in the CCPOC-high group; meanwhile, KIF20B was highly expressed in the CCPOC-high group, while POLA2 was highly expressed in the CCPOC-low group (Supplementary Figure S4). The CCPOC showed stronger prognostic efficiency than its individual constituents (Figure 3A). In the GSE26172 cohort, patients in the CCPOC-high group had significantly poorer OS than patients (Figure 3B, Supplementary Table S5). Moreover, the CCPOC-high group had significantly reduced OS compared to the CCPOC-low group in the seven public validation cohorts (Figure 3C–I, Supplementary Table S5) and our internal validation BL-OC cohort (Figure 3J, Supplementary Table S5). In addition, the CCPOC remains effective at discriminating survival after adjusting for clinical factors, including sex and de-bulking status (p < 0.05, Supplementary Figure S5). To test whether the CCPOC was an independent prognostic predictor, univariate and multivariate Cox regression analyses were conducted in the GSE26172 cohort and meta-validation of public cohorts. After adjusting for the clinicopathological parameters, the CCPOC remained independently prognostic (Table 2). Together, these findings indicated that the CCPOC was an independent prognostic signature.
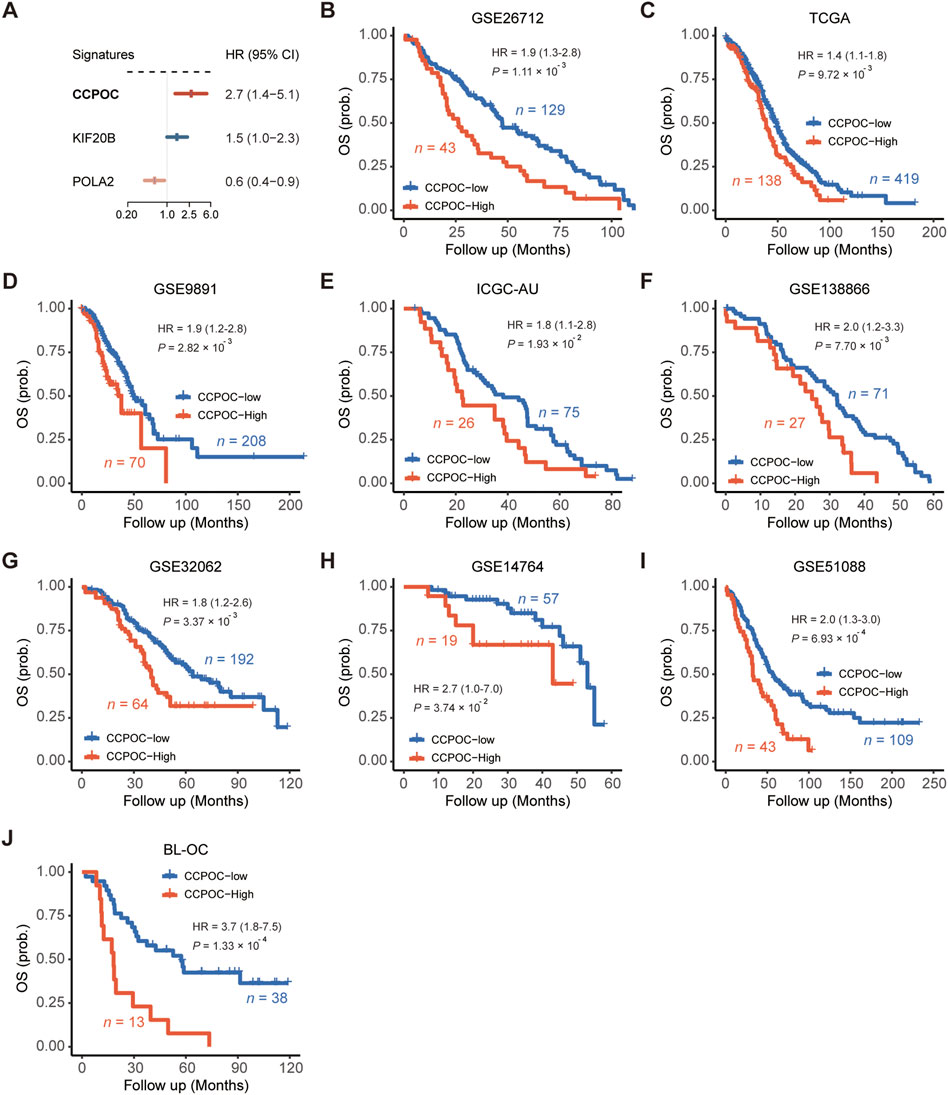
FIGURE 3. Assessment of the prognostic value of the CCPOC. (A) Comparison of prognostic efficiencies between the CCPOC and its individual constituents. (B) Kaplan–Meier survival analysis showing that the CCPOC-high group had an unfavorable OS in the training cohort (GSE26712). In the seven public validation cohorts (C–I), the CCPOC-high group stably showed a significantly poor prognosis for OS. (J) Evaluation of the prognostic value of CCPOC in the BL-OC cohort.
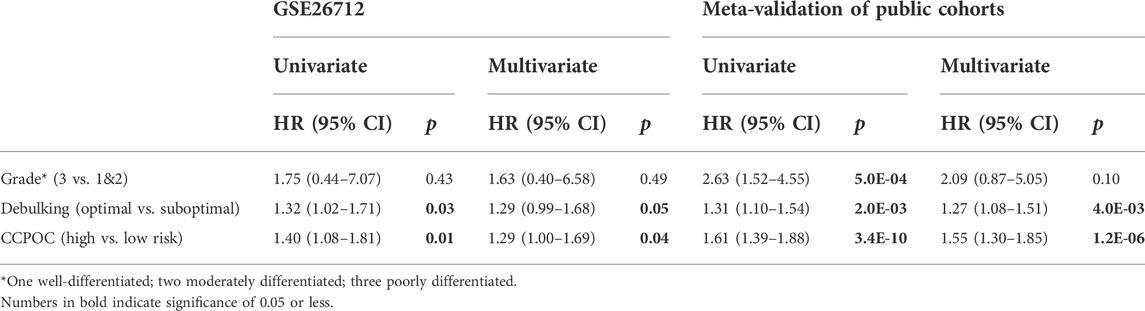
TABLE 2. Univariate and multivariate prognostic analyses of the cell cycle signature and clinicopathological factors in the training cohort and meta-validation of public cohorts.
Next, in order to compare the prognostic value of the CCPOC with published OC prognostic models, referred to as Bao et al. (2020), Hu et al. (2021), Zhang et al. (2021), Pan’s (Pan and Ma, 2020), Qi’s (Ye et al., 2021), Wang et al. (2022), and Yang et al. (2021) prognostic system, based on the OS data of the GSE138866, GSE32062, GSE51088, GSE9891, and ICGC-AU cohorts, the C-index and D-index were calculated. As presented in Figure 4, the C-index was significantly higher in CCPOC than existing Bao and Wang models (Figures 4A, C). Like the C-index, the D-index was significantly higher in CCPOC than in most of the existing prognostic systems (Figures 4B, D).
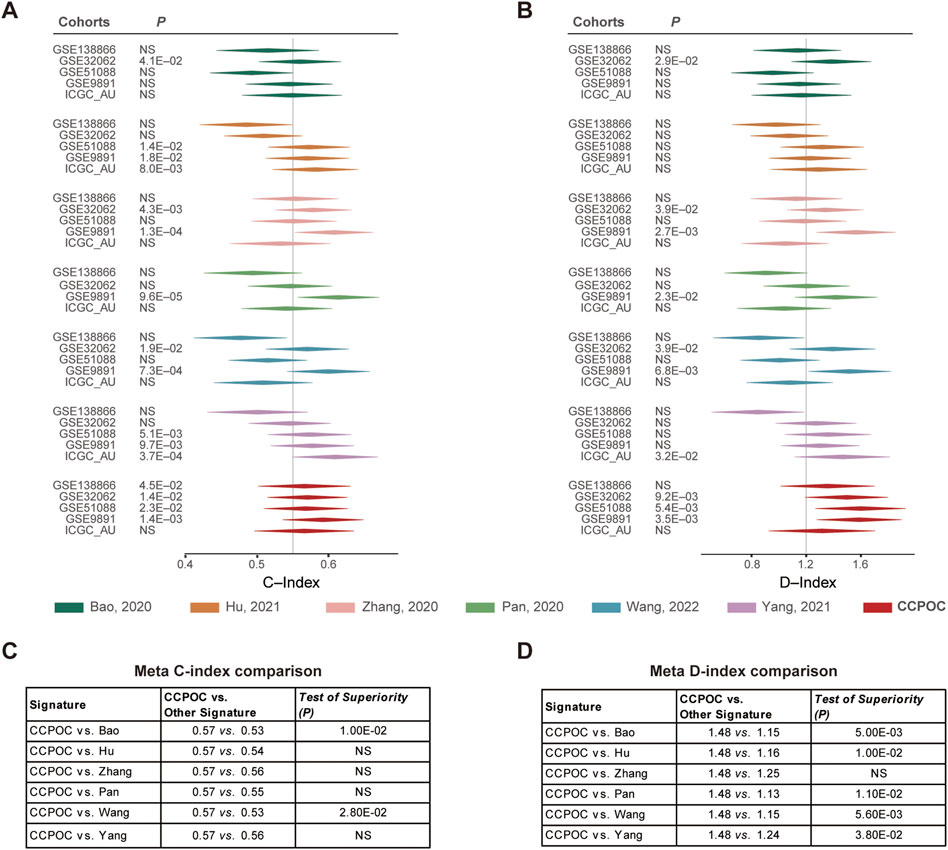
FIGURE 4. Comparison of published classifiers with CCPOC. Forest plot reporting of the (A) concordance index (C-index) and (B) D-index (robust hazard ratio) for CCPOC and published classifiers. The tables illustrate the superiority of CCPOC compared with published classifiers for Meta C-index (C) and Meta D-index (D).
Earlier, we showed that the CCPOC could help risk stratification of OC patients. Next, we explored the immune microenvironment composition in CCPOC-low and CCPOC-high groups. Immunomodulators have been classified into three types of molecules which include immune-inhibitors, immuno-stimulators, and major histocompatibility complex (MHC) molecules. The DNA damage response (DDR) refers to the process by which the cell maintains integrity of the genome after insult. The CCPOC-high group presented lower expression of MHC I/II molecular, immuno-inhibitor markers, immuno-stimulator markers (Figure 5A), and DDR markers (Figure 5B). The immune cell infiltration results showed that the CCPOC-high group was enriched with T cell CD4 memory resting cells (Figure 5C). Then, we conducted GSEA between the CCPOC-high and CCPOC-low groups (Supplementary Table S6). The EMT, TGF-β, and Wnt pathways were upregulated in the CCPOC-high group (Figure 6A). When analyzing CCPOC to predict chemotherapy sensitivity in the GSE146965 and PMID17290060 cohorts, chemotherapy effectiveness was lower in the CCPOC-high group than in the CCPOC-low group (Figure 6B). Immunotherapy, represented by a PD-L1/L1 blockade, has become a new breakthrough in cancer treatment. We analyzed the association between CCPOC and the response to immune checkpoint blockade therapy in two immunotherapy cohorts. In both the anti-PD-L1 cohort (IMvigor210) and the anti-PD-1 cohort (GSE78220), patients within the CCPOC-low group showed prolonged survival (Figures 6D,F). Treatment results showed that patients within the CCPOC-low group showed more efficacy against anti-PD-1/L1 immunotherapy than CCPOC-high group patients (Figure 6E and 6G-H). The aforementioned data indicate that the CCPOC-high group had lower tumor immunogenicity and lower efficacy of chemotherapy and anti-PD-1/L1 immunotherapy treatment response.
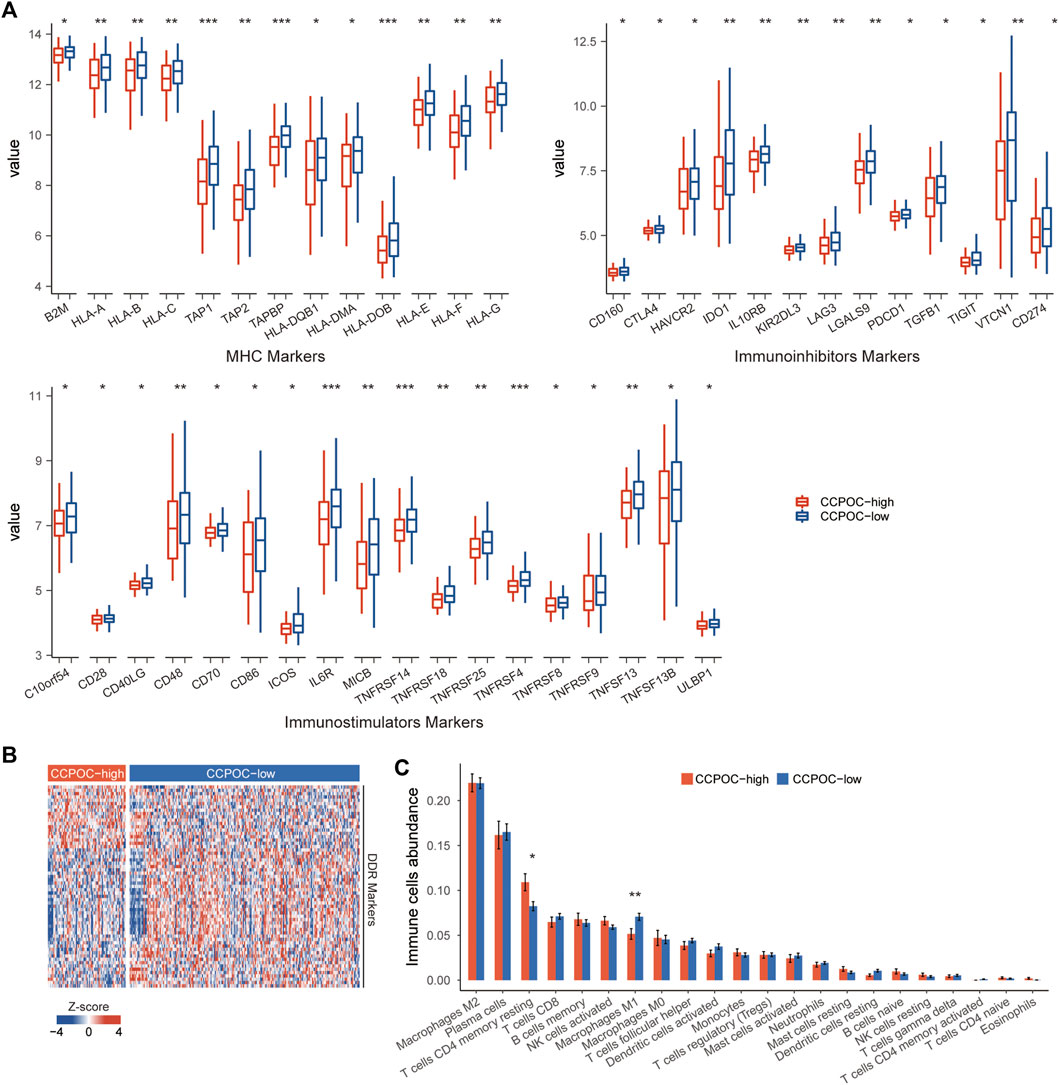
FIGURE 5. Immune microenvironment composition in CCPOC groups. (A) Expression levels of immuno-inhibitors, MHC I/II molecular, and immuno-stimulator markers within the CCPOC groups. (B) Heatmap of the expression of DDR markers between the CCPOC-high and CCPOC-low groups. (C) Distribution of 22 immune cells in the CCPOC groups. (*p < 0.05 and **p < 0.01).
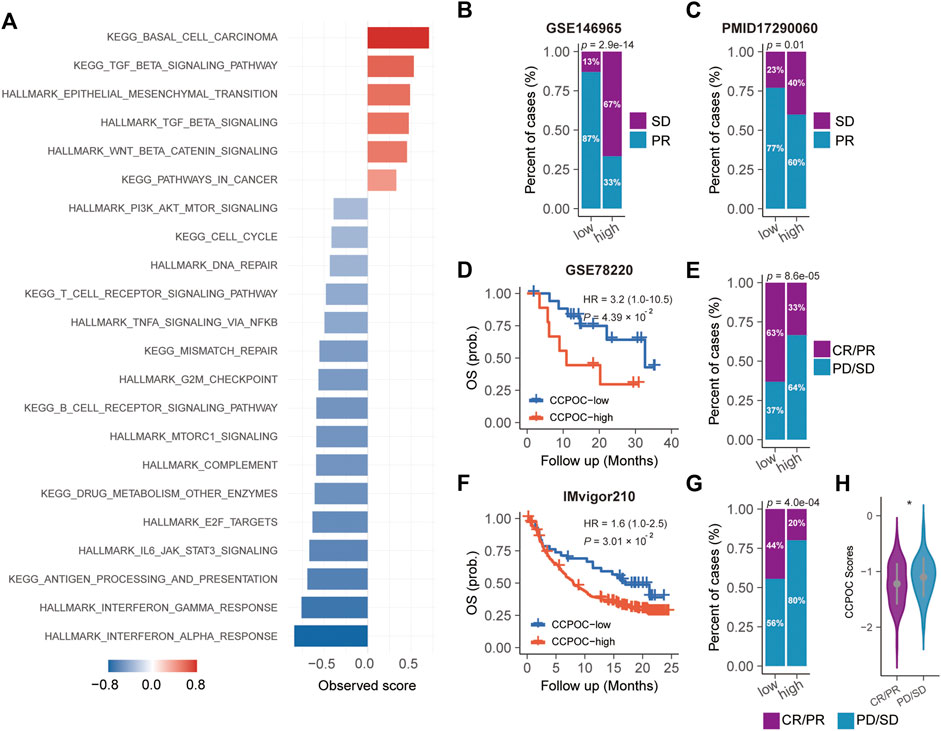
FIGURE 6. Dysregulated pathways and drug sensitivity within the CCPOC groups. (A) Enrichment of dysregulated pathways between the high- and low- CCPOC groups. (B) and (C) chemotherapy sensitivity analysis. Survival analyses for the CCPOC groups in the GSE78220 cohort (D) and the IMvigor210 cohort (F). Proportion of patients with response to anti-PD-1/L1 immunotherapy in low- or high-CCPOC groups in the GSE78220 cohort (E) and the IMvigor210 cohort (G). (H) Distribution of the CCPOC scores in CCPOC groups. CR, complete response; PR, partial response; SD, stable disease; PD, progressive disease.
Next, we explored the CCPOC signature in pan-cancer. As shown in Figure 7A, the CCPOC scores of OC were medium in the 33 cancers. Then, we explored the prognostic significance of CCPOC in pan-cancer. As presented in Figure 7B, CCPOC acted as a prognostic factor in almost 25% of cancer types. In addition, the CCPOC-high group presented low lymphocyte infiltration, such as CD8+ T cell, B cells, and NK cells (Figure 7C). Through an extensive literature search, we identified 15 tumor types for which data regarding the ORR of anti-PD-1/PD-L1 were available (OC excluded, Supplementary Table S7). In line with our suggestion, the CCPOC was negative to anti-PD-1/PD-L1 response in pan-cancer (r = −0.47, OC excluded) (Figure 7D). These data showed that CCPOC could be a biomarker in predicting the prognosis and anti-PD-1/PD-L1 response in other cancer types.
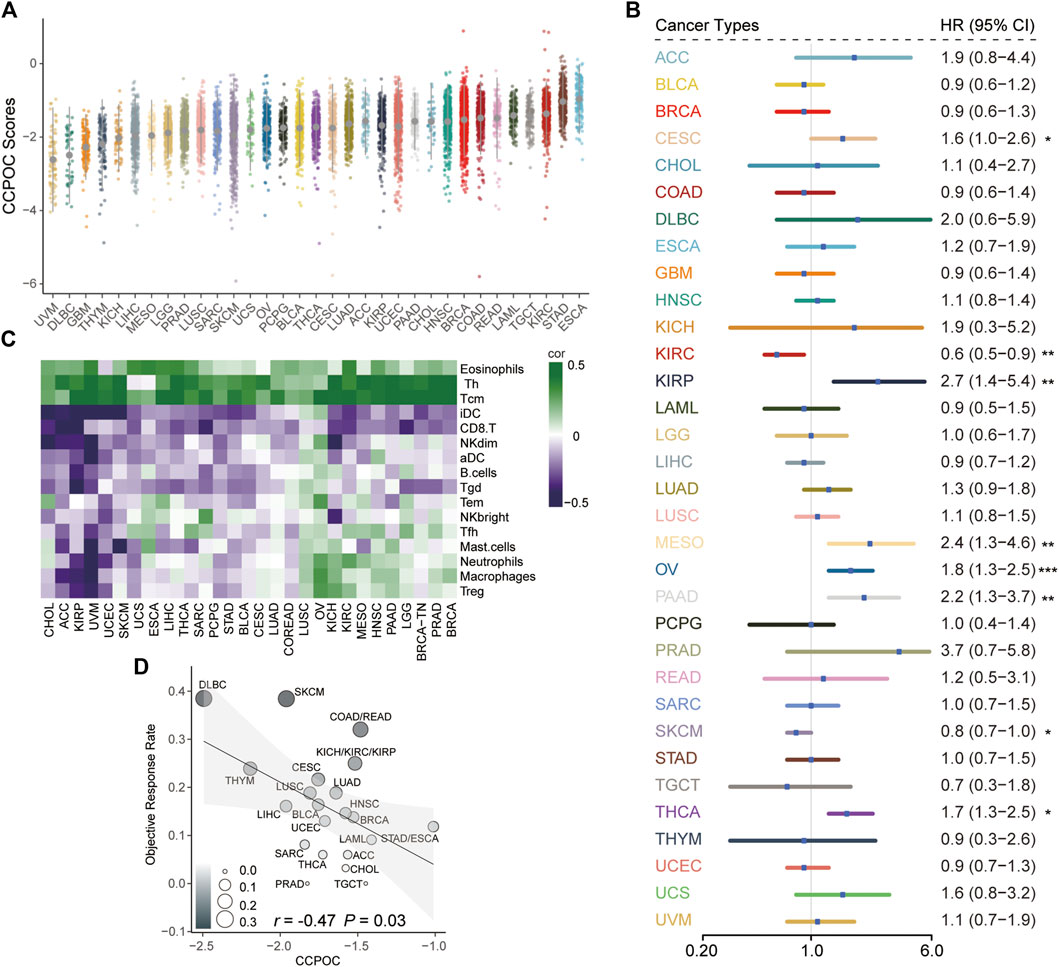
FIGURE 7. Pan-cancer analysis of the prognostic significance and anti-PD-1/PD-L1 response for CCPOC. (A) Distribution of CCPOC scores in pan-cancer. (B) Prognostic relevance of CCPOC in various cancer types. (C) Heatmap of the correlation of immune cells and CCPOC scores across various cancer types. (D) Correlation between CCPOC and anti-PD-1/PD-L1 ORR of various cancer types. (*p < 0.05, **p < 0.01, and ***p < 0.001).
Ovarian cancer (OC) is the most lethal gynecological cancer with pathological and molecular heterogeneity characteristics (Siegel et al., 2019). Various multi-gene prognostic biomarkers have been developed (Pan and Ma, 2020; Yang et al., 2021), but their prediction efficiencies are still uncertain. Therefore, a new signature that can accurately recognize OC patients with poor prognoses is urgently needed. Based on transcriptome data, OC has been unsupervised and classified into four molecular subtypes (immunoreactive, differentiated, proliferative, and mesenchymal) with distinct molecular and clinical characteristics (Cancer Genome Atlas Research Network, 2011). The mesenchymal subtype highly expressed the mesenchymal signature and was associated with worse clinical outcomes. The prognostic signature screened based on molecular portraits specific to the worst prognosis subtype may be used for risk stratification of OC patients. In addition, many studies have explored the role of cell cycle in the prognosis prediction of tumors (Hui et al., 2021; Jiang et al., 2021). However, most studies have only studied the prognostic relevance of cell cycle without considering tumor heterogeneity. In this study, we applied a network-based approach to integrate cell cycle signature and modalities underlying the mesenchymal subtype to establish a prognostic signature termed “Cell Cycle Prognostic Signature of Ovarian Cancer” (CCPOC). To our knowledge, no prognostic cell cycle-based signature has been constructed by incorporating molecular subtyping information of OC.
The CCPOC was constructed by two cell cycle genes (POLA2 and KIF20B) which were key regulators of the mesenchymal subtype and could stratify patients into different risk groups. Within these two cell cycle genes, KIF20B can promote cell proliferation and could be a potential therapeutic target in pancreatic cancer (Chen et al., 2021). Koh et al. reported that the knockdown of POLA2 increases chemo-resistance in human lung cancer cells (Koh et al., 2016). The defined CCPOC-high group showed a worse OS than the CCPOC-low group. To confirm this finding, we validated the results in seven independent cohorts measured by various platforms and one independent internal cohort (BL-OC cohort) and found that the signature successfully stratified the prognosis in all cohorts. The CCPOC remained an independent prognostic predictor in the multivariate Cox proportional hazards analysis after adjusting for other clinical factors. In line with the findings, we found that the C-index and D-index of the CCPOC were significantly higher than those of the published prognostic models, which was superior to the current genomic classification. These data suggest that the CCPOC has a strong and reproducible prognostic value for risk stratification of OC. In addition, we also found that the CCPOC was related to weakened tumor immunogenicity and inflamed antitumor immunity, and the correlation analysis showed that CCPOC was negatively related to the ORR in pan-cancer (OC excluded), which indicated that the CCPOC-low group may be sensitive to anti-PD-1/PD-L1 therapy. Together, these findings show that the CCPOC could serve as a robust prognostic signature in OC.
This study still has some limitations. First, the prognostic signature was screened from gene expression profiles generated from microarray platforms, which are expensive, difficult to operate, and involve professional bioinformatics expertise, so it is difficult to be popularized in daily clinical application. Second, the training and validation datasets were all from retrospective studies in the study, including fresh frozen samples. Therefore, in practice, we need to detect the expression of signature genes using conventional clinical techniques, such as RT-PRC or IHC, and then reconstruct the new model and perform large-scale multicenter cohorts to validate the validity and robustness of the model.
In conclusion, using multi-dimensional network inference underlying the mesenchymal subtype of OC, we have identified and validated a two cell cycle signature, named CCPOC, to risk-stratify patients and provide an easy method for the exploration of new effective therapeutic options, including novel target drugs and immune therapy in the future.
The datasets presented in this study can be found in online repositories. The names of the repository/repositories and accession number(s) can be found in the article/Supplementary Material.
The studies involving human participants were reviewed and approved by the Ethics Committee of the Beilun People’s Hospital. The patients/participants provided their written informed consent to participate in this study.
LC and YH contributed to the conception and design of the project. LC, HG, JW, and LZ participated in the data collection and data analyses. YH and CS wrote and edited the manuscript. All the authors read and approved the final manuscript. All authors contributed to the manuscript and approved the submitted version.
The authors declare that the research was conducted in the absence of any commercial or financial relationships that could be construed as a potential conflict of interest.
All claims expressed in this article are solely those of the authors and do not necessarily represent those of their affiliated organizations, or those of the publisher, the editors, and the reviewers. Any product that may be evaluated in this article, or claim that may be made by its manufacturer, is not guaranteed or endorsed by the publisher.
The Supplementary Material for this article can be found online at: https://www.frontiersin.org/articles/10.3389/fgene.2022.958092/full#supplementary-material
SUPPLEMENTARY FIGURE S1 | Kaplan–Meier analysis of different molecular subtypes.
SUPPLEMENTARY FIGURE S2 | Expression levels of POLA2 and KIF20B (B) genes among different subtypes.
SUPPLEMENTARY FIGURE S3 | 2-year and 5-year AUC of the CCPOC score in the BL-OC cohort.
SUPPLEMENTARY FIGURE S4 | Heatmap of the expression of the two candidate immune genes.
SUPPLEMENTARY FIGURE S5 | Kaplan–Meier analysis of CCPOC risk groups within different conditions.
Bao, M., Zhang, L., and Hu, Y. (2020). Novel gene signatures for prognosis prediction in ovarian cancer. J. Cell. Mol. Med. 24 (17), 9972–9984. doi:10.1111/jcmm.15601
Bertoli, C., Skotheim, J. M., and De Bruin, R. A. (2013). Control of cell cycle transcription during G1 and S phases. Nat. Rev. Mol. Cell Biol. 14 (8), 518–528. doi:10.1038/nrm3629
Bonome, T., Levine, D. A., Shih, J., Randonovich, M., Pise-Masison, C. A., Bogomolniy, F., et al. (2008). A gene signature predicting for survival in suboptimally debulked patients with ovarian cancer. Cancer Res. 68 (13), 5478–5486. doi:10.1158/0008-5472.CAN-07-6595
Bottoni, P., and Scatena, R. (2015). The role of CA 125 as tumor marker: biochemical and clinical aspects. Adv. Exp. Med. Biol. 867, 229–244. doi:10.1007/978-94-017-7215-0_14
Cancer Genome Atlas Research Network (2011). Integrated genomic analyses of ovarian carcinoma. Nature 474 (7353), 609–615. doi:10.1038/nature10166
Charoentong, P., Finotello, F., Angelova, M., Mayer, C., Efremova, M., Rieder, D., et al. (2017). Pan-cancer immunogenomic analyses reveal genotype-immunophenotype relationships and predictors of response to checkpoint blockade. Cell Rep. 18 (1), 248–262. doi:10.1016/j.celrep.2016.12.019
Chen, G. M., Kannan, L., Geistlinger, L., Kofia, V., Safikhani, Z., Gendoo, D. M., et al. (2018). Consensus on molecular subtypes of high-grade serous ovarian carcinoma. Clin. Cancer Res. 24 (20), 5037–5047. doi:10.1158/1078-0432.CCR-18-0784
Chen, J., Zhao, C.-C., Chen, F.-R., Feng, G.-W., Luo, F., and Jiang, T. (2021). KIF20B promotes cell proliferation and may Be a potential therapeutic target in pancreatic cancer. J. Oncol. 2021, 5572402. doi:10.1155/2021/5572402
Coleman, R. L., Monk, B. J., Sood, A. K., and Herzog, T. J. (2013). Latest research and treatment of advanced-stage epithelial ovarian cancer. Nat. Rev. Clin. Oncol. 10 (4), 211–224. doi:10.1038/nrclinonc.2013.5
Cuzick, J., Swanson, G. P., Fisher, G., Brothman, A. R., Berney, D. M., Reid, J. E., et al. (2011). Prognostic value of an RNA expression signature derived from cell cycle proliferation genes in patients with prostate cancer: a retrospective study. Lancet. Oncol. 12 (3), 245–255. doi:10.1016/S1470-2045(10)70295-3
Denkert, C., Budczies, J., Darb‐Esfahani, S., Györffy, B., Sehouli, J., Könsgen, D., et al. (2009). A prognostic gene expression index in ovarian cancer—validation across different independent data sets. J. Pathol. 218 (2), 273–280. doi:10.1002/path.2547
Dressman, H. K., Berchuck, A., Chan, G., Zhai, J., Bild, A., Sayer, R., et al. (2007). An integrated genomic-based approach to individualized treatment of patients with advanced-stage ovarian cancer. J. Clin. Oncol. 25 (5), 517–525. doi:10.1200/JCO.2006.06.3743
Fletcher, M. N., Castro, M. A., Wang, X., De Santiago, I., O’Reilly, M., Chin, S.-F., et al. (2013). Master regulators of FGFR2 signalling and breast cancer risk. Nat. Commun. 4 (1), 2464–2512. doi:10.1038/ncomms3464
Hu, Y., Taylor-Harding, B., Raz, Y., Haro, M., Recouvreux, M. S., Taylan, E., et al. (2020). Are Epithelial ovarian cancers of the mesenchymal subtype actually intraperitoneal metastases to the ovary? Front. Cell Dev. Biol. 8, 647. doi:10.3389/fcell.2020.00647
Hu, Y., Zheng, M., Wang, S., Gao, L., Gou, R., Liu, O., et al. (2021). Identification of a five-gene signature of the RGS gene family with prognostic value in ovarian cancer. Genomics 113 (4), 2134–2144. doi:10.1016/j.ygeno.2021.04.012
Hugo, W., Zaretsky, J. M., Sun, L., Song, C., Moreno, B. H., Hu-Lieskovan, S., et al. (2016). Genomic and transcriptomic features of response to anti-PD-1 therapy in metastatic melanoma. Cell 165 (1), 35–44. doi:10.1016/j.cell.2016.02.065
Hui, Y., Leng, J., Jin, D., Liu, D., Wang, G., Wang, Q., et al. (2021). A cell cycle progression-derived gene signature to predict prognosis and therapeutic response in hepatocellular carcinoma. Dis. Markers 2021, 1986159. doi:10.1155/2021/1986159
Jiang, W., Xu, J., Liao, Z., Li, G., Zhang, C., and Feng, Y. (2021). Prognostic signature for lung adenocarcinoma patients based on cell-cycle-related genes. Front. Cell Dev. Biol. 9, 635. doi:10.3389/fcell.2021.655950
Jiménez-Sánchez, A., Cybulska, P., Mager, K. L., Koplev, S., Cast, O., Couturier, D.-L., et al. (2020). Unraveling tumor–immune heterogeneity in advanced ovarian cancer uncovers immunogenic effect of chemotherapy. Nat. Genet. 52 (6), 582–593. doi:10.1038/s41588-020-0630-5
Karlan, B. Y., Dering, J., Walsh, C., Orsulic, S., Lester, J., Anderson, L. A., et al. (2014). POSTN/TGFBI-associated stromal signature predicts poor prognosis in serous epithelial ovarian cancer. Gynecol. Oncol. 132 (2), 334–342. doi:10.1016/j.ygyno.2013.12.021
Knijnenburg, T. A., Wang, L., Zimmermann, M. T., Chambwe, N., Gao, G. F., Cherniack, A. D., et al. (2018). Genomic and molecular landscape of DNA damage repair deficiency across the Cancer Genome Atlas. Cell Rep. 23 (1), 239e6–254. doi:10.1016/j.celrep.2018.03.076
Koh, V., Kwan, H. Y., Tan, W. L., Mah, T. L., and Yong, W. P. (2016). Knockdown of POLA2 increases gemcitabine resistance in lung cancer cells. BMC genomics 17 (13), 1029–1096. doi:10.1186/s12864-016-3322-x
Konecny, G. E., Wang, C., Hamidi, H., Winterhoff, B., Kalli, K. R., Dering, J., et al. (2014). Prognostic and therapeutic relevance of molecular subtypes in high-grade serous ovarian cancer. J. Natl. Cancer Inst. 106 (10), dju249. doi:10.1093/jnci/dju249
Lheureux, S., Gourley, C., Vergote, I., and Oza, A. M. (2019). Epithelial ovarian cancer. Lancet 393 (10177), 1240–1253. doi:10.1016/S0140-6736(18)32552-2
Mariathasan, S., Turley, S. J., Nickles, D., Castiglioni, A., Yuen, K., Wang, Y., et al. (2018). TGFβ attenuates tumour response to PD-L1 blockade by contributing to exclusion of T cells. Nature 554 (7693), 544–548. doi:10.1038/nature25501
Mo, X., Su, Z., Yang, B., Zeng, Z., Lei, S., and Qiao, H. (2020). Identification of key genes involved in the development and progression of early-onset colorectal cancer by co-expression network analysis. Oncol. Lett. 19 (1), 177–186. doi:10.3892/ol.2019.11073
Newman, A. M., Liu, C. L., Green, M. R., Gentles, A. J., Feng, W., Xu, Y., et al. (2015). Robust enumeration of cell subsets from tissue expression profiles. Nat. Methods 12 (5), 453–457. doi:10.1038/nmeth.3337
Pan, X., and Ma, X. (2020). A novel six-gene signature for prognosis prediction in ovarian cancer. Front. Genet. 11, 1006. doi:10.3389/fgene.2020.01006
Patch, A.-M., Christie, E. L., Etemadmoghadam, D., Garsed, D. W., George, J., Fereday, S., et al. (2015). Whole–genome characterization of chemoresistant ovarian cancer. Nature 521 (7553), 489–494. doi:10.1038/nature14410
Siegel, R. L., Miller, K. D., and Jemal, A. (2019). Cancer statistics, 2019. CA. A Cancer J. Clin. 69 (1), 7–34. doi:10.3322/caac.21551
Tamborero, D., Rubio-Perez, C., Muiños, F., Sabarinathan, R., Piulats, J. M., Muntasell, A., et al. (2018). A pan-cancer landscape of interactions between solid tumors and infiltrating immune cell populations. Clin. Cancer Res. 24 (15), 3717–3728. doi:10.1158/1078-0432.CCR-17-3509
Tothill, R. W., Tinker, A. V., George, J., Brown, R., Fox, S. B., Lade, S., et al. (2008). Novel molecular subtypes of serous and endometrioid ovarian cancer linked to clinical outcome. Clin. Cancer Res. 14 (16), 5198–5208. doi:10.1158/1078-0432.CCR-08-0196
Verhaak, R. G., Hoadley, K. A., Purdom, E., Wang, V., Qi, Y., Wilkerson, M. D., et al. (2010). Integrated genomic analysis identifies clinically relevant subtypes of glioblastoma characterized by abnormalities in PDGFRA, IDH1, EGFR, and NF1. Cancer Cell 17 (1), 98–110. doi:10.1016/j.ccr.2009.12.020
Wang, X., Terfve, C., Rose, J. C., and Markowetz, F. (2011). HTSanalyzeR: An R/bioconductor package for integrated network analysis of high-throughput screens. Bioinformatics 27 (6), 879–880. doi:10.1093/bioinformatics/btr028
Wang, Y., Li, B. X., and Li, X. (2022). Identification and validation of angiogenesis-related gene expression for predicting prognosis in patients with ovarian cancer. Front. Oncol. 11, 783666. doi:10.3389/fonc.2021.783666
Williams, G. H., and Stoeber, K. (2012). The cell cycle and cancer. J. Pathol. 226 (2), 352–364. doi:10.1002/path.3022
Yang, J., Hong, S., Zhang, X., Liu, J., Wang, Y., Wang, Z., et al. (2021). Tumor immune microenvironment related gene-based model to predict prognosis and response to compounds in ovarian cancer. Front. Oncol. 11, 807410. doi:10.3389/fonc.2021.807410
Ye, Y., Dai, Q., Li, S., He, J., and Qi, H. (2021). A novel defined risk signature of the ferroptosis-related genes for predicting the prognosis of ovarian cancer. Front. Mol. Biosci. 8, 645845. doi:10.3389/fmolb.2021.645845
Yoshihara, K., Tsunoda, T., Shigemizu, D., Fujiwara, H., Hatae, M., Fujiwara, H., et al. (2012). High-risk ovarian cancer based on 126-gene expression signature is uniquely characterized by downregulation of antigen presentation pathway. Clin. Cancer Res. 18 (5), 1374–1385. doi:10.1158/1078-0432.CCR-11-2725
Keywords: ovarian cancer, cell cycle, mesenchymal subtype, prognosis, PD-1/PD-L1
Citation: Chen L, Gu H, Zhou L, Wu J, Sun C and Han Y (2022) Integrating cell cycle score for precise risk stratification in ovarian cancer. Front. Genet. 13:958092. doi: 10.3389/fgene.2022.958092
Received: 31 May 2022; Accepted: 19 July 2022;
Published: 17 August 2022.
Edited by:
Wei Wang, Huzhou Maternity & Child Health Care Hospital, ChinaReviewed by:
Jun Xu, The First Affiliated Hospital of University of Science and Technology of China Anhui Provincial Hospital, ChinaCopyright © 2022 Chen, Gu, Zhou, Wu, Sun and Han. This is an open-access article distributed under the terms of the Creative Commons Attribution License (CC BY). The use, distribution or reproduction in other forums is permitted, provided the original author(s) and the copyright owner(s) are credited and that the original publication in this journal is cited, in accordance with accepted academic practice. No use, distribution or reproduction is permitted which does not comply with these terms.
*Correspondence: Changdong Sun, c3VuY2hhbmcxOTc3MDExMEAxNjMuY29t; Yonggui Han, aGFueW9uZ2d1aTU5NjhAMTYzLmNvbQ==
†These authors have contributed equally to this work and share first authorship
Disclaimer: All claims expressed in this article are solely those of the authors and do not necessarily represent those of their affiliated organizations, or those of the publisher, the editors and the reviewers. Any product that may be evaluated in this article or claim that may be made by its manufacturer is not guaranteed or endorsed by the publisher.
Research integrity at Frontiers
Learn more about the work of our research integrity team to safeguard the quality of each article we publish.