 Khaing Zin Than1Kanha Muisuk2Wipada Woravatin3Chatmongkon Suwannapoom4Metawee Srikummool5Suparat Srithawong3Sengvilay Lorphengsy6
 Wibhu Kutanan3*
- 1Biological Science Program, Faculty of Science, Khon Kaen University, Khon Kaen, Thailand
- 2Department of Forensic Medicine, Faculty of Medicine, Khon Kaen University, Khon Kaen, Thailand
- 3Department of Biology, Faculty of Science, Khon Kaen University, Khon Kaen, Thailand
- 4School of Agriculture and Natural Resources, University of Phayao, Muang Phayao, Thailand
- 5Department of Biochemistry, Faculty of Medical Science, Naresuan University, Phitsanulok, Thailand
- 6The Biotechnology and Ecology Institute Ministry of Science and Technology, Vientiane, Laos
The Lao Isan and Laotian are the major groups in the area of present-day northeastern Thailand and Laos, respectively. Several previous genetic and forensic studies indicated an admixed genetic structure of Lao Isan with the local Austroasiatic speaking groups, e.g. Khmer, whereas there is a paucity of reporting Laotian’s forensic short tandem repeats (STRs). Here, we newly generated 451 genotypes of seven Lao Isan and three Laotian populations (two Lao Lum and one Lao Thoeng) using 23 autosomal STRs embedded in VerifilerTM plus PCR Amplification kit. We reported allelic frequency and forensic parameters in different dataset: combined ethnic Lao groups, combined Lao Isan populations and combined Laotians. Overall, the forensic parameter results indicate that this set of STRs is suitable for forensic investigation. The anthropological results revealed the genetic homogeneity of Tai-Kadai speaking Lao groups from Thailand and Laos, consistent with previous studies, while the Austroasiatic speaking groups from southern Laos showed genetic relatedness to both Lao Isan and Khmer. In sum, STRs allelic frequency results can provide the genetic backgrounds of populations which is useful for anthropological research and also strengthens the regional forensic database in both countries.
Introduction
As lands with much common history, the areas of present-day Laos and Thailand share multiple cultural and historical perspectives (Arnamwat, 1985; Teerawit, 2001) and a border delineated by high mountains and the Mekong River. With a geography that encompasses both upland and lowland areas located in the heart of Mainland Southeast Asia (MSEA), both countries are served with land suitable for human occupations and harbor multiple diverse ethnolinguistic groups. With population sizes of ∼6.86 million in Laos and 68.62 million in Thailand (Eberhard et al., 2020), there are 85 and 70 different languages in Laos and Thailand, respectively. All of these languages are classified as belonging to five major language families: Tai-Kadai (TK), Austroasiatic (AA), Sino-Tibetan (ST), Hmong-Mien (HM) and Austronesian (AN). The most common language family is the TK language with ∼4.29 million speakers in Laos and 46.69 million in Thailand, while AA is the second most commonly spoken language in Laos (∼1.71 million) and Thailand (∼2.07 million). However, the number of AA languages is higher (49 in Laos and 26 in Thailand) than TK languages (20 in Laos and 16 in Thailand), reflecting greater diversification of AA than TK. The ST and HM languages are less spoken in both countries (ST: 11 in Laos and 19 in Thailand; HM: 4 in Laos and 3 in Thailand) while the AN family is restricted to southern Thailand (6 languages) (Eberhard et al., 2020).
In Laos, geographic criteria are generally used to grouping populations; the major TK speaking Laotians or Lao Lum (∼4.3 million) inhabit in the lowland with various dialects spoken, e.g., Luang Prabang, Vientiane and Savannakhet (Eberhard et al., 2020). There are ∼1.7 million AA speaking Laotians or Lao Thoeng which refers to mid-landers or uplanders, while ∼0.2 million of the HM and ST speaking Laotians are highlanders known as Lao Sung (Schliesinger, 2003; Eberhard et al., 2020). In Thailand, the major TK speaking groups in four different regions are known as Khonmueang in the North, Lao Isan in the Northeast, Central Thai in the Central, and Southern Thai or Khon Tai in the South. Among those four major Thai groups, Lao Isan is ethnically closer to Laotian. Lao Isan are ethnically Lao but citizens of Thailand; they were historically relocated from Laos during the 14th to 18th century A.D. (Vallibhotama, 1989; Myers, 2005; Mishra, 2010). Both Laotian and Lao Isan are regarded as the ethnic Lao group which makes up ∼62.53% of the total population in Laos and a major group, with a population of ∼15 million, in the northeast of Thailand (Rakow, 1992; Schliesinger, 2003; Schlemmer, 2017; Eberhard et al., 2020).
Beside the Lao Isan, northeastern Thailand especially in the lower part is home to ∼1.4 million AA-speaking Khmer people (Eberhard et al., 2020) and ∼400,000 AA-speaking Kuy or Suay people who are presently trilingual, speaking both Khmer and Lao in addition to Kuy language (Premsrirat, 1997; Eberhard et al., 2020). Numerous archaeological sites since around 6th century A.D. evidently attest that the Khmer are native to present-day northeastern Thailand prior to the arrival of the Lao (Coedes, 1968) whereas the Kuy migrated from southern Laos to northeastern Thailand around the 17th to 18th century A.D. (Sa-ard, 1984). Generally speaking, the AA-speaking Kuy in Laos nowadays are also one of the Lao Thoeng groups.
Several previous genetic studies of Laotian and Lao Isan were based on mitochondrial (mt) DNA and Y chromosome (Bodner et al., 2011; Kutanan et al., 2014; Kutanan et al., 2017; Kutanan et al., 2019; Kutanan et al., 2021) and genome-wide data (McColl et al., 2018; Tätte et al., 2019; Kutanan et al., 2021). However, data from forensic microsatellites or short tandem repeats (STRs) has been much less published, especially with populations from Laos (Srithawong et al., 2015, 2020). Furthermore, previous STRs data were based on 15 autosomal loci. However, more STRs can increase resolution for complex paternity cases, e.g., determining the true relationship between parent-child, siblings or half sibling (O’Connor et al., 2010; Alsafiah et al., 2019) and enhance the discrimination power in cases of partial DNA profiles and DNA mixtures (Haidar et al., 2021). Several forensic kits have been developed to expand the number of STR markers required for the Combined DNA Index System (CODIS) and for the European Standard Set (ESS) (Gill et al., 2006; Hares, 2015), e.g., VeriFiler Plus PCR Amplification Kit (Applied Biosystems, United States) which is a six-dye kit that can amplify 23 autosomal STR loci (D3S1358, vWA, D16S539, CSF1PO, TPOX, D8S1179, D21S11, D18S51, D2S441, D19S433, TH01, FGA, D22S1045, D5S818, D13S317, D7S820, D10S1248, D1S1656, D12S391, D2S1338, D6S1043, Penta D, Penta E), 1 insertion/deletion polymorphic marker on the Y chromosome (Y indel) and Amelogenin (sex-determining marker). This kit has already been validated following SWGDAM (Scientific Working Group on DNA Analysis Methods) guidelines (Al Janaahi, 2019; Alsafiah, 2019; Alsafiah et al., 2019; Green et al., 2021). This present study newly generated the genetic data of 451 Lao Isan from northeastern Thailand and Laotian from Laos, using the battery of VeriFiler Plus PCR Amplification Kit. We also reported population genetics results and established allelic frequency of 23 autosomal STRs which is beneficial for future forensic investigation in Thailand and Laos.
Materials and Methods
Samples Collection and Extraction
A total 451 genotypes that were newly generated for 23 autosomal STR loci belonged to ten populations: seven Lao Isan and three Laotian (two Lao Lum and one Lao Thoeng). Buccal swab samples of 39 volunteers from one Laotian population were newly collected from Savannakhet Province, southern Laos; this Austroasiatic-speaking Lao population (LA1) is called Lao Thoeng. To recruit samples, we interviewed volunteers to include subjects who were unrelated for at least two generations and then collected buccal samples with informed consent. Genomic DNA was extracted using the Gentra Puregene Buccal Cell Kit (Qiagen, Hilden, Germany) according to the manufacturer’s instructions. An additional 412 genomic DNA samples from other Laotian and Lao Isan populations were retrieved from previous studies (Kutanan et al., 2017; Srithawong et al., 2020; Kutanan et al., 2021) (Table 1). Ethical approval for this study was provided by Khon Kaen University for Lao Isan and Naresuan University for Laotian.
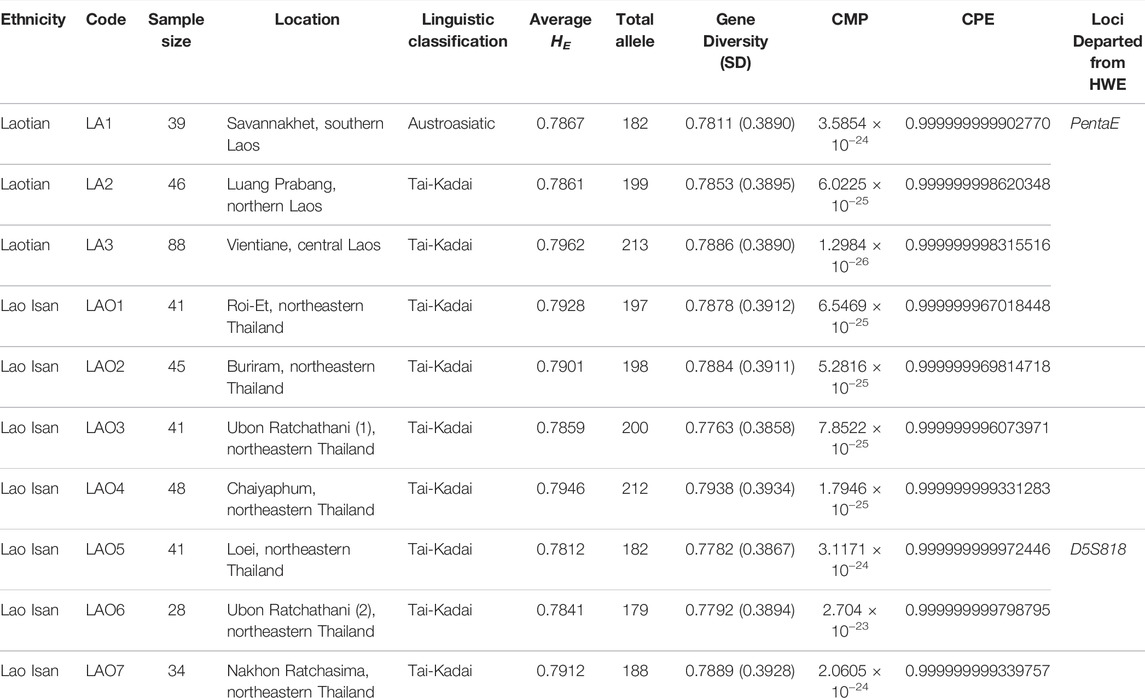
TABLE 1. General information of the studied populations, genetic diversity indices and forensic parameters.
DNA Amplification and STR Genotyping
We amplified 23 autosomal STR loci of all genomic samples using VerifilerTM plus PCR amplification kit in a reaction volume of 25 µl with 5 µl of VeriFiler™ Plus PCR Master Mix (Applied Biosystems), 2.5 µl of the primer mix, and the remaining 17.5 µl composed of DNA template and water to adjust the DNA input amount to reach 500 pg. Amplification process was carried out on GeneAmp™ PCR System 9700 in the following conditions; 95°C for 1 min; 2 cycles: 96°C for 10 s, 62°C for 90 s; 27 cycle: 96°C for 10 s, 59°C for 90 s; 60°C for 5 min; 4°C for ∞. The PCR products were genotyped by multi-capillary electrophoresis in an ABI 3500 genetic analyzer (Applied Biosystems). The genotyping data were analyzed by Gene Mapper software v.3.7 (Applied Biosystem).
Statistical Analyses
Arlequin v.3.5.2.2 (Excoffier and Lischer, 2010) was used to calculate allele frequency, Hardy–Weinberg equilibrium (HWE) p values, observed heterozygosity (HO), expected heterozygosity (HE), total alleles, and gene diversity (GD). Significant levels for the HWE were adjusted according to the sequential Bonferroni correction (α = 0.05/23) (Rice, 1989). We used STRAF (http://cmpg.unibe.ch/shiny/STRAF/), an online tool for STR data analysis (Gouy and Zieger, 2017), to compute several forensic parameters, i.e., power of discrimination (PD), matching probability (MP), polymorphic information content (PIC), power of exclusion (PE), and typical paternity index (TPI).
Among all 10 Lao Isan and Laotian populations, we first computed a genetic distance matrix based on number of different alleles (Fst) using Arlequin, then plotting a matrix in three dimensions by means of multidimensional scaling (MDS) using Statistica v.10 demo (StatSoft, Inc, United States). The heatmap visualization of Fst and MDS values were obtained using R package (R Development Core Team). To delineate cryptic population structure, a model-based cluster analysis was investigated by STRUCTURE 2.3.4 under the following prior parameters: admixture, correlated allele frequencies, and assistance of sampling locations (LOCPRIOR model) (Pritchard et al., 2000; Falush et al., 2003; Hubisz et al., 2009). We ran ten replications for each cluster (K) from 2 to 10 with burn-in length of 100,000 iterations followed by 200,000 iterations. The STRUCTURE outputs were merged to compute a second-order rate of change logarithmic likelihood between subsequent K values (△K) (Evanno et al., 2005) by STRUCTURE Harvester (Earl and vonHoldt, 2012) in order to discover the ideal K value in the data. CLUMPAK was used to construct a single-set result from 10 replications of STRUCTURE outputs to validate the dynamic approach determining the optimal similarity threshold for each value of K (Kopelman et al., 2015); CLUMPAK outputs were graphically modified by DISTRUCT (Rosenberg, 2003).
To reveal population relationships with other Thai populations, we collected previously published data of 15 STRs from 14 populations: BlackTai1, BlackTai2, Phutai, Phuan, Seak, Nyaw, Kaleang, Bru, Nyahkur, Mon, Soa, Khmer1, Khmer 2 and Suay (Srithawong et al., 2015; Chantakot et al., 2017; Srithawong et al., 2020). When the newly generated data of Lao Thoeng were combined with this published data, it provided a total raw 15 STRs genotype data of 1,039 samples belonging to 24 populations for subsequent analyses (Figure 1). As mentioned previously, the same software and parameters were employed to estimate genetic distances and genetic structure.
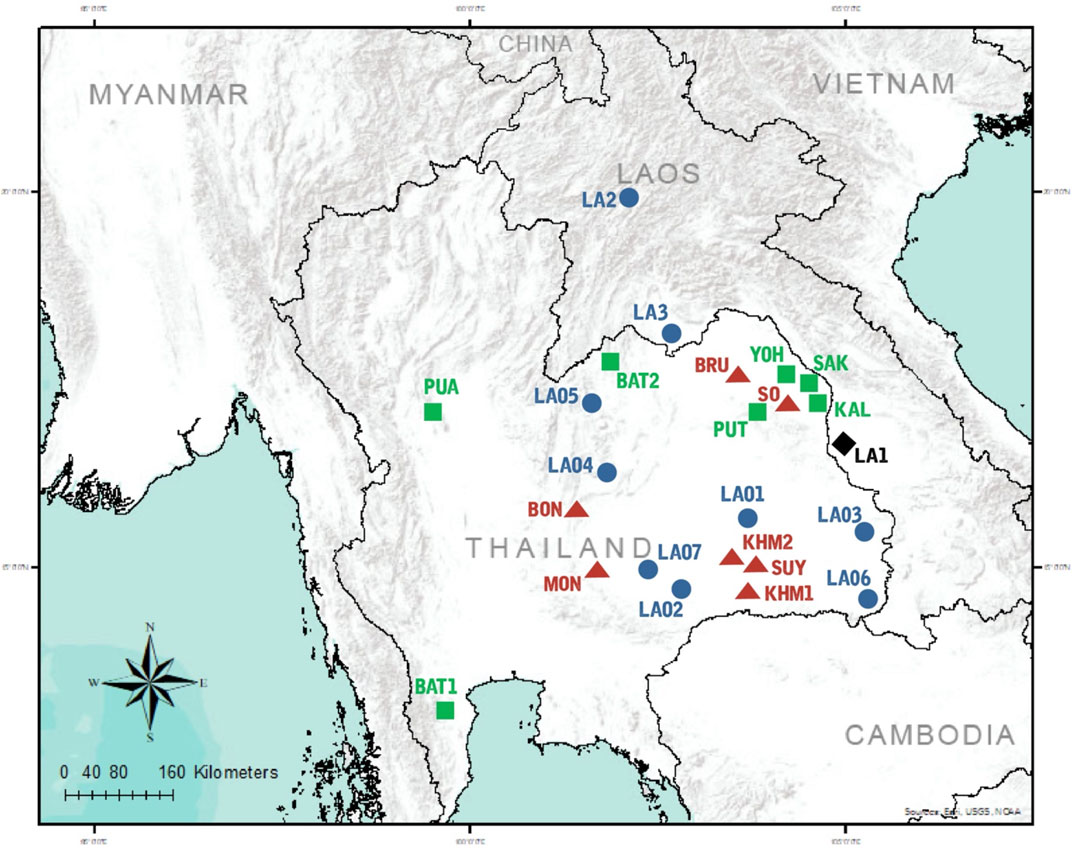
FIGURE 1. Map of sampling locations. 10 populations were sampled in the present study, combined with data from 14 populations collected in previous studies. Population codes are given in .Supplementary Table S16 Black diamond, blue circles, green squares, and red triangles represent AA-speaking Laotian, ethnic Lao group, compared TK-speaking and AA-speaking populations respectively.
Mantel test (Mantel, 1967) in Arlequin was used to estimate correlation between distance matrices of genetic vs. geography. Geographic distances (in form of great-circle distances) in Km between the approximate locations of each population were calculated from their latitudinal and longitudinal coordinates using an online tool (http://onlineconversion.com/map-greatcircle-distance.htm).
To get a more comprehensive picture of population linkages in Asia, we employed POPTREE v.2 (Takezaki et al., 2014) to build a neighbor-joining tree (NJ) based on Fst computation by allele frequency from 13 STRs with publicly accessible data from relevant populations (Brinkmann et al., 2002; Kim et al., 2003; Seah et al., 2003; De Ungria et al., 2005; Dobashi et al., 2005; Tie et al., 2006; Maruyama et al., 2008; Zhu et al., 2008; Untoro et al., 2009; Song et al., 2010; Kutanan et al., 2011; Yang et al., 2013; Zhai et al., 2014; Huang et al., 2015; Kutanan et al., 2015; Srithawong et al., 2015; Zhang, 2015a; Zhang, 2015b; Chantakot et al., 2017; Guo, 2017; Guo et al., 2017; Srithawong et al., 2020; Mawan et al., 2021).
Results and Discussion
Genetic Diversities and Forensic Parameters
A total of 451 individual raw genotypes are provided in Supplementary Table S1. The allelic frequency table of 23 STR loci in 10 individual studied populations are reported in Supplementary Table S2–S11. Hardy–Weinberg equilibrium (HWE) tests showed no significant deviation from expected values for all 23 loci (p > 0.05) after Bonferroni adjustment (0.05/23 = 0.002) in exception with PentaE in LAO1 and D5S818 in LAO5 (Table 1). The genetic diversity indices and forensic parameters, including average HE, total alleles, gene diversity (GD), forensic parameters; combined matching probability (CMP), combined power of exclusion (CPE) are presented in Table 1. The average HE is greater than 0.7 in all studied populations, ranging from 0.7962 (LA3) to 0.7812 (LAO5). Total number of alleles is highest in LA3 (213 alleles) and lowest in LAO6 (179 alleles). The GD ranges from 0.7763 ± 0.3858 in LAO3 to 0.7938 ± 0.3934 in LAO4.
The allelic frequency of 23 STR loci in the ethnic Lao groups (n = 412), comprising two Lao Lum (LA2-3) from Laos and seven Lao Isan (LAO1-7) from northeastern Thailand, is presented in Supplementary Table S12. Only two loci (D10S1248, TPOX) departed from the HWE (p > 0.05) after Bonferroni adjustment (0.05/23 = 0.002) (Supplementary Table S12). There are total 292 alleles, with the range of 8 alleles at D16S539 and D5S818 loci to 23 alleles at FGA locus and allelic frequency ranging from 0.0012 to 0.6163. Among the tested loci, FGA was the most polymorphic and discriminative locus with highest HE (0.8821), HO (0.9005), PIC (0.8699), TPI (5.0244), MP (0.0276), PD (0.9724) and PE (0.7964) with a combined power of discrimination (CPD) value of 0.999999999999999 and a CPE value of 0.999999995430163. The least polymorphic and discriminative locus was TPOX with the lowest HE (0.5629), HO (0.5122), PIC (0.5163), TPI (1.0250), MP (0.2391), PD (0.7609), PE (0.1984) (Supplementary Table S12).
We also reported the allele frequency based on the 23 STR loci of the combined Lao Isan (LAO1-7: n = 278) (Supplementary Table S13) and combined Laotian (LA1-3: n = 173) data (Supplementary Table S14). In Lao Isan dataset, there are 278 alleles varied from 8 alleles (D16S539 and D5S818) to 23 alleles (FGA) (Supplementary Table S13) with the allelic frequency ranging from 0.0018 to 0.6025 and only one locus (D10S1248) departed from HWE after Bonferroni correction (0.05/23 = 0.002). Among the tested loci, FGA was the most polymorphic and discriminative locus with highest HE (0.8837), HO (0.8957), PIC (0.8712), TPI (4.7931), MP (0.0275), PD (0.9725) and PE (0.7866) with a CPD value of 0.999999999999999 and a CPE value of 0.999999994092542. The least polymorphic and discriminative locus was TPOX with the lowest HE (0.5759), HO (0.5324), PIC (0.5280), TPI (1.0692), MP (0.2275), PD (0.7725), PE (0.2174) (Supplementary Table S13).
In the combined Laotian (LA1-3) dataset, all of loci are in agreement with HWE even after Bonferroni correction. The total number of alleles is 233, varying from 6 alleles at D3S1358, D16S539, TPOX to 19 alleles at FGA and allelic frequency ranging from 0.0029 to 0.6170 (Supplementary Table S14). Among the tested loci, FGA was the most polymorphic and discriminative locus with highest HE (0.8844), HO (0.9017), PIC (0.8706), TPI (5.0882), MP (0.0314), PD (0.9686) and PE (0.7990) with a CPD value of 0.999999999999999 and a CPE value of 0.999999998686772. The least polymorphic and discriminative locus was TPOX with the lowest HE (0.5633), HO (0.5118), PIC (0.5143), TPI (1.0241), MP (0.2432), PD (0.7568), PE (0.1980) (Supplementary Table S14).
This study provides additional forensic STR loci of Lao Isan and Laotian populations. After applying Bonferroni’s correction, there was absence of departure from Hardy–Weinberg equilibrium tests in several datasets (Supplementary Table S2–S4, S6–S8, S10–S11, S14), implying that the samples are representative and the data is credible. When the PD was larger than 0.80, a STR locus was considered highly polymorphic (Shriver et al., 1995). In the ethnic Lao dataset all loci except TPOX had a PD value of more than 0.80 (Supplementary Table S12, S13) while in the pooled Laotian populations, all other markers were found to be highly discriminative except for D3S1358 and TPOX, which showed PD values lower than 0.80 (Supplementary Table S14). All populations had high heterozygosity (average HE greater than 0.7) and high CPD values (more than 0.999999999999999) which reflects the high discriminatory power of these 23 loci. In addition, the CPE values were greater than 0.9999999 which indicate that these markers are undoubtedly acceptable for paternal and maternal identification in the studied populations (Al-Eitan and Tubaishat, 2016). Likewise, the CMP in individuals improved to values ranging from 2.704 × 10⁻²³ (LAO6) to 1.2984 × 10⁻²⁶ (LA3) in this study (Table 1), when compared with the result of CMP (ranged from 2.26 × 10⁻¹⁴ to 4.16 × 10⁻¹⁶) in previous studies using AmpFLSTR Identifiler kit (Srithawong et al., 2020). As a result of using these 23 loci, this statistic implies that the chances of two people in the population having the same genetic profile are almost negligible and VerifilerTM plus PCR amplification kit is an effective method for kinship analysis (Alsafiah, 2019; Alsafiah et al., 2019). The FGA and TPOX were respectively the loci showing highest and lowest TPI values in all combined datasets (Supplementary Table S12, S13, S14). Consistent with previous studies, TPOX was the least discriminative locus. While in this study FGA was the most informative locus, other studies have supported PentaE as the most powerful locus (Rodriguez et al., 2015; Sheng et al., 2018; Castillo et al., 2019; Chen et al., 2019; Naji et al., 2019; Shrivastava et al., 2019; Vu et al., 2021). Overall, the 23 STR loci in VerifilerTM plus PCR amplification kit could be valuable for forensic investigation in Thailand and Laos.
Genetic Affinity and Genetic Structure
To investigate genetic relationship between these 10 populations, three from Laos (LA1-3) and seven from northeastern Thailand (LAO1-7), we computed pairwise genetic distance (Fst) based on 23 STR loci and among 45 pairwise comparisons there are 36 pairs (80%) which showed statistical differences (p < 0.05) (Supplementary Table S15). In general, the results of distance-based clustering methods revealed that LA1 and LAO5 showed genetic divergence from other populations (Figures 2, 3). For the model-based clustering results revealed by STRUCTURE, we ran 10 iterations of consecutive clusters (K) from 2 to 10. The most appropriate △K are K = 5 and 7 (Supplementary Figure S1). The LA1 showed genetic differentiation from other groups with the presence of a purple component that also saw minor emergence in LAO3 (Figure 4), indicating a certain relatedness between them. The AA-speaking LA1 and TK-speaking LAO3 speak different language but the geographic locations of these two populations are close (Figure 1); they may have contact and gene flow between them. In addition, there is a small green component in LAO5 from Loei provinces (Figure 4), reflecting the differentiation of this group, consistent with previous study (Srithawong et al., 2020).
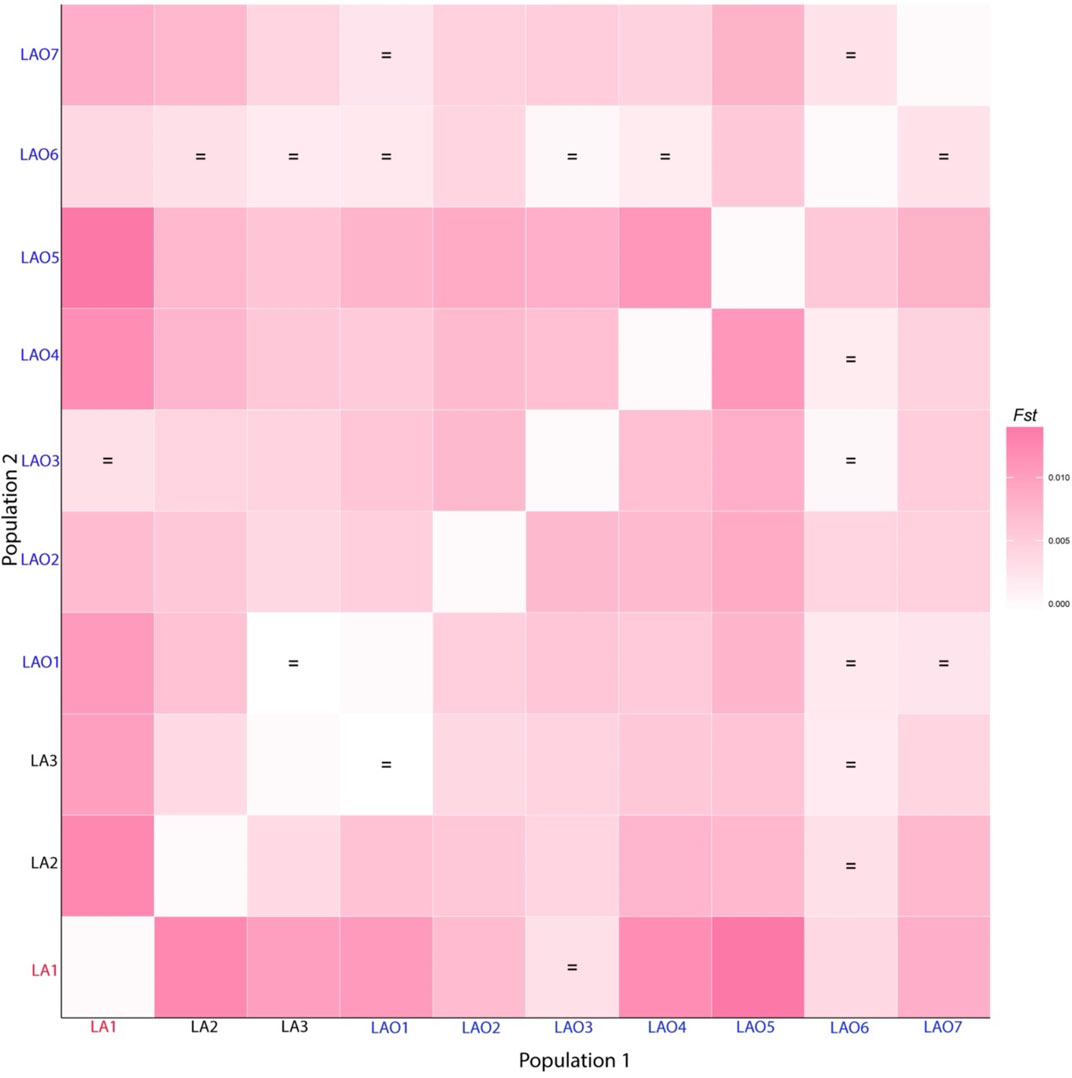
FIGURE 2. Heat plot of Fst values between 10 populations from Laos and Thailand. Population names are color-coded as red, black and blue representing AA-speaking Laotian, TK-speaking Laotians and Lao Isan, respectively. The “ = ” symbol indicates Fst values that are not significantly different from zero (p > 0.05).
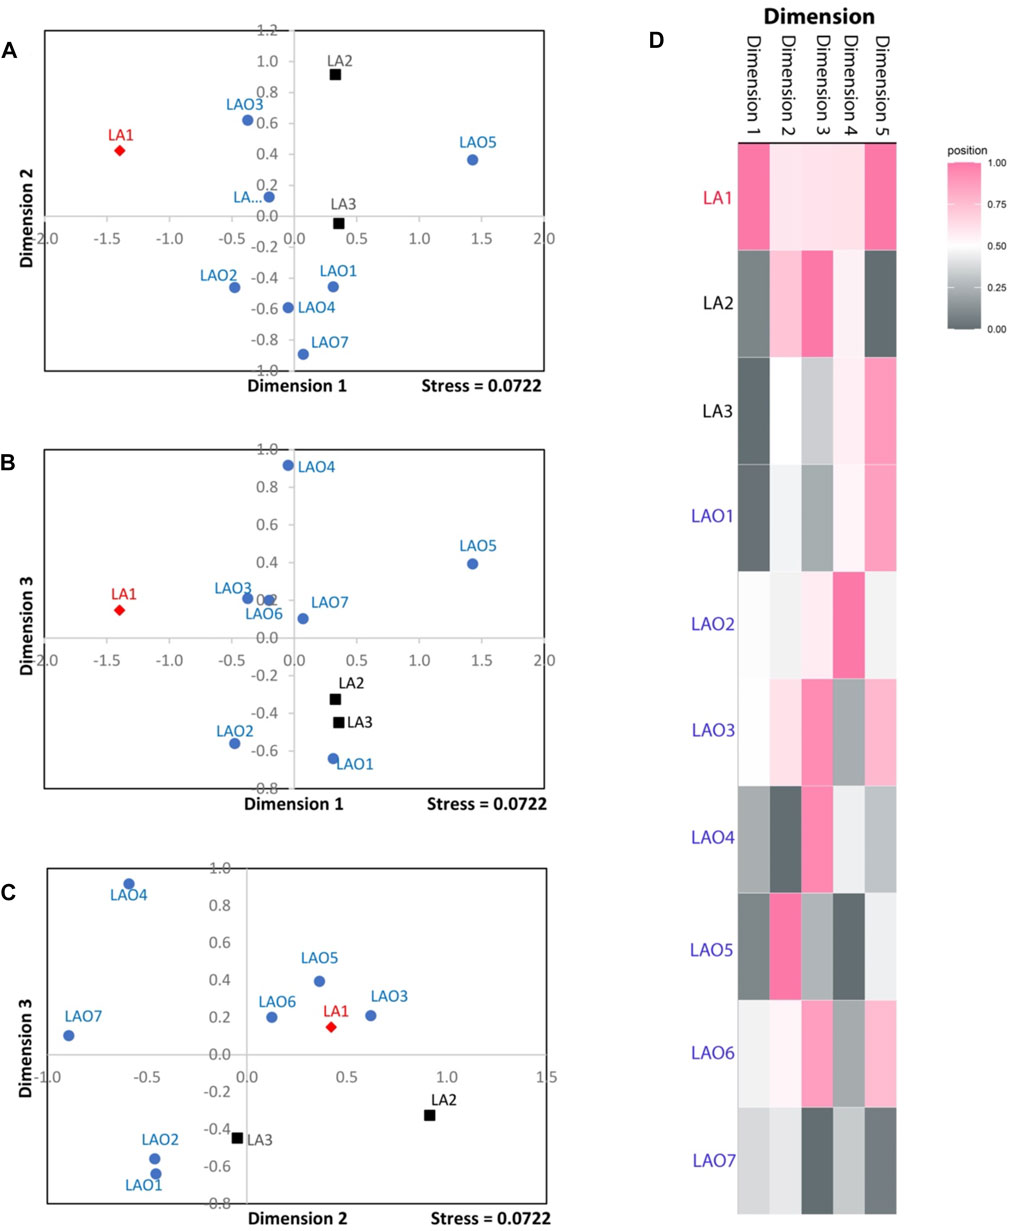
FIGURE 3. The three-dimensional MDS plot of dimension 1 vs. 2 (A), 1 vs. 3 (B) and 2 vs. 3 (C) of total 10 populations. The heat plot of standardized values of MDS with five dimensions (D). Red diamond, black squares, and blue circles represent AA-speaking Laotian, TK-speaking Laotians and Lao Isan populations, respectively.
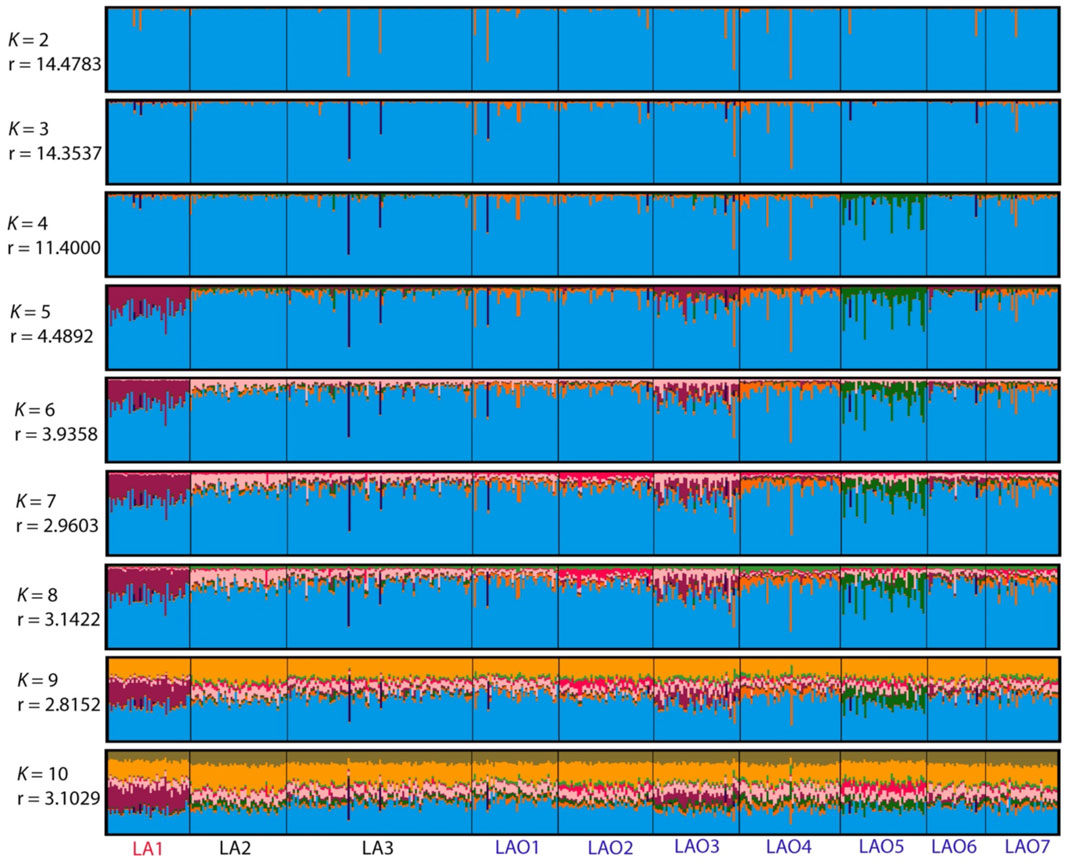
FIGURE 4. The STRUCTURE result of 10 populations from number of cluster (K) = 2 to 10. Each individual population is represented by a single column divided into segments whose size and colour correspond to the relative proportion of a particular cluster. Populations are separated by black lines. Population names are color-coded; red, black and blue represent AA-speaking Laotian, TK-speaking Laotians and Lao Isan populations, respectively. The parameters “r” indicate the informativeness of sampling location data.
To understand comprehensive genetic relationships among populations in northeastern Thailand and Laos, we retrieved genotypic data on 15 STRs of 14 populations from previous studies for comparison with present data (Supplementary Table S16). Again, the pairwise Fst value, three dimensions MDS plots and the model-based clustering STRUCTURE based on the 15 STR loci were analyzed. Among 276 pairwise comparisons of Fst value, there are 263 pairs (95.29%) with statistical differences (p < 0.05) (Supplementary Table S17). The ethnic Lao groups (LA2-3 and LAO1-7) showed a narrow range of Fst value, reflecting close genetic relatedness. Interestingly, with a reduced number of STRs, LA1 from southern Laos still showed significant relatedness to LAO3 from Thailand (Figure 5; Supplementary Table S17) and LAO6 showed genetic similarity to all of ethnic Lao populations (Figure 5). The MDS plots based of Fst value (Figures 6A–C) revealed an overall pattern of genetic homogeneity of TK speaking groups and genetic heterogeneity of AA speaking populations. The positions on the margin of MDS plots of AA-speaking LA1, BON, SUY, KHM2, SO and BRU and TK-speaking SAK and BAT2 reflect the genetic divergence of the others (Figures 6A,C,D). The STRUCTRUE results indicated that K = 6 is the most appropriate △K for describing sub-structuring of populations (Supplementary Figure S2) and at K = 6 all populations shared a common blue component with different proportions. In general, the AA speaking groups have reduced blue component but show additional various minor components, indicating their genetic differentiation from each other and from the TK speaking groups, which is consistent with previous mtDNA, Y chromosome and genome-wide studies (Kutanan et al., 2014; Kutanan et al., 2017; Kutanan et al., 2019; Kutanan et al., 2021). Genetic drift, isolation and population interactions with other groups are factors promoting genetic differentiations of AA speaking groups in Thailand (Kutanan et al., 2018; Kutanan et al., 2021). Interestingly, the AA-speaking LA1 and KHM2 groups and TK-speaking LAO3 share minor pink components (Figure 7), reflecting interactions among these groups. Although there is limited historical evidence supporting interactions among LA1 and KHM2, there were several reports about genetic connections between some AA-peaking populations in northeastern Thailand (Khmer, Kuy, Soa and Bru) and Lao Isan groups (Chantakot et al., 2017; Kutanan et al., 2019; 2021). Population admixture could explain a shared genetic component among these three groups.
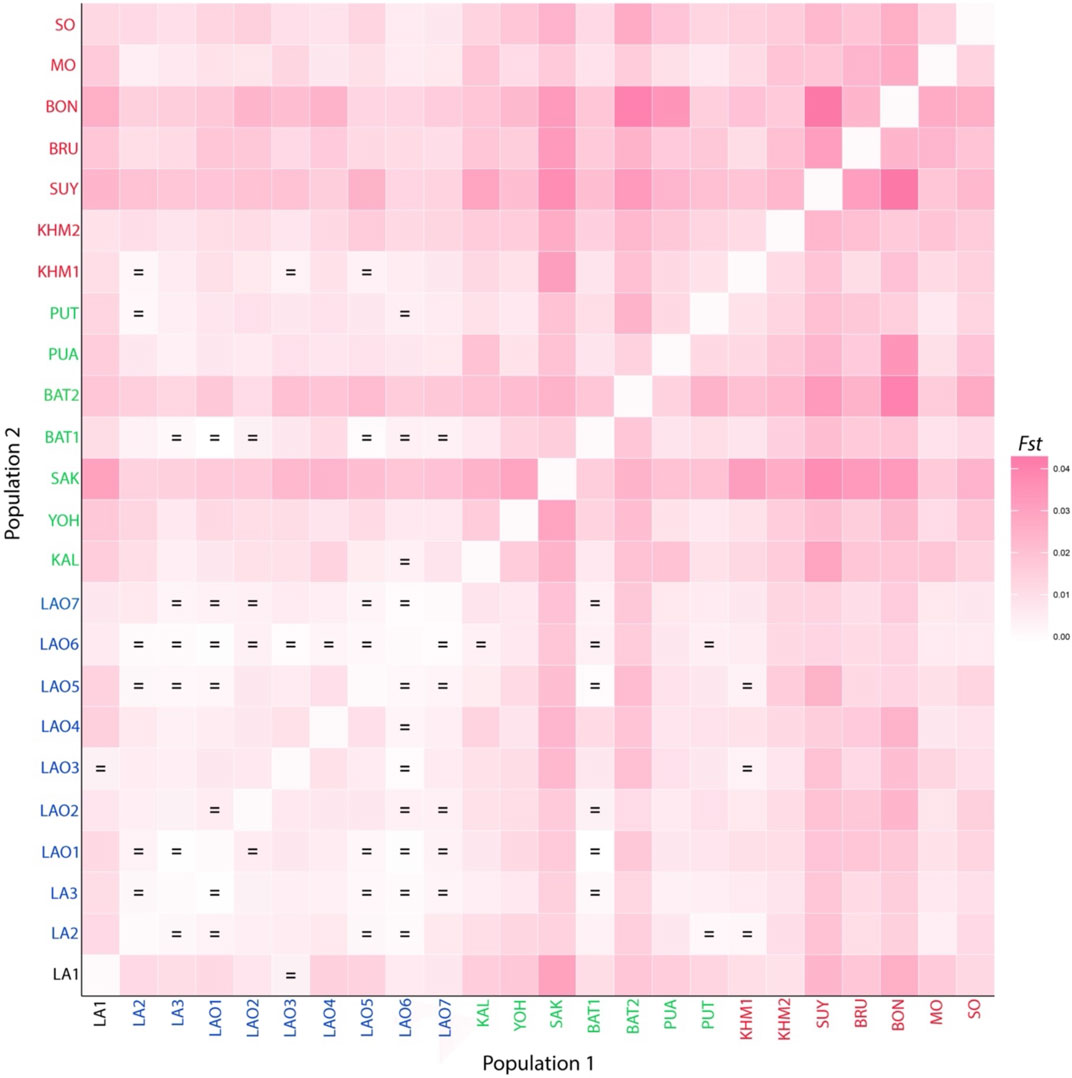
FIGURE 5. Heat plot of Fst values between 24 populations from Laos and Thailand. Population names are color-coded as black, blue, green and red representing AA-speaking Laotian, ethnic Lao group, compared TK-speaking and AA-speaking populations, respectively. The “ = ” symbol indicates Fst values that are not significantly different from zero (p > 0.05).
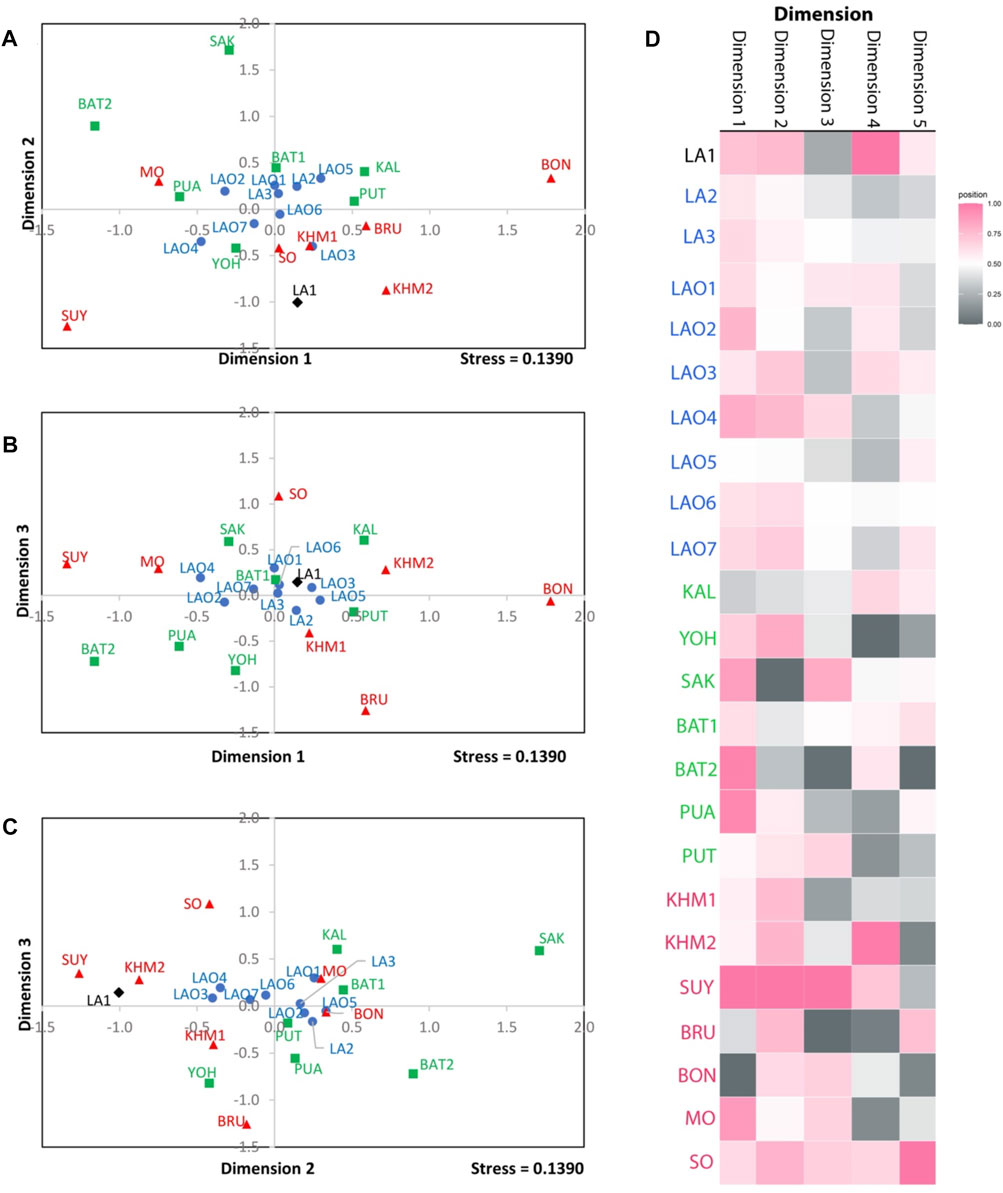
FIGURE 6. The three-dimensional MDS plots of dimension 1 vs. 2 (A), 1 vs. 3 (B) and 2 vs. 3 (C) of total 24 populations. The heat plot of standardized values of MDS with five dimensions (D). Black diamond, blue circles, green squares, and red triangles represent AA-speaking Laotian, ethnic Lao group, compared TK-speaking and AA-speaking populations respectively.
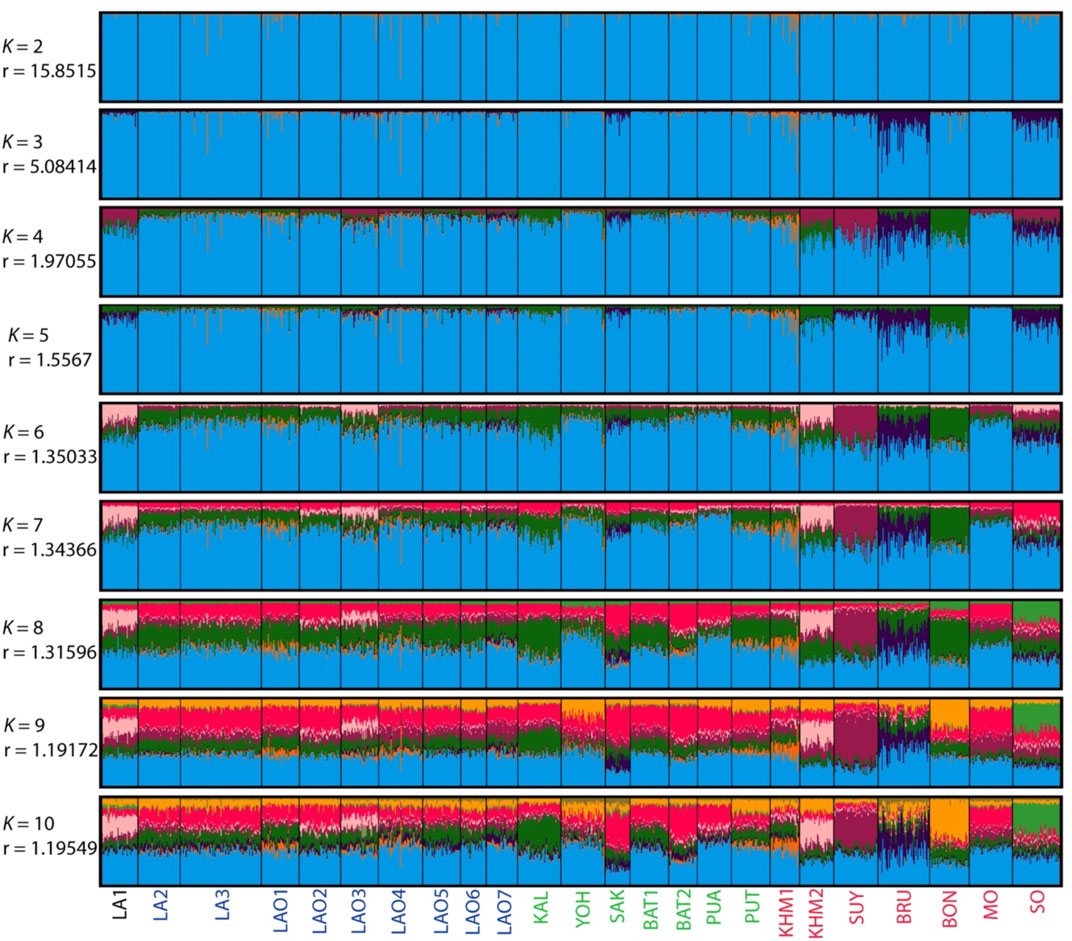
FIGURE 7. The STRUCTURE result of 24 populations from number of cluster (K) = 2 to 10. Each individual population is represented by a single column divided into segments whose size and colour correspond to the relative proportion of a particular cluster. Populations are separated by black lines. Population names are color-coded; black, blue, green and red represent AA-speaking Laotian, ethnic Lao group, comparing TK-speaking and AA-speaking populations, respectively. The parameters “r” indicate the informativeness of sampling location data.
Although some populations that lived in close geographic locations showed a certain similarity in genetic structures, e.g. LA1 and LAO3, Mantel testing showed that there were no correlations between genetic vs. geographic distances (r = 0.0689, p > 0.05 for dataset of 10 populations and r = -0.1570, p > 0.05 for dataset of 24 populations). Therefore, the overall genetic variation did not correlate with geography. In contrast to the previous study that reported correlation between mtDNA variations and geography in northeastern Thailand (Kutanan et al., 2014), this result indicates that genetic divergences between populations do not primarily influence by geography but other driving forces, e.g. genetic drift might be the probable driven factors, particularly in the AA speaking groups.
In sum, the present results indicate a genetic homogeneity of TK speaking groups in northeastern Thailand but some populations within the ethnic Lao groups exhibited their unique genetic characters, e.g. genetic distinction of LAO3 and LAO4 from the others and genetic similarity of LAO6 to other groups (Figure 5). This within-group heterogeneity was arisen from various sources as mentioned previously. We emphasize the important to study multiple samples from the same ethnic group that can provide more insights into genetic history of population.
Asian Phylogenetic Tree
A neighbor-joining (NJ) tree based on Fst computation by allele frequency of 13 STR loci was constructed to evaluate Asian population relationships. We pooled seven Lao Isan to one group due to their close genetic relationship and likewise, the two Laotians (LA2-3) were combined to one group (Lao Lum), while the LA1 was represented by Lao Thoeng (Figure 8). The Lao Isan, Lao Thoeng and Lao Lum were clustered on the same clade with AA-speaking Chaobon, Khmer, Soa, Suay and Khmu, reflecting genetic interaction between northeastern Thai and Lao populations and AA speaking groups. Previous Y chromosomal study indicated AA ancestry in Lao Isan groups (Kutanan et al., 2019) and recent genome-wide study also supports genetic relatedness among TK-speaking groups in northeastern Thailand and Laos with AA-speaking populations, especially the Khmuic-Katuic groups (Kutanan et al., 2021).
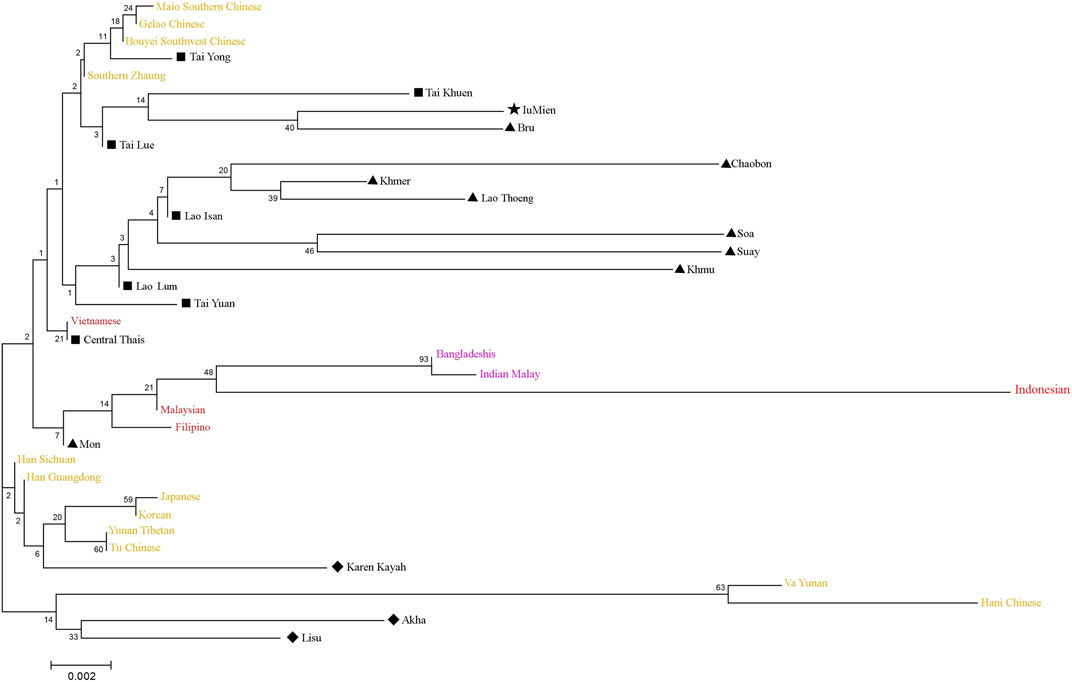
FIGURE 8. Neighbor-joining tree constructed from FST genetic distance based on the allelic frequencies of 13 STR loci among total 37 populations. The comparative populations from China/East Asia, Southeast Asia and South Asia were represented by yellow, red and purple, respectively. Populations from Thailand were indicated with black and different symbols. Diamonds, triangles, star, and squares represent ST-, AA-, HM-, and TK-speaking populations, respectively.
Conclusion
This study genotyped 23 autosomal forensic STRs using VerifilerTM plus PCR amplification kit of the ethnic Lao groups from northeastern Thailand and Laos and AA-speaking Laotian from southern Laos. Although there have been some previous investigations on STRs in the region, only 15 loci were previously published. Here, we expanded the study, genotyping 23 STR loci, of which 8: D2S441, D22S1045, D10S1248, D1S1656, D12S391, D6S1043, Penta D, and Penta E were firstly reported. We generated allelic frequency table, calculated forensic parameters and investigated genetic relationships among populations. Previously there were much less forensic STRs data produced in Laos, compared to Thailand; this present study established the complete allelic frequency of STRs. Although no STRs in Laotians showed significant departure from HWE and few loci departed from HWE in other datasets, all forensic parameters indicate that this kit is suitable for forensic investigation. Genetic characterization showed that AA-speaking Laotian from southern Laos was genetically different from northern and central Lao groups who speak TK languages. In fact, the southern Laotian was more related to Lao Isan who live in vicinity. Although the Lao Isan migrated from Laos ∼200 years ago, the ethnic Lao groups (Lao Isan and TK-speaking Laotian) still showed closer genetic relatedness than the other ethnolinguistic groups, reflecting a common ancestry. In sum, the STRs allelic frequency results strengthen the regional forensic database in both countries and provide the genetic backgrounds of populations that are useful for anthropological research.
Data Availability Statement
The datasets presented in this study can be found in online repositories. The names of the repository/repositories and accession number(s) can be found in the article/Supplementary Material.
Ethics Statement
The studies involving human participants were reviewed and approved by Khon Kaen University and Naresuan University ethic committee. The patients/participants provided their written informed consent to participate in this study.
Author Contributions
WK conceived and designed the project; CS, SL, SS, and MS collected samples; SS, WW KT, and KM generated data; KT and SS carried out the data analyses; KT and WK prepared the original draft. All authors reviewed and edited the final draft. WK and KT revised the manuscript.
Conflict of Interest
The authors declare that the research was conducted in the absence of any commercial or financial relationships that could be construed as a potential conflict of interest.
Publisher’s Note
All claims expressed in this article are solely those of the authors and do not necessarily represent those of their affiliated organizations, or those of the publisher, the editors and the reviewers. Any product that may be evaluated in this article, or claim that may be made by its manufacturer, is not guaranteed or endorsed by the publisher.
Acknowledgments
We would like to thank village chief and participants who donated their biological samples. KT was supported by KKU Scholarship for ASEAN and GMS Countries’ Personal, Academic Year 2020. CS was supported by the Thailand science research and innovation fund and the University of Phayao (Grant Nos. FF65-UoE003). W.W. was supported by National Research Council of Thailand (NRCT) (Grant Nos. N41A640275). SS was funded by the Post-Doctoral Training Program from Khon Kaen University, Thailand (PD-2564–10). WK and KM was funded by Khon Kaen University.
Supplementary Material
The Supplementary Material for this article can be found online at: https://www.frontiersin.org/articles/10.3389/fgene.2022.954586/full#supplementary-material
References
Al Janaahi, N. S. (2019). Forensic Evaluation of 6-Dye Chemistry Kit Composed of 23 Loci with Casework Samples. Biology Theses, 20. Available at: https://scholarworks.uaeu.ac.ae/bio_theses/20.
Al-Eitan, L. N., and Tubaishat, R. R. (2016). Evaluation of Forensic Genetic Efficiency Parameters of 22 Autosomal STR Markers (PowerPlex Fusion System) in a Population Sample of Arab Descent from Jordan. Aust. J. Forensic Sci. 50, 97–109. doi:10.1080/00450618.2016.1212401
Alsafiah, H. M., Aljanabi, A. A., Hadi, S., Alturayeif, S. S., and Goodwin, W. (2019). An Evaluation of the SureID 23comp Human Identification Kit for Kinship Testing. Sci. Rep. 9, 16859. doi:10.1038/s41598-019-52838-7
Alsafiah, H. M. (2019). Evaluation of DNA Polymorphisms for Kinship Testing in the Population of Saudi Arabia. PhD thesis. The University of Central Lancashire.
Arnamwat, T. (1985). Thai-history: From the Past to the End of Aryutthaya Era. Bangkok: Amorn Karn Pim, 166.
Bodner, M., Zimmermann, B., Röck, A., Kloss-Brandstätter, A., Horst, D., Horst, B., et al. (2011). Southeast Asian Diversity: First Insights into the Complex mtDNA Structure of Laos. BMC Evol. Biol. 11 (1), 49. doi:10.1186/1471-2148-11-49
Brinkmann, B., Shimada, I., Tuyen, N., and Hohoff, C. (2002). Allele Frequency Data for 16 STR Loci in the Vietnamese Population. Int. J. Leg. Med. 116 (4), 246–248. doi:10.1007/s00414-002-0313-z
Castillo, A., Pico, A., Gil, A., Gusmão, L., and Vargas, C. (2019). Genetic Variation of 23 STR Loci in a Northeast Colombian Population (Department of Santander). Forensic Sci. Int. Genet. Suppl. Ser. 7, 33–35. doi:10.1016/j.fsigss.2019.09.015
Chantakot, P., Srithongdang, K., Srithawong, S., Boonsoda, P., Pittayaporn, P., and Kutanan, W. (2017). Genetic Divergence of Austroasiatic Speaking Groups in the Northeast of Thailand: A Case Study on Northern Khmer and Kuy. Chiang Mai J. Sci. 44, 1279–1294.
Chen, P., Adnan, A., Rakha, A., Wang, M., Zou, X., Mo, X., et al. (2019). Population Background Exploration and Genetic Distribution Analysis of Pakistan Hazara via 23 Autosomal STRs. Ann. Hum. Biol. 46, 514–518. doi:10.1080/03014460.2019.1673483
De Ungria, M. C. A., Roby, R. K., Tabbada, K. A., Rao-Coticone, S., Tan, M. M. M., and Hernandez, K. N. (2005). Allele Frequencies of 19 STR Loci in a Philippine Population Generated Using AmpFlSTR Multiplex and ALF Singleplex Systems. Forensic Sci. Int. 152 (2-3), 281–284. doi:10.1016/j.forsciint.2004.09.125
Dobashi, Y., Kido, A., Fujitani, N., Hara, M., Susukida, R., and Oya, M. (2005). STR Data for the AmpFLSTR Identifiler Loci in Bangladeshi and Indonesian Populations. Leg. Med. 7 (4), 222–226. doi:10.1016/j.legalmed.2005.04.001
Earl, D. A., and vonHoldt, B. M. (2012). STRUCTURE HARVESTER: a Website and Program for Visualizing STRUCTURE Output and Implementing the Evanno Method. Conserv. Genet. Resour. 4, 359–361. doi:10.1007/s12686-011-9548-7
Eberhard, D. M., Simons, G. F., and Fennig, C. D. (2020). Ethnologue: Languages of the World. 23rd ed. Dallas, Texas, USA: SIL International.
Evanno, G., Regnaut, S., and Goudet, J. (2005). Detecting the Number of Clusters of Individuals Using the Software STRUCTURE: a Simulation Study. Mol. Ecol. 14, 2611–2620. doi:10.1111/j.1365-294x.2005.02553.x
Excoffier, L., and Lischer, H. E. L. (2010). Arlequin Suite Ver 3.5: a New Series of Programs to Perform Population Genetics Analyses under Linux and Windows. Mol. Ecol. Resour. 10, 564–567. doi:10.1111/j.1755-0998.2010.02847.x
Falush, D., Stepheas, M., and Pritchard, J. K. (2003). Inference of Population Structure Using Multilocus Genotype Data: Linked Loci and Correlated Allele Frequencies. Genetics 164, 156–187. doi:10.1093/genetics/164.4.1567
Gill, P., Fereday, L., Morling, N., and Schneider, P. M. (2006). New Multiplexes for Europe-Amendments and Clarification of Strategic Development. Forensic Sci. Int. 163, 155–157. doi:10.1016/j.forsciint.2005.11.025
Gouy, A., and Zieger, M. (2017). STRAF-A Convenient Online Tool for STR Data Evaluation in Forensic Genetics. Forensic Sci. Int. Genet. 30, 148–151. doi:10.1016/j.fsigen.2017.07.007
Green, R., Elliott, J. L., Norona, W., Go, F., Nguyen, V. T., Ge, J., et al. (2021). Developmental Validation of VeriFiler Plus PCR Amplification Kit: A 6-dye Multiplex Assay Designed for Casework Samples. Forensic Sci. Int. Genet. 53, 102494. doi:10.1016/j.fsigen.2021.102494
Guo, F. (2017). Allele Frequencies of 17 Autosomal STR Loci in the Va Ethnic Minority from Yunnan Province, Southwest China. Int. J. Leg. Med. 131, 1251–1252. doi:10.1007/s00414-017-1620-8
Guo, F., Li, J., Wei, T., Ye, Q., and Chen, Z. (2017). Genetic Variation of 17 Autosomal STR Loci in the Zhuang Ethnic Minority from Guangxi Zhuang Autonomous Region in the South of China. Forensic Sci. Int. Genet. 28, e51–e52. doi:10.1016/j.fsigen.2017.03.015
Haidar, M., Abbas, F. A., Alsaleh, H., and Haddrill, P. R. (2021). Population Genetics and Forensic Utility of 23 Autosomal PowerPlex Fusion 6C STR Loci in the Kuwaiti Population. Sci. Rep. 11, 1865. doi:10.1038/s41598-021-81425-y
Hares, D. R. (2015). Selection and Implementation of Expanded CODIS Core Loci in the United States. Forensic Sci. Int. Genet. 17, 33–34. doi:10.1016/j.fsigen.2015.03.006
Huang, Y., Yao, J., Li, J., Wen, J., Yuan, X., and Xu, B. (2015). Population Genetic Data for 17 Autosomal STR Markers in the Hani Population from China. Int. J. Leg. Med. 129, 995–996. doi:10.1007/s00414-015-1176-4
Hubisz, M. J., Falush, D., Stephens, M., and Pritchard, J. K. (2009). Inferring Weak Population Structure with the Assistance of Sample Group Information. Mol. Ecol. Resour. 9, 1322–1332. doi:10.1111/j.1755-0998.2009.02591.x
Ireson, C. J., and Ireson, W. R. (1991). Ethnicity and Development in Laos. Asian Surv. 31 (10), 920–937. doi:10.2307/2645064
Keyes, C. (1967). Isan: Regionalism in Northeastern Thailand. New York: Department of Asian Studies, Southeast Asia Program, Cornell University.
Kim, Y. L., Hwang, J. Y., Kim, Y. J., Lee, S., Chung, N. G., Goh, H. G., et al. (2003). Allele Frequencies of 15 STR Loci Using AmpF/STR Identifiler Kit in a Korean Population. Forensic Sci. Int. 136 (1-3), 92–95. doi:10.1016/s0379-0738(03)00255-x
Kopelman, N. M., Mayzel, J., Jakobsson, M., Rosenberg, N. A., and Mayrose, I. (2015). Clumpak: a Program for Identifying Clustering Modes and Packaging Population Structure Inferences acrossK. Mol. Ecol. Resour. 15, 1179–1191. doi:10.1111/1755-0998.12387
Kutanan, W., Kampuansai, J., Srikummool, M., Kangwanpong, D., Ghirotto, S., Brunelli, A., et al. (2017). Complete Mitochondrial Genomes of Thai and Lao Populations Indicate an Ancient Origin of Austroasiatic Groups and Demic Diffusion in the Spread of Tai-Kadai Languages. Hum. Genet. 136 (1), 85–98. doi:10.1007/s00439-016-1742-y
Kutanan, W., Ghirotto, S., Bertorelle, G., Srithawong, S., Srithongdaeng, K., Pontham, N., et al. (2014). Geography Has More Influence Than Language on Maternal Genetic Structure of Various Northeastern Thai Ethnicities. J. Hum. Genet. 59 (9), 512–520. doi:10.1038/jhg.2014.64
Kutanan, W., Kampuansai, J., Brunelli, A., Ghirotto, S., Pittayaporn, P., Ruangchai, S., et al. (2018). New Insights from Thailand into the Maternal Genetic History of Mainland Southeast Asia. Eur. J. Hum. Genet. 26 (6), 898–911. doi:10.1038/s41431-018-0113-7
Kutanan, W., Kampuansai, J., Colonna, V., Nakbunlung, S., Lertvicha, P., Seielstad, M., et al. (2011). Genetic Affinity and Admixture of Northern Thai People along Their Migration Route in Northern Thailand: Evidence from Autosomal STR Loci. J. Hum. Genet. 56 (2), 130–137. doi:10.1038/jhg.2010.135
Kutanan, W., Kampuansai, J., Srikummool, M., Brunelli, A., Ghirotto, S., Arias, L., et al. (2019). Contrasting Paternal and Maternal Genetic Histories of Thai and Lao Populations. Mol. Biol. Evol. 36, 1490–1506. doi:10.1039/molbev/msz08310.1093/molbev/msz083
Kutanan, W., Liu, D., Kampuansai, J., Srikummool, M., Srithawong, S., Shoocongdej, R., et al. (2021). Reconstructing the Human Genetic History of Mainland Southeast Asia: Insights from Genome-wide Data from Thailand and Laos. Mol. Biol. Evol. 38 (8), 3459–3477. doi:10.1101/2020.12.24.42429410.1093/molbev/msab124
Kutanan, W., Srikummool, M., Pittayaporn, P., Seielstad, M., Kangwanpong, D., Kumar, V., et al. (2015). Admixed Origin of the Kayah (Red Karen) in Northern Thailand Revealed by Biparental and Paternal Markers. Ann. Hum. Genet. 79 (2), 108–121. doi:10.1111/ahg.12100
Mantel, N. (1967). The Detection of Disease Clustering and a Generalized Regression Approach. Cancer Res. 27, 209–220.
Maruyama, S., Minaguchi, K., Takezaki, N., and Nambiar, P. (2008). Population Data on 15 STR Loci Using AmpF/STR Identifiler Kit in a Malay Population Living in and Around Kuala Lumpur, Malaysia. Leg. Med. 10, 160–162. doi:10.1016/j.legalmed.200711.00210.1016/j.legalmed.2007.11.002
Mawan, A., Prakhun, N., Muisuk, K., Srithawong, S., Srikummool, M., Kampuansai, J., et al. (2021). Autosomal Microsatellite Investigation Reveals Multiple Genetic Components of the Highlanders from Thailand. Genes 12, 383. doi:10.3390/genes12030383
McColl, H., Racimo, F., Vinner, L., Demeter, F., Gakuhari, T., Moreno-Mayar, J. V., et al. (2018). The Prehistoric Peopling of Southeast Asia. Science 361, 88–92. doi:10.1126/science.aat3628
Myers, R. L. (2005). The Isan Saga: The Inhabitants of Rural Northeast Thailand and Their Struggle for Identity, Equality and Acceptance (1964-2004) (Master's Thesis). San Diego, CA: San Diego State University.
Naji, M., Damji, R., Adan, A., Abu Qamar, S., and Alghafri, R. (2019). Population Genetics Data of 23 Autosomal STR Loci for Three Populations in United Arab Emirates. Forensic Sci. Int. Genet. Suppl. Ser. 7, 187–188. doi:10.1016/j.fsigss.2019.09.073
O’Connor, K. L., Butts, E., Hill, C. R., Butler, J. M., and Vallone, P. M. (2010). Evaluating the Effect of Additional Forensic Loci on Likelihood Ratio Values for Complex Kinship Analysis (The 21st International Symposium on Human Identification).
Premsrirat, S. (1997). Linguistic Contributions to the Study of the Northern Khmer Language of Thailand in the Last Two Decades. Mon-Khmer Stud. 27, 129–136.
Pritchard, J. K., Stephens, M., and Donnelly, P. (2000). Inference of Population Structure Using Multilocus Genotype Data. Genetics 155 (2), 945–959. doi:10.1093/genetics/155.2.945
Promega (1999). Powerstats Version 1.2, Tools for Analysis of Population Statistics. Available at: https://www.promega.com.cn/products/genetic-identity.
Rakow, M. R. (1992181p). Laos and Laotians. Honolulu: Center for Southeast Asian Studies, School of Hawaiian, Asian and Pacific Studies, University of Hawaii at Manoa.
Rice, W. R. (1989). Analyzing Tables of Statistical Tests. Evolution 43, 223–225. doi:10.1111/j.1558-5646.1989.tb04220.x
Rodriguez, J. J. R. B., Salvador, J. M., Calacal, G. C., Laude, R. P., and De Ungria, M. C. A. (2015). Allele Frequencies of 23 Autosomal Short Tandem Repeat Loci in the Philippine Population. Leg. Med. 17, 295–297. doi:10.1016/j.legalmed.2015.02.005
Rosenberg, N. A. (2003). DISTRUCT: a Program for the Graphical Display of Population Structure. Mole Ecol. Notes 4, 137–138. doi:10.1046/j.1471-8286.2003.00566.x
Schlemmer, G. (2017). Ethnic Belonging in Laos: A Politico-Historical Perspective. Changing Lives. New Perspectives on Society, Politics and Culture in Laos. Available at: https://hal.archives-ouvertes,fr/hal-01853834.
Schliesinger, J. (2003). Ethnic Groups of Laos: Profiles of Austro-Thai-speaking Peoples. Bangkok, Thailand: White Lotus Press.
Seah, L. H., Jeevan, N. H., Othman, M. I., Jaya, P., Ooi, Y. S., Wong, P. C., et al. (2003). STR Data for the AmpFlSTR Identifiler Loci in Three Ethnic Groups (Malay, Chinese, Indian) of the Malaysian Population. Forensic Sci. Int. 138, 134–137. doi:10.1016/j.forsciint.2003.09.005
Sheng, X., Wang, Y., Zhang, J., Chen, L., Lin, Y., Zhao, Z., et al. (2018). Forensic Investigation of 23 Autosomal STRs and Application in Han and Mongolia Ethnic Groups. Forensic Sci. Res. 3, 138–144. doi:10.1080/20961790.2018.1428782
Shrivastava, P., Kaitholia, K., Kumawat, R. K., Dixit, S., Dash, H. R., Srivastava, A., et al. (2019). Forensic Effectiveness and Genetic Distribution of 23 Autosomal STRs Included in Verifiler PlusTM Multiplex in a Population Sample from Madhya Pradesh, India. Int. J. Leg. Med. 134, 1327–1328. doi:10.1007/s00414-019-02172-4
Shriver, M. D., Jin, L., Boerwinkle, E., Deka, R., Ferrell, R. E., and Chakraborty, R. (1995). A Novel Measure of Genetic Distance for Highly Polymorphic Tandem Repeat Loci. Mol. Biol. Evol. 12 (5), 914–920. doi:10.1093/oxfordjournals.molbev.a040268
Song, X.-b., Zhou, Y., Ying, B.-w., Wang, L.-l., Li, Y.-s., Liu, J.-f., et al. (2010). Short-tandem Repeat Analysis in Seven Chinese Regional Populations. Genet. Mol. Biol. 33, 605–609. doi:10.1590/s1415-47572010000400002
Srithawong, S., Muisuk, K., Srikummool, M., Mahasirikul, N., Triyarach, S., Sriprasert, K., et al. (2020). Genetic Structure of the Ethnic Lao Groups from Mainland Southeast Asia Revealed by Forensic Microsatellites. Ann. Hum. Genet. 84, 357–369. doi:10.1111/ahg.12379
Srithawong, S., Srikummool, M., Pittayaporn, P., Ghirotto, S., Chantawannakul, P., Sun, J., et al. (2015). Genetic and Linguistic Correlation of the Kra-Dai-Speaking Groups in Thailand. J. Hum. Genet. 60, 371–380. doi:10.1038/jhg.2015.32
Takezaki, N., Nei, M., and Tamura, K. (2014). POPTREEW: Web Version of POPTREE for Constructing Population Trees from Allele Frequency Data and Computing Some Other Quantities. Mol. Biol. Evol. 31, 1622–1624. doi:10.1093/molbev/msu093
Tätte, K., Pagani, L., Pathak, A. K., Kõks, S., Ho Duy, B., Ho, X. D., et al. (2019). The Genetic Legacy of Continental Scale Admixture in Indian Austroasiatic Speakers. Sci. Rep. 9, 3818. doi:10.1038/s41598-019-40399-8
Teerawit, K. (2001). Thai-Lao Relations in Laotian Perception. Bangkok: Chulalongkorn Printing house.
Tie, J., Wang, X., and Oxida, S. (2006). Genetic Polymorphisms of 15 STR Loci in a Japanese Population. J. Forensic Sci. 51, 188–189. doi:10.1111/j.1556-4029.2005.00037.x
Untoro, E., Atmadja, D. S., Pu, C.-E., and Wu, F.-C. (2009). Allele Frequency of CODIS 13 in Indonesian Population. Leg. Med. 11 (Suppl. 1), S203–S205. doi:10.1016/j.legalmed.2009.01.007
Vallibhotama, S. (1989). A Northeastern Site of Civilization: New Archeolgical Evidence to Change the Face of Thai History. Bangkok, Thailand: Matichon.
Vu, T. T. H., Do, T. T. M., Nguyen, T. H., and Luyen, Q. H. (2021). Allele Frequencies of 23 Short Tandem Repeat Loci in the Vietnamese Kinh Population. Forensic Sci. Int. Rep. 3, 100210. doi:10.1016/j.fsir.2021.100210
Yang, L., Zhao, Y., Liu, C., Chan, D. W. T., Chan, M., and He, M. (2013). Allele Frequencies of 15 STRs in Five Ethnic Groups (Han, Gelao, Jing, Shui and Zhuang) in South China. Forensic Sci. Int. Genet. 7, e9–e14. doi:10.1016/j.fsigen.2012.10.009
Zhai, D., Yang, J., Huang, Y., Chen, L., Wu, D., Wu, J., et al. (2014). The Allele Frequency of 15 STRs Among Three Tibeto-Burman-Speaking Populations from the Southwest Region of Mainland China. Forensic Sci. Int. Genet. 13, e22–e24. doi:10.1016/j.fsigen.2014.09.001
Zhang, L. (2015b). Population Data for 15 Autosomal STR Loci in the Bouyei Ethnic Minority from Guizhou Province, Southwest China. Forensic Sci. Int. Genet. 17, 108–109. doi:10.1016/j.fsigen.2015.04.006
Zhang, L. (2015a). Population Data for 15 Autosomal STR Loci in the Dong Ethnic Minority from Guizhou Province, Southwest China. Forensic Sci. Int. Genet. 16, 237–238. doi:10.1016/j.fsigen.2015.02.005
Keywords: laotian, Lao isan, strs, verifiler TM plus PCR amplification kit, Laos
Citation: Than KZ, Muisuk K, Woravatin W, Suwannapoom C, Srikummool M, Srithawong S, Lorphengsy S and Kutanan W (2022) Genetic Structure and Forensic Utility of 23 Autosomal STRs of the Ethnic Lao Groups From Laos and Thailand. Front. Genet. 13:954586. doi: 10.3389/fgene.2022.954586
Received: 27 May 2022; Accepted: 20 June 2022;
Published: 07 July 2022.
Edited by:
Guanglin He, Nanyang Technological University, SingaporeReviewed by:
Daixin Huang, Huangdaixin, ChinaXiaoye Jin, Xi’an Jiaotong University Health Science Center, China
Lingxiang Wang, Fudan University, China
Copyright © 2022 Than, Muisuk, Woravatin, Suwannapoom, Srikummool, Srithawong, Lorphengsy and Kutanan. This is an open-access article distributed under the terms of the Creative Commons Attribution License (CC BY). The use, distribution or reproduction in other forums is permitted, provided the original author(s) and the copyright owner(s) are credited and that the original publication in this journal is cited, in accordance with accepted academic practice. No use, distribution or reproduction is permitted which does not comply with these terms.
*Correspondence: Wibhu Kutanan, d2liaHVAa2t1LmFjLnRo