Abstract
Identifying the genetic components underlying yield-related traits in soybean is crucial for improving its production and productivity. Here, 211 soybean genotypes were evaluated across six environments for four yield-related traits, including seed yield per plant (SYP), number of pods per plant number of seeds per plant and 100-seed weight (HSW). Genome-wide association study (GWAS) and genomic prediction (GP) analyses were performed using 12,617 single nucleotide polymorphism markers from NJAU 355K SoySNP Array. A total of 57 SNPs were significantly associated with four traits across six environments and a combined environment using five Genome-wide association study models. Out of these, six significant SNPs were consistently identified in more than three environments using multiple GWAS models. The genomic regions (±670 kb) flanking these six consistent SNPs were considered stable QTL regions. Gene annotation and in silico expression analysis revealed 15 putative genes underlying the stable QTLs that might regulate soybean yield. Haplotype analysis using six significant SNPs revealed various allelic combinations regulating diverse phenotypes for the studied traits. Furthermore, the GP analysis revealed that accurate breeding values for the studied soybean traits is attainable at an earlier generation. Our study paved the way for increasing soybean yield performance within a short breeding cycle.
Introduction
Soybean (Glycine max L. Merr.) is one of the most important food legume crops cultivated globally (Hina et al., 2020). Many countries including China are highly dependent on soybean imports to fulfil their domestic needs (Liu et al., 2018; Karikari et al., 2019). Improving soybean yield has been a primary objective of breeders from China and several other countries across the world (Karikari et al., 2019). Seed yield of soybean is governed by yield-related traits such as the number of pods per plant, number of seeds per plant, and seed weight (Bianchi et al., 2020). However, yield and its component traits are complex, being controlled by multiple genes and are considerably affected by the environment (Liu et al., 2011).
Many studies have revealed the genetic basis of yield-related traits in staple crops such as maize (Badu-Apraku et al., 2020; Yang et al., 2020), rice (Yue et al., 2015; Adeboye K. A. et al., 2021), and soybean (Karikari et al., 2019; Hu et al., 2020) by using bi-parental mapping populations. To date, several hundred QTLs regulating yield and yield-related traits have been mapped across the soybean genome, and many QTLs were consistently identified in different populations (http://www.soybase.org). All these studies have validated the role of linkage mapping as an efficient approach to dissecting the genetic basis of quantitative traits (Karikari et al., 2019; Hina et al., 2020). However, a major limitation of the linkage mapping approach is its dependence on limited diversity existing within segregating populations derived from two contrasting parents. By contrast, GWAS has emerged as an alternative approach, which is more efficient in the identification of QTLs regulating quantitative traits by utilizing natural diversity existing within crop germplasm and the use of high-density genetic markers (Zargar et al., 2015; Yu et al., 2019). Importantly, GWAS has a higher potential to identify candidate genes regulating the trait of interest because of a reduced level of genomic linkage disequilibrium (LD) (Alqudah et al., 2020).
Advances in next-generation sequencing technologies have enabled a wider availability of high-throughput sequencing and genotyping platforms (Bhat et al., 2020; Sahu et al., 2020). As a result, genomics-assisted breeding (GAB) has emerged as the method of choice for crop improvement in plant breeding programs (Varshney et al., 2021). Although, both linkage mapping and GWAS approaches are being successfully used for the identification of QTLs/candidate genes in crop plants, limited allelic diversity and genomic resolution associated with linkage mapping are addressed by GWAS in the gene identification process (Brachi et al., 2011). GWAS has been efficiently used to identify the QTLs/genes underlying various yield-related traits in soybeans such as seed protein and oil content (Zhang et al., 2019), agronomy (Zatybekov et al., 2017), salt tolerance (Zeng et al., 2017), and yield-related traits (Hu et al., 2020). Another genomic-based plant breeding approach is the genomic prediction (GP). Here, phenotypic traits or performance of an individual is predicted based on genomic data. GP is currently being used in multiple plant species to estimate the genetic values (genotypic estimated breeding values (GEBVs)) of the individual genotypes based on the genome-wide genotypic data without the need for phenotypic data (Habier et al., 2007; Bhat et al., 2016; Crossa et al., 2017). The GP allows for the captures of QTLs with minor effects since the model is based on the genome-wide marker data rather than few markers as in the marker-assisted selection model. Thus, it has a great potential for improving the genetic gain associated with yield and other complex traits within a limited time frame in different crop plants (Crossa et al., 2017; Voss-Fels et al., 2019; Lebedev et al., 2020). Moreover, GP has been used in soybean for improving different traits such as cyst nematode infestation (Ravelombola et al., 2020), disease resistance (Rolling et al., 2020), agronomic traits (Beche et al., 2021), and seed yield (Mendonça et al., 2020). The results of these studies have demonstrated the potential of GP for improving complex traits in soybean. Furthermore, advanced sequencing technologies are providing high accuracy in gene and haplotype mining in crop germplasm (Bevan et al., 2017; Bhat et al., 2021).
The present study analyzes the genetic basis of yield-related traits in summer planting soybean genotypes grown in soybean growing areas of China. We evaluated 211 diverse soybean genotypes across six environments for four yield-related traits, including seed yield per plant (SYP), number of pods per plant (PPP), number of seeds per plant (SPP), and 100-seed weight (HSW). Based on the phenotypic performance, genome-wide association analysis was conducted to identify QTLs associated with the studied traits using five different models. The genes underlying the identified QTLs were validated based on RNA-seq data for soybean tissues. Furthermore, superior haplotypes and alleles were identified within the genomic regions associated with the studied traits. Also, genetic values of individual genotypes were estimated based on the studied yield-related traits to facilitate the selection of soybean for improved yield performance.
Materials and methods
Plant materials and field experiment
The GWAS panel of soybean used in the current study consists of 211 diverse genotypes; which include 201 genotypes originating from 25 provinces of China that represents all three ecological habitats of China (Zhang S. et al., 2021) and ten genotypes from the United States, Japan, and Brazil (Zhang et al., 2015). This soybean germplasm was evaluated at three different locations in China viz., Nanjing, Nantong, and Yangzhou, for two consecutive years. This makes a total of six different environments viz., E1 and E2 (Nanjing); E3 and E4 (Nantong); and E5 and E6 (Yangzhou). The study location was previously described by Bhat et al. (2022). Nanjing (32°12′ N, 118°37′ E) has north subtropical humid climate. It receives an average rainfall of 1,106.5 mm, 76% average relative humidity, and 15.4°C average temperature. Nantong (31°58′ N, 120°53′ E) is located at the lower reaches of Yangtze River in the alluvial plain with mild marine climate, and possesses an average temperature and precipitation of 15.1°C and ∼1,040 mm, respectively. Yangzhou (32°23′ N, 119°25′ E) is located in the southern end of Yangtze Huaihe plain, and receives an average precipitation and temperature of 1,020 mm and 14.8°C, respectively. In each environment, all the 211 diverse soybean genotypes were planted in a randomized complete block design with three replications. Each genotype was planted in a plot of three rows with row-length and spacing of 200 and 50 cm, respectively. Normal agronomic practices were followed for the cultivation of soybean germplasm at each location, as previously described by Zhang S. et al. (2021).
Phenotypic data collection and analysis
At maturity, five consecutive plants of each genotype were selected from the middle of each plot for data collection. Phenotypic data were recorded for four yield-related traits including seed yield per plant (SYP), number of pods per plant (PPP), number of seeds per plant (SPP), and 100-seed weight (HSW). The phenotypic data were subjected to analysis of variance with the mixed linear model using lme4 – an r-package implemented in PBTools v1.4 (IRRI, 2014). BLUPs were generated for GWAS by setting the genotype as random. Pearson correlation coefficient between traits was determined at p < 0.05 and visualized using MVApp (Julkowska et al., 2019).
Genotyping, linkage disequilibrium, and genome-wide association study
NJAU 355 K Soy SNP Array previously developed and described by Wang et al. (2016) was used in this study. Quality control analysis was performed using PLINK v1.07 (Purcell et al., 2007) with the following criteria: missing genotype and individual at 0.1; minor allele frequency (MAF) at 0.01, and Hardy-Weinberg exact test at 0.000001. For the genome-wide LD analysis, pairwise squared allele-frequency correlations (r2) between SNP markers with known genomic positions were calculated using Trait Analysis by Association, Evolution, and Linkage (TASSEL) v5.72 (Bradbury et al., 2007) with 100 sliding window sizes. The expected values of r2 under drift equilibrium were calculated according to Hill and Weir (1988) and plotted against physical distance (Kbp). The LD decay curve line was fitted on the scatterplot using the smoothing spline regression line at the genome level following the procedure of Remington et al. (2001) in the R environment.
The GWAS was performed using the following five models:
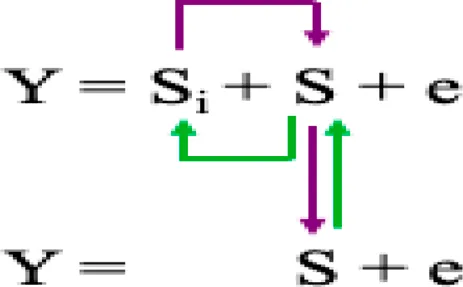
1) General linear model (GLM) with principal component analysis (PCA) to reduce false positive association due to population structure (Price et al., 2006) based on the equation as follows:
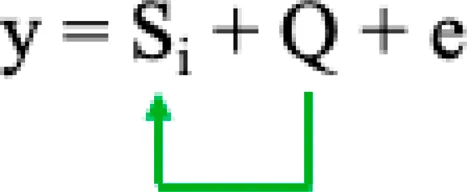
Where Si = testing marker, and Q = Population structure.
2) The compressed mixed linear model (CMLM) (Zhang et al., 2010), has increased statistical power for marker-trait association detection relative to other methods. CMLM method groups individuals into clusters, and random effects are fitted as genetic values of clusters in a mathematical model:
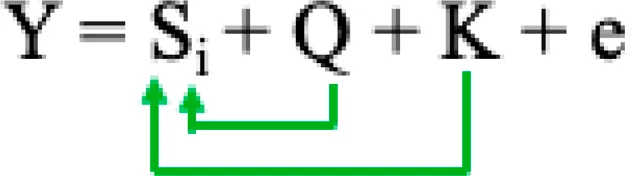
Where Si = testing marker, Q = Population structure, and K = Kinship by group.
3) The multiple-locus mixed linear model (MLMM) (Segura et al., 2012) incorporates the kinship matrix and Pseudo Quantitative Trait Nucleotide (QTN) to control false discovery rate (FDR) based on the model equation:
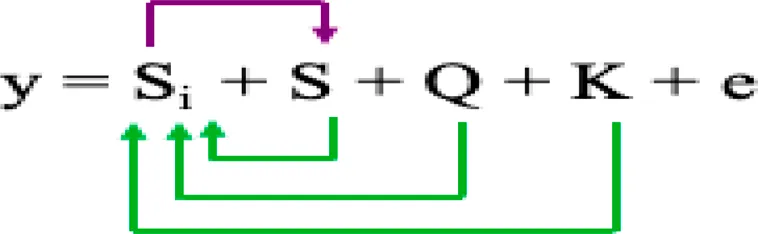
Where Si = testing marker, Q = Population structure, K = Kinship of individuals, and S = Pseudo QTN.
4) The fixed and random model circulating probability unification (FarmCPU) (Liu et al., 2016) iteratively uses the Fixed Effect Model (FEM) and a Random Effect Model (REM) as shown in the model equation:
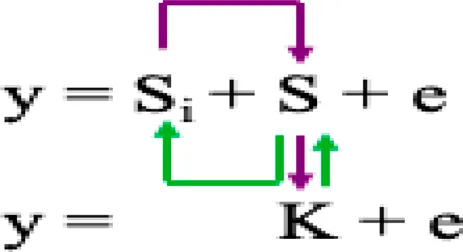
Where K = kinship derived from only the associated markers or Pseudo QTN (S) using maximum likelihood method.
5) Bayesian-information and linkage-disequilibrium iteratively nested keyway (BLINK) (Huang et al., 2019) is an improved version of FarmCPU model and expressed as below:
S = pseudo QTNs that are not in LD with each other selected in two FEMs and one filtering process and optimization using Bayesian information criterion (BIC).
Among the five GWAS models used, GLM and CMLM are single locus models; whereas, MLMM, FarmCPU, and BLINK are the multi-locus models. All of the models were implemented using GAPIT v3 package (Lipka et al., 2012) in an R environment. To correct for the population structure, PCA was employed using BIC to estimate the optimal numbers of PCA (Schwarz, 1978). The population structure was visualized based on soybean ecological regions in China using the “ggbiplot” package in the R environment. Significant SNP associations were determined according to the inherently included method in GAPIT v3 (Lipka et al., 2012) as the negative logarithm of p-value (where p-value = 0.01/number of markers, and 0.01 represents MAF cut-off). Furthermore, only SNPs that were commonly detected across a minimum of two models were considered for further analysis.
Prediction of candidate genes
The genes lying upstream and downstream of each stable SNP (within the LD decay distance of the studied population) were obtained from the freely available online RNA-seq data for different soybean tissues on SoyBase website (https://www.soybase.org). Functional descriptions of these genes were also obtained, manually screened, and presented in a heatmap.
Allele-effect and haplotype analysis
Effects of alleles underlying the significant stable SNP markers were analyzed as previously described by Su et al. (2019) and Alemu et al. (2021). Genotypes were grouped into independent groups according to their specific SNP alleles, and means were compared using Turkey’s HSD test.
Haplotype analysis was conducted using PLINK v1.07 (Purcell et al., 2007). The stable SNP markers (identified in two or more two environments) were considered reference markers for building haplotype blocks/loci. Besides, all markers that were in close association with the reference SNP markers within the estimated LD decay distance of the studied population formed a haplotype block/locus. Effects of haplotype alleles on the studied traits were tested across all the six environments using the conditional haplotype testing command (--chap). Also, the contribution of each haplotype to the observed phenotypic variance across the environments was estimated using the "--hap-assoc” command (Purcell et al., 2007) and visualized in Microsoft Excel.
Genomic prediction
The genomic prediction was explored for each trait in individual and combined environments using Genomic best linear unbiased prediction (gBLUP) and the ridge regression best linear unbiased prediction (rrBLUP) based on the mixed-model:where β and μ represent the vectors of fixed and random effects, respectively, and ε is the residual error.
The gBLUP was implemented in TASSEL v5.72 (Bradbury et al., 2007). Cross-validation was achieved in five-folds with 20 iterations to test the genomic prediction accuracy and to avoid overfitting of the model. The rrBLUP on the other hand was implemented using the “rrBLUP” package (Endelman, 2011; Endelman and Jannink, 2012) in the R environment. To validate the genomic prediction accuracy, the dataset was randomly divided into training and testing sets at 80 and 20% respectively. To manage the challenges of overfitting, the cross-validation was conducted in five hundred cycles of iterations. The predictive ability was estimated as the Pearson’s correlation coefficient between the observed and predicted phenotypic values of the test set based on the effect estimates of genotypes in the training set.
Results
Phenotypic analysis
Analysis of variance for the four yield-related traits evaluated across 211 soybean genotypes is summarized in Table 1. A highly significant variation (p < 0.0001) was observed for the genotype, environment, and G × E interaction in all the studied traits. However, the estimates of variance components varied across different traits (Table 1). For all the studied traits, the genotype component accounted for the highest proportion of the observed variations. Moreover, medium to high broad-sense heritability (h2) was observed, ranging from 0.61 (SYP) to 0.99 (HSW) in individual environments (Supplementary Table S1) and from 0.80 (SYP) to 0.99 (HSW) in the combined environment (Table 1).
TABLE 1
| Traits | PPP | HSW | SPP | SYP |
|---|---|---|---|---|
| Variance | ||||
| Genotype (G) | 320.8*** | 24.8*** | 1,144.5*** | 11.9*** |
| Environment (E) | 386.1*** | 1.3*** | 861.8*** | 22.9*** |
| G × E | 73.8*** | 1.7*** | 329.4*** | 5.8*** |
| Error | 259.5 | 2.2 | 919.5 | 17.7 |
| Broad-sense heritability | 0.85 | 0.99 | 0.89 | 0.80 |
Combined analysis of variance and broad-sense heritability for four yield and yield-related traits.
***represents the significance level at p< 0.0001.
Furthermore, Pearson correlation analysis revealed that SYP has a positive significant correlation with PPP, SPP and HSW (Figure 1). Whereas, HSW was negatively correlated with PPP and SPP in all the studied environments. Also, PPP showed a positive correlation with SPP across all six environments.
FIGURE 1
Marker quality control, population structure, and linkage disequilibrium
The quality control analysis retained 12,617 SNPs across 211 soybean genotypes at a genotyping rate of 99% after removing SNPs that failed the missingness, minor allele frequency, and Hardy-Weinberg exact tests. The markers were distributed across the soybean genome, with the highest (1,112) and lowest (352) number of markers present on Chr.06 and Chr.05, respectively (Figure 2A). Heatmaps and dendrograms of the kinship matrix, based on 12,617 polymorphic SNPs for the studied genotypes, indicated that there was no clear clustering among the genotypes (Figure 2B). The population structure based on soybean ecological regions in China also revealed a continuous distribution without any distinct structure (Figure 2C).
FIGURE 2
The graphical representation of the linkage disequilibrium characteristics of the 211 soybean genotypes is presented in Figure 3. The average r2 value of the genome was 0.12, and the LD decay was found to initiate at an r2 value of 0.47 and reached half-decay at 0.24. The LD decay curve intersected with the half-decay at 670 Kbp, which represents the genome-wide critical distance to detect linkage. Hence, markers associated with the same trait within this distance were considered as a single QTL.
FIGURE 3
Marker-trait associations for yield-related traits
A total of 57 SNPs detected using five different GWAS models were found to possess significant association with four studied traits across six different environments (Supplementary Figure S1; Table 2). These SNPs were distributed across 17 soybean chromosomes. Among the significant SNPs identified, the highest number of SNPs (10) are found on Chr.15, followed by eight and five SNPs on Chr.20 and Chr.11, respectively. Four significant SNPs were found each on Chr.04, Chr.06, and Chr.13; whereas, Chr.08 and Chr.12 possessed three significant SNPs each. The remaining ten chromosomes possessed one or two significant SNPs. Further, some of these SNPs were consistently detected in multiple environments, using different GWAS models, and were found to be associated with more than one studied trait. Such SNPs were considered stable MTAs. For example, the significant SNP (AX-93793,210) on Chr.11 was identified consistently in five individual environments (E1, E2, E3, E4, and E5) and the combined environment. In addition, this SNP was also identified through four different GWAS models (BLINK, FarmCPU, GLM, and MLMM), and was found to be associated with two yield-related traits (HSW and SPP). Similarly, another SNP (AX-93807,406) detected on Chr.13 was found to be significantly associated with HSW and SPP across five individual environments (E1, E2, E4, E5, and E6) and the combined environment. This SNP was also identified using three GWAS models (BLINK, FarmCPU, and GLM).
TABLE 2
| Sr. No | SPP | Trait | Chra | Pos. (bp)b | Environments | Model | p-value | MAF |
|---|---|---|---|---|---|---|---|---|
| 1 | AX-93668,616 | SYP | 1 | 11,556,172 | E3 and COM | BLINK, FarmCPU, GLM | 2.68E-06 to 6.87E-14 | 0.06 |
| 2 | AX-93973,672 | PPP | 1 | 55,502,450 | E1 | BLINK, GLM | 1.69E-08 to 7.65E-08 | 0.01 |
| 3 | AX-93991,698 | SYP | 3 | 24,910,743 | COM | BLINK, FarmCPU | 3.23E-07 to 7.38E-07 | 0.04 |
| 4 | AX-93703,924 | PPP, SPP | 4 | 4,291,705 | E3, E6 and COM | BLINK, FarmCPU, GLM | 1.33E-06 to 8.45E-07 | 0.04 |
| 5 | AX-93707,240 | HSW | 4 | 1,611,547 | E1 and E5 | BLINK, FarmCPU, GLM | 1.05E-12 to 9.43E-07 | 0.17 |
| 6 | AX-94000,527 | PPP | 4 | 5,416,455 | E2 and COM | FarmCPU, GLM | 1.26E-06 to 4.17E-10 | 0.35 |
| 7 | AX-94006,694 | HSW | 4 | 39,016,845 | E3 | BLINK, FarmCPU | 5.37E-07 to 9.88E-07 | 0.45 |
| 8 | AX-93922099 | HSW | 5 | 36,599,702 | E1, E5 and COM | BLINK, FarmCPU | 2.12E-09 to 8.33E-08 | 0.09 |
| 9 | AX-93715,038 | HSW | 5 | 2,491,676 | E1 and E4 | FarmCPU, GLM | 1.01E-07 to 6.23E-07 | 0.09 |
| 10 | AX-93725,825 | PPP | 6 | 5,623,054 | E1 | BLINK, GLM | 3.09E-07 to 3.63E-07 | 0.13 |
| 11 | AX-93730,411 | HSW | 6 | 19,462,776 | E2 | BLINK, GLM | 1.35E-09 to 2.78E-08 | 0.09 |
| 12 | AX-93735,201 | HSW | 6 | 43,399,273 | E4 | BLINK, FarmCPU | 1.07E-06 to 1.83E-06 | 0.14 |
| 13 | AX-94033,285 | SYP | 6 | 48,786,905 | E3 | BLINK, FarmCPU | 6.83E-09 to 9.40E-10 | 0.48 |
| 14 | AX-94034,566 | HSW, SYP | 7 | 1,626,042 | E3 and E3 | BLINK, FarmCPU, GLM | 1.24E-06 to 2.98E-07 | 0.32 |
| 15 | AX-94050,700 | SYP | 8 | 15,859,520 | COM | BLINK, FarmCPU | 5.66E-10 to 9.74E-09 | 0.04 |
| 16 | AX-94283,862 | PPP | 8 | 19,011,459 | COM | BLINK, FarmCPU | 1.27E-06 to 7.72E-08 | 0.04 |
| 17 | AX-93755,601 | PPP | 8 | 19,248,053 | E3 | BLINK, FarmCPU | 1.57E-10 to 5.25E-07 | 0.12 |
| 18 | AX-93636,437 | SYP | 9 | 6,958,542 | E2 | BLINK, GLM | 6.90E-07 to 9.77E-12 | 0.05 |
| 19 | AX-93772,794 | SYP | 9 | 4,4,392,036 | COM | BLINK, GLM | 1.36E-06 to 1.78E-06 | 0.13 |
| 20 | AX-93793,210 | HSW, SPP | 11 | 29,587,057 | E1, E2, E3, E4, E5 and COM | BLINK, FarmCPU, GLM and MLMM | 1.13E-08 to 7.01E-11 | 0.26 |
| 21 | AX-93792,964 | HSW, PPP | 11 | 27,468,886 | E5, E6 | BLINK, FarmCPU, GLM | 1.31E-07 to 5.42E-13 | 0.19 |
| 22 | AX-94276,492 | PPP, SPP | 11 | 2,211,768 | E3 | BLINK, GLM | 1.34E-08 to 8.75E-10 | 0.10 |
| 23 | AX-93792,958 | HSW | 11 | 27,459,211 | E2 and COM | BLINK, FarmCPU, GLM and MLMM | 3.22E-06 to 8.67E-07 | 0.19 |
| 24 | AX-94092,104 | SYP | 11 | 38,213,308 | COM | BLINK, FarmCPU, GLM | 1.98E-08 to 4.35E-07 | 0.09 |
| 25 | AX-93797,890 | PPP, SPP | 12 | 5,802,813 | E3 and E5 | BLINK, FarmCPU | 1.11E-06 to 9.02E-08 | 0.03 |
| 26 | AX-93804,315 | PPP | 12 | 33,817,396 | E1 | FarmCPU, GLM | 2.29E-08 to 3.72E-07 | 0.01 |
| 27 | AX-93805,697 | SYP | 12 | 37,339,415 | E4 | BLINK, GLM | 1.49E-07 to 3.29E-07 | 0.20 |
| 28 | AX-93807,406 | HSW, SPP | 13 | 1,843,185 | E1, E2, E4, E5, E6 and COM | BLINK, FarmCPU, GLM | 1.17E-10 to 8.25E-08 | 0.28 |
| 29 | AX-94104,132 | HSW, SPP | 13 | 1,704,148 | E3 and COM | BLINK, FarmCPU, GLM | 1.74E-06 to 9.50E-07 | 0.23 |
| 30 | AX-94111,538 | HSW | 13 | 29,191,712 | E5 and COM | BLINK, FarmCPU | 1.00E-07 to 4.87E-07 | 0.03 |
| 31 | AX-93810,993 | HSW | 13 | 13,752,815 | E5 | BLINK, FarmCPU | 1.73E-06 to 4.86E-08 | 0.05 |
| 32 | AX-94123,137 | PPP, SPP | 14 | 23,593,462 | E3 | BLINK, GLM | 1.31E-10 to 9.43E-09 | 0.02 |
| 33 | AX-94137,762 | SYP | 15 | 22,710,572 | E5 | BLINK, FarmCPU, CMLM, GLM and MLMM | 1.64E-09 to 2.48E-06 | 0.04 |
| 34 | AX-93648,081 | HSW | 15 | 1,479,982 | E6 | BLINK, FarmCPU, GLM | 1.84E-07 to 6.39E-07 | 0.34 |
| 35 | AX-94138,593 | SYP | 15 | 29,628,987 | COM | BLINK, FarmCPU, GLM | 2.98E-07 to 8.36E-15 | 0.01 |
| 36 | AX-93647,998 | PPP | 15 | 14,306,514 | COM | BLINK, GLM | 1.10E-10 to 1.24E-06 | 0.05 |
| 37 | AX-94139,057 | SPP | 15 | 32,570,960 | E6 | BLINK, GLM | 1.07E-06 to 1.31E-07 | 0.07 |
| 38 | AX-94139,404 | SYP | 15 | 37,194,980 | E3 | FarmCPU and MLMM | 1.18E-13 to 2.51E-06 | 0.03 |
| 39 | AX-94139,741 | SPP | 15 | 40,016,648 | COM | BLINK, GLM | 1.66E-07 to 4.89E-10 | 0.14 |
| 40 | AX-94139,803 | PPP | 15 | 40,162,413 | E2 | BLINK, GLM | 1.44E-08 to 6.40E-08 | 0.06 |
| 41 | AX-93843,622 | HSW | 15 | 44,240,130 | E5 | FarmCPU, GLM | 1.03E-06 to 4.93E-08 | 0.13 |
| 42 | AX-93843,767 | SPP | 15 | 44,966,712 | COM | BLINK, GLM | 3.31E-06 to 9.03E-11 | 0.14 |
| 43 | AX-93650,734 | HSW | 16 | 30,750,889 | E3 | BLINK, FarmCPU, GLM | 2.98E-06 to 9.61E-09 | 0.13 |
| 44 | AX-93855,303 | SPP | 16 | 33,390,841 | E5 | BLINK, FarmCPU, GLM | 2.13E-09 to 7.13E-07 | 0.02 |
| 45 | AX-93652076 | SYP | 17 | 1,3,931,777 | E6 | BLINK, FarmCPU, GLM | 1.67E-06 to 4.45E-07 | 0.01 |
| 46 | AX-93959,968 | SPP | 17 | 12,429,289 | E2 | FarmCPU, GLM | 1.52E-06 to 4.87E-07 | 0.02 |
| 47 | AX-94176727 | HSW, PPP | 18 | 46,137,043 | E1, E2 and COM | BLINK, FarmCPU, GLM | 1.22E-07 to 5.79E-07 | 0.04 |
| 48 | AX-93869,048 | PPP | 18 | 3,396,703 | E3 | BLINK, FarmCPU | 2.32E-06 to 3.28E-07 | 0.04 |
| 49 | AX-93886,740 | PPP | 19 | 3,901,635 | E3 | FarmCPU, GLM | 1.57E-07 to 3.77E-06 | 0.03 |
| 50 | AX-94199992 | PPP, SPP | 20 | 12,095,298 | E1, E3 and COM | BLINK, FarmCPU, GLM | 1.27E-08 to 6.40E-10 | 0.05 |
| 51 | AX-93901,622 | SPP | 20 | 10,355,416 | E2 and E3 | BLINK, FarmCPU, GLM and MLMM | 1.88E-06- to 4.95E-07 | 0.01 |
| 52 | AX-93903,055 | PPP | 20 | 17,413,084 | E1 and E2 | BLINK, FarmCPU, GLM | 1.10E-07 to 8.65E-09 | 0.01 |
| 53 | AX-94198582 | PPP | 20 | 4,715,203 | E3 | BLINK, GLM | 2.07E-09 to 2.67E-13 | 0.08 |
| 54 | AX-94201014 | PPP | 20 | 17,645,281 | E3 | GLM, MLMM | 1.50E-06 to 8.73E-11 | 0.02 |
| 55 | AX-93903,184 | PPP | 20 | 18,155,072 | E3 | BLINK, GLM | 4.38E-11 to 7.33E-09 | 0.02 |
| 56 | AX-94207999 | HSW | 20 | 42,330,677 | E2 | BLINK, GLM | 6.29E-09 to 7.83E-07 | 0.30 |
| 57 | AX-94292,257 | PPP | 20 | 45,876,916 | E5 | BLINK, FarmCPU | 1.99E-07 to 2.36E-07 | 0.01 |
Significant marker-trait associations identified for four yield and yield-related traits across six environments (E1, E2, E3, E4, E5, and E6) and a combined environment (COM) using five GWAS models.
Chromosome.
Physical position; MAF (minor allele frequency).
Furthermore, three significant SNPs (AX-94199992, AX-93703,924, and AX-94176727) on Chr.20, Chr.04, and Chr.18, respectively, were consistently detected in the combined environment using three different models (BLINK, FarmCPU, and GLM) and showed association with two of the three traits viz., HSW, PPP, and SPP. The SNP (AX-93922099) was detected in the combined environment using two different models (BLINK and FarmCPU) and was associated with HSW. Few significant SNPs such as AX-93792,964, AX-94034,566, AX-93797,890, and AX-94104,132, present on Chr.11, Chr.07, Chr.12, and Chr.13, respectively, were found to be associated with two of the four studied traits, using up to three GWAS models in one or two individual environments and a combined environment. Moreover, eight SNPs (AX-93668,616, AX-93707,240, AX-93792,958, AX-94000,527, AX-93715,038, AX-94111,538, AX-93901,622, and AX-93903,055) were detected in one or two individual environment(s) and a combined environment. Each of these eight SNPs was associated with only one trait and identified using up to four different GWAS models. The SNPs (AX-94276,492 and AX-94123,137) were found to be associated with two traits (PPP and SPP) and were identified using two GWAS models (BLINK and GLM), but were identified in only one individual environment. The remaining 37 significant SNPs were found to be associated with only one trait and environment, and most of them were identified using two or three GWAS models.
Based on GWAS, we identified six significant SNPs (AX-93703,924, AX-93922099, AX-93793,210, AX-93807,406, AX-94176727, and AX-94199992) on Chr.4, Chr.5, Chr.11, Chr.13, Chr.18, and Chr.20, respectively, consistently in three or more than three environments and using multiple models (Tables 2, 3). Of these, five SNPs (AX-93807,406, AX-93793,210, AX-94199992, AX-93703,924, and AX-94176727) were found to be associated with two studied traits (Tables 2, 3). However, the SNP AX-93922099 was associated with only HSW (Tables 2, 3). Hence, based on the LD decay, the genomic regions (±670 kb) flanking these significant SNPs (AX-93807,406, AX-93793,210, AX-94199992, AX-93922099, AX-93703,924, and AX-94176727) were considered as QTLs viz., qHSW-SPP13, qHSW-SPP11, qPPP-SPP20, qHSW5, qPPP-SPP4, and qHSW-PPP18, respectively (Table 3). These QTLs/genomic regions represented stable genetic elements potentially regulating soybean yield-related traits.
TABLE 3
| QTL | Chra | Rep.SPPb | Pos. (bp)c | Environments | Model | Related QTL | References |
|---|---|---|---|---|---|---|---|
| qPPP-SPP4 | 4 | AX-93703,924 | 4,291,705 | E3, E6 and COM | BLINK, FarmCPU, GLM | Novel QTL | Not available |
| qHSW5 | 5 | AX-93922099 | 36,599,702 | E1, E5 and COM | BLINK, FarmCPU | Seed weight 34–9; Seed-yield 22–10 | Han et al., 2012; Du et al., 2009 |
| qHSW-SPP11 | 11 | AX-93793,210 | 29,587,057 | E1, E2, E3, E4, E5 and COM | BLINK, FarmCPU, GLM and MLMM | Seed weight 35–9 | Han et al. (2012) |
| qHSW-SPP13 | 13 | AX-93807,406 | 1,843,185 | E1, E2, E4, E5, E6 and COM | BLINK, FarmCPU, GLM | Novel QTL | Not available |
| qHSW-PPP18 | 18 | AX-94176727 | 46,137,043 | E1, E2 and COM | BLINK, FarmCPU, GLM | Novel QTL | Not available |
| qPPP-SPP20 | 20 | AX-94199992 | 12,095,298 | E1, E3 and COM | BLINK, FarmCPU, GLM | Novel QTL | Not available |
Stable QTLs/genomic regions identified for the studied traits in at least three or more environments.
Chromosome.
The representative SPP, with the min p value.
Physical position.
The italic values indicate “QTL names” and “Gene IDs”.
RNA-seq data revealed 15 putative genes regulating yield-related traits
Six QTLs/genomic regions were identified on Chr.04 (qPPP-SPP4), Chr.05 (qHSW5), Chr.11 (qHSW-SPP11), Chr.13 (qHSW-SPP13), Chr.18 (qHSW-PPP18), and Chr.20 (qPPP-SPP20) were further used to identify putative genes regulating yield-related traits in soybean. The gene models and their annotations underlying the physical intervals of these six QTL regions were downloaded from the SoyBase database to predict putative candidates (Supplementary Table S2). In total, 739 gene models were identified within the physical genomic interval of qPPP-SPP4, qHSW5, qHSW-SPP11, qHSW-SPP13, qHSW-PPP18 and qPPP-SPP2. However, by considering gene annotation, we selected 113 gene models within their physical genomic interval, which consisted of 31, 33, 10, 11, 14, and 14 genes underlying qPPP-SPP4, qHSW5, qHSW-SPP11, qHSW-SPP13, qHSW-PPP18 and qPPP-SPP20, respectively (Supplementary Table S2). In addition, RNA-seq data for samples collected across different stages of soybean growth and development (www.soybase.org) was downloaded and analyzed for identifying putative genes underlying the QTL intervals (Supplementary Table S3). The RNA-seq data of these genes are represented using a heatmap (Supplementary Figure S2). Based on the in-silico analysis of gene expression data and gene annotations, we predicted a total of 15 putative candidates underlying six QTLs. These include 6, 2, 2, 1, 3, and 1 gene underlying qPPP-SPP4, qHSW5, qHSW-SPP11, qHSW-SPP13, qHSW-PPP18, and qPPP-SPP20, respectively (Table 4).
TABLE 4
| QTL name | Gene IDs | Chrom-osome | Gene functional annotation |
|---|---|---|---|
| qPPP-SPP4 | Glyma04g05500 | 04 | Protein folding; abiotic stress response; positive regulation of transcription |
| Glyma04g05520 | 04 | NA | |
| Glyma04g05580 | 04 | Gluconeogenesis; glycolysis; translational initiation; abiotic stress response | |
| Glyma04g05690 | 04 | Lipid biosynthetic process | |
| Glyma04g05720 | 04 | Protein folding; abiotic stress response | |
| Glyma04g05800 | 04 | Photosynthesis | |
| qHSW5 | Glyma05g31250 | 05 | Acetyl-CoA metabolic process; abiotic stress response; polysaccharide transport; sterol biosynthetic process; brassinosteroid biosynthetic process |
| Glyma05g31260 | 05 | Nuclear division; cytokinesis by cell plate formation; chromatin silencing; nucleolus organization; biological process; cell proliferation; histone phosphorylation; histone H3-K9 methylation | |
| qHSW-SPP11 | Glyma11g28990 | 11 | NA |
| Glyma11g29000 | 11 | Protein N-linked glycosylation; ethylene biosynthetic process; sugar mediated signaling pathway; stem cell division; proteasomal ubiquitin-dependent protein catabolic process; cotyledon development; regulation of post-embryonic root development | |
| qHSW-SPP13 | Glyma13g01950 | 13 | Carbohydrate metabolic process; regulation of meristem growth |
| qHSW-PPP18 | Glyma18g38490 | 18 | Regulation of transcription; gibberellin biosynthetic process; response to auxin stimulus; response to abscisic acid stimulus; gibberellic acid mediated signaling pathway; embryo development; terpenoid biosynthetic process; cotyledon development; cell division |
| Glyma18g38570 | 18 | Cell morphogenesis; protein N-linked glycosylation; N-terminal protein myristoylation; cell growth; protein ubiquitination; regulation of protein localization; protein autophosphorylation; Golgi vesicle transport; root hair elongation | |
| Glyma18g38610 | 18 | Regulation of transport | |
| qPPP-SPP20 | Glyma20g08580 | 20 | Actin filament organization; regulation of stomatal movement; regulation of protein localization |
Putative genes underlying six QTLs and their gene annotation.
The italic values indicate “QTL names” and “Gene IDs”.
Allelic effects of stable marker-trait associations
The six significant SNPs (AX-93703,924, AX-93922099, AX-93793,210, AX-93807,406, AX-94176727, and AX-94199992), showing stable MTAs with yield-related traits were further used to determine the effects of their individual alleles on the studied traits (Figure 4). The alleles of these six SNP markers showed substantial effects on yield-related traits combined from all the six environments (Figure 4). However, the number of alleles for each of these six SNP markers in the whole soybean population varied from two to three. For example, the SNP markers AX-93807,406, AX-93793,210, and AX-94199992 each possessed three different alleles; whereas, AX-93922099, AX-93703,924, and AX-94176727 possessed two alleles each (Figure 4). The SNP marker AX-93807,406 possessed three alleles (AX-93807406-AA, AX-93807406-AG, and AX-93807406-GG), and were found to regulate HSW and SPP (Figures 4A,B). The AX-93807406-AA, AX-93807406-AG, and AX-93807406-GG alleles governed higher, intermediate, and lower HSW, respectively; whereas these same alleles regulated lower, intermediate, and higher SPP, respectively. The SNP marker AX-93793,210 is associated with two yield-related traits (HSW and SPP), and all three alleles of this marker (AX-93793210-TT, AX-93793210-TC, and AX-93793210-CC) showed significantly different allelic effects on both HSW and SPP (Figures 4C,D). The allele AX-93793210-TT was associated with higher HSW, whereas AX-93793210-CC was associated with lower HSW. The effect of AX-93793210-TC on HSW was intermediate between that of AX-93793210-TT and AX-93793210-CC. However, the effect of three alleles of AX-93793,210 on SPP was found to be opposite to that of HSW, which also supports the negative correlation between HSW and SPP.
FIGURE 4
Moreover, three alleles of SNP marker AX-94199992, including AX-94199992-AA, AX-94199992-AG, and AX-94199992-GG, were found to govern three diverse phenotypes of SPP and PPP (Figures 4E,F). Besides, these three alleles of AX-94199992 regulated SPP and PPP phenotype in the same order as lower, intermediate and higher, respectively, which further supports the positive correlation of SPP and PPP traits. The two alleles of marker AX-93922099, including AX-93922099-TT and AX-93922099-TC, showed a significant difference in the regulation of HSW. For instance, the allele AX-93922099-TT governed lower HSW; whereas, the allele AX-93922099-TC was associated with higher HSW (Figure 4G). Similarly, the AX-93703,924 marker governed SPP and PPP traits, and the two alleles of this marker (AX-93703924-CC and AX-93703924-CG) regulated lower and higher trait values, respectively, for both the traits (Figures 4H,I). The SNP marker AX-94176727, possessing two alleles (AX-94176727-TT and AX-94176727-AT), regulated contrasting phenotypes of HSW and PPP (Figures 4J,K). For instance, AX-94176727-TT and AX-94176727-AT regulated lower and higher HSW, respectively; whereas, the same alleles governed higher and lower PPP values, respectively. These results are per the negative correlation observed between HSW and PPP.
Haplotypes for yield-related traits
The six stable markers mentioned above were used as a reference for the identification of haplotypes for yield-related traits. These stable markers were located on Chr.04 (AX-93703,924), Chr.05 (AX-93922099), Chr.11 (AX-93793,210), Chr.13 (AX-93807,406), Chr.18 (AX-94176727), and Chr.20 (AX-94199992). All the markers that were in strong LD (within ±670 kbp) with these six SNP markers, represented a haplotype block/locus (Figure 5; Table S4). For example, 17 SNP markers were in strong LD with the reference marker AX-93703,924 (3,957,601–4291,705) and formed a haplotype block. Three haplotype alleles were identified within this haplotype block, in the soybean population (Figure 5A). These three haplotype alleles identified on Chr.04 showed significant differences in the phenotypes of SPP and PPP. Further, the reference marker AX-93922099 (36,238,983–3,7,041,764) formed a haplotype block with 26 markers, which consisted of eight haplotype alleles (Figure 5B). Substantial phenotypic variance in HSW was observed for haplotype alleles present within this haplotype block on Chr.05 (Figure 5C). The marker AX-93793,210 (29,587,057–30102,619) constituted a haplotype block with five SNP markers constituting four haplotype alleles. Variation in these four alleles led to significant phenotypic variation in HSW and SPP traits (Figures 5D,E).
FIGURE 5
Eight SNP markers were associated with AX-93807,406 (1,843,185–1943,859), which represented a haplotype block and constituted six haplotype alleles. All the six alleles identified within this haplotype block showed significant differences in the phenotypes of HSW and SPP (Figures 5F,G). Similarly, six SNPs were in association with the reference marker AX-94176727 (45,780,783–46,573,568), which together formed a haplotype block on Chr.18. Eight alleles identified within this haplotype block showed substantial variation in the phenotypes of HSW and PPP (Figures 5H,I). Further, 13 SNP markers were in close association with AX-94199992 (11,625,046–12,289,831) and formed a haplotype block representing nine haplotype alleles (Figures 5J,K). The haplotype alleles of the AX-94199992 (11,625,046–12,289,831) block showed significant phenotypic variation in PNP and SNP (Figures 5H,I). Although haplotype alleles for most haplotype blocks showed significant differences in the phenotypes of different yield-related traits in six individual environments, a few exceptions were also observed. For example, the haplotype alleles of AX-93922099 (36,238,983–3,7,041,764) block on Chr.05 did not show significant phenotypic variation in HSW for E3 (NT1) and E6 (YZ2). Moreover, the haplotype alleles of all other haplotype blocks showed a significant phenotypic difference (p < 0.05) in their associated traits across all six environments. The phenotypic variance contributed by the alleles of different haplotype blocks to the associated traits across six environments is shown in Figure 5. The list of markers that are in close association with the reference markers and the effects of the common haplotypes are provided in Supplementary Table S4.
Genomic prediction
The genome-wide prediction accuracy values obtained from the gBLUP and rrBLUP approaches for the studied yield-related traits are presented in Figure 6. Based on the gBLUP approach, the GP accuracy of HSW among different environments ranged between 0.76 and 0.85 (Figure 6A). The E3 environment showed the lowest GP accuracy (0.76), while the combined environment displayed the highest GP accuracy (0.85) for HSW (Figure 6A). For the PPP trait, the E4 environment had the lowest GP accuracy with 0.44, while the highest accuracy was recorded in the E3 environment (0.72) (Figure 6B). Moreover, the GP accuracy for SPP varied from 0.46 to 0.72 in E4 and E3 environments, respectively (Figure 6C). Similarly, in the case of SYP, the GP accuracy was found to be highest (0.70) in the combined environment, whereas the lowest GP accuracy of 0.37 was observed in the E5 environment (Figure 6D). A similar trend in the genome-wide prediction accuracy was observed using the rrBLUP approach: HSW ranged between 0.78 and 0.85 for E3 and combined environment, respectively (Figure 6A); and PPP varied from 0.49 to 0.69. The PPP trait possessed the highest GP accuracy in the E1 environment and the lowest accuracy in the E2 environment (Figure 6B). Also, the GP accuracy for SPP and SYP respectively ranged from 0.50 (E4) to 0.73 (combined environment) and 0.36 (E5) to 0.72 (combined environment) (Figures 6C,D).
FIGURE 6
Discussion
Yield-related traits are important characters associated with yield and directly govern the productivity and quality of crops (Hina et al., 2020). They also represent selection targets in plant breeding programs when direct selection for yield is complex. Hence, crop germplasm collections are characterized for yield-related traits to facilitate crop improvement (Adeboye K. A. et al., 2021). In soybean, a complex inheritance pattern of yield and its sensitivity to the environment have been documented (Lee et al., 2015). Therefore, it has remained the long-term goal of breeders to improve soybean yield by manipulating yield-related traits. Determining the genetic basis of yield-related traits is a key step in soybean improvement strategy for developing varieties with higher yield potential.
In the present study, 211 soybean germplasm accessions were characterized in six field trials for four yield-related traits. The genotypic performance of the soybean germplasm based on all these traits varied significantly, indicating the possibility of genetic improvement. Moreover, the medium to high broad-sense heritability observed for these traits across environments is an indication that the same phenotypic performance is achievable if grown in the same environment. However, the significant environmental variations observed for all the four yield-related traits studied suggest possible complexity in their inheritance pattern which may lead to difficulty in breeding efforts. These findings corroborate many earlier reports on these yield-related traits in soybean germplasm (Hu et al., 2014; Diers et al., 2018; Klein et al., 2020; Li et al., 2020). Moreover, correlation analysis revealed a positive association of SYP with the three yield-related traits (PPP, SPP, and HSW) consistent with the findings of Malik et al. (2006). The HSW was negatively correlated with PPP and SPP; while PPP was positively associated with SPP. These results are in accordance with previous reports (Malik et al., 2006; Liu et al., 2011; Li et al., 2020).
Based on the high genetic variability observed, the studied yield-related traits were subjected to further analysis to unravel their genetic basis and pave the way for their improvement through marker-assisted breeding (MAB). MAB involves the identification of genetic markers that are associated with the trait of interest in a defined germplasm collection, such as bi-parental population or a panel of diverse accessions as used in this study. Marker-trait association using a panel of diverse accessions is often confounded by several factors, including genotyping error, population structure, and linkage disequilibrium. These factors are responsible for the high rate of false associations that are not useful in MAB. In this study, the discovery of false association was reduced by ensuring only quality markers which included a total of 12.617 SNPs at genotyping rate of 99%, which were retained for further analysis. Although the population structure of the germplasm collection used in this study appears continuous with no definite stratification, the LD decay distance of 670 kb within which significant association may be defined as relatively large. In self-pollinating plants such as soybean, LD may range over several hundred Kbp leading to the inclusion of many candidate genes in a single LD block exhibiting a significant signal (Gupta et al., 2005; Yano et al., 2016). Moreover, several studies have revealed that the discovery of false positives arising from population structure in crops may not be completely controlled (Myles et al., 2009; Hamblin et al., 2011; Lipka et al., 2015). Based on this, we explored various statistically robust models for the genome-wide marker-trait association analysis.
Hundreds of QTLs for yield and yield-related traits have been reported in soybean mainly by using the low-resolution approach of linkage mapping. Rarely any of these QTLs have been used for breeding high-yielding soybean varieties (Karikari et al., 2019). In this context, GWAS facilitates enhanced resolution and accuracy for mining genetic loci for four yield-related traits (Assefa et al., 2019; Zhang W. et al., 2021). In the current study, we report a total of 57 MTAs associated with four traits. These MTAs were detected on all chromosomes of soybean, except Chr.02 and Chr.10, indicating the complex genetic regulation of soybean yield, which is in agreement with previous reports (Li et al., 2019; Hu et al., 2020). Many significant MTAs were detected in one environment and some in five environments, suggesting the presence of environmental influence on these traits. Per the present results, the interaction of QTLs with the environment has been previously documented (Fang et al., 2020; Hu et al., 2020).
Significant SNPs reported in more than three environments and using different models were considered stable MTAs. The regions within ±670 kb flanking six significant SNPs were referred to as stable QTLs, based on LD decay (Wang et al., 2016). The QTL on Chr.11 associated with HSW has been previously reported in the genomic region between 27,790,963–32,194,459 bp (Han et al., 2012), and the genomic region underlying qHSW-SPP11 was found to co-locate with the same physical interval. Therefore, qHSW-SPP11 might be similar to Seed weight 35–9, as reported earlier by Han et al. (2012). Notably, compared to Seed weight 35–9, the physical interval of qHSW-SPP11 has been considerably decreased in the present study. Furthermore, qHSW5 identified in the present study was found to co-locate with two previously identified QTLs viz., Seed weight 34–9 (8,665,543–40,414,305 bp) and Seed-yield 22–10 (35,536,817–37,612,231 bp) on Chr.05 (Kraakman et al., 2004; Du et al., 2009; Han et al., 2012). However, the remaining four QTLs (qHSW-SPP13, qPPP-SNP20, qPPP-SPP4, and qHSW-PPP18) identified in the current study represented novel QTLs. The physical intervals of qHSW-SPP11 and qHSW5 were considerably reduced in the present study. This ability of the GWAS allows for its increased utility in crop breeding programs for developing high-yielding stress-tolerant soybean varieties (Zargar et al., 2015; Yu et al., 2019).
The favourable and unfavourable alleles can be easily determined either with or without considering the heterozygous SNPs in plant species (Soltani et al., 2017; Su et al., 2019). For instance, Wu et al. (2016) set the heterozygous SNPs as missing and only used the homozygous SNPs for a GWA study in Brassica napus. Soybean is a highly heterozygous crop species with a complex background, in which the presence of heterozygous loci is very common. A locus is considered to be in a heterozygous state if the depth of the minor allele is larger than one-third of the total sample depth during SNP calling (Chong et al., 2016). The above-mentioned six stable significant SNP loci (AX-93807,406, AX-93793,210, AX-94199992, AX-93922099, AX-93703,924, and AX-94176727) associated with yield-related traits were not all in a heterozygous state in the GWAS population. For example, the SNP markers AX-93807,406, AX-93793,210, and AX-94199992 were heterozygous, whereas the remaining three markers AX-93922099, AX-93703,924, and AX-94176727 were homozygous.
Trait values governed by the heterozygous alleles of three SNP markers (AX-93807,406, AX-93793,210, and AX-94199992) were intermediate between two homozygous alleles which control the extreme phenotypes of yield-related traits. However, two homozygous alleles identified for the remaining three SNP markers (AX-93922099, AX-93703,924, and AX-94176727) regulate contrasting/extreme trait values of the corresponding traits. As a result, the SNP alleles with higher trait effect, i.e., which increase the target trait, were defined as “favourable alleles”; whereas, SNP alleles regulating the lowest trait value were defined as “unfavourable alleles”. However, the heterozygous alleles possessing trait effect between favourable and unfavourable alleles were referred to as “intermediate alleles”. This classification assisted in the use of these alleles for yield modulation in soybean. To date, the effectiveness of marker-based gene pyramiding strategies in soybean has been demonstrated for soybean mosaic virus (Wang D. G. et al., 2017), Phytophthora rot and powdery mildew resistance (Ramalingam et al., 2020), and rust resistance (Yamanaka and Hossain, 2019). Hence, the elite alleles identified for yield-related traits within six significant SNP markers can be effectively used for developing high-yielding soybean varieties through MAB efforts. Negligible efforts have been made toward mining candidate genes for yield-related traits in soybean (Karikari et al., 2019; Li et al., 2019; Qi et al., 2020); except for two genes that have been reported viz., in (Jeong et al., 2012) and PP2C-1 (Lu et al., 2011). In the present study, we predicted some putative genes underlying six QTLs identified based on the gene expression data and annotations. We selected only those genes whose functions were directly or indirectly related to regulating the seed yield of soybeans, such as seed oil, seed protein, photosynthesis, cell division or elongation, and phytohormones. The putative genes identified in the present study need further functional validation for their deployment in soybean breeding programs.
Recent studies have documented desirable haplotype alleles for important traits such as salinity tolerance in soybean (Patil et al., 2016), grain quality traits in rice (Wang X. et al., 2017), and drought stress tolerance in pigeon pea (Sinha et al., 2020). In the present study, haplotypes were constructed by using six significant SNP markers as a reference. These six stable markers possessed multiple significant SNP markers within the LD range of 670 kbp. Our results revealed that haplotype alleles identified within the haplotype blocks/loci regulated a diverse range of phenotypes of yield-related traits in soybean. The haplotype analysis revealed that, compared to individual SNP markers, the haplotype-based markers possessed a considerably higher number of alleles regulating a diverse range of phenotypic variation for the trait of interest, similar to previous studies (Zaitlen et al., 2005; Qian et al., 2017). Hence, haplotype-based markers provided more options to modulate the desired yield potential in soybean (Meuwissen et al., 2001). In the case of significant SNP markers identified, we found a maximum of three alleles in the GWAS population, which allowed to modify the yield of soybean at three levels. The incorporation of these haplotype alleles in soybean breeding programs can effectively improve yield potential in soybean. We propose that the haplotype-based breeding approach will assist in the selection of desirable plant genotypes possessing superior haplotype alleles (Varshney et al., 2019). Parent accessions with diverse haplotypes can be used for the generation of novel superior haplotypes. However, it is important to identify the interactive effects of diverse haplotypes of various genes regulating the trait of interest.
Genomic Prediction (GP) is a modern breeding approach that involves the use of genome-wide markers to estimate the breeding value of the genotypes at the genomic level (Meuwissen et al., 2001; Varshney et al., 2014). For the past 2 decades, GP has emerged as a powerful tool to select favourable genetic material for traits of interest (Bhat et al., 2016; Crossa et al., 2017). In the present study, GWAS identified minor-to-moderate effect QTLs. Thus, it was hypothesized that the GP method could be more appropriate to select high-yielding genotypes based on the overall marker effect (Varshney et al., 2014). Different statistical models have been developed and used for GP analysis (Daetwyler et al., 2010; Wang et al., 2018; Merrick and Carter, 2021). However, these methods mainly differ in the assumptions of the distribution and variances of marker effects (Wang et al., 2015). In the present study, we explored two approaches, including the gBLUP and rrBLUP, both of which are based on the mixed linear model statistical functions. Therefore, our results show a similar trend in their prediction accuracy as expected, suggesting their equal potential and efficiency in the prediction of yield-related traits in soybean.
The range of moderate to high GP accuracy of 100-seed weight and seed yield observed in our study is similar to the observation of Ravelombola et al. (2021) and Matei et al. (2018) in soybean based on rrBLUP approach. Similarly, Duhnen et al. (2017) reported a moderate GP accuracy for the seed yield of soybean based on the gBLUP approach. Moreover, moderate to high GP accuracy has been reported for yield-related traits from both rrBLUP and gBLUP approaches in other crops such as wheat (Ali et al., 2020), tea (Lubanga et al., 2021), rice (Xu et al., 2018), and chickpea (Roorkiwal et al., 2016). The genomic prediction results from our study revealed that accurate breeding values for the studied yield-related traits can be estimated at an earlier generation of soybean, which allows for yield improvement within a short breeding cycle.
Conclusion
The present study used GWAS, haplotype analysis, and GP for studying the genetic architecture of four yield and yield-related traits in soybean. GWAS identified a total of 57 significant SNPs and six stable QTL regions (qPPP-SPP4, qHSW5, qHSW-SPP11, qHSW-SPP13, qHSW-PPP18, and qPPP-SPP20). Among these six QTLs, four QTLs (qPPP-SPP4, qHSW-SPP13, qHSW-PPP18, and qPPP-SPP20) were novel; whereas, the remaining two QTLs (qHSW5 and qHSW-SPP11) were reported previously. Besides, a total of 15 genes underlying these six QTLs were prioritized as putative candidates. Allele-effect analysis of the six significant SNPs showed the presence of two or three alleles within each of these SNPs that regulated contrasting phenotypes of the associated traits. Moreover, multiple haplotype alleles detected within each of the six haplotype blocks regulated a diverse range of phenotypic variation for yield and yield-related traits. The GP analysis for four studied traits showed moderate to high accuracy using two methods (gBLUP and rrBLUP). The stable QTLs as well as the desirable SNP alleles and haplotype alleles (underlying these stable QTLs) identified for the yield-related traits can serve as potential resource for the improvement of soybean yield. After proper validation of these QTLs and alleles/haplotypes in different genetic backgrounds of soybean, they can be introduced into marker-assisted breeding programs for developing high-yielding soybean varieties. Besides, the putative candidate genes underlying these stable QTLs, after proper functional validation using overexpression or gene knockout studies, can be deployed in the development of high-yielding soybean varieties. Our study provided critical analyses of cultivated soybean genetic resources and identified novel genomic resources (QTLs and haplotype alleles) for soybean yield improvement programs.
Statements
Data availability statement
The original contributions presented in the study are publicly available. This data can be found here: “https://www.soybase.org/projects/SoyBase.C2021.03.php”.
Author contributions
JB, DY, RKV conceived and planned the experiments. JB, DH performed the experiments. KA, analyzed the data. KA, JB, SG, RB, and DH interpreted, validated and visualized the results. JB, KA wrote the initial draft of the manuscript. JB, DY, RKV supervised the project. All the authors read and revised the manuscript.
Funding
This work was supported in part by National Natural Science Foundation of China (No. 32090065, and Ministry of Science and Technology (No. 2017YFE0111000). JB also thank International Genome Center, Jiangsu University for their research assistance and facilities provided. RKV is thankful to Food Futures Institute, Murdoch University for supporting this research in part.
Conflict of interest
The authors declare that the research was conducted in the absence of any commercial or financial relationships that could be construed as a potential conflict of interest.
Publisher’s note
All claims expressed in this article are solely those of the authors and do not necessarily represent those of their affiliated organizations, or those of the publisher, the editors and the reviewers. Any product that may be evaluated in this article, or claim that may be made by its manufacturer, is not guaranteed or endorsed by the publisher.
Supplementary material
The Supplementary Material for this article can be found online at: https://www.frontiersin.org/articles/10.3389/fgene.2022.953833/full#supplementary-material
References
1
AdeboyeK. A.OduwayeO. A.DanielI. O.FofanaM.SemonM. (2021b). Characterization of flowering time response among recombinant inbred lines of WAB638-1/PRIMAVERA rice under reproductive stage drought stress. Plant Genet. Resour.19 (1), 1–8. 10.1017/S1479262121000010
2
AdeboyeK. A.SemonM.OyetundeO. A.OduwayeO. A.AdebamboA. O.FofanaM.et al (2021a). Diversity array technology (DArT)-based mapping of phenotypic variations among recombinant inbred lines of WAB638-1/PRIMAVERA under drought stress. Euphytica217, 130. 10.1007/s10681-021-02860-6
3
AlemuA.FeyissaT.MaccaferriM.SciaraG.TuberosaR.AmmarK.et al (2021). Genome-wide association analysis unveils novel QTLs for seminal root system architecture traits in Ethiopian durum wheat. BMC Genomics22, 20–16. 10.1186/s12864-020-07320-4
4
AliM.ZhangY.RasheedA.WangJ.ZhangL. (2020). Genomic prediction for grain yield and yield-related traits in Chinese winter wheat. Int. J. Mol. Sci.21, 1342. 10.3390/ijms21041342
5
AlqudahA. M.SallamA.BaenzigerP. S.BörnerA. (2020). Gwas: Fast-Forwarding gene identification and characterization in temperate cereals: Lessons from barley–A review. J. Adv. Res.22, 119–135. 10.1016/j.jare.2019.10.013
6
AssefaT.OtyamaP. I.BrownA. V.KalbererS. R.KulkarniR. S.CannonS. B. (2019). Genome-wide associations and epistatic interactions for internode number, plant height, seed weight and seed yield in soybean. BMC Genomics20, 527. 10.1186/s12864-019-5907-7
7
Badu-AprakuB.AdewaleS.PaterneA. A.GedilM.ToyinboJ.AsieduR. (2020). Identification of QTLs for grain yield and other traits in tropical maize under Striga infestation. PLoS ONE15, e0239205. 10.1371/journal.pone.0239205
8
BecheE.GillmanJ. D.SongQ.NelsonR.BeissingerT.DeckerJ.et al (2021). Genomic prediction using training population design in interspecific soybean populations. Mol. Breed.41, 15. 10.1007/s11032-021-01203-6
9
BevanM. W.UauyC.WulffB. B.ZhouJ.KrasilevaK.ClarkM. D. (2017). Genomic innovation for crop improvement. Nature543, 346–354. 10.1038/nature22011
10
BhatJ. A.AliS.SalgotraR. K.MirZ. A.DuttaS.JadonV.et al (2016). Genomic selection in the era of next generation sequencing for complex traits in plant breeding. Front. Genet.7, 221. 10.3389/fgene.2016.00221
11
BhatJ. A.DeshmukhR.ZhaoT.PatilG.DeokarA.ShindeS.et al (2020). Harnessing high-throughput phenotyping and genotyping for enhanced drought tolerance in crop plants. J. Biotechnol.324, 248–260. 10.1016/j.jbiotec.2020.11.010
12
BhatJ. A.KarikariB.AdeboyeK. A.GanieS. A.BarmukhR.HuD.et al (2022). Identification of superior haplotypes in a diverse natural population for breeding desirable plant height in soybean. Theor. Appl. Genet.135, 2407–2422. 10.1007/s00122-022-04120-0
13
BhatJ. A.YuD.BohraA.GanieS. A.VarshneyR. K. (2021). Features and applications of haplotypes in crop breeding. Commun. Biol.4, 1266. 10.1038/s42003-021-02782-y
14
BianchiJ. S.QuijanoA.GospariniC. O.MorandiE. N. (2020). Changes in leaflet shape and seeds per pod modify crop growth parameters, canopy light environment, and yield components in soybean. Crop J.8, 351–364. 10.1016/j.cj.2019.09.011
15
BrachiB.MorrisG. P.BorevitzJ. O. (2011). Genome-wide association studies in plants: The missing heritability is in the field. Genome Biol.12, 232–238. 10.1186/gb-2011-12-10-232
16
BradburyP. J.ZhangZ.KroonD. E.CasstevensT. M.RamdossY.BucklerE. S. (2007). Tassel: Software for association mapping of complex traits in diverse samples. Bioinformatics23, 2633–2635. 10.1093/bioinformatics/btm308
17
ChongX.ZhangF.WuY.YangX.ZhaoN.WangH.et al (2016). A SNP-enabled assessment of genetic diversity, evolutionary relationships and the identification of candidate genes in chrysanthemum. Genome Biol. Evol.8, 3661–3671. 10.1093/gbe/evw270
18
CrossaJ.Pérez-RodríguezP.CuevasJ.Montesinos-LópezO.JarquínD.De Los CamposG.et al (2017). Genomic selection in plant breeding: Methods, models, and perspectives. Trends Plant Sci.22, 961–975. 10.1016/j.tplants.2017.08.011
19
DaetwylerH. D.Pong-WongR.VillanuevaB.WoolliamsJ. A. (2010). The impact of genetic architecture on genome-wide evaluation methods. Genetics185, 1021–1031. 10.1534/genetics.110.116855
20
DiersB. W.SpechtJ.RaineyK. M.CreganP.SongQ.RamasubramanianV.et al (2018). Genetic architecture of soybean yield and agronomic traits. G38, 3367–3375. 10.1534/g3.118.200332
21
DuW.WangM.FuS.YuD. (2009). Mapping QTLs for seed yield and drought susceptibility index in soybean (Glycine max L.) across different environments. J. Genet. Genom.36, 721–731. 10.1016/S1673-8527(08)60165-4
22
DuhnenA.GrasA.TeyssèdreS.RomestantM.ClaustresB.DaydéJ.et al (2017). Genomic selection for yield and seed protein content in soybean: A study of breeding program data and assessment of prediction accuracy. Crop Sci.57, 1325–1337. 10.2135/cropsci2016.06.0496
23
EndelmanJ. B.JanninkJ. L. (2012). Shrinkage estimation of the realized relationship matrix. G32, 1405–1413. 10.1534/g3.112.004259
24
EndelmanJ. B. (2011). Ridge regression and other kernels for genomic selection with R package rrBLUP. Plant Genome4, 250–255. 10.3835/plantgenome2011.08.0024
25
FangY.LiuS.DongQ.ZhangK.TianZ.LiX.et al (2020). Linkage analysis and multi-locus genome-wide association studies identify QTNs controlling soybean plant height. Front. Plant Sci.11, 9. 10.3389/fpls.2020.00009
26
GuptaP. K.RustgiS.KulwalP. L. (2005). Linkage disequilibrium and association studies in higher plants: Present status and future prospects. Plant Mol. Biol.57, 461–485. 10.1007/s11103-005-0257-z
27
HabierD.FernandoR. L.DekkersJ. C. (2007). The impact of genetic relationship information on genome-assisted breeding values. Genetics177, 2389–2397. 10.1534/genetics.107.081190
28
HamblinM. T.BucklerE. S.JanninkJ.-L. (2011). Population genetics of genomics-based crop improvement methods. Trends Genet.27, 98–106. 10.1016/j.tig.2010.12.003
29
HanY.LiD.ZhuD.LiH.LiX.TengW.et al (2012). QTL analysis of soybean seed weight across multi-genetic backgrounds and environments. Theor. Appl. Genet.125, 671–683. 10.1007/s00122-012-1859-x
30
HillW. G.WeirB. S. (1988). Variances and covariances of squared linkage disequilibria in finite populations. Theor. Popul. Biol.33, 54–78. 10.1016/0040-5809(88)90004-4
31
HinaA.CaoY.SongS.LiS.SharminR. A.ElattarM. A.et al (2020). High-resolution mapping in two RIL populations refines major “QTL Hotspot” regions for seed size and shape in soybean (Glycine max L.). Int. J. Mol. Sci.21, 1040. 10.3390/ijms21031040
32
HuD.ZhangH.DuQ.HuZ.YangZ.LiX.et al (2020). Genetic dissection of yield-related traits via genome-wide association analysis across multiple environments in wild soybean (Glycine soja Sieb. and Zucc.). Planta251, 39–17. 10.1007/s00425-019-03329-6
33
HuZ.ZhangD.ZhangG.KanG.HongD.YuD. (2014). Association mapping of yield-related traits and SSR markers in wild soybean (Glycine soja Sieb. and Zucc.). Breed. Sci.63, 441–449. 10.1270/jsbbs.63.441
34
HuangM.LiuX.ZhouY.SummersR. M.ZhangZ. (2019). Blink: A package for the next level of genome-wide association studies with both individuals and markers in the millions. GigaScience8, giy154. 10.1093/gigascience/giy154
35
JeongN.SuhS. J.KimM. H.LeeS.MoonJ. K.KimH. S.et al (2012). Ln is a key regulator of leaflet shape and number of seeds per pod in soybean. Plant Cell24, 4807–4818. 10.1105/tpc.112.104968
36
JulkowskaM. M.SaadeS.AgarwalG.GaoG.PaillesY.MortonM.et al (2019). MVApp—Multivariate analysis application for streamlined data analysis and curation. Plant Physiol.180, 1261–1276. 10.1104/pp.19.00235
37
KarikariB.ChenS.XiaoY.ChangF.ZhouY.KongJ.et al (2019). Utilization of interspecific high-density genetic map of RIL population for the QTL detection and candidate gene mining for 100-seed weight in soybean. Front. Plant Sci.10, 1001. 10.3389/fpls.2019.01001
38
KleinA.HoutinH.Rond-CoissieuxC.Naudet-HuartM.TouratierM.MargetP.et al (2020). Meta-analysis of QTL reveals the genetic control of yield-related traits and seed protein content in pea. Sci. Rep.10, 15925. 10.1038/s41598-020-72548-9
39
KraakmanA. T.NiksR. E.Van den BergP. M.StamP.Van EeuwijkF. A. (2004). Linkage disequilibrium mapping of yield and yield stability in modern spring barley cultivars. Genetics168, 435–446. 10.1534/genetics.104.026831
40
LebedevV. G.LebedevaT. N.ChernodubovA. I.ShestibratovK. A. (2020). Genomic selection for forest tree improvement: Methods, achievements and perspectives. Forests11, 1190. 10.3390/f11111190
41
LeeC.ChoiM. S.KimH. T.YunH. T.LeeB.ChungY. S.et al (2015). Soybean [Glycine max (L.) Merrill]: Importance as a crop and pedigree reconstruction of Korean varieties. Plant Breed. Biotechnol.2, 179–196. 10.9787/pbb.2015.3.3.179
42
LiD.ZhaoX.HanY.LiW.XieF. (2019). Genome-wide association mapping for seed protein and oil contents using a large panel of soybean accessions. Genomics111, 90–95. 10.1016/j.ygeno.2018.01.004
43
LiM.LiuY.WangC.YangX.LiD.ZhangX.et al (2020). Identification of traits contributing to high and stable yields in different soybean varieties across three Chinese latitudes. Front. Plant Sci.10, 1642. 10.3389/fpls.2019.01642
44
LipkaA. E.KandianisC. B.HudsonM. E.YuJ.DrnevichJ.BradburyP. J.et al (2015). From association to prediction: Statistical methods for the dissection and selection of complex traits in plants. Curr. Opin. Plant Biol.24, 110–118. 10.1016/j.pbi.2015.02.010
45
LipkaA. E.TianF.WangQ.PeifferJ.LiM.BradburyP. J.et al (2012). Gapit: Genome association and prediction integrated tool. Bioinformatics28, 2397–2399. 10.1093/bioinformatics/bts444
46
LiuW.KimM. Y.VanK.LeeY. H.LiH.LiuX.et al (2011). QTL identification of yield-related traits and their association with flowering and maturity in soybean. J. Crop Sci. Biotechnol.14, 65–70. 10.1007/s12892-010-0115-7
47
LiuX.HuangM.FanB.BucklerE. S.ZhangZ. (2016). Iterative usage of fixed and random effect models for powerful and efficient genome-wide association studies. PLoS Genet.12, e1005767. 10.1371/journal.pgen.1005767
48
LiuX.RahmanT.SongC.YangF.SuB.CuiL.et al (2018). Relationships among light distribution, radiation use efficiency and land equivalent ratio in maize-soybean strip intercropping. Field Crops Res.224, 91–101. 10.1016/j.fcr.2018.05.010
49
LuX.XiongQ.ChengT.LiQ. T.LiuX. L.BiY. D.et al (2011). A PP2C-1 allele underlying a quantitative trait locus enhances soybean 100-seed weight. Mol. Plant10, 670–684. 10.1016/j.molp.2017.03.006
50
LubangaN.MassaweF.MayesS. (2021). Genomic and pedigree‐based predictive ability for quality traits in tea (Camellia sinensis (L.) O. Kuntze). Euphytica217, 32–15. 10.1007/s10681-021-02774-3
51
MalikM. F. A.QureshiA. S.AshrafM.GhafoorA. (2006). Genetic variability of the main yield related characters in soybean. Int. J. Agri. Biol.8, 815–819.
52
MateiG.WoyannL. G.MilioliA. S.de Bem OliveiraI.ZdziarskiA. D.ZanellaR.et al (2018). Genomic selection in soybean: Accuracy and time gain in relation to phenotypic selection. Mol. Breed.38, 117. 10.1007/s11032-018-0872-4
53
MendonçaL. D. F.GalliG.MaloneG.Fritsche-NetoR. (2020). Genomic prediction enables early but low‐intensity selection in soybean segregating progenies. Crop Sci.60, 1346–1361. 10.1002/csc2.20072
54
MerrickL. F.CarterA. H. (2021). Comparison of genomic selection models for exploring predictive ability of complex traits in breeding programs. Plant Genome14, e20158. 10.1002/tpg2.20158
55
MeuwissenT. H.HayesB. J.GoddardM. E. (2001). Prediction of total genetic value using genome-wide dense marker maps. Genetics157, 1819–1829. 10.1093/genetics/157.4.1819
56
MylesS.PeifferJ.BrownP. J.ErsozE. S.ZhangZ.CostichD. E.et al (2009). Association mapping: Critical considerations shift from genotyping to experimental design. Plant Cell21, 2194–2202. 10.1105/tpc.109.068437
57
PatilG.DoT.VuongT. D.ValliyodanB.LeeJ. D.ChaudharyJ.et al (2016). Genomic-assisted haplotype analysis and the development of high-throughput SNP markers for salinity tolerance in soybean. Sci. Rep.6, 19199. 10.1038/srep19199
58
PriceA. L.PattersonN. J.PlengeR. M.WeinblattM. E.ShadickN. A.ReichD. (2006). Principal components analysis corrects for stratification in genome-wide association studies. Nat. Genet.38, 904–909. 10.1038/ng1847
59
PurcellS.NealeB.Todd-BrownK.ThomasL.FerreiraM. A.BenderD.et al (2007). Plink: A tool set for whole-genome association and population-based linkage analyses. Am. J. Hum. Genet.81, 559–575. 10.1086/519795
60
QiZ.SongJ.ZhangK.LiuS.TianX.WangY.et al (2020). Identification of QTNs controlling 100-seed weight in soybean using multilocus genome-wide association studies. Front. Genet.11, 689. 10.3389/fgene.2020.00689
61
QianL.HickeyL. T.StahlA.WernerC. R.HayesB.SnowdonR. J.et al (2017). Exploring and harnessing haplotype diversity to improve yield stability in crops. Front. Plant Sci.8, 1534. 10.3389/fpls.2017.01534
62
RamalingamJ.AlagarasanG.SavithaP.LydiaK.PothirajG.VijayakumarE.et al (2020). Improved host-plant resistance to Phytophthora rot and powdery mildew in soybean (Glycine max (L.) Merr.). Sci. Rep.10, 13928. 10.1038/s41598-020-70702-x
63
RavelombolaW.QinJ.ShiA.SongQ.YuanJ.WangF.et al (2021). Genome-wide association study and genomic selection for yield and related traits in soybean. PLoS ONE16, e0255761. 10.1371/journal.pone.0255761
64
RavelombolaW. S.QinJ.ShiA.NiceL.BaoY.LorenzA.et al (2020). Genome-wide association study and genomic selection for tolerance of soybean biomass to soybean cyst nematode infestation. PLoS ONE15, e0235089. 10.1371/journal.pone.0235089
65
RemingtonD. L.ThornsberryJ. M.MatsuokaY.WilsonL. M.WhittS. R.DoebleyJ.et al (2001). Structure of linkage disequilibrium and phenotypic associations in the maize genome. Proc. Natl. Acad. Sci. U. S. A.98, 11479–11484. 10.1073/pnas.201394398
66
RollingW. R.DorranceA. E.McHaleL. K. (2020). Testing methods and statistical models of genomic prediction for quantitative disease resistance to Phytophthora sojae in soybean [Glycine max (L.) Merr] germplasm collections. Theor. Appl. Genet.133, 3441–3454. 10.1007/s00122-020-03679-w
67
RoorkiwalM.RathoreA.DasR. R.SinghM. K.JainA.SrinivasanS.et al (2016). Genome-enabled prediction models for yield related traits in chickpea. Front. Plant Sci.7, 1666. 10.3389/fpls.2016.01666
68
SahuP. K.MondalS.SaoR.VishwakarmaG.KumarV.DasB. K.et al (2020). Genome-wide association mapping revealed numerous novel genomic loci for grain nutritional and yield-related traits in rice (Oryza sativa L.) landraces. 3 Biotech.10, 487. 10.1007/s13205-020-02467-z
69
SchwarzG. (1978). Estimating the dimension of a model. Ann. Stat.6, 461–464. 10.1214/aos/1176344136
70
SeguraV.VilhjálmssonB. J.PlattA.KorteA.SerenÜ.LongQ.et al (2012). An efficient multi-locus mixed-model approach for genome-wide association studies in structured populations. Nat. Genet.44, 825–830. 10.1038/ng.2314
71
SinhaP.SinghV. K.SaxenaR. K.KhanA. W.AbbaiR.ChitikineniA.et al (2020). Superior haplotypes for haplotype‐based breeding for drought tolerance in pigeonpea (Cajanus cajan L.). Plant Biotechnol. J.18, 2482–2490. 10.1111/pbi.13422
72
SoltaniA.MafiMoghaddamS.WalterK.Restrepo-MontoyaD.MamidiS.SchroderS.et al (2017). Genetic architecture of flooding tolerance in the dry bean Middle-American diversity panel. Front. Plant Sci.8, 1183. 10.3389/fpls.2017.01183
73
SuJ.ZhangF.ChongX.SongA.GuanZ.FangW.et al (2019). Genome-wide association study identifies favorable SNP alleles and candidate genes for waterlogging tolerance in chrysanthemums. Hortic. Res.6, 21–13. 10.1038/s41438-018-0101-7
74
VarshneyR. K.BohraA.YuJ.GranerA.ZhangQ.SorrellsM. E. (2021). Designing future crops: Genomics-assisted breeding comes of age. Trends Plant Sci.26, 631–649. 10.1016/j.tplants.2021.03.010
75
VarshneyR. K.PandeyM. K.BohraA.SinghV. K.ThudiM.SaxenaR. K. (2019). Toward the sequence-based breeding in legumes in the post-genome sequencing era. Theor. Appl. Genet.132, 1797–1816. 10.1007/s00122-018-3252-x
76
VarshneyR. K.TerauchiR.McCouchS. R. (2014). Harvesting the promising fruits of genomics: Applying genome sequencing technologies to crop breeding. PLoS Biol.12, e1001883. 10.1371/journal.pbio.1001883
77
Voss-FelsK. P.CooperM.HayesB. J. (2019). Accelerating crop genetic gains with genomic selection. Theor. Appl. Genet.132, 669–686. 10.1007/s00122-018-3270-8
78
WangD. G.LinZ.KaiL. I.YingM. A.WangL. Q.YangY. Q.et al (2017a). Marker-assisted pyramiding of soybean resistance genes RSC4, RSC8, and RSC14Q to soybean mosaic virus. J. Integ. Agri.16, 2413–2420.
79
WangJ.ChuS.ZhangH.ZhuY.ChengH.YuD. (2016). Development and application of a novel genome-wide SNP array reveals domestication history in soybean. Sci. Rep.6, 20728. 10.1038/srep20728
80
WangX.PangY.WangC.ChenK.ZhuY.ShenC.et al (2017b). New candidate genes affecting rice grain appearance and milling quality detected by genome-wide and gene-based association analyses. Front. Plant Sci.7, 1998. 10.3389/fpls.2016.01998
81
WangX.XuY.HuZ.XuC. (2018). Genomic selection methods for crop improvement: Current status and prospects. Crop J.6, 330–340. 10.1016/j.cj.2018.03.001
82
WangX.YangZ.XuC. (2015). A comparison of genomic selection methods for breeding value prediction. Sci. Bull. (Beijing).60, 925–935. 10.1007/s11434-015-0791-2
83
WuJ.ZhaoQ.LiuS.ShahidM.LanL.CaiG.et al (2016). Genome-wide association study identifies new loci for resistance to Sclerotinia stem rot in Brassica napus. Front. Plant Sci.7, 1418. 10.3389/fpls.2016.01418
84
XuY.WangX.DingX.ZhengX.YangZ.XuC.et al (2018). Genomic selection of agronomic traits in hybrid rice using an NCII population. Rice11, 32–10. 10.1186/s12284-018-0223-4
85
YamanakaN.HossainM. M. (2019). Pyramiding three rust‐resistance genes confers a high level of resistance in soybean (Glycine max). Plant Breed.138, 686–695. 10.1111/pbr.12720
86
YangJ.LiuZ.ChenQ.QuY.TangJ.LübberstedtT.et al (2020). Publisher correction: Mapping of QTL for grain yield components based on a DH population in maize. Sci. Rep.10, 13218. 10.1038/s41598-020-70123-w
87
YanoK.YamamotoE.AyaK.TakeuchiH.LoP. C.HuL.et al (2016). Genome-wide association study using whole-genome sequencing rapidly identifies new genes influencing agronomic traits in rice. Nat. Genet.48, 927–934. 10.1038/ng.3596
88
YuZ.ChangF.LvW.SharminR. A.WangZ.KongJ.et al (2019). Identification of QTN and candidate gene for seed-flooding tolerance in soybean [Glycine max (L.) Merr.] using genome-wide association study (GWAS). Genes10, 957. 10.3390/genes10120957
89
YueF.Rong-rongZ.Ze-chuanL.Li-yongC.Xing-huaW.Shi-huaC. (2015). Quantitative trait locus analysis for rice yield traits under two nitrogen levels. Rice Sci.22, 108–115. 10.1016/j.rsci.2015.05.014
90
ZaitlenN. A.KangH. M.FeoloM. L.SherryS. T.HalperinE.EskinE. (2005). Inference and analysis of haplotypes from combined genotyping studies deposited in dbSNP. Genome Res.15, 1594–1600. 10.1101/gr.4297805
91
ZargarS. M.RaatzB.SonahH.BhatJ. A.DarZ. A.AgrawalG. K.et al (2015). Recent advances in molecular marker techniques: Insight into QTL mapping, GWAS and genomic selection in plants. J. Crop Sci. Biotechnol.18, 293–308. 10.1007/s12892-015-0037-5
92
ZatybekovA.AbugalievaS.DidorenkoS.GerasimovaY.SidorikI.AnuarbekS.et al (2017). GWAS of agronomic traits in soybean collection included in breeding pool in Kazakhstan. BMC Plant Biol.17, 179. 10.1186/s12870-017-1125-0
93
ZengA.ChenP.KorthK.HancockF.PereiraA.BryeK.et al (2017). Genome-wide association study (GWAS) of salt tolerance in worldwide soybean germplasm lines. Mol. Breed.37, 30–14. 10.1007/s11032-017-0634-8
94
ZhangJ.SongQ.CreganP. B.NelsonR. L.WangX.WuJ.et al (2015). Genome-wide association study for flowering time, maturity dates and plant height in early maturing soybean (Glycine max) germplasm. BMC Genomics16, 217. 10.1186/s12864-015-1441-4
95
ZhangS.HaoD.ZhangS.ZhangD.WangH.DuH.et al (2021a). Genome-wide association mapping for protein, oil and water-soluble protein contents in soybean. Mol. Genet. Genomics296, 91–102. 10.1007/s00438-020-01704-7
96
ZhangT.WuT.WangL.JiangB.ZhenC.YuanS.et al (2019). A combined linkage and GWAS analysis identifies QTLs linked to soybean seed protein and oil content. Int. J. Mol. Sci.20, 5915. 10.3390/ijms20235915
97
ZhangW.XuW.ZhangH.LiuX.CuiX.LiS.et al (2021b). Comparative selective signature analysis and high-resolution GWAS reveal a new candidate gene controlling seed weight in soybean. Theor. Appl. Genet.134, 1329–1341. 10.1007/s00122-021-03774-6
98
ZhangZ.ErsozE.LaiC. Q.TodhunterR. J.TiwariH. K.GoreM. A.et al (2010). Mixed linear model approach adapted for genome-wide association studies. Nat. Genet.42, 355–360. 10.1038/ng.546
Summary
Keywords
haplotype-based breeding, GWAS, legumes, seed yield, candidate genes, crop improvement
Citation
Bhat JA, Adeboye KA, Ganie SA, Barmukh R, Hu D, Varshney RK and Yu D (2022) Genome-wide association study, haplotype analysis, and genomic prediction reveal the genetic basis of yield-related traits in soybean (Glycine max L.). Front. Genet. 13:953833. doi: 10.3389/fgene.2022.953833
Received
26 May 2022
Accepted
22 July 2022
Published
17 August 2022
Volume
13 - 2022
Edited by
Aamir Raina, Aligarh Muslim University, India
Reviewed by
Nisha Singh, Gujarat Biotechnology University, India
Valerio Hoyos-Villegas, McGill University, Montreal, Canada
Karansher Singh Sandhu, Bayer Crop Science, United States
Updates
Copyright
© 2022 Bhat, Adeboye, Ganie, Barmukh, Hu, Varshney and Yu.
This is an open-access article distributed under the terms of the Creative Commons Attribution License (CC BY). The use, distribution or reproduction in other forums is permitted, provided the original author(s) and the copyright owner(s) are credited and that the original publication in this journal is cited, in accordance with accepted academic practice. No use, distribution or reproduction is permitted which does not comply with these terms.
*Correspondence: Javaid Akhter Bhat, javid.akhter69@gmail.com; Rajeev K. Varshney, rajeev.varshney@murdoch.edu.au; Deyue Yu, dyyu@njau.edu.cn
†These authors share first authorship
This article was submitted to Plant Genomics, a section of the journal Frontiers in Genetics
Disclaimer
All claims expressed in this article are solely those of the authors and do not necessarily represent those of their affiliated organizations, or those of the publisher, the editors and the reviewers. Any product that may be evaluated in this article or claim that may be made by its manufacturer is not guaranteed or endorsed by the publisher.