 Myungsuk Kim1†Kye Won Park2†Yeongseon Ahn3Eun Bi Lim3Soo Heon Kwak4
 Ahmad Randy1‡No Joon Song2Kyong Soo Park4Chu Won Nho5*
 Yoon Shin Cho3*
- 1Natural Product Research Center, Korea Institute of Science and Technology, Gangneung, South Korea
- 2Department of Food Science and Biotechnology, Sungkyunkwan University, Suwon, South Korea
- 3Department of Biomedical Science, Hallym University, Chuncheon, South Korea
- 4Department of Internal Medicine, Seoul National University College of Medicine, Seoul, South Korea
- 5Smart Farm Research Center, Korea Institute of Science and Technology, Gangneung, South Korea
Although there are a number of discoveries from genome-wide association studies (GWAS) for obesity, it has not been successful in linking GWAS results to biology. We sought to discover causal genes for obesity by conducting functional studies on genes detected from genetic association analysis. Gene-based association analysis of 917 individual exome sequences showed that HOGA1 attains exome-wide significance (p-value < 2.7 × 10⁻⁶) for body mass index (BMI). The mRNA expression of HOGA1 is significantly increased in human adipose tissues from obese individuals in the Genotype-Tissue Expression (GTEx) dataset, which supports the genetic association of HOGA1 with BMI. Functional analyses employing cell- and animal model-based approaches were performed to gain insights into the functional relevance of Hoga1 in obesity. Adipogenesis was retarded when Hoga1 was knocked down by siRNA treatment in a mouse 3T3-L1 cell line and a similar inhibitory effect was confirmed in mice with down-regulated Hoga1. Hoga1 antisense oligonucleotide (ASO) treatment reduced body weight, blood lipid level, blood glucose, and adipocyte size in high-fat diet-induced mice. In addition, several lipogenic genes including Srebf1, Scd1, Lp1, and Acaca were down-regulated, while lipolytic genes Cpt1l, Ppara, and Ucp1 were up-regulated. Taken together, HOGA1 is a potential causal gene for obesity as it plays a role in excess body fat development.
Introduction
Obesity, characterized by increased adipose tissue mass, poses a major unmet public health problem since it is a risk factor for many metabolic diseases and cancer (Kopelman, 2000; Ghaben and Scherer, 2019). Excess energy intake relative to energy expenditure during obesity promotes body weight gain by storing the remaining calories in triglycerides in the adipose tissue (Ng et al., 2014). The hypothalamus-adipose axis plays an important role in weight gain by regulating food intake and energy expenditure (Arora and Anubhuti, 2006). Obesity-related genes are known to be involved in appetite-related signals, adipocyte growth and differentiation, energy expenditure regulation, or insulin metabolism and adipose tissue inflammation (Gonzalez Jimenez, 2011). Considering the increasing incidence of obesity worldwide, discovering genetic factors is of fundamental significance to overcome the risk of obesity and its comorbidities. Although a number of obesity genetic factors were identified from numerous genetic studies, the molecular mechanism of adipogenesis has not been fully elucidated.
Obesity is a heritable disease and more than 250 common genetic variants are identified, mainly by genome-wide association studies (GWASs) for body mass index (BMI) over the past decade (Wen et al., 2012; Monda et al., 2013; Wen et al., 2014; Locke et al., 2015; Winkler et al., 2015; Akiyama et al., 2017). However, these GWAS loci (mostly common variants) do not fully explain BMI heritability (Manolio et al., 2009; Nolte et al., 2017). Moreover, most reported GWAS genes for BMI are not necessarily causal. Recently, a large-scale GWA meta-analysis combining 718,734 individuals discovered 14 rare or low-frequency genetic variants (minor allele frequency; MAF <5%) in 13 genes associated with BMI (Turcot et al., 2018). However, there are few examples that GWAS discoveries are linked to biology (Visscher et al., 2017).
Recently, deep sequencing of all known exons through high-throughput sequencing technology detected low-frequency disease-causing variants (Buermans and den Dunnen, 2014). This technology was employed in numerous genetic studies for diverse traits to better understand genetic heritability and to discover functional variants or genes for traits of interest (Yohe and Thyagarajan, 2017). In this regard, exome sequencing of 917 adult subjects was conducted to identify novel causal genes for obesity. Furthermore, biological approaches were employed to validate the potential causal genes detected from genetic association analysis.
Materials and methods
Subjects
A total of 917 subjects from the Korean population were recruited between 2001 and 2014 at Seoul National University Hospital (Kwak et al., 2018). The study protocol was approved by the institutional review board (IRB) of the Biomedical Research Institute at Seoul National University Hospital (IRB No. 1205-130-411), and written informed consent was obtained from each participant. All clinical investigations were conducted in accordance with the Declaration of Helsinki.
Exome sequencing
Whole exome sequencing of 917 subjects was conducted as previously described (Kwak et al., 2017; Kwak et al., 2018). In brief, exome capture of genomic DNA was carried out using Agilent SureSelect v4+UTR and sequencing was conducted using an Illumina Hiseq (2000) sequencing system. The minimum and average read depths of coverage for the target region were 80X and 101X, respectively. The resulting sequence reads were aligned to the human reference genome buide 37 (GRCh37) and processed using Burrow-Wheeler Aligner (BWA) (Li and Durbin, 2009), Picard (http://broadinstitute.github.io/picard/), and Genome Analysis Toolkit (GATK) software (McKenna et al., 2010). Variant calling was performed using multi-sample HaplotypeCaller of GATK (McKenna et al., 2010). To ensure high-quality genotypes, variants were only called at sites where the low depth was ≥7, the genotype quality was ≥20, and the call rate was >0.90. Detailed quality control procedures for sequence data and the statistical summary of sequence read output were previously reported (Kwak et al., 2017).
Association analysis
Of the total of 635,881 SNVs called from whole exome sequencing of 917 subjects, SNVs with a Hardy-Weinberg equilibrium test p-value < 10–6 were excluded from the subsequent analyses (Lim et al., 2021). The SKAT-O test implemented in the EPACTS software pipeline (http://genome.sph.umich.edu/wiki/EPACTS) (Kang et al., 2010) was employed for gene-based association analysis for BMI. Association analysis was adjusted for age, sex, and type 2 diabetes (T2D) status of subjects assuming an additive genetic model. In this study, the exome-wide significance threshold was determined at p-value < 2.7 × 10⁻⁶ based on a Bonferroni correction for a total of 18,379 loci reported in gene-based association analysis.
Statistical analyses for quantitative data from 3T3-L1 cells and animal studies
In 3T3-L1 cell studies, relative gene expression levels measured from three independent experiments are presented as the mean ± standard deviation (SD). Group differences were assessed by the Wilcoxon rank-sum test. Statistical analyses were performed using R software. P-values < 0.05 were considered statistically significant.
Results of animal studies from more than three independent experiments are presented as the mean ± standard deviation (SD). Group differences were assessed using one-way analysis of variance (ANOVA), followed by Scheffe’s test. P-values < 0.05 were considered statistically significant. Statistical analyses were performed using SPSS 12.0 (SPSS Inc, Chicago, IL, United States).
HOGA1 expression in human tissues from the GTEx dataset
HOGA1 expression data and phenotype information (phs000424.GTEx.v7. p2. c1. GRU) were obtained from the GTEx data portal (https://gtexportal.org/home/) (GTEx_Consortium, 2017). HOGA1 expression was compared between 261 normal and 236 obese individuals by the Wilcoxon rank-sum test using RNA sequencing data of 848 adipocyte samples. BMIs above 30, between 25 and 30, and between 18.5 and 24.9 were considered obese, overweight, and normal according to the World Health Organization (WHO) obesity classification system. The association between BMI and HOGA1 expression in a total of 848 adipocyte samples was tested by linear regression analysis adjusted for age, sex, and race.
HOGA1 expression was compared between 49 normal and 49 obese individuals using RNA sequencing data of 188 liver tissue samples from the GTEx dataset. Group differences were assessed by the Wilcoxon rank-sum test. Statistical analyses were performed using R software. P-values < 0.05 were considered statistically significant.
Mouse 3T3-L1 cell culture and Oil-Red-O staining
3T3-L1 preadipocytes derived from mouse 3T3 cells were grown in DMEM (Dulbecco’s modified Eagle’s medium) culture medium supplemented with 10% bovine calf serum (BCS) and 1% penicillin in a humidified incubator containing 5% CO2 at 37°C. After the 3T3-L1 preadipocytes became 100% confluent, the medium was replaced with a differentiation medium containing 10% FBS (fetal bovine serum), 0.5 mM isobutylmethylxanthine, 1 μM dexamethasone, and 1 μg/ml insulin and cultured for 2 days. The medium was replaced with a differentiation medium every 2 days. On day 7, cells were washed twice with phosphate-buffered saline, fixed with 10% formalin for 20 min at room temperature, and then stained with 0.5% Oil-Red-O in isopropanol for 20 min. Cells were washed with water and images of each dish were taken using an Eclipse TE 2000U inverted microscope with twin CCD cameras (Nikon, Tokyo, Japan).
Transfection of 3T3-L1 cells with siRNA
Hoga1 siRNAs and scrambled control siRNA were designed according to GenBank accessions (Supplementary Table S2). Two days before incubating in the differentiation medium, 3T3-L1 cells were transfected with control or siRNA specific to Hoga1 (100 pmol). siRNA was incubated with Lipofectamine RNAiMAX (Invitrogen, United States) in DMEM for 20 min at room temperature before transfection. Six hours after transfection, the medium was replaced with a culture medium and further induced into adipocytes as described above. Differentiated adipocytes were assessed by Oil-Red-O staining and analyzed by quantitative real-time polymerase chain reaction (qRT-PCR) of adipogenic markers.
Animal experiments
Twenty one 5 week-old male C57BL/6J mice (Central Laboratory Animal Inc, Seoul, Korea) were housed in a controlled environment (25 ± 2○C, 55 ± 5% relative humidity, 12 h light–dark cycle). The mice were allowed free access to food and tap water during the experiment. To study the role of Hoga1 in vivo, antisense oligonucleotide (ASO) were used as previously described (Song et al., 2016). Briefly, two independent siRNAs for Hoga1 were designed for the mouse Hoga1 mRNA sequence and screened to select the most potent ASO (Supplementary Table S2). A control ASO with no complementary binding to any known gene sequence was synthesized (Genolution, Seoul, Korea) and diluted in a buffer containing 1 mmol/L ethylenediaminetetraacetic acid (EDTA) and 10 mmol/L TrisHCl, pH 7.4. After acclimatization for 2 weeks, mice were randomly divided into two groups: NCD (N = 7) and HFD (N = 14). The HFD group was fed a rodent diet (D12451, Research Diets, New Brunswick, NJ, United States) wherein 60% of the energy came from fat, 20% from carbohydrates, and 20% from protein. The fourteen mice in the HFD group were equally divided into two groups of seven and intraperitoneally injected with validated Hoga1 ASO (HFD Hoga1 ASO group), or control ASO (HFD vehicle group) twice per week (25 mg/kg) for 9 weeks. The NCD vehicle group was intraperitoneally injected with control ASO twice per week (25 mg/kg) for 9 weeks. The body weight and food intake were measured every week during animal experiments. All mice were sacrificed by cervical dislocation after overnight fasting at the end of Hoga1 ASO treatment. Fat pads and livers were removed, weighed, and frozen in liquid nitrogen. This study adhered to the Guide for the Care and Use of Laboratory Animals developed by the Institute of Laboratory Animal Resources of the National Research Council. The study protocol was approved by the Institutional Animal Care and Use Committee of the Korea Institute of Science and Technology in Seoul, Korea.
Histological and biochemical analyses
Blood samples were collected by cardiac puncture from all mice, and serum was separated by centrifugation at 7,000 rpm for 10 min and stored at −70○C for the subsequent analysis. White adipose tissue (WAT) and liver obtained from all mice were embedded in tissue-freezing medium (Leica, Wetzlar, Germany). Histological sections (5 μm thickness) of the tissues were cut, deparaffinized in xylene, and rehydrated in an alcohol solution gradient. After fixation, staining with hematoxylin and eosin (H&E) was performed, and adipocyte size was analyzed with an Eclipse TE 2000U inverted microscope with twin CCD cameras (×100 magnification; Nikon, Tokyo, Japan). TG, TC, and glucose levels were measured enzymatically using commercial kits (Asan Pham, Seoul, South Korea). Serum leptin, MCP-1, TNF-α, IL-6, and insulin were quantified using enzyme-linked immunosorbent assay (ELISA) kits (Abcam, Cambridge, United Kingdom). HOMA-IR was calculated using glucose and insulin levels. Each commercial kit was used according to the manufacturer’s instructions.
Western blot
Epididymal WAT and liver specimens from all mice (approximately 20 mg each) were homogenized in lysis buffer supplemented with a protease inhibitor cocktail (Sigma-Aldrich, Saint Lousis, MO, United States). Western blotting was performed as described in a previously published study (Kim et al., 2017). Target proteins were detected using specific antibodies with enhanced chemiluminescence (ECL) detection system (Amersham Pharmacia Biotech, Piscataway, NJ, United States) and visualized with a LuminoImager (LAS-3000 Bio Imaging Analysis System; Fuji Film Co., Tokyo, Japan).
Quantitative reverse transcriptase-polymerase chain reaction (qRT-PCR)
Total RNA was isolated from 3T3-L1 cells, livers, or WAT using Trizol reagent (Invitrogen, Carlsbad, CA, United States). Total RNA was quantified by nanodrop (Invitrogen, United States). cDNA was synthesized from 1 µg aliquots of the total RNA in a reaction mixture containing oligo (dT) and reverse transcription premix (ELPIS-Biotech, Daejeon, Korea). qRT-PCR was performed as described previously (Kim et al., 2017) using the SYBR Green master mix (Roche, Indianapolis, IN, United States) in the Light Cycler 480 real-time PCR system (Roche, Indianapolis, IN, United States). mRNA expression levels encoded by specific mouse genes were quantified using the specific primers listed in Supplementary Table S3.
Reagents and materials
3T3-L1 cells were purchased from the American Type Culture Collection (Manassas, VA, United States). Oil-Red-O, 3-(4,5-dimethylthiazol-2-yl)-2,5-diphenyltetrazolium bromide (MTT), and other reagents were purchased from Sigma-Aldrich (St. Louis, MO, United States). FBS, penicillin/streptomycin and DMEM were purchased from Hyclone (Logan, UT, United States). BCS was purchased from Gibco (Grand Island, NY, United States). Antibodies against SREBP-1c, SCD1, FAS, PPARα, PGC-1α, CPT-1L, and β-actin, and HRP-linked anti-rabbit and anti-mouse IgG secondary antibodies were from Cell Signaling Technology (Beverly, MA, United States) and Santa Cruz Biotechnology (Santa Cruz, CA, United States), while the antibody against Hoga1 was from Abcam (Cambridge, United Kingdom).
Results
Genetic association analysis for BMI
Genetic association analysis using whole exome sequencing (WES) data from 917 subjects was performed to identify the causal genes for obesity (Kwak et al., 2018). Among approximately 674,000 single nucleotide variants (SNVs) in WES, common variants (MAF ≥5%), low frequency variants (0.5% ≤ MAF <5%), and rare variants (MAF <0.5%) accounted for 16, 11, and 73%, respectively. Moreover, exonic variants accounted for approximately 34%.
An association test at the gene level was applied by grouping together rare variants to overcome the low power of rare variant association analysis. The SKAT-O test for gene-based analysis was performed to detect genes associated with BMI across all exonic loci (Figure 1). This test revealed one gene (HOGA1) at exome-wide significance (p < 2.7 × 10⁻⁶) with BMI (Table 1). The results of the skat-O test for the entire 18,379 loci reported in gene-based association analysis are shown in Supplementary Table 1.
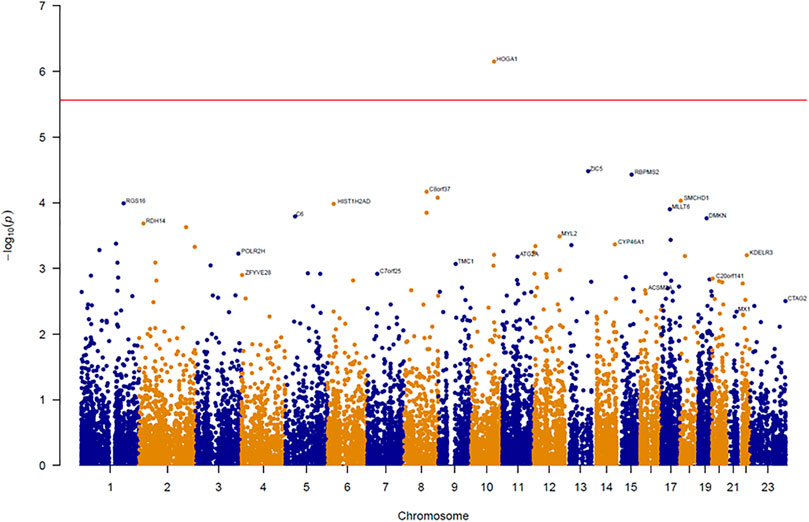
FIGURE 1. Manhattan plot of results from gene-based association analysis for BMI. The negative logarithm of the association p-value for genes distributed in the autosomal genome is represented as a dot. The red line represents the exome-wide significant p-value (p-value < 2.7 × 10⁻⁶).
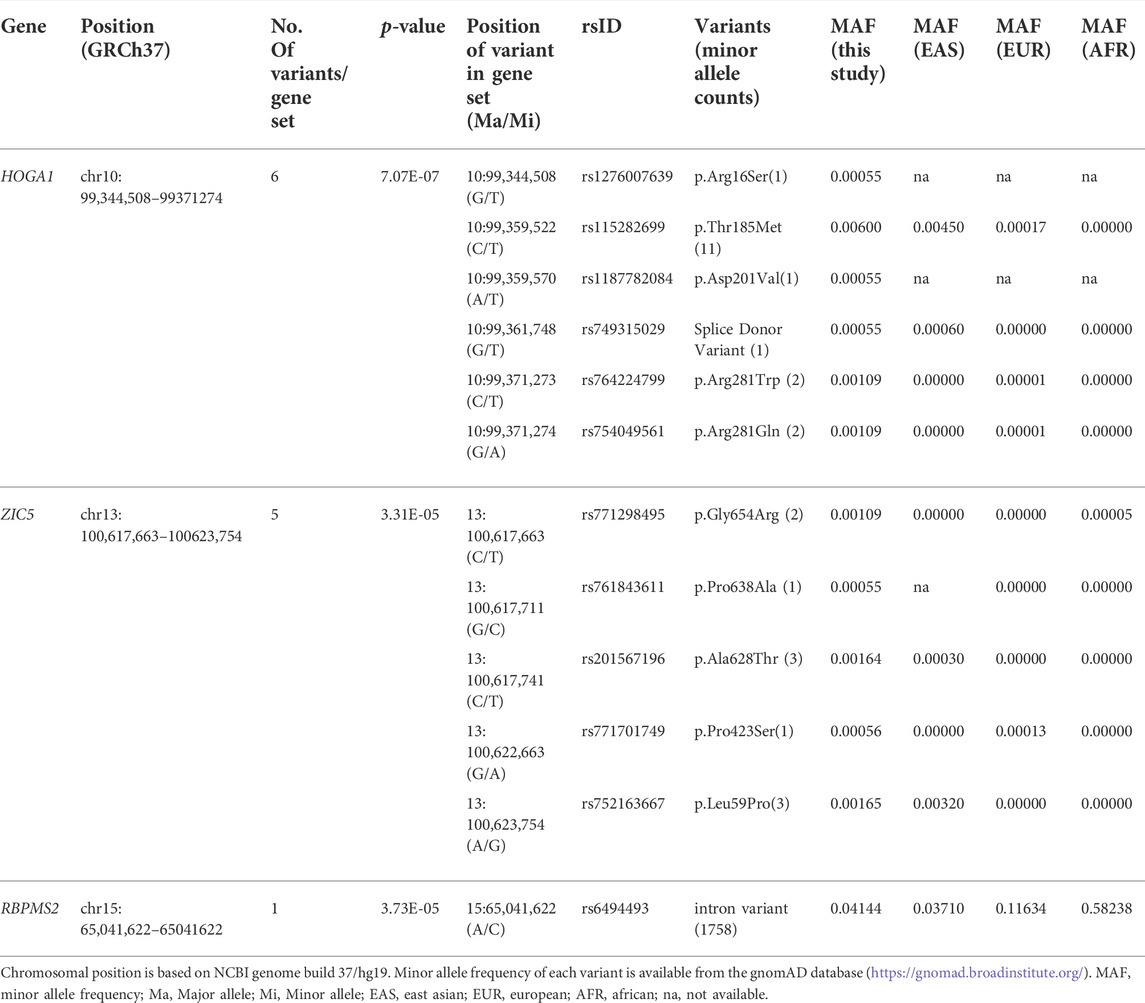
TABLE 1. Top three genes associated with BMI identified by gene-based test (p-value < 5 × 10⁻⁵).
HOGA1 expression in human adipocytes
HOGA1 expression was approximately 1.2-fold higher in samples from individuals with obesity compared with from normal individuals (Wilcoxon rank-sum test p-value = 0.0058) (Figure 2) using RNA sequencing data of 848 adipocyte tissues from The Genotype-Tissue Expression (GTEx) portal (https://gtexportal.org/home/) (GTEx_Consortium, 2017). Linear regression analysis adjusted for age, sex, and race further revealed the significant association between BMI and HOGA1 expression in 848 adipocyte samples (p-value = 0.001, β = 0.43 ± 0.13).
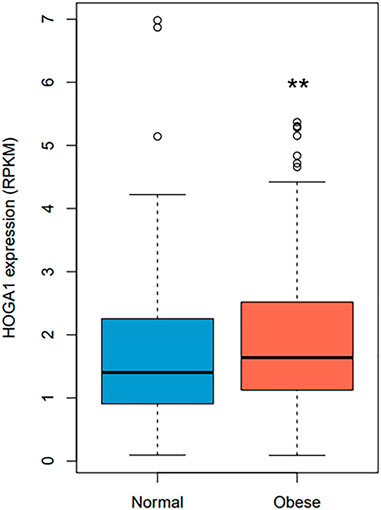
FIGURE 2. HOGA1 expression levels in adipocytes detected from the GTEx dataset. HOGA1 expression was compared between normal and obese individuals using RNA sequencing data of adipocyte samples. Group differences were assessed by the Wilcoxon rank-sum test (*p < 0.05, **p < 0.01, ***p < 0.001 vs normal).
mRNA expression of Hoga1 in mouse 3T3-L1 cells
The expression level of the mouse homolog of human HOGA1 (Hoga1) was first examined during adipocyte differentiation of 3T3-L1 cells derived from mouse 3T3 cells. Although 3T3-L1 cells have a fibroblast-like morphology, the cells display an adipocyte-like phenotype under appropriate differentiation conditions (Green and Kehinde, 1975; Zebisch et al., 2012). Increased Hoga1 expression was observed in response to adipogenic stimulation at the late stage together with the induced gene expression pattern of peroxisome proliferator-activated receptor gamma (Pparg), a key regulator of adipocyte differentiation (Figure 3A). This demonstrates that Hoga1 is likely involved in adipogenesis.
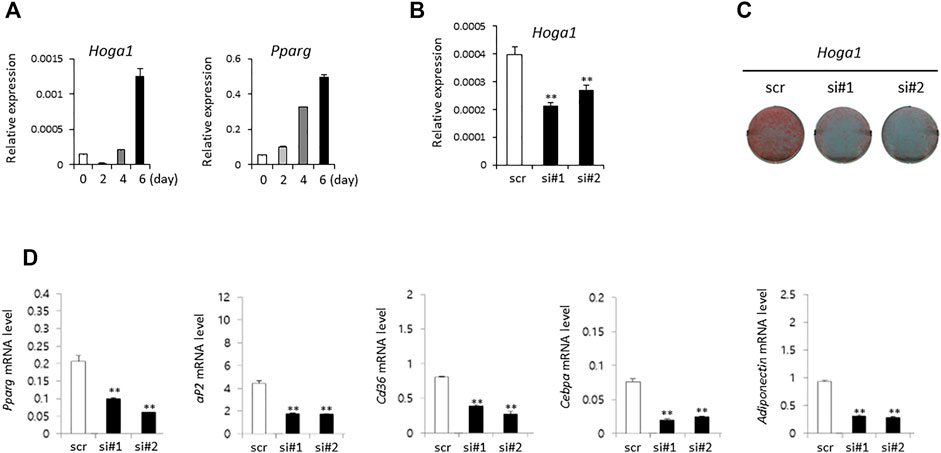
FIGURE 3. The effect of Hoga1 knockdown on adipogenesis in mouse 3T3-L1 cells. (A) Relative expression levels of Hoga1 and Pparg during adipocyte differentiation. (B) Hoga1 knockdown efficiency of two independent siRNAs (si#1 and si#2) compared to scrambled control siRNA (scr). (C) Lipid accumulation during adipocyte differentiation in 3T3-L1 pre-adipocytes transfected with two independent Hoga1-targeting siRNAs or scr siRNA. Red dots indicate lipid droplets stained with Oil-Red-O. (D) Expression levels of Pparg, aP2, Cd36, Cebpa, and Adiponectin genes related to adipogenesis in 3T3-L1 pre-adipocytes transfected with two independent Hoga1-targeting siRNAs or scr siRNA. Notes: The mRNA level of each gene was measured on day 1 after treatment with each Hoga1-siRNA or scr siRNA by RT-qPCR analysis. Results are expressed as the mean ± SD of three independent experiments (*p < 0.05 and **p < 0.01 vs scrambled control).
Effect of Hoga1 down-regulation on adipogenesis in 3T3-L1 cells
SiRNA treatment of Hoga1 in 3T3-L1 cells reduced Hoga1 mRNA by 25–50%, as observed by quantitative real time polymerase chain reaction (qRT-PCR, Figure 3B). Lipid accumulation indicating adipogenic differentiation was inhibited by reduced Hoga1 mRNA expression determined by Oil-Red-O staining (Figure 3C). Furthermore, Hoga1 knockdown significantly reduced the mRNA expression of genes involved in adipogenesis including Pparg, aP2, Cd36, Cebpa, and Adiponectin (Figure 3D). These results indicate the functional role of Hoga1 to adipocyte differentiation, and strongly imply that this gene has functional roles in adipogenesis.
Effect of Hoga1 down-regulation on diet-induced obese mice
C57BL/6J mice induced with a high-fat diet (HFD) were randomly divided and intraperitoneally injected with a control oligonucleotide (vehicle) or with Hoga1 ASO (25 mg/kg) twice a week. After 9 weeks of treatment, Hoga1 mRNA and protein levels in the epididymal white adipose tissue (eWAT) increased compared to those in the normocaloric diet (NCD) mice. This increase in Hoga1 mRNA and protein levels in the eWAT dropped to that of NCD mice when HFD-induced mice were treated with Hoga1 ASO (Figure 4A). However, the significant increase of Hoga1 was not detected in the liver of HFD-induced mice (Figure 4B). Similarly, no significant increase of this gene was observed in the liver of obese individuals in the GTEx dataset (Wilcoxon rank-sum test p-value = 0.297) (Supplementary Figure S1). These results strongly imply that Hoga1 is associated with adipogenesis.
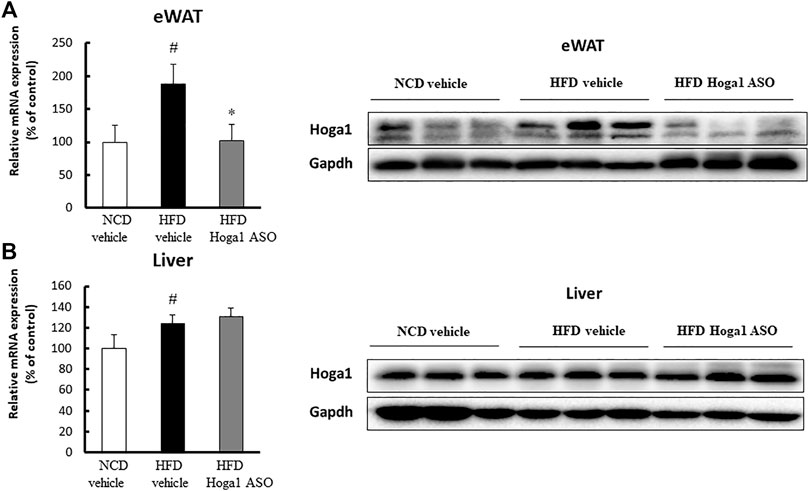
FIGURE 4. Increased Hoga1 expression in adipose tissues of diet-induced obese mice. High-fat diet (HFD) C57BL/6J mice were treated with Hoga1 ASO (HFD Hoga1 ASO) or scrambled control ASO (HFD vehicle) twice per week (25 mg per kg body weight per dose) for 6 weeks. In addition, normocaloric diet (NCD) mice were treated with scrambled control ASO (NCD vehicle). The mRNA and protein levels of Hoga1 in epididymal white adipose tissue (eWAT) (A) and in the liver (B) of the NCD vehicle, HFD vehicle, and HFD Hoga1 ASO groups were measured by qRT-PCR (left panel) and Western blot (right panel) analyses, respectively. Five mice were used per group (#p < 0.05 indicates a significant difference between the NCD vehicle and HFD vehicle; *p < 0.05 indicates a significant difference between the HFD vehicle and HFD Hoga1 ASO).
Hoga1 down-regulation induces reversible weight loss and plasma lipid levels in obese mice
Treatment of mice with Hoga1 ASO (25 mg/kg) suppressed the HFD-induced weight gain (Figure 5A). There was no effect of Hoga1 ASO on mouse food intake during the study (Figure 5B). Hoga1 suppression by ASO treatment in HFD-induced mice not only reduced the overall mass of epididymal fat, perirenal fat, and liver (Figures 6A,B) but also reduced adipocyte size in eWAT (Figures 6C,D). Hoga1 ASO-treated obese mice showed decreased serum triglyceride (TG) (47%), and leptin (38%), whereas total cholesterol (TC) in the serum did not significantly change (Figure 6E).
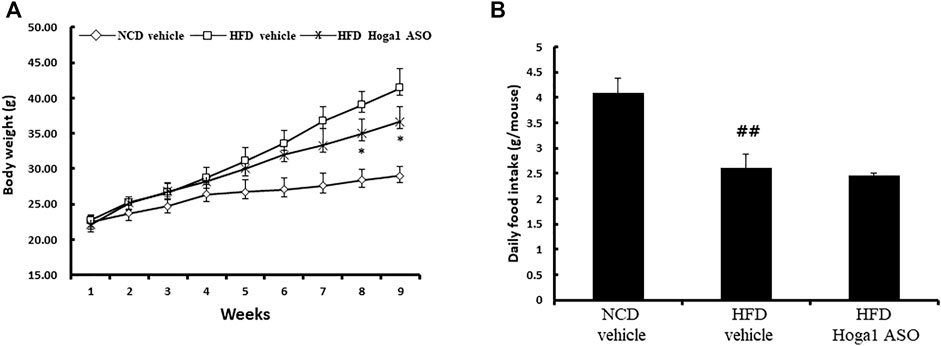
FIGURE 5. Reversible weight loss in diet-induced obese mice due to Hoga1 knockdown. Body weight gain (A) and food intake (B) in NCD and HFD mice treated with scrambled control ASO or Hoga1 ASO were measured from six mice per group (##p < 0.01 indicates a significant difference between the NCD vehicle and HFD vehicle; *p < 0.05 indicates a significant difference between the HFD vehicle and HFD Hoga1 ASO).
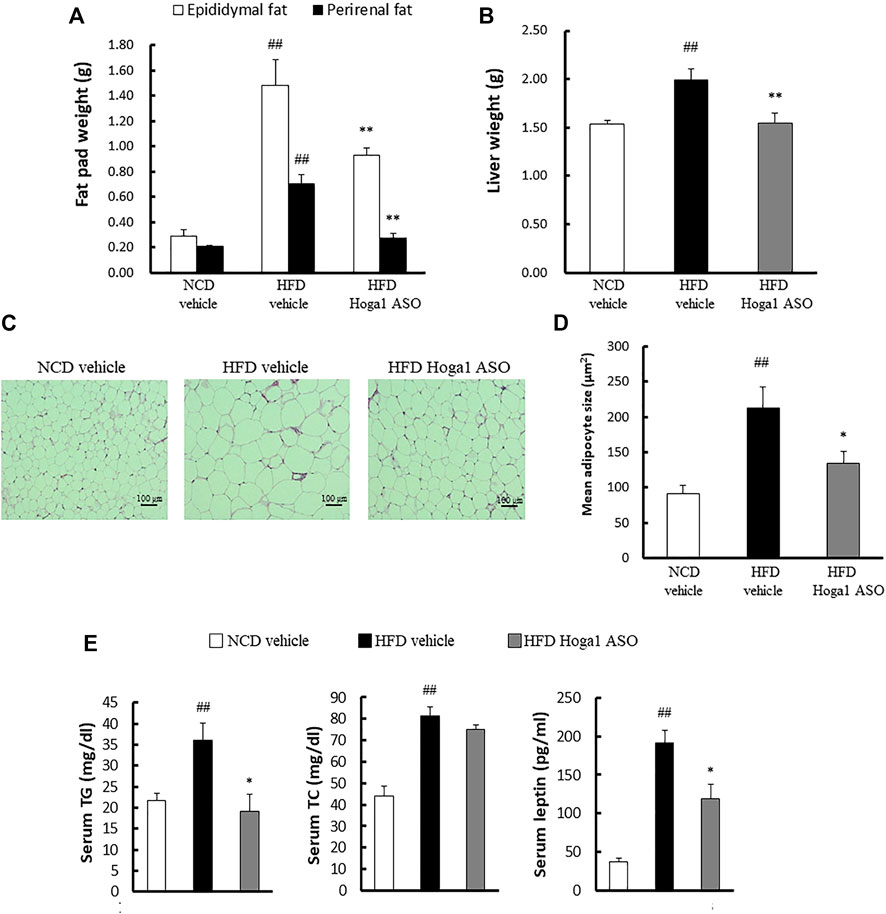
FIGURE 6. The effect of Hoga1 knockdown on lipid properties in obese mice. Fat pad (A) and liver (B) masses of C57BL/6J mice from NCD or HFD mice treated with scrambled control ASO or Hoga1 ASO were measured from six mice per group. (C) Representative images of H&E-stained sections from eWAT of NCD or HFD mice treated with scrambled control ASO or Hoga1 ASO (×200 magnification). (D) Average adipocyte size per microscopic field was compared among the NCD vehicle, HFD vehicle, and HFD Hoga1 ASO groups (N = 6 per group). (E) Triglyceride, total cholesterol, and leptin levels of NCD and HFD mice treated with scrambled control ASO or Hoga1 ASO were measured from six mice per group. Results are expressed as the mean ± SD of three independent experiments (##p < 0.01 indicates a significant difference between the NCD vehicle and HFD vehicle; *p < 0.05 and **p < 0.01 indicate significant differences between the HFD vehicle and HFD Hoga1 ASO, respectively).
Hoga1 down-regulation inhibits insulin resistance in obese mice
Obesity-induced insulin resistance has been reported (McArdle et al., 2013; Ye, 2013; Benomar and Taouis, 2019); therefore, T2D parameters were assessed in HFD-induced mice treated with Hoga1 ASO. Hoga1 ASO treatment ameliorated the clinical indexes of insulin resistance including glucose, insulin, and homeostatic model assessment of insulin resistance (HOMA-IR) levels in HFD-induced mice (Figure 7). This suggests that Hoga1 down-regulation improves insulin sensitivity in obese animals.
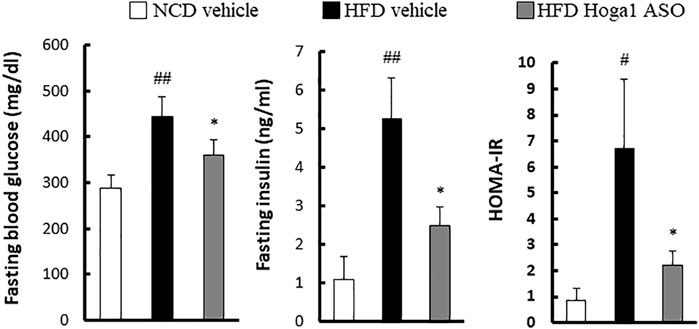
FIGURE 7. The effect of Hoga1 knockdown on clinical indexes of insulin resistance in obese mice. Fasting blood glucose, serum insulin concentration, and HOMA-IR were compared among the NCD vehicle, HFD vehicle, and HFD Hoga1 ASO groups (N = 6 per group). Results are expressed as the mean ± SD of three independent experiments (#p < 0.05 and ##p < 0.01 indicate significant differences between the NCD vehicle and HFD vehicle, respectively; *p < 0.05 indicates a significant difference between the HFD vehicle and HFD Hoga1 ASO).
Hoga1 down-regulation ameliorates adipose tissue inflammation in obese mice
Obesity induces chronic inflammation in adipose tissues (McArdle et al., 2013). We tested whether Hoga1 down-regulation prevents the infiltration of inflammatory macrophages into eWAT. Hoga1 ASO treatment in HFD-induced mice significantly reduced the mRNA levels of key inflammatory genes including Emr1, Icam1, Ccl2, and Ccl3 in eWAT (Figure 8A). Serum concentrations of inflammatory cytokines, including monocyte chemoattractant protein 1 (MCP-1), tumor necrosis factor-alpha (TNF-α), and interleukin-6 (IL-6) were lower in HFD-induced mice treated with Hoga1 ASO (HFD Hoga1 ASO) than in HFD-induced mice treated with scrambled control ASO (HFD vehicle) (Figure 8B). This suggests that Hoga1 down-regulation ameliorates adipose tissue inflammation in obese mice.
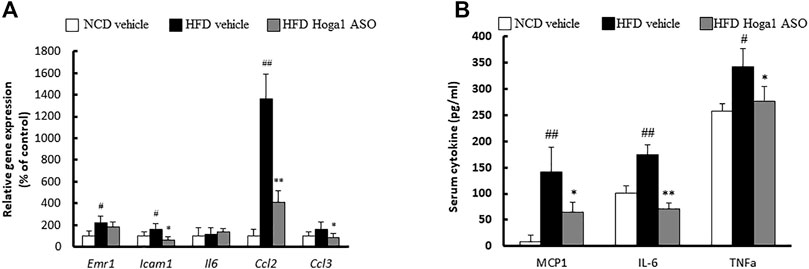
FIGURE 8. The effect of Hoga1 knockdown on adipose tissue inflammation in obese mice. (A) mRNA expression of inflammatory genes in eWAT was measured from NCD and HFD mice treated with scrambled control ASO or Hoga1 ASO (N = 5 per group). (B) Serum inflammatory cytokine concentrations compared among the NCD vehicle, HFD vehicle, and HFD Hoga1 ASO groups (N = 5 per group). Results are expressed as the mean ± SD of three independent experiments (#p < 0.05 and ##p < 0.01 indicate significant differences between the NCD vehicle and HFD vehicle; *p < 0.05 and **p < 0.01 indicate significant differences between the HFD vehicle and HFD Hoga1 ASO).
Molecular mechanism of Hoga1 in adipocyte differentiation
The expression levels of genes involved in lipid metabolism in eWAT were measured to gain insights into the molecular mechanism of Hoga1 in adipogenesis. The levels of proteins (sterol regulatory element-binding protein 1c [Srebp-1c], stearoyl-CoA desaturase [Scd], and fatty acid synthase [Fas]) (Figure 9A) and mRNAs (Acaca, Lpl, Scd1, and Srebf1) (Figure 9B) involved in lipogenesis were reduced in the Hoga1 ASO-treated group. In addition, the protein (Figure 9C) and mRNA (Figure 9D) levels of lipolytic genes such as peroxisome proliferator-activated receptor alpha (Ppara), carnitine palmitoyl transferase 1 (Cpt1a), Ppar-gamma coactivator 1 alpha (Pgc1α), and uncoupling 1 (Ucp1) were increased in the Hoga1 ASO-treated group. These results indicate that Hoga1 may enhance and suppress the expression of lipogenic and lipolytic genes, respectively.
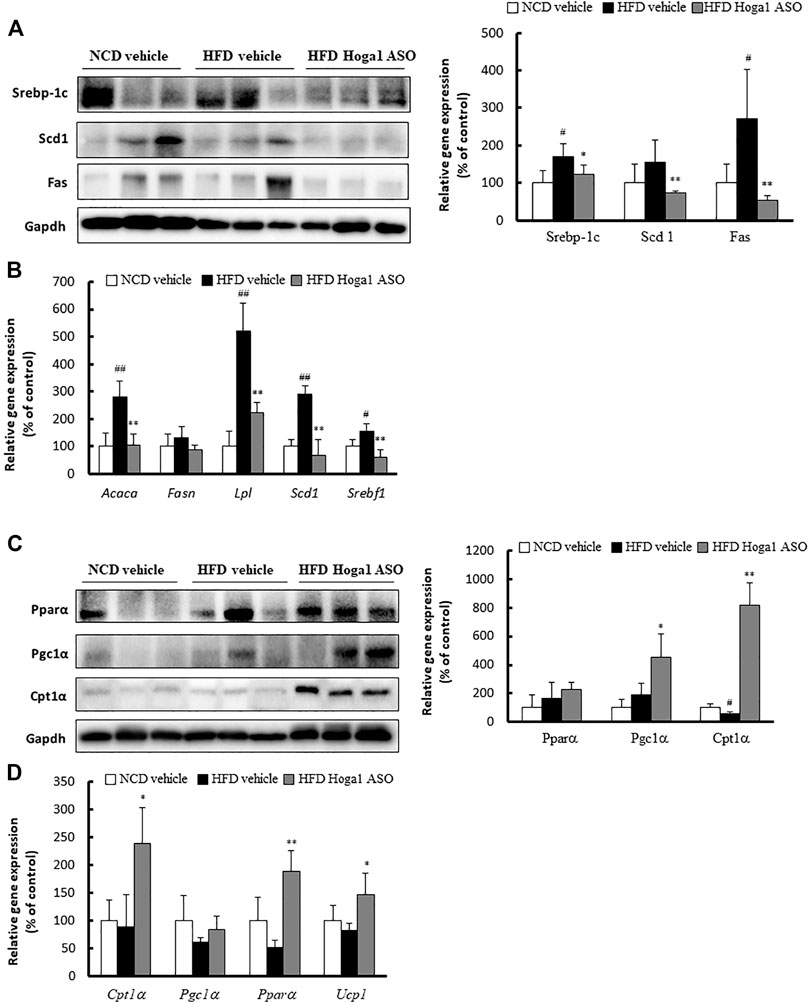
FIGURE 9. Lipogenic and lipolytic gene expression in mouse eWAT. The levels of proteins (A) and mRNAs (B) of lipogenic genes were compared in eWAT from NCD and HFD mice treated with scrambled control ASO or Hoga1 ASO. The levels of proteins (C) and mRNAs (D) of lipolytic genes were compared in eWAT from NCD and HFD mice treated with scrambled control ASO or Hoga1 ASO. Notes: N = 5 per group. Results are expressed as the mean ± SD of three independent experiments (#p < 0.05 and ##p < 0.01 indicate significant differences between the NCD vehicle and HFD vehicle; *p < 0.05 and **p < 0.01 indicate significant differences between the HFD vehicle and HFD Hoga1 ASO).
Discussion
In this study, exome-sequencing was employed to discover causal genes for obesity. A large portion of SNVs called from exome sequencing were rare variants. Single-variant testing using rare variants has some limitations in most association analyses because of the low power due to fewer variations and a high false positive rate due to sparse data distribution, unstable/biased parameter estimation, and inflated p-values (Kang et al., 2013; Lee et al., 2014). To avoid these limitations, a gene-based association analysis was designed to identify genes containing multiple risk variants that are individually and weakly associated with a univariate trait (Chung et al., 2019; Cirulli et al., 2020). The SKAT-O test used in this study includes sequence kernel association test (SKAT) and burden tests. This method was developed to maximize power in the presence of protective and deleterious variants, null variants, and a large number of causal variants with the same direction in a region (Lee et al., 2012).
The SKAT-O test for gene-based association analysis detected one gene (HOGA1), with exome-wide significance (p = 7.07 × 10⁻⁷) for BMI (Table 1 and Figure 1). This gene encodes mitochondrial 4-hydroxy-2-oxoglutarate aldolase 1 (HOGA1) which catalyzes the conversion of 4-hydroxy-2-oxoglutarate into glyoxylate and pyruvate (Riedel et al., 2011). Glyoxylate is then converted to oxalate by lactate dehydrogenase. HOGA1 also has a catalytic activity to convert oxaloacetate to pyruvate and carbon dioxide (Dekker and Kitson, 1992). Although the biological significance of this associated oxaloacetate decarboxylase activity is largely unknown, it suggests that the mitochondrial localization of HOGA1 is involved in the Krebs cycle. Indeed, mitochondria play a critical role in adipose tissue by regulating lipid and glucose homeostasis, energy expenditure, and adipocyte differentiation (Heinonen et al., 2015). HOGA1 is expressed primarily in the liver and kidney, and genetic variation of this gene is observed in patients with primary hyperoxalurea type III (Fang et al., 2019; Huang et al., 2019). This is the first study identifying the association of HOGA1 with BMI. In the GTEx dataset, a significantly increased expression of HOGA1 was observed in adipocytes from obese people (Figure 2), suggesting that HOGA1 is biologically relevant to adipogenesis.
We validated the functional role of Hoga1 in adipogenesis using mouse 3T3-L1 cells that exhibit a fibroblast-like morphology but have an adipocyte-like phenotype under appropriate differentiation conditions (Green and Kehinde, 1975; Zebisch et al., 2012). Hoga1 mRNA expression increased in mouse 3T3-L1 adipocytes during adipogenesis. In addition, adipogenesis was markedly inhibited in Hoga1 siRNA-treated 3T3-L1 cells. Based on these findings, we hypothesize that Hoga1 might act as an endogenous factor regulating adipocyte function.
Hormones regulate adipocyte differentiation via transcription factors and target genes involved in adipogenesis, including PPARγ, C/EBPα, aP2, CD36, and adiponectin (Lee et al., 2018). C/EBPβ is a key transcription factor involved in early adipocyte differentiation by promoting PPARγ expression which activates C/EBPα expression. Subsequently, PPARγ and C/EBPα activate the expression of numerous genes involved in terminal adipocyte differentiation (Tontonoz et al., 1994). Our study found that Hoga1 siRNA treatment decreased the expression of Pparγ, C/ebpα, aP2, Cd36, and adiponectin, indicating that Hoga1 knockdown suppressed intracellular lipid accumulation through the Pparγ and C/ebpα pathways.
The anti-obesity effect of Hoga1-targeted ASO was corroborated and extended in diet-induced obese mice. We hypothesized that the intraperitoneal route of injection with Hoga1 ASO contributed to adipose tissue infiltration. Treatment with Hoga1 ASO resulted in (i) reduced Hoga1 expression in eWAT, (ii) decreased adipocyte size and the expression of lipogenic key factors in the eWAT, and (iii) decreased inflammatory cytokine levels that are highly associated with metabolic dysregulation in tissue and serum. Weight loss in obesity ameliorates inflammatory factors (Forsythe et al., 2008); however, rapid and sustained weight loss is rarely possible. Mice with deletion of genes that play an important role in obesity-induced inflammation had improved insulin resistance and reduced hepatic lipid accumulation and liver weight compared to mice maintained on a HFD despite negligible changes in body weight (Kanda et al., 2006; Wueest et al., 2010). Our study showed a small but significant weight loss at the end of the 7-weeks observation period after Hoga ASO treatment, suggesting that prolonged treatment may lead to additional weight loss. A more intriguing finding was that the knockdown of Hoga1 expression drastically reduced adipose tissue size, adipose tissue weight to body weight ratio, and adipocyte diameter in epididymal fat depots.
Dysregulation of lipid metabolism is one of the major pathogenesis of obesity (Savage et al., 2007; Smilowitz et al., 2009). Circulating free fatty acids (FFAs) in the plasma are absorbed by metabolic organs such as adipose, liver, and muscle tissues and are converted to TGs via lipogenesis and lipid oxidation pathways (Olefsky, 2008). Lipogenic enzymes, including FAS and SCD, synthesized in hepatocytes and adipocytes, are regulated by SREBP-1c, a key transcription factor inducing TG biosynthesis (Harvatine and Bauman, 2006). Increases in these lipogenic factors significantly increase the levels of FFAs and cholesterol, leading to insulin resistance. However, lipolytic factors such as PPARα, CPT-1, and PGC-1α activate fatty acid oxidation and clearance. Thus, reduced lipogenic proteins and increased lipolytic proteins ameliorate obesity and dyslipidemia in HFD-induced obese mouse models (Boden, 2006). In this context, our study demonstrated that Hoga1 may enhance and suppress the expression of lipogenic and lipolytic genes, respectively in HFD-induced obese mice during adipogenesis. HOGA1-lipogenic (or lipolytic) protein interactions need to be elucidated to understand the molecular mechanism exerted by HOGA1 in adipogenesis.
Modulating the proliferation or differentiation of adipocytes may yield promising drug targets (Stumvoll et al., 2005; Biddinger and Kahn, 2006). However, our understanding of the complex genetic networks underlying adipocyte differentiation is incomplete, and little is known regarding which proteins are responsible for the binding and localization of transcriptional complexes in adipocytes. This study was conducted to leverage findings from the genetic association analysis to provide a biological understanding of obesity for future drug development. Overall, our data indicate that HOGA1 may act as an important regulator of adipogenesis. Therefore, targeting HOGA1 could be a potential therapeutic target for obesity.
Data availability statement
The original contributions presented in the study are included in the article/Supplementary Material, further inquiries can be directed to the corresponding authors. Exome sequencing data are available from the Clinical & Omics Data Archive (CODA) in the Korea National Institute of Health (https://coda.nih.go.kr) with the CODA accession number R001814 upon reasonable request.
Ethics statement
The studies involving human participants were reviewed and approved by the institutional review board (IRB) of the Biomedical Research Institute at Seoul National University Hospital (IRB No. 1205-130-411). The patients/participants provided their written informed consent to participate in this study. The animal study was reviewed and approved by Institutional Animal Care and Use Committee of the Korea Institute of Science and Technology.
Author contributions
CWN and YSC designed the study. SHK and KSP obtained the data. MK, AR, YA and EBL performed the experiments. MK, SHK, KWP and YSC analyzed the data. MK, KWP, CWN and YSC wrote the manuscript. All authors read and provided critical comments on the manuscript.
Funding
This study was supported by the National Research Foundation of Korea (NRF) (grant NRF2020R1I1A2075302), the Bio and Medical Technology Development Program of the National Research Foundation (NRF) funded by the Ministry of Science and ICT (2N64100), and KIST intramural fund 2Z06720. This research was supported by a grant from the Korea Health Technology R&D Project through the Korea Health Industry Development Institute, funded by the Ministry of Health and Welfare (grants HI15C1595).
Conflict of interest
The authors declare that the research was conducted in the absence of any commercial or financial relationships that could be construed as a potential conflict of interest.
Publisher’s note
All claims expressed in this article are solely those of the authors and do not necessarily represent those of their affiliated organizations, or those of the publisher, the editors and the reviewers. Any product that may be evaluated in this article, or claim that may be made by its manufacturer, is not guaranteed or endorsed by the publisher.
Supplementary material
The Supplementary Material for this article can be found online at: https://www.frontiersin.org/articles/10.3389/fgene.2022.951025/full#supplementary-material
References
Akiyama, M., Okada, Y., Kanai, M., Takahashi, A., Momozawa, Y., Ikeda, M., et al. (2017). Genome-wide association study identifies 112 new loci for body mass index in the Japanese population. Nat. Genet. 49 (10), 1458–1467. doi:10.1038/ng.3951
Arora, S., and Anubhuti, (2006). Role of neuropeptides in appetite regulation and obesity--a review. Neuropeptides 40 (6), 375–401. doi:10.1016/j.npep.2006.07.001
Benomar, Y., and Taouis, M. (2019). Molecular mechanisms underlying obesity-induced hypothalamic inflammation and insulin resistance: pivotal role of resistin/TLR4 pathways. Front. Endocrinol. 10, 140. doi:10.3389/fendo.2019.00140
Biddinger, S. B., and Kahn, C. R. (2006). From mice to men: insights into the insulin resistance syndromes. Annu. Rev. Physiol. 68, 123–158. doi:10.1146/annurev.physiol.68.040104.124723
Boden, G. (2006). Fatty acid-induced inflammation and insulin resistance in skeletal muscle and liver. Curr. Diab. Rep. 6 (3), 177–181. doi:10.1007/s11892-006-0031-x
Buermans, H. P., and den Dunnen, J. T. (2014). Next generation sequencing technology: advances and applications. Biochim. Biophys. Acta 1842 (10), 1932–1941. doi:10.1016/j.bbadis.2014.06.015
Chung, J., Jun, G. R., Dupuis, J., and Farrer, L. A. (2019). Comparison of methods for multivariate gene-based association tests for complex diseases using common variants. Eur. J. Hum. Genet. 27 (5), 811–823. doi:10.1038/s41431-018-0327-8
Cirulli, E. T., White, S., Read, R. W., Elhanan, G., Metcalf, W. J., Tanudjaja, F., et al. (2020). Genome-wide rare variant analysis for thousands of phenotypes in over 70, 000 exomes from two cohorts. Nat. Commun. 11 (1), 542. doi:10.1038/s41467-020-14288-y
Dekker, E. E., and Kitson, R. P. (1992). 2-Keto-4-hydroxyglutarate aldolase: purification and characterization of the homogeneous enzyme from bovine kidney. J. Biol. Chem. 267 (15), 10507–10514. doi:10.1016/s0021-9258(19)50046-1
Fang, X., He, L., Xu, G., Lin, H., Xu, M., and Geng, H. (2019). Nine novel HOGA1 gene mutations identified in primary hyperoxaluria type 3 and distinct clinical and biochemical characteristics in Chinese children. Pediatr. Nephrol. 34 (10), 1785–1790. doi:10.1007/s00467-019-04279-7
Forsythe, L. K., Wallace, J. M., and Livingstone, M. B. (2008). Obesity and inflammation: the effects of weight loss. Nutr. Res. Rev. 21 (2), 117–133. doi:10.1017/S0954422408138732
Ghaben, A. L., and Scherer, P. E. (2019). Adipogenesis and metabolic health. Nat. Rev. Mol. Cell Biol. 20 (4), 242–258. doi:10.1038/s41580-018-0093-z
Gonzalez Jimenez, E. (2011). Genes and obesity: a cause and effect relationship. Endocrinol. Nutr. 58 (9), 492–496. doi:10.1016/j.endonu.2011.06.004
Green, H., and Kehinde, O. (1975). An established preadipose cell line and its differentiation in culture. II. Factors affecting the adipose conversion. Cell 5 (1), 19–27. doi:10.1016/0092-8674(75)90087-2
GTEx_Consortium (2017). Genetic effects on gene expression across human tissues. Nature 550 (7675), 204–213. doi:10.1038/nature24277
Harvatine, K. J., and Bauman, D. E. (2006). SREBP1 and thyroid hormone responsive spot 14 (S14) are involved in the regulation of bovine mammary lipid synthesis during diet-induced milk fat depression and treatment with CLA. J. Nutr. 136 (10), 2468–2474. doi:10.1093/jn/136.10.2468
Heinonen, S., Buzkova, J., Muniandy, M., Kaksonen, R., Ollikainen, M., Ismail, K., et al. (2015). Impaired mitochondrial biogenesis in adipose tissue in acquired obesity. Diabetes 64 (9), 3135–3145. doi:10.2337/db14-1937
Huang, A., Burke, J., Bunker, R. D., Mok, Y. F., Griffin, M. D., Baker, E. N., et al. (2019). Regulation of human 4-hydroxy-2-oxoglutarate aldolase by pyruvate and alpha-ketoglutarate: implications for primary hyperoxaluria type-3. Biochem. J. 476 (21), 3369–3383. doi:10.1042/BCJ20190548
Kanda, H., Tateya, S., Tamori, Y., Kotani, K., Hiasa, K., Kitazawa, R., et al. (2006). MCP-1 contributes to macrophage infiltration into adipose tissue, insulin resistance, and hepatic steatosis in obesity. J. Clin. Invest. 116 (6), 1494–1505. doi:10.1172/JCI26498
Kang, H. M., Sul, J. H., Service, S. K., Zaitlen, N. A., Kong, S. Y., Freimer, N. B., et al. (2010). Variance component model to account for sample structure in genome-wide association studies. Nat. Genet. 42 (4), 348–354. doi:10.1038/ng.548
Kang, G., Jiang, B., and Cui, Y. (2013). Gene-based genomewide association analysis: a comparison study. Curr. Genomics 14 (4), 250–255. doi:10.2174/13892029113149990001
Kim, M., Yoo, G., Randy, A., Kim, H. S., and Nho, C. W. (2017). Chicoric acid attenuate a nonalcoholic steatohepatitis by inhibiting key regulators of lipid metabolism, fibrosis, oxidation, and inflammation in mice with methionine and choline deficiency. Mol. Nutr. Food Res. 61 (5), 1600632. doi:10.1002/mnfr.201600632
Kopelman, P. G. (2000). Obesity as a medical problem. Nature 404 (6778), 635–643. doi:10.1038/35007508
Kwak, S. H., Chae, J., Choi, S., Kim, M. J., Choi, M., Chae, J. H., et al. (2017). Findings of a 1303 Korean whole-exome sequencing study. Exp. Mol. Med. 49 (7), e356. doi:10.1038/emm.2017.142
Kwak, S. H., Chae, J., Lee, S., Choi, S., Koo, B. K., Yoon, J. W., et al. (2018). Nonsynonymous variants in PAX4 and GLP1R are associated with type 2 diabetes in an east Asian population. Diabetes 67 (9), 1892–1902. doi:10.2337/db18-0361
Lee, S., Wu, M. C., and Lin, X. (2012). Optimal tests for rare variant effects in sequencing association studies. Biostatistics 13 (4), 762–775. doi:10.1093/biostatistics/kxs014
Lee, S., Abecasis, G. R., Boehnke, M., and Lin, X. (2014). Rare-variant association analysis: study designs and statistical tests. Am. J. Hum. Genet. 95 (1), 5–23. doi:10.1016/j.ajhg.2014.06.009
Lee, R. A., Harris, C. A., and Wang, J. C. (2018). Glucocorticoid receptor and adipocyte biology. Nucl. Recept. Res. 5, 101373. doi:10.32527/2018/101373
Li, H., and Durbin, R. (2009). Fast and accurate short read alignment with Burrows-Wheeler transform. Bioinformatics 25 (14), 1754–1760. doi:10.1093/bioinformatics/btp324
Lim, W. Y., Lee, H., and Cho, Y. S. (2021). Identification of genetic variants for blood insulin level in sex-stratified Korean population and evaluation of the causal relationship between blood insulin level and polycystic ovary syndrome. Genes Genomics 43 (10), 1105–1117. doi:10.1007/s13258-021-01134-8
Locke, A. E., Kahali, B., Berndt, S. I., Justice, A. E., Pers, T. H., Day, F. R., et al. (2015). Genetic studies of body mass index yield new insights for obesity biology. Nature 518 (7538), 197–206. doi:10.1038/nature14177
Manolio, T. A., Collins, F. S., Cox, N. J., Goldstein, D. B., Hindorff, L. A., Hunter, D. J., et al. (2009). Finding the missing heritability of complex diseases. Nature 461 (7265), 747–753. doi:10.1038/nature08494
McArdle, M. A., Finucane, O. M., Connaughton, R. M., McMorrow, A. M., and Roche, H. M. (2013). Mechanisms of obesity-induced inflammation and insulin resistance: insights into the emerging role of nutritional strategies. Front. Endocrinol. 4, 52. doi:10.3389/fendo.2013.00052
McKenna, A., Hanna, M., Banks, E., Sivachenko, A., Cibulskis, K., Kernytsky, A., et al. (2010). The genome analysis Toolkit: a MapReduce framework for analyzing next-generation DNA sequencing data. Genome Res. 20 (9), 1297–1303. doi:10.1101/gr.107524.110
Monda, K. L., Chen, G. K., Taylor, K. C., Palmer, C., Edwards, T. L., Lange, L. A., et al. (2013). A meta-analysis identifies new loci associated with body mass index in individuals of African ancestry. Nat. Genet. 45 (6), 690–696. doi:10.1038/ng.2608
Ng, M., Fleming, T., Robinson, M., Thomson, B., Graetz, N., Margono, C., et al. (2014). Global, regional, and national prevalence of overweight and obesity in children and adults during 1980-2013: a systematic analysis for the global burden of disease study 2013. Lancet 384 (9945), 766–781. doi:10.1016/S0140-6736(14)60460-8
Nolte, I. M., van der Most, P. J., Alizadeh, B. Z., de Bakker, P. I., Boezen, H. M., Bruinenberg, M., et al. (2017). Missing heritability: is the gap closing? An analysis of 32 complex traits in the lifelines cohort study. Eur. J. Hum. Genet. 25 (7), 877–885. doi:10.1038/ejhg.2017.50
Olefsky, J. M. (2008). Fat talks, liver and muscle listen. Cell 134 (6), 914–916. doi:10.1016/j.cell.2008.09.001
Riedel, T. J., Johnson, L. C., Knight, J., Hantgan, R. R., Holmes, R. P., and Lowther, W. T. (2011). Structural and biochemical studies of human 4-hydroxy-2-oxoglutarate aldolase: implications for hydroxyproline metabolism in primary hyperoxaluria. PLoS One 6 (10), e26021. doi:10.1371/journal.pone.0026021
Savage, D. B., Petersen, K. F., and Shulman, G. I. (2007). Disordered lipid metabolism and the pathogenesis of insulin resistance. Physiol. Rev. 87 (2), 507–520. doi:10.1152/physrev.00024.2006
Smilowitz, J. T., Wiest, M. M., Watkins, S. M., Teegarden, D., Zemel, M. B., German, J. B., et al. (2009). Lipid metabolism predicts changes in body composition during energy restriction in overweight humans. J. Nutr. 139 (2), 222–229. doi:10.3945/jn.108.095364
Song, N. J., Choi, S., Rajbhandari, P., Chang, S. H., Kim, S., Vergnes, L., et al. (2016). Prdm4 induction by the small molecule butein promotes white adipose tissue browning. Nat. Chem. Biol. 12 (7), 479–481. doi:10.1038/nchembio.2081
Stumvoll, M., Goldstein, B. J., and van Haeften, T. W. (2005). Type 2 diabetes: principles of pathogenesis and therapy. Lancet 365 (9467), 1333–1346. doi:10.1016/S0140-6736(05)61032-X
Tontonoz, P., Hu, E., and Spiegelman, B. M. (1994). Stimulation of adipogenesis in fibroblasts by PPAR gamma 2, a lipid-activated transcription factor. Cell 79 (7), 1147–1156. doi:10.1016/0092-8674(94)90006-x
Turcot, V., Lu, Y., Highland, H. M., Schurmann, C., Justice, A. E., Fine, R. S., et al. (2018). Protein-altering variants associated with body mass index implicate pathways that control energy intake and expenditure in obesity. Nat. Genet. 50 (1), 26–41. doi:10.1038/s41588-017-0011-x
Visscher, P. M., Wray, N. R., Zhang, Q., Sklar, P., McCarthy, M. I., Brown, M. A., et al. (2017). 10 Years of GWAS discovery: biology, function, and translation. Am. J. Hum. Genet. 101 (1), 5–22. doi:10.1016/j.ajhg.2017.06.005
Wen, W., Cho, Y. S., Zheng, W., Dorajoo, R., Kato, N., Qi, L., et al. (2012). Meta-analysis identifies common variants associated with body mass index in east Asians. Nat. Genet. 44 (3), 307–311. doi:10.1038/ng.1087
Wen, W., Zheng, W., Okada, Y., Takeuchi, F., Tabara, Y., Hwang, J. Y., et al. (2014). Meta-analysis of genome-wide association studies in East Asian-ancestry populations identifies four new loci for body mass index. Hum. Mol. Genet. 23 (20), 5492–5504. doi:10.1093/hmg/ddu248
Winkler, T. W., Justice, A. E., Graff, M., Barata, L., Feitosa, M. F., Chu, S., et al. (2015). The influence of age and sex on genetic associations with adult body size and shape: A large-scale genome-wide interaction study. PLoS Genet. 11 (10), e1005378. doi:10.1371/journal.pgen.1005378
Wueest, S., Rapold, R. A., Schumann, D. M., Rytka, J. M., Schildknecht, A., Nov, O., et al. (2010). Deletion of Fas in adipocytes relieves adipose tissue inflammation and hepatic manifestations of obesity in mice. J. Clin. Invest. 120 (1), 191–202. doi:10.1172/JCI38388
Ye, J. (2013). Mechanisms of insulin resistance in obesity. Front. Med. 7 (1), 14–24. doi:10.1007/s11684-013-0262-6
Yohe, S., and Thyagarajan, B. (2017). Review of clinical next-generation sequencing. Arch. Pathol. Lab. Med. 141 (11), 1544–1557. doi:10.5858/arpa.2016-0501-RA
Keywords: exome sequencing, obesity, association analysis, adipogenesis, HOGA1, 3T3-L1, functional study
Citation: Kim M, Park KW, Ahn Y, Lim EB, Kwak SH, Randy A, Song NJ, Park KS, Nho CW and Cho YS (2022) Genetic association-based functional analysis detects HOGA1 as a potential gene involved in fat accumulation. Front. Genet. 13:951025. doi: 10.3389/fgene.2022.951025
Received: 23 May 2022; Accepted: 18 July 2022;
Published: 12 August 2022.
Edited by:
Clevio Nobrega, University of Algarve, PortugalReviewed by:
José María Moreno-Navarrete, CIBER Fisiopatología Obesidad y Nutrición (CIBEROBN), SpainPrashantha Hebbar, Dasman Diabetes Institute, Kuwait
Copyright © 2022 Kim, Park, Ahn, Lim, Kwak, Randy, Song, Park, Nho and Cho. This is an open-access article distributed under the terms of the Creative Commons Attribution License (CC BY). The use, distribution or reproduction in other forums is permitted, provided the original author(s) and the copyright owner(s) are credited and that the original publication in this journal is cited, in accordance with accepted academic practice. No use, distribution or reproduction is permitted which does not comply with these terms.
*Correspondence: Chu Won Nho, Y3duaG9Aa2lzdC5yZS5rcg==; Yoon Shin Cho, eW9vbmNobzMzQGhhbGx5bS5hYy5rcg==
†These authors have contributed equally to this work
‡Present addressess: Ahmad Randy, Research Center of Raw Material for Medicine and Traditional Medicine, National Research and Innovation Agency, Tangerang Selatan, Indonesia; Yeongseon Ahn, NGeneBio Corporation Research Institute, Seoul, South Korea