 Chahat Fatima1
 Muhammad Hammad Nadeem Tahir1
 Rao Muhammad Ikram2
 Zulqurnain Khan1
 Muhammad Sajjad3
 Ghulam Qanmber4
 Essam Darwish5Zhide Geng6Gao Xiangkuo6*
 Shoaib Ur Rehman1*
- 1Institute of Plant Breeding and Biotechnology, MNS University of Agriculture, Multan, Pakistan
- 2Department Agronomy, MNS University of Agriculture, Multan, Pakistan
- 3Department of Biosciences, COMSATS University Islamabad (CUI), Islamabad, Pakistan
- 4State Key Laboratory of Cotton Biology, Cotton Research Institute of Chinese Academy of Agricultural Sciences, Anyang, China
- 5Plant Physiology Section, Agricultural Botany Department, Faculty of Agriculture, Cairo University, Giza, Egypt
- 6Institute of Food Crops, Yunnan Academy of Agricultural Sciences, Kunming, China
The main function of histone protein is to provide support to the structure of chromosomes. It helps in binding a long thread of DNA into a more condensed shape to fit into the nucleus. From histone variants, histone H3 (HH3) plays a crucial role in plant growth and development. Characterization of histones has not been reported in Glycine max till now. The objective of this study was to characterize the HH3 gene family for molecular breeding of G. max. In this study, 17 HH3 members in G. max were identified by performing local BLASTp using HH3 members from Arabidopsis as a query. Phylogenetic analysis classified HH3 genes in seven clades. Sequence logo analysis among Arabidopsis thaliana, Oryza sativa, and Glycine max showed a higher level of similarity in amino acids. Furthermore, conserveness of G. max HH3 genes was also confirmed by Gene Structure Display. Ten paralogous gene pairs were identified in GmHH3 genes in the Glycine max genome by conducting collinearity analysis. G. max HH3 genes have experienced strong purifying selection pressure, with limited functional divergence originating from the segmental and whole-genome duplication, as evidenced by the Ka/Ks ratio. The KASP marker was developed for GmHH3-3 gene. Genotyping was performed on 46 G. max genotypes. This differentiation was based upon the presence of either GmHH3-3-C or GmHH3-3-T allele in the CDS region. The results showed that G. max accessions containing the GmHH3-3-T allele at respective locus showed higher thousand seed weight than that of those accessions that contain the GmHH3-3-C allele. This research provides the basic information to further decipher the function of HH3 in soybean.
Introduction
Histone proteins provide structural support to chromosomes and assist in binding long strands of DNA into a more compressed shape to reside in the nucleus. Some of the histone variants are associated with gene expression regulation. These DNA folding proteins are present in the chromosomes of all studied eukaryotic cells. Histones are highly conserved and are categorized into five extensive classes named HH1/H5, HH2A, HH2B, HH3, and HH4. On the basis of gene expression analysis, histone genes are classified into three basic classes, replication-dependent histones, replication-independent histones, and tissue-specific histones (Elsaesser, Goldberg, and Allis, 2010). The replication-dependent histones express highly just before the initiation of S-phase and are suppressed at the termination of DNA replication, while during the whole cell cycle, the replication-independent histone variants continuously express themselves; hence, they are also named as replacement histones (Filipescu, Müller, and Almouzni, 2014).
Mainly, all histone proteins are involved in the folding of chromosomes, but HH3 is associated with the chromosome structure (Bhasin, Reinherz, and Reche, 2006). In the case of histone H3, three different strains of HH3 proteins are found in both animals and plants: H3.1, H3.3, and the centromere-specific CENP-A (CENH3) (Stroud et al., 2012). H3.1 and H3.3 have the same length and amino acid sequence, while the CenH3 variants differ from these two by a large and extensive tail at the N-terminal (Malik and Henikoff, 2003).
The role of H3 protein in transcription has been demonstrated by genome-wide profiling of histone H3.3 variants in mammalian Drosophila (Deal, Henikoff, and Henikoff, 2010; Goldberg et al., 2011). Enrichment of H3.3 in pericentric heterochromatin and telomers has also been explored by other research (Wong et al., 2010). Histone H3 protein plays its peculiar role in distinct functions involving gene silencing, gene inactivation, genomic instability, and sex chromosome inactivation (Celeste et al., 2003; Fernandez-Capetillo et al., 2003). Genome-wide identification in Arabidopsis resulted in the identification of a male gamete–specific gene named AtMGH3 (Okada et al., 2005). Similarly, genome-wide analysis of two HH3 variants HH3.1 and HH3.3 highlighted similar genomic localization schemes with certain unique attributes in Arabidopsis (Stroud et al., 2012). H3.3 has been shown to be highly correlated with transcriptional activity in the transcribed regions, although H3.3 at promoters is often unrelated to transcription. (Shu et al., 2014). Genome-wide characterization of HH3 in cotton reported that GhHH3 genes were most appropriately expressed in the tissues of the ovule (Qanmber et al., 2019a). At present, no comprehensive report on the characterization of the HH3 gene family in soybean is available. We believe that this gene family has the potential to be used in the molecular breeding of soybean.
Soybean (G. max) is a leguminous crop with prime economic importance. Several studies reported the phenotypic differences between G. max and G. soja (ancestor of G. max), but both the species have the same number of chromosomes with normal meiotic chromosomal pairing and are cross-compatible.
In accordance with the importance of soybean, the present study aims for genome-wide characterization of the histone H3 gene family in G. max. This gene family has been broadly characterized in Gossypium hirsutum (Du et al., 2006; Qanmber et al., 2019a), Arabidopsis thaliana (Okada et al., 2005; Stroud et al., 2012), and Oryza sativa (Du et al., 2006; Hu and Lai, 2015), but currently there is no extensive and detailed study reporting the genome-wide characterization of HH3 genes in G. max. The whole-genome sequencing of soybean in the past decade (Wollmann et al., 2012; Qi et al., 2014) has opened the way to study various gene families in soybean by using modern genome-wide approaches. The availability of pan-genome is expected to pave the way for molecular breeding in soybean. Although quantitative trait loci and SNP-based markers have been reported (Seo et al., 2022), continuous searching for genes underpinning yield and its director contributing traits should continue for sustainable development in the research sector.
In the current study, we identified HH3 gene members in G. max. Gene structure, gene duplication via collinearity analysis, sequence logo analysis, chromosome duplication, and domain architecture were predicted by using different structural and functional approaches. Evolutionary analysis was also performed by constructing a phylogenetic tree. Tissue-specific expression analysis was also checked, and a heat map was constructed based on the fragments per kilobase of transcript per million mapped reads (FPKM) values. An SNP-based high-throughput KASP molecular marker for the candidate gene GmHH3-3 was also developed by exploring the pan-genome of soybean.
Materials and Methods
Sequence Identification
AtHH3 protein sequences were used as a query to retrieve the sequences of HH3 from G. max. HH3 protein sequences were also extracted from other species by using the respective databases for Gossypium raimondii (V-2.0), Solanum tuberosum (V-10), Theobroma cacao (V-10), Oryza sativa (V-10), Zea mays (V-10), Chlamydomonas reinhardtii (V-5.5), Selaginella moellendorffii (V-1.0), Ananas comosus (V-3.0) Vitis vinifera (V-10), Chlamydomonas reinhardtii (V-5.5), and Cicer arietinum (V-2.0). Local BLASTp search was performed to extract the desired sequences. Databases for all organisms were extracted from Phytozome v11 (https://phytozome.jgi. doe.gov/pz/portal.html). For further confirmation of the retrieved HH3 protein sequences, bioinformatics techniques including InterProScan 63.0 (Jones et al., 2014) (http://www.ebi.ac.uk/InterProScan/) and SMART (Letunic, Doerks, and Bork, 2015) (http://smart.embl-heidelberg.de/) were used. Biophysical properties such as isoelectric point, protein length, and molecular weight were computed by using the ExPASy ProtParam tool (https://web.expasy.org/protparam/). Sub-cellular localization was predicted by using Softberry (http://www.softberry.com/).
Conserved Sequence and Phylogenetic Analysis
In order to perform phylogenetic analyses, complete protein sequences of HH3 genes of the aforementioned species were extracted from the Phytozome (https://phytozome.jgi. doe. gov/pz/portal.html). For the construction of a phylogenetic tree, ClustalW program from MEGA-X (Kumar et al., 2018) was used to perform sequence alignment, and then the tree was generated using the maximum likelihood method. Amino acid sequences of A. thaliana, O. sativa, and G. max were aligned by multiple sequence alignment using Clustal X 2.0 (http://www.clustal.org/clustal2/) to create a sequence. Logos were generated by using the online tool WEBLOG (Crooks et al., 2004).
Domain Architecture, Gene Structure, and Cis-element Analysis
To perform domain architecture analyses, the full-length protein sequences of GmHH3 genes were subjected to MEME software (Crooks et al., 2004) (https://meme-suite.org/meme/tools/meme), as described in previous studies (Li et al., 2019). For gene structure analyses, genomic and conserved DNA sequences were downloaded from the Phytozome and Newick file obtained by aligning protein sequences in MEGA-X using the CLUSTAL-W approach. This Newick file genomic and CDS sequences were subjected to GSDS 2.0 (Hu et al., 2015). The PlantCARE database (Li et al., 2019) was used to analyze cis-elements up to the 2 kb promoter region, and anticipated cis-elements were categorized in accordance with their functional divergence, as stated previously (Pandey et al., 2016).
Chromosomal Localizations, Ka/Ks Ratio, and Collinearity Analysis
Chromosomal mapping of GmHH3 genes was identified first by the soybean genome annotation file (https://www.soybase.org/genomeannotation/), and then we extracted gff3-files. Paralogous gene pair data were obtained from collinearity analysis as described earlier (Yang et al., 2017), and then a figure was created by using CIRCOS (Krzywinski et al., 2009) to express the outcomes of synteny analysis. Duplicated gene pair sequences were aligned by using Clustal X 2.0, and synonymous and non-synonymous (Ks, Ka) and divergence level ratios were measured. Finally, Ka and Ks values were computed using the CODEML program by using the PAML package (Yang, 2007) and used to determine dispersed, segmental, and/or whole-genome duplication in soybean for GmHH3.
Tissue Specific Expression Pattern of GmHH3
To investigate the gene expression pattern of GmHH3 in different tissues at different growth stages, the FPKM values were extracted from the ePlant/soybase database (https://bar.utoronto.ca/eplant_soybean/). After taking log10 of each FPKM value, a heat map was constructed using TB-Tools (Chen et al., 2003) to express the transcript level of GmHH3 genes based on (FPKM) values.
Isolation of Candidate GmHH3 Genes From Soybean PAN-Genome
The PAN-genome was used to identify polymorphic sites in GmHH3s. For this, the whole-genome sequences (WGSs) of three cultivars of Glycine max (Willliams-82 (Wm82. a4), Lee (Lee.a1), and Zhonghuang-13 (ZH13. a1) were downloaded from SoyBase (https://soybase.org/). Local BLAST was used to identify GmHH3 sequences in the abovementioned three cultivars. The SeqMan program (Swindell, 1997) in the DNAstar Lasergene software package (Burland, 2000) was used for assembling of the genes to obtain the consensus sequence of every gene.
Phenotyping and Genotyping
A set of 46 G. max accessions was collected from the gene bank of the MNS University of Agriculture, Multan, (MNSUAM). These accessions were planted in two different environments, that is, under “well water” and “water limited” conditions following an augmented design (check = UAM-SB-200) at the research farm of MNSUAM, Spring 2021. The “well water” experimental units were irrigated after an interval of ∼15 days, whereas for “water limited” experimental units, the soybean accessions were subjected to drought stress conditions, especially at the flowering stage. Each accession was planted on two beds on both sides. The dimensions of each bed were length × width = 15 × 2.5 ft. Seeds were planted with plant-to-plant distance of 1 ft with two seeds at one place, thinning was practiced to eradicate the unhealthy one, and healthy plants were retained. Phenotypic data were collected from six plants of each soybean accession for plant height (inches), number of pods plant−1, pod length (cm), number of seeds pod−1, seed weight plant−1 (g), thousand seed weight (g), seed length (mm), seed width (mm), and seed thickness (mm) from both water regime conditions.
The genomic DNA of the studied soybean germplasm was extracted from young leaves (one leaf per soybean accession) following the CTAB method (Aboul-Maaty and Oraby, 2019). DNA quality was initially checked by using a NANO-Drop (K5800C Micro-Spectrophotometer) followed by running the extracted DNA on 1% agarose gel. Out of 17 GmHH3s, only one gene (GmHH3-3) showed polymorphic site. CDS sequences of GmHH3-3 along with SNP sites from three cultivars are given in (Supplementary Table 1). A typical KASP assay (http://www.lgcgenomics.com) was designed on the SNP present in the C-terminal region of the gene. From the PAN-genome, we came to know that Williams-82 possessed the GmHH3-3-T allele at 165 nt, while LEE and Zhonghuang-13 contained the GmHH3-3-C allele at 165 nt. Hence, a KASP assay on the SNP (at 165 nt C/T) was developed. Two allele-specific reverse primers and one common forward primer were designed to perform allele calling (Supplementary Table 1).
One reverse complement allele-specific primer was designed for “T” base (detected by FAM), and another reverse complement allele-specific primer was designed for “C” base (detected by HEX). DNA of some accessions (Williams-82 and Lee), in which the target gene had been sequenced, were initially selected to counter-check the reliability of molecular markers. The primer mixture contained 12 µl of each tailed primer (100 µM), 30 µl common primer (100 µM), and 46 µl double distilled water. A KASP assay was performed in 96-well PCR plates and set up ∼5 µl reaction mixture. The recipe of the mixture for 1X is given in (Supplementary Table 2). PCR conditions were as follows: hot start at 95°C for 15 minutes, followed by 10 touch-down cycles (95°C for 20 s; touch-down at 61°C initially and decreasing by 0.6°C cycle-1 for 25 s), followed by 32 more cycles of annealing (95°C for 15 s, 57°C for 1 min). Genotyping (PCR) was performed by using the CFX Connect Real-Time PCR detection system (Bio-Rad® laboratories Inc. United States). The PCR plate was also read by the QuantStudio 7 Flex Real-Time PCR system.
Association Analyses
Microsoft Excel 2019 was used to perform descriptive statistics and variance estimations. P 0.05 was used to determine whether a marker-trait correlation was statistically significant. The effects of each allele of GmHH3-3 at 165 nt from CDS were also analyzed by using Student’s t test at p < 0.05.
Results
Sequence Identification
A total of 139 HH3 proteins among 12 species were identified. Out of the studied 139 HH3 members, 14 are from Arabidopsis (6-H3.1, 7-H3.3, and 1-centromeric variant); 13 members from G. raimondii (8-H3.1 and 5-H3.3 variants); 17 G. max members; 13 O. sativa members; nine T. cacao members; 14 S. tuberosum members, 12 C. arietinum members, 16 Z. mays members; 10 A. comosus members, 11 C. reinhardtii members, six S. melanodorffii members, and four V. vinifera members. We found that almost all selected plants have a minimum of 4-HH3 genes, and from these G. max has the most 17) HH3 genes, while V. vinifera has only four, demonstrating that HH3 genes have undergone a bigger-scale expansion. (Supplementary Table 3). As our main focus was on G. max, so other biophysical properties were also determined including locus ID, coding sequence (CDS), gene length, molecular weight (MW), protein length, isoelectric point (pI), subcellular localization, and chromosome position (Supplementary Table 4). GmHH3-7 had the maximum length of coding region (798 bp) followed by GmHH3-15 which had 561 bp of coding sequence, while all other GmHH3 members had coding sequence lengths of 411bp. However, it was predicted that all the GmHH3 genes are localized in the nucleus.
Sequence Alignment and Phylogenetic Analysis
Phylostatum analysis was performed, and it showed that HH3 genes were present in primitive plant ancestry as these genes are present in C. reinhardti, an older plant; lineage. HH3 genes are located in monocots, dicots, lycophytes, chlorophytes, and angiosperms showing the large-scale expansion of HH3 genes across the plant kingdom (Figure 1A). An evolutionary tree was constructed to estimate the deeper relation of HH3 genes among the studied organisms including dicotyledons (A. thaliana, G. raimondii, G. max, S. tuberosum, V. vinifera T. cacao, and C. arietinum), monocotyledons (O. sativa and, Z. mays), C. reinhardtii (chlorophyte), S. moellendorffii (lycophyte), and A. comosus (angiosperm). The prefixes At, Gr, Gm, St, Tc, Vv, Ca, Zm, Cr, Sm, Os, and Ac were used in place of the names of HH3 genes from G. max, A. thaliana, G. raimondii, S. tuberosum, T, cacao, V. vinifera, C. arietinum, O. sativa, Z. mays, C. reinhardtii, S. melaonodorfii, and A. comosus, respectively.
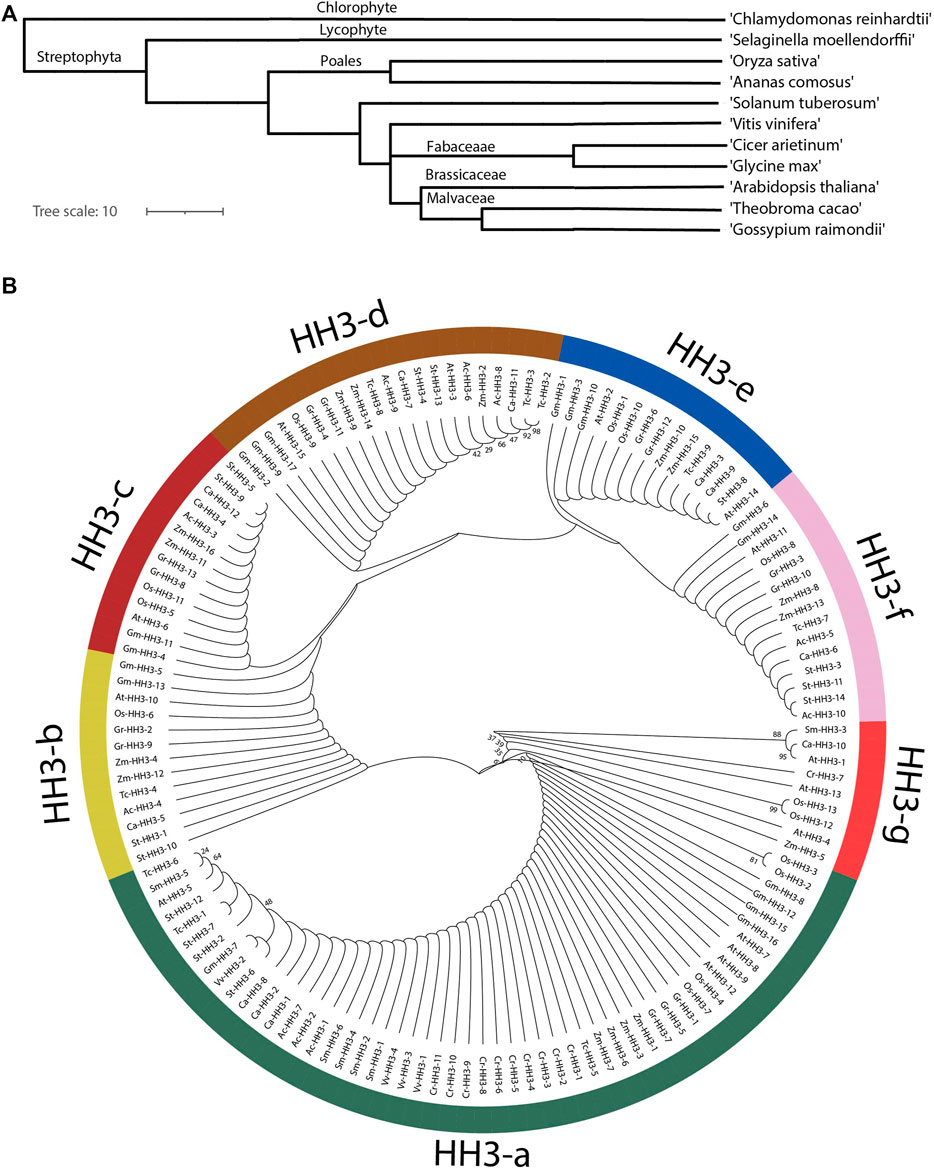
FIGURE 1. Phylogenetic analyses of the HH3 gene in different organisms. (A) Phylostratum analysis of HH3 genes. (B) Phylogenetic tree divided members of HH3 genes in seven clades; green color shows clade-a, yellow colors shows clade-b, maroon color shows clade-c, brown color shows clade-d, and blue color shows clade-e.
The evolutionary tree (Figure 1B) shows that all 139 genes from the studied organisms were naturally classified into seven Clades, that is, Clade a-g. Clade-a contains most of the HH3 genes (53 genes) followed by clade-d (21 genes), clade-e and clade-f (15 genes), clade-c (14 genes), clade-b (13 genes), and clade-g (9 genes). HH3 clade-a contains genes from all the studied species with maximum members showing that the HH3 gene family is highly conserved among all species. Clade-b, d, and f contain members from O. sativa, G. max, A. thaliana, G. raimondii, Z. mays, T. cacao, A. comosus, C, arietinum, and S. tuberosum. Clade-c contains fourteen members from eight species excluding members from T. cacao, C. reinhardtii, V. vinifera, and S. moellendorffii. Clade-e contains 15 members from S. tuberosum, G. raimondii, Z. mays, A. thaliana, T. cacao, O. sativa, and G. max; Clade-g contains nine members from A. thaliana, Z. mays, C. reinhardtii, S. moellendorffii, O. sativa, and C. arietinum. All members from clade-g have evolved separately. All clades from a–g contain members from both monocots and dicots showing that the HH3 gene family evolved before monocot and dicot separation. Phylogenetic analysis in this study showed gene enlargement in G. max. Moreover, orthologous gene pairs extracted from similar branch nodes were noticed in almost all studied species. During the evolutionary process, GmHH3 genes have undergone duplication events, which resulted in the paralogous gene pair’s formation, although this duplication was irregular in all clades and different studied organisms.
Conserved Amino Acid Residue Analysis
To explore the amino acid residues (AARs), conservation multiple sequence alignment was conducted to perceive the homologous domain sequence in GmHH3 genes. This alignment was conducted in model plants including A. thaliana, O. sativa, and in our studied crop G. max. Results showed high similarity ratio in logos of all three species. For example, few AARs including M [1], A [2], R [3], Q [4], A [6], R [7], P [8], P [10], P [13], G [14], T [15], V [16], A [17], L [18], R [19], I [21], R [22], K [23], Y [24], Q [25], K [26], T [28], R [29], K [30], L [31], P [32], Q [33], A [36], V [37], A [38], L [39], Q [40], A [41], E [42], F [44], E [45], D [46], T [47], L [48], C [49], A [50], H [51], A [52], K [53], 4 [54], T [56], I [57], M [58], P [59], K [60], Q [62], L [63], and A [64] were found to be highly conserved, showing that HH3 protein is having a highly conserved pattern of distribution without any discrimination of the N or C terminal (Figure 2).
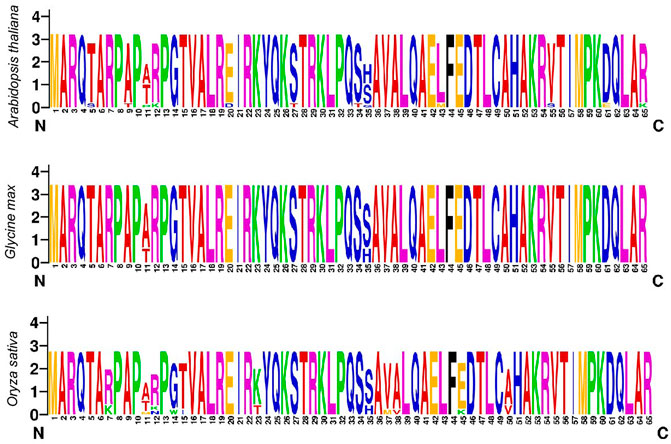
FIGURE 2. Sequence logos of conserved amino acid residues generated for three species.
Chromosomal Localizations, Ka/Ks Ratio, and Collinearity Analysis
The GFF3 files were utilized to map studied GmHH3 genes onto their corresponding chromosomes. Paralogous gene pairs were identified in G. max in order to inspect the locus relationships among GmHH3 genes, (Figure 3). The results of synteny analysis confirmed that most of the gene loci are significantly conserved. A total of 10 paralogous gene pairs were recognized, of which all studied GmHH3 genes except GmHH3-1, GmHH3-2, GmHH3-8, and GmHH3-16 had undergone whole-genome or segmental duplication (WGD). GmHH3-1 and GmHH3-2 showed dispersed duplication, while GmHH3-8 and GmHH3-16 showed tandem duplication (Supplementary Table 5). Non-functionalization, neo-functionalization, and sub-functionalization are the functional divergences in genes that can result during the process of evolution. The extent and nature of selection can be determined by calculating Ka/Ks values of these duplicated genes. In the case of neutral selection, the Ka/Ks value is always equal to 1; for positive selection, the Ka/Ks value is always greater than 1, while duplicated genes having Ka/Ks ratio less than 1 express the ability for purifying selection.
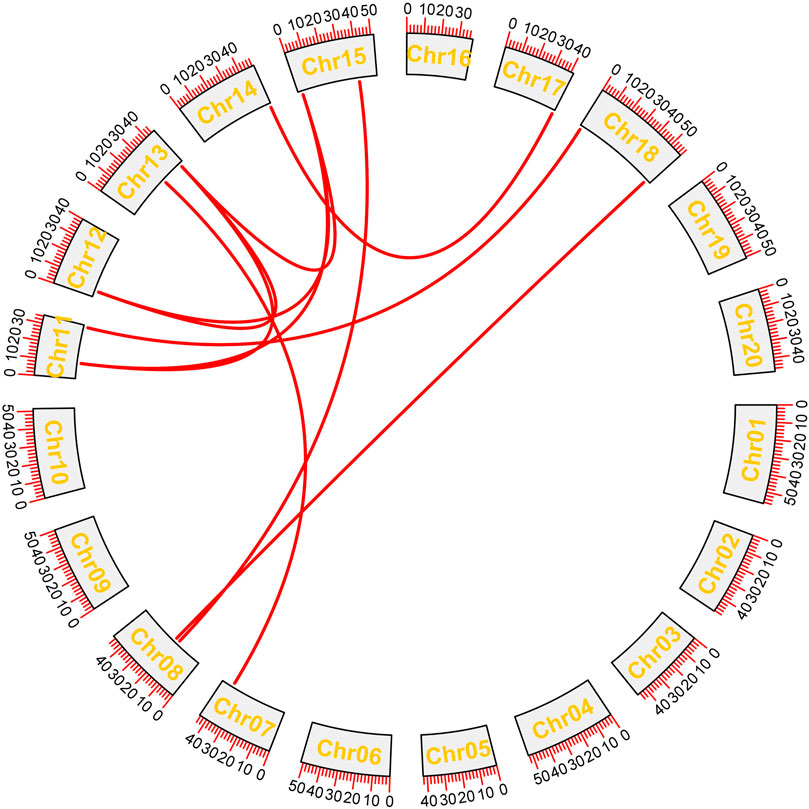
FIGURE 3. Gene duplication analyses of GmHH3. Red lines show the duplication of genes on different chromosomes.
The results of our study showed that all GmHH3 genes showed Ka/Ks values less than 1. We can conclude that GmHH3 genes have experienced strong purifying selection pressure with a little functional deviation because of segmental and whole-genome duplication.
Domain Architecture, Gene Structure, and Cis-element Analysis
The plantcare database was used to explore cis-elements present in 2 kb upstream of GmHH3 genes. Results showed that all GmHH3 genes carry various motifs for growth and development, light responses, and for several stress responses. For growth and development, important motifs are GCN-4 motif, TATA box, CAAT box, and circadian. GA-motif, GATA-motif, and Box-4 are for light responses. ABRE, AuxRR, MYB, and WUN–motif are for several stress responses. Various cis-elements performing their functions in different responses are given (Supplementary Table 6).
The evolution of a plant species is always associated with its gene structure. In order to explore the evolutionary relationship of all GmHH3, the gene structure along with its phylogenetic tree was constructed (Figure 4). Out of 17 GmHH3 members, 12 members have no introns and have only one exon. The remaining genes showed different exon/intron patterns (Figure 4). Moreover, all GmHH3 genes showed a significantly similar motif pattern as all the genes except GmHH3-15 and GmHH3-7 have the same motifs. Overall, all GmHH3 genes displayed a highly conserved pattern of motif distribution and gene structure (Figure 5).
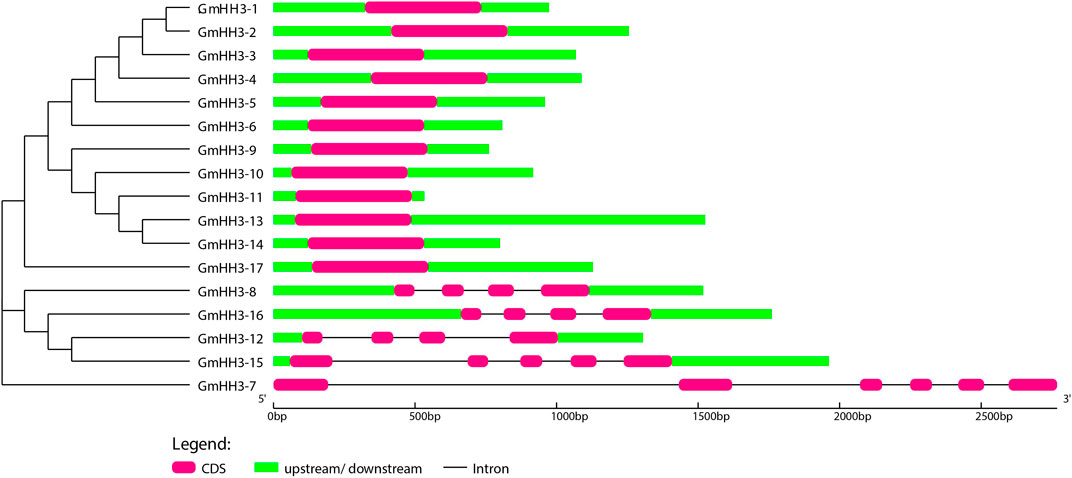
FIGURE 4. Exon/intron structure display of GmHH3. Pink box shows CDS regions, green box shows upstream/downstream regions, and black line shows introns.
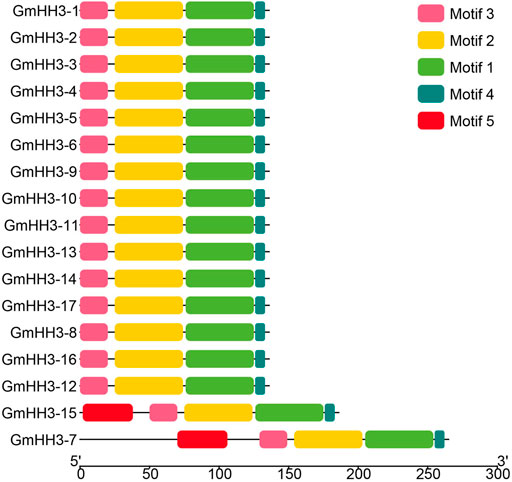
FIGURE 5. Conserved motifs in GmHH3.
Expression Profiling of GmHH3 Genes in Different Tissues
The biological function of a gene can be predicted by its expression. So, the expression of GmHH3 genes was inspected in different soybean tissues based on FPKM values. To examine the expression of GmHH3 genes in enormous plant tissues at different growth stages, the transcript level values were obtained from the ePlant/soybase database (https://bar.utoronto.ca/eplant_soybean/), and a heat map was created for different tissues in all 17 GmHH3 genes (Figure 6). We observed that all GmHH3 genes (except GmHH3-7, GmHH3-8, GmHH3-14, and GmHH3-15) were widely expressed in young leaves, and all genes except these four genes show their expression in all tissues. Data were recorded on the following parameters including young leaf, flower, pod (1 cm), pod shell 10 DAF (Days after flowering), nodule, root, pod shell (14 DAF), seed (10 DAF), and seed (25 DAF) explaining that GmHH3 genes are involved in enormous biological functions. From all GmHH3 genes, GmHH3-16 is showing higher expression than others. All of the genes with identical expression patterns were discovered to be clustered together.
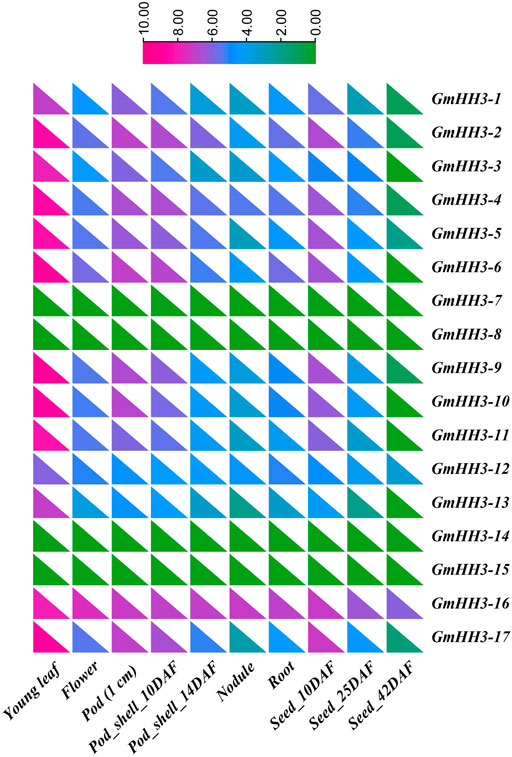
FIGURE 6. Tissue-specific expression profiling based on FPKM values. DAF, days after fertilization.
Sequence Polymorphism Assay and Development of the KASP Marker for GmHH3-3
The soybean PAN-genome was used to explore the polymorphic sites for all GmHH3 genes. Except for GmHH3-3, no gene showed sequence polymorphism and hence were excluded from further marker-trait association analyses. For GmHH3-3, the SNP at 165 nt (T/C) was identified in exon with no change in amino acid. The scatter plot for the developed KASP assay displays the clustering of soybean accessions on X-HEX and Y-FAM axes. Accessions colored blue contain the GmHH3-3-T allele, whereas accessions colored red have the GmHH3-3-C allele (Figure 7).
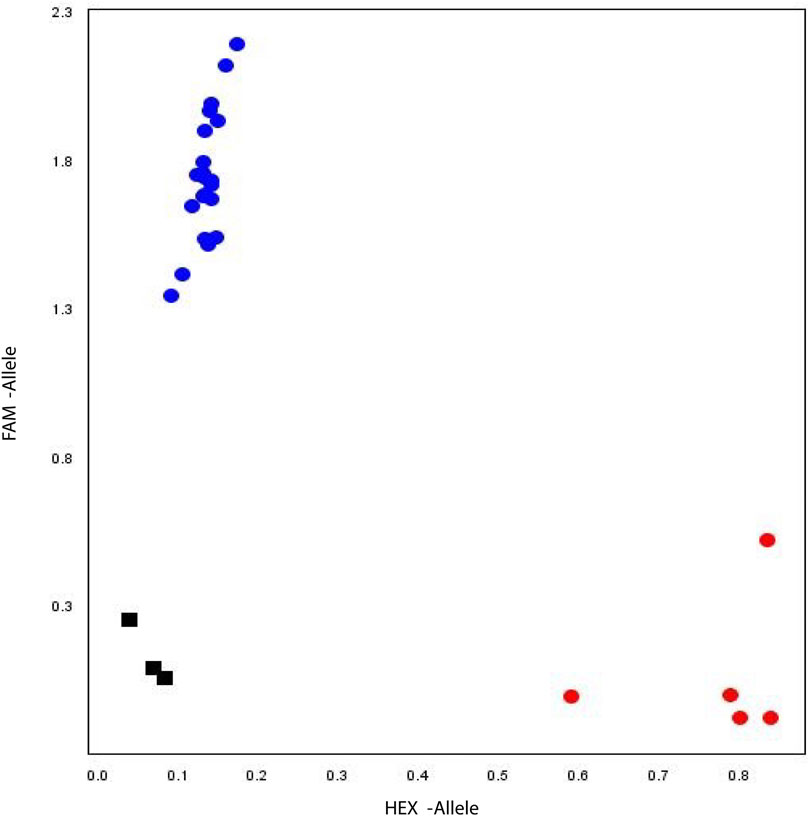
FIGURE 7. Allelic discrimination plot. KASP assay of GmHH3-3 along X- and Y-axes. Blue dots represent accessions carrying the FAM type allele, and red dots show accessions having the HEX-type allele. Black box shows the non-template control.
Association Analysis of GmHH3-3 Allelic Variations and Morphological Traits
For GmHH3-3, 41.3% of the studied germplasm possessed GmHH3-3-T, while 58.6% possessed GmHH3-3-C. Association analysis was performed on all the aforementioned traits in both growing conditions, and non-significant statistical differences were recorded in all studied traits except for thousand seed weight. Association analysis exhibited that at unique field sites, the allele T of GmHH3-3 was linked with higher thousand seed weight under both water regime conditions (Figure 8 A, B) indicating that the GmHH3-3-T allele has a superiority over GmHH3-3-C and hence can be used for future soybean breeding programs.
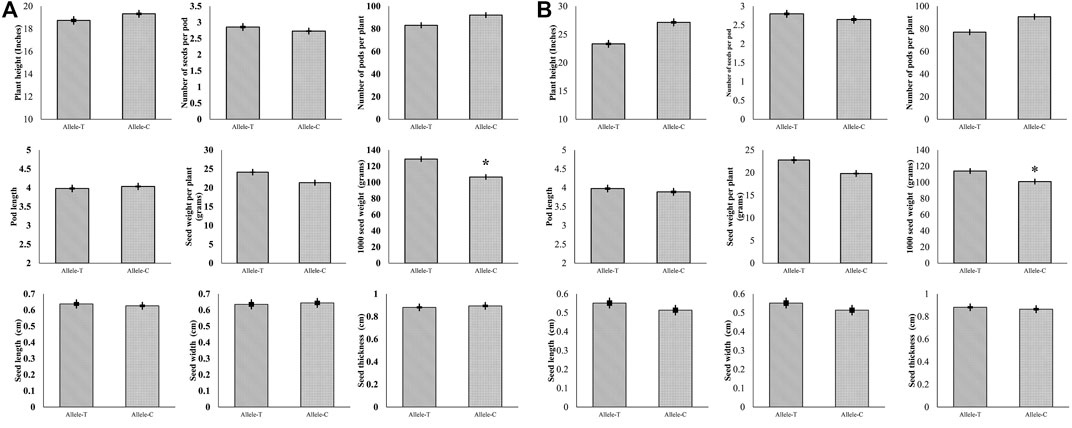
FIGURE 8. Phenotypic comparison of two GmHH3-3 allelic variations in two environments. (A) Phenotypic comparison under well-watered and (B) under water-limited conditions.
Discussion
The biological function of HH3 genes and histone modifications in various species has already been investigated in a number of publications. (Bhasin, Reinherz and Reche, 2006; Elsaesser, Goldberg and Allis, 2010; Wollmann et al., 2012; Hu and Lai, 2015). Till now, no comprehensive assessment of G. max HH3 genes has been carried out. We presented a detailed analysis of HH3 genes in G. max in order to investigate the role of the HH3 gene in G. max and establish a platform for future research.
In our study, we performed evolutionary analysis of 12 different organisms including monocotyledons dicotyledons, chlorophytes, lycophytes, and angiosperms. The HH3 gene family’s phylostratum analysis revealed the earliest plant lineage, with HH3 genes found in C. reinhardtii (chlorophyte), showing that HH3 genes came from the phylostratum of early land plants and that probable orthologous genes of HH3 are found across the plant kingdom. All HH3 genes can be categorized into seven primary clades, according to phylogenetic analysis. This analysis showed that all HH3 genes are highly conserved and have evolved before the differentiation of monocots and dicots. The existence of HH3 genes in each organism, with 17 HH3 genes in G. max and just four genes in V. vinifera, revealed that HH3 genes are evolutionarily conserved and have expanded widely in plants.
Multiple sequence alignment was utilized to construct sequence logos of conserved AARs for dicots (A. thaliana and G. max) and monocots (O. sativa). Furthermore, regardless of the N or C terminus, the sequence logos of all three identified species were largely conserved. Previous research has found that histone proteins are substantially conserved among studied plant species, despite the discovery of a number of variants depending on amino acid differences in their sequences. These variations could be as small as a few amino acids or as vast as a major percentage of a protein. The histone variation H3 has been linked to gene transcription in a favorable way. HH3 enrichment was previously identified toward promoters and transcription termination sites in a genome-wide investigation (Stroud et al., 2012; Wollmann et al., 2012; Shu et al., 2014). In sequence logo analysis, the AARs such as M, A, R, Q, R, P, P, G, T, V, A, L, R, I, R, K, Y, Q, K, T, R, K, L, P, Q, A, V, A, and others were highly conserved.
All the GmHH3 genes displayed a nearly identical pattern of cis-elements linked to soybean growth and development, as well as light and stress responses, in their promoter sequences. Several studies have shown that light has a significant impact on plant development. Cis-elements such as heat stress response elements (Díaz-Martín et al., 2005), abscisic acid (ABA) responsive elements (Narusaka et al., 2003), and dehydration-response elements (Song et al., 2005) have been identified in different organisms. More cis-elements such as ARE, CGTCA-motif, GARE-motif, and TGACG-motif were identified for different stress responses (Singh, Foley, and Oñate-Sánchez, 2002), Box 4, Box I, Box II, G-box, and GA-motif were identified for light responses. These elements are found in a number of GmHH3 genes, with typical traits confirming their predicted activities in growth, development, hormonal, and abiotic stresses.
Except for a few, all GmHH3 genes had very comparable gene structures and protein motif distributions, specifying that GmHH3 genes were evolutionarily conserved. Introns were said to have an integral part in the evolution of many plant species based on the gene structure (Roy and Gilbert, 2006). It is well-known that there were more introns during the early growth phase, which experienced decline over time (Roy and Penny, 2007). These research studies claim that more advanced species’ genomes have fewer introns (Qanmber et al., 2019b). The creation of novel functions is aided by the presence of more or larger introns. Tandem duplications result in a rise in introns, which leads to the emergence of additional genes. As two GmHH3 genes experience tandem duplication so that these genes have three or four introns. From 17 GmHH3 genes, 12 genes have no introns. These findings were in line with those of past studies. The GmHH3 gene family is relatively old, with introns lost over a period of time, showing the evolutionarily conserved activities of this gene family soybean growth and development, based on the lower number of introns.
Crop breeding merely on a morphological basis is comparatively ineffective (Ur Rehman et al., 2019), and effective selection using the SNP-based molecular markers will definitely put the breeding process on the fast-track (Rasheed et al., 2017). Genomic studies in soybean were dependent to some extent on comparative genomics approaches with other members of model organisms. At present, the release of soybean PAN-genome has revolutionized the approach and paved a smooth way for genomic studies in soybean. The absence of polymorphism in all the GmHH3 genes except GmHH3-3 is possibly due to allele fixation during evolution or domestication. The other probable reason might be the investigation of a smaller number of soybean accessions for the identification of polymorphic sites.
Since 1923, the soybean genetic gain is estimated to be ∼0.34 bu/ac (Rincker et al., 2014). This genetic gain has largely been achieved by breeding for grain yield. Advanced molecular breeding tools can certainly be helpful in the improvement of genetic gain. Fast forward genetic gain can be achieved by coupling the marker-assisted selection with a lower generation turnaround time period. In this study, GmHH3-3-T showed a significant association with thousand grain weight in both environments, suggesting that the use of this allele could be instrumental for the higher thousand grain weight selection. Gel-free KASP assays (high-throughput) can considerably fast-track soybean breeding programs. Application of the SNP-based functional markers will be more efficient for plant yield improvement and has been recommended by different researchers (Semagn et al., 2014; Rasheed et al., 2016). The gene identified here and the molecular marker developed here to identify the allelic variation might be helpful for marker-assisted breeding for higher thousand grain weight which can be utilized alone or in combination with the other reported functional markers.
Conclusion
We identified 139 HH3 genes in 12 different organisms. Phylogenetic analyses, gene structure, and motif analysis revealed the conserveness of HH3 genes across the species. Cis-element analysis predicted the role of HH3 genes in soybean growth and development and as well as in light response and various stress responses. Collinearity analysis indicated that the soybean HH3 gene family had undergone WGD, segmental, and tandem duplication. Marker trait association analysis confirmed that GmHH3-3-T had superiority over GmHH3-3-C regarding thousand grain weight.
Data Availability Statement
The original contributions presented in the study are included in the article/Supplementary Materials; further inquiries can be directed to the corresponding authors.
Author Contributions
CF performed the experiments and analyzed the data. MT, RI, MS, GQ, ZK, and SU guided and assisted in the execution of the laboratory and field experiments. ZG and GX assisted in developing the molecular marker. CF wrote the original draft of the manuscript. ZG, GX, MT, ZK, MS, GQ, and SU reviewed the manuscript. CF, MT, and SU conceived the idea.
Funding
This research was funded by the Special Project on Science and Technology Innovation and Achievement Transformation Pilot of Yunnan Academy of Agricultural Sciences in 2021 Project number: 202102AE090036-07 and Pakistan Agricultural Research Board, Project number PARB-830.
Conflict of Interest
The authors declare that the research was conducted in the absence of any commercial or financial relationships that could be construed as a potential conflict of interest.
Publisher’s Note
All claims expressed in this article are solely those of the authors and do not necessarily represent those of their affiliated organizations, or those of the publisher, the editors, and the reviewers. Any product that may be evaluated in this article, or claim that may be made by its manufacturer, is not guaranteed or endorsed by the publisher.
Acknowledgments
The authors are grateful to the Director of University Farms, Abdul Ghaffar and Deputy Director University Farms, Mahmood Alam Khan of MNSUAM for providing the facility to conduct the field research. The authors are also grateful to the Graduate Resource Center of MNSUAM for providing training on the construction of high-quality images for research publications.
Supplementary Material
The Supplementary Material for this article can be found online at: https://www.frontiersin.org/articles/10.3389/fgene.2022.949027/full#supplementary-material
Supplementary Table 1 | SNP information and KASP marker detail.
Supplementary Table 2 | Recipe of GmHH3-3 KASP assay for 1x sample.
Supplementary Table 3 | HH3 gene IDs of 12 species.
Supplementary Table 4 | Biophysical properties of GmHH3 genes.
Supplementary Table 5 | Collinearity/synteny and Ka/Ks values of GmHH3-3.
Supplementary Table 6 | cis-elements in GmHH3-3.
References
Aboul-Maaty, N. A.-F., and Oraby, H. A.-S. (2019). Extraction of High-Quality Genomic DNA from Different Plant Orders Applying a Modified CTAB-Based Method. Bull. Natl. Res. Cent. 43. doi:10.1186/s42269-019-0066-1
Bhasin, M., Reinherz, E. L., and Reche, P. A. (2006). Recognition and Classification of Histones Using Support Vector Machine. J. Comput. Biol. 13, 102–112. doi:10.1089/cmb.2006.13.102
Burland, T. G. (2000), DNASTAR's Lasergene Sequence Analysis Software. Sequence Analysis Using DNASTAR Lasergene Software Suite. New JerseyTotowa, NJ: Humana Press, 71–91. doi:10.1385/1-59259-192-2:71
Celeste, A., Difilippantonio, S., Difilippantonio, M. J., Fernandez-Capetillo, O., Pilch, D. R., Sedelnikova, O. A., et al. (2003). H2AX Haploinsufficiency Modifies Genomic Stability and Tumor Susceptibility. Cell 114, 371–383. doi:10.1016/S0092-8674(03)00567-1
Chen, C., Chen, H., Zhang, Y., Thomas, H. R., Frank, M. H., He, Y., et al. (2020). TBtools: An Integrative Toolkit Developed for Interactive Analyses of Big Biological Data. Mol. Plant 13, 1194–1202. doi:10.1016/j.molp.2020.06.009
Crooks, G. E., Hon, G., Chandonia, J.-M., and Brenner, S. E. (2004). WebLogo: A Sequence Logo Generator: Figure 1. Genome Res. 14, 1188–1190. doi:10.1101/gr.849004
Deal, R. B., Henikoff, J. G., and Henikoff, S. (2010). Genome-Wide Kinetics of Nucleosome Turnover Determined by Metabolic Labeling of Histones. Science 328, 1161–1164. doi:10.1126/science.1186777
Díaz-Martín, J., Almoguera, C., Prieto-Dapena, P., Espinosa, J. M., and Jordano, J. (2005). Functional Interaction between Two Transcription Factors Involved in the Developmental Regulation of a Small Heat Stress Protein Gene Promoter. Plant Physiol. 139, 1483–1494. doi:10.1104/pp.105.069963
Du, Z., Li, H., Wei, Q., Zhao, X., Wang, C., Zhu, Q., et al. (2013). Genome-Wide Analysis of Histone Modifications: H3K4me2, H3K4me3, H3K9ac, and H3K27ac in Oryza Sativa L. Japonica. Mol. Plant 6, 1463–1472. doi:10.1093/mp/sst018
Elsaesser, S. J., Goldberg, A. D., and Allis, C. D. (2010). New Functions for an Old Variant: No Substitute for Histone H3.3. Curr. Opin. Genet. Dev. 20, 110–117. doi:10.1016/j.gde.2010.01.003
Fernandez-Capetillo, O., Mahadevaiah, S. K., Celeste, A., Romanienko, P. J., Camerini-Otero, R. D., Bonner, W. M., et al. (2003). H2AX Is Required for Chromatin Remodeling and Inactivation of Sex Chromosomes in Male Mouse Meiosis. Dev. Cell 4, 497–508. doi:10.1016/S1534-5807(03)00093-5
Filipescu, D., Müller, S., and Almouzni, G. (2014). Histone H3 Variants and Their Chaperones during Development and Disease: Contributing to Epigenetic Control. Annu. Rev. Cell Dev. Biol. 30, 615–646. doi:10.1146/annurev-cellbio-100913-013311
Goldberg, A. D., Banaszynski, L. A., Noh, K.-M., Lewis, P. W., Elsaesser, S. J., Stadler, S., et al. (2010). Distinct Factors Control Histone Variant H3.3 Localization at Specific Genomic Regions. Cell 140, 678–691. doi:10.1016/j.cell.2010.01.003
Hu, B., Jin, J., Guo, A.-Y., Zhang, H., Luo, J., and Gao, G. (2015). GSDS 2.0: an Upgraded Gene Feature Visualization serverAn Upgraded Gene Feature Visualization Server. Bioinformatics 31, 1296–1297. doi:10.1093/bioinformatics/btu817
Hu, Y., and Lai, Y. (2015). Identification and Expression Analysis of Rice Histone Genes. Plant Physiology Biochem. 86, 55–65. doi:10.1016/j.plaphy.2014.11.012
Jones, P., Binns, D., Chang, H.-Y., Fraser, M., Li, W., McAnulla, C., et al. (2014). InterProScan 5: Genome-Scale Protein Function Classification. Bioinformatics 30, 1236–1240. doi:10.1093/bioinformatics/btu031
Krzywinski, M., Schein, J., Birol, İ., Connors, J., Gascoyne, R., Horsman, D., et al. (2009). Circos: An Information Aesthetic for Comparative Genomics. Genome Res. 19, 1639–1645. doi:10.1101/gr.092759.109
Kumar, S., Stecher, G., Li, M., Knyaz, C., and Tamura, K. (2018). MEGA X: Molecular Evolutionary Genetics Analysis across Computing Platforms. Mol. Biol. Evol. 35, 1547–1549. doi:10.1093/molbev/msy096
Letunic, I., Doerks, T., and Bork, P. (2015). SMART: Recent Updates, New Developments and Status in 2015. Nucleic Acids Res. 43, D257–D260. doi:10.1093/nar/gku949
Li, J., Yu, D., Qanmber, G., Lu, L., Wang, L., Zheng, L., et al. (2019). GhKLCR1, a Kinesin Light Chain-Related Gene, Induces Drought-Stress Sensitivity in Arabidopsis. Sci. China Life Sci. 62, 63–75. doi:10.1007/s11427-018-9307-y
Malik, H. S., and Henikoff, S. (2003). Phylogenomics of the Nucleosome. Nat. Struct. Mol. Biol. 10, 882–891. doi:10.1038/nsb996
Narusaka, Y., Nakashima, K., Shinwari, Z. K., Sakuma, Y., Furihata, T., Abe, H., et al. (2003). Interaction between Two Cis-Acting Elements, ABRE and DRE, in ABA-dependent Expression of Arabidopsis rd29A Gene in Response to Dehydration and High-Salinity Stresses. Plant J. 34, 137–148. doi:10.1046/j.1365-313X.2003.01708.x
Okada, T., Endo, M., Singh, M. B., and Bhalla, P. L. (2005). Analysis of the Histone H3 Gene Family in Arabidopsis and Identification of the Male-gamete-specific Variant AtMGH3. Plant J. 44, 557–568. doi:10.1111/j.1365-313X.2005.02554.x
Pandey, A., Misra, P., Alok, A., Kaur, N., Sharma, S., Lakhwani, D., et al. (2016). Genome-wide Identification and Expression Analysis of Homeodomain Leucine Zipper Subfamily IV (HDZ IV) Gene Family from Musa Accuminata. Front. Plant Sci. 7, 1–14. doi:10.3389/fpls.2016.00020
Qanmber, G., Ali, F., Lu, L., Mo, H., Ma, S., Wang, Z., et al. (2019a). Identification of Histone H3 (HH3) Genes in Gossypium Hirsutum Revealed Diverse Expression during Ovule Development and Stress Responses. Genes 10, 355. doi:10.3390/genes10050355
Qanmber, G., Liu, J., Yu, D., Liu, Z., Lu, L., Mo, H., et al. (2019b). Genome-wide Identification and Characterization of the PERK Gene Family in Gossypium Hirsutum Reveals Gene Duplication and Functional Divergence. Ijms 20, 1750. doi:10.3390/ijms20071750
Qi, X., Li, M.-W., Xie, M., Liu, X., Ni, M., Shao, G., et al. (2014). Identification of a Novel Salt Tolerance Gene in Wild Soybean by Whole-Genome Sequencing. Nat. Commun. 5, 1–11. doi:10.1038/ncomms5340
Rasheed, A., Hao, Y., Xia, X., Khan, A., Xu, Y., Varshney, R. K., et al. (2017). Crop Breeding Chips and Genotyping Platforms: Progress, Challenges, and Perspectives. Mol. Plant 10, 1047–1064. doi:10.1016/j.molp.2017.06.008
Rasheed, A., Wen, W., Gao, F., Zhai, S., Jin, H., Liu, J., et al. (2016). Development and Validation of KASP Assays for Genes Underpinning Key Economic Traits in Bread Wheat. Theor. Appl. Genet. 129, 1843–1860. doi:10.1007/s00122-016-2743-x
Rincker, K., Nelson, R., Specht, J., Sleper, D., Cary, T., Cianzio, S. R., et al. (2014). Genetic Improvement of U.S. Soybean in Maturity Groups II, III, and IV. Crop Sci. 54, 1419–1432. doi:10.2135/cropsci2013.10.0665
Roy, S. W., and Penny, D. (2007). A Very High Fraction of Unique Intron Positions in the Intron-Rich Diatom Thalassiosira Pseudonana Indicates Widespread Intron Gain. Mol. Biol. Evol. 24, 1447–1457. doi:10.1093/molbev/msm048
Semagn, K., Babu, R., Hearne, S., and Olsen, M. (2014). Single Nucleotide Polymorphism Genotyping Using Kompetitive Allele Specific PCR (KASP): Overview of the Technology and its Application in Crop Improvement. Mol. Breed. 33, 1–14. doi:10.1007/s11032-013-9917-x
Seo, J.-H., Dhungana, S. K., Kang, B.-K., Baek, I.-Y., Sung, J.-S., Ko, J.-Y., et al. (2022). Development and Validation of SNP and InDel Markers for Pod-Shattering Tolerance in Soybean. Ijms 23 (4), 2382. doi:10.3390/ijms23042382
Shu, H., Nakamura, M., Siretskiy, A., Borghi, L., Moraes, I., Wildhaber, T., et al. (2014). Arabidopsis Replacement Histone Variant H3.3 Occupies Promoters of Regulated Genes. Genome Biol. 15, R62–R14. doi:10.1186/gb-2014-15-4-r62
Singh, K., Foley, R. C., and Oñate-Sánchez, L. (2002). Transcription Factors in Plant Defense and Stress Responses. Curr. Opin. Plant Biol. 5, 430–436. doi:10.1016/S1369-5266(02)00289-3
Song, C.-P., Agarwal, M., Ohta, M., Guo, Y., Halfter, U., Wang, P., et al. (2005). Role of an Arabidopsis AP2/EREBP-type Transcriptional Repressor in Abscisic Acid and Drought Stress Responses. Plant Cell 17, 2384–2396. doi:10.1105/tpc.105.033043
Stroud, H., Otero, S., Desvoyes, B., Ramírez-Parra, E., Jacobsen, S. E., and Gutierrez, C. (2012). Genome-wide Analysis of Histone H3.1 and H3.3 Variants in Arabidopsis thaliana. Proc. Natl. Acad. Sci. U.S.A. 109, 5370–5375. doi:10.1073/pnas.1203145109
Swindell, S. R. (1997). Sequencing Data Analysis Guidebook. Totowa, New Jersey: Humana Press. TNC. doi:10.1385/0896033589
Ur Rehman, S., Wang, J., Chang, X., Zhang, X., Mao, X., and Jing, R. (2019). A Wheat Protein Kinase Gene TaSnRK2.9-5A Associated with Yield Contributing Traits. Theor. Appl. Genet. 132, 907–919. doi:10.1007/s00122-018-3247-7
William Roy, S., and Gilbert, W. (2006). The Evolution of Spliceosomal Introns: Patterns, Puzzles and Progress. Nat. Rev. Genet. 7, 211–221. doi:10.1038/nrg1807
Wollmann, H., Holec, S., Alden, K., Clarke, N. D., Jacques, P.-É., and Berger, F. (2012). Dynamic Deposition of Histone Variant H3.3 Accompanies Developmental Remodeling of the Arabidopsis Transcriptome. PLoS Genet. 8, e1002658–31. doi:10.1371/journal.pgen.1002658
Wong, L. H., McGhie, J. D., Sim, M., Anderson, M. A., Ahn, S., Hannan, R. D., et al. (2010). ATRX Interacts with H3.3 in Maintaining Telomere Structural Integrity in Pluripotent Embryonic Stem Cells. Genome Res. 20, 351–360. doi:10.1101/gr.101477.109
Yang, Z., Gong, Q., Qin, W., Yang, Z., Cheng, Y., Lu, L., et al. (2017). Genome-wide Analysis of WOX Genes in Upland Cotton and Their Expression Pattern under Different Stresses. BMC Plant Biol. 17. doi:10.1186/s12870-017-1065-8
Keywords: histone H3, marker-assisted breeding, KASP, drought, Glycine max
Citation: Fatima C, Tahir MHN, Ikram RM, Khan Z, Sajjad M, Qanmber G, Darwish E, Geng Z, Xiangkuo G and Ur Rehman S (2022) Characterization of Histone H3 Gene Family Reveals That GmHH3-3 is Associated With Higher Seed Weight in Glycine max. Front. Genet. 13:949027. doi: 10.3389/fgene.2022.949027
Received: 20 May 2022; Accepted: 15 June 2022;
Published: 22 July 2022.
Edited by:
Ali Raza, Fujian Agriculture and Forestry University, ChinaReviewed by:
Sajid Shokat, Nuclear Institute for Agriculture and Biology (NIAB), PakistanAndrea Dama, Modibbo Adama University of Technology, Nigeria
Aamir Raina, Aligarh Muslim University, India
Copyright © 2022 Fatima, Tahir, Ikram, Khan, Sajjad, Qanmber, Darwish, Geng, Xiangkuo and Ur Rehman. This is an open-access article distributed under the terms of the Creative Commons Attribution License (CC BY). The use, distribution or reproduction in other forums is permitted, provided the original author(s) and the copyright owner(s) are credited and that the original publication in this journal is cited, in accordance with accepted academic practice. No use, distribution or reproduction is permitted which does not comply with these terms.
*Correspondence: Gao Xiangkuo, ODM4MzkwNzE4QHFxLmNvbQ==; Shoaib Ur Rehman, c2hvYWliLnJlaG1hbkBtbnN1YW0uZWR1LnBr