 Amanda W. S. Martins1
 Eduardo N. Dellagostin1
 Eduardo B. Blödorn1
 Tony Leandro R. Silveira2
 Luis A. Sampaio3
 Eliza R. Komninou1Antonio S. Varela Junior4
 Carine D. Corcini5
 Leandro S. Nunes1
 Mariana H. Remião1
 Gilberto L. Collares6
 William B. Domingues1
 Vinicius F. Campos1*
- 1Laboratório de Genômica Estrutural, Programa de Pós-Graduação em Biotecnologia, Centro de Desenvolvimento Tecnológico, Universidade Federal de Pelotas, Pelotas, RS, Brazil
- 2Instituto de Ciências Biológicas, Universidade Federal do Rio Grande, Rio Grande, RS, Brazil
- 3Laboratório de Piscicultura Estuarina e Marinha, Programa de Pós-graduação em Aquicultura, Instituto de Oceanografia, Universidade Federal do Rio Grande, Rio Grande, RS, Brazil
- 4Laboratório de Reprodução Animal, Programa de Pós-Graduação em Biologia de Ambientes Aquáticos Continentais, Instituto de Ciências Biológicas, Universidade Federal do Rio Grande, Rio Grande, RS, Brazil
- 5ReproPel, Programa de Pós-Graduação em Veterinária, Faculdade de Veterinária, Universidade Federal de Pelotas, Pelotas, RS, Brazil
- 6Agência de Desenvolvimento da Bacia da Lagoa Mirim, Universidade Federal de Pelotas, Pelotas, RS, Brazil
Variations in water salinity and other extrinsic factors have been shown to induce changes in feeding rhythms and growth in fish. However, it is unknown whether appetite-related hormones mediate these changes in Nile tilapia (Oreochromis niloticus), an important species for aquaculture in several countries. This study aimed to evaluate the expression of genes responsible for appetite regulation and genes related to metabolic and physiological changes in tilapia exposed to different salinities. Moreover, the study proposed to sequence and to characterize the cart, cck, and pyy genes, and to quantify their expression in the brain and intestine of the fish by quantitative polymerase chain reaction (qPCR). The animals were exposed to three salinities: 0, 6, and 12 parts per thousand (ppt) of salt for 21 days. Furthermore, lipid peroxidation, reactive oxygen species, DNA damage, and membrane fluidity in blood cells were quantified by flow cytometry. The results indicated an increased expression of cart, pyy, and cck and a decreased expression of npy in the brain, and the same with cck and npy in the intestine of fish treated with 12 ppt. This modulation and other adaptive responses may have contributed to the decrease in weight gain, specific growth rate, and final weight. In addition, we showed oxidative damage in blood cells resulting from increasing salinity. These results provide essential data on O. niloticus when exposed to high salinities that have never been described before and generate knowledge necessary for developing biotechnologies that may help improve the production of economically important farmed fish.
1 Introduction
Nile tilapia (Oreochromis niloticus) is a fish species native to African freshwater lakes and rivers. It is currently one of the most widely farmed freshwater fish around the world due to its favorable production characteristics and high economic value and has been used as a biological model in several studies (Beardmore et al., 2001; He et al., 2011; FAO, 2020; Mohamed et al., 2021). Considering the scarcity of fresh water in many countries, studies are being carried out to develop the production of this species in brackish and seawater (El-Sayed et al., 2005; Mohamed et al., 2021).
Changes in water salinity modify the homeostasis of the organisms and biological processes and may even lead to death (Rahmah et al., 2020). Exposure of different tilapia species to increasing salinity is known to affect growth performance (Ninh et al., 2014; Gan et al., 2016), digestive capacity (Tran-Ngoc et al., 2017), blood parameters (Verdegem et al., 1997), reproductive capacity (Cruz Vieira et al., 2019), histopathology and behavior (Hassan et al., 2013), antioxidant status (Gan et al., 2016), and metabolic rate (Iwama et al., 1997).
The homeostatic regulation of food intake depends on a complex network involving signals which promote the release of a wide range of hormones produced by the brain and peripheral organs that can stimulate (orexigenic) or inhibit (anorexigenic) appetite (Conde-Sieira et al., 2018). Among the main hormones involved in appetite regulation, the most important ones are the neuropeptide Y (Npy), cocaine and amphetamine-regulated transcription factor (Cart), cholecystokinin (Cck), and peptide YY (Pyy) (Rønnestad et al., 2017).
Plasma glucose level is one of the most common stress indicators. Furthermore, circulating glucose levels are believed to activate neurocircuitry in regulating food intake (Pankhurst, 2011; Soengas, 2014). In addition, blood oxidative parameters are often used to assess fish health (Bojarski and Witeska, 2020). Thus, evaluating whether salinities caused any damage to tilapia blood cells or whether they modulated plasma glucose levels is extremely interesting.
Living in a marine or freshwater environment, with direct contact with water for gas exchange and secretion of metabolic waste, teleost fish face constant osmotic stress that requires physiological compensation (Mohamed et al., 2021). Under stress conditions, the mechanisms that control food intake in fish are dysregulated. Therefore, understanding the factors underlying the responses to environmental stress observed among species is of great interest, having implications for aquaculture output. Currently, little is known about the influence of salinity on genetic variations related to endocrine factors that regulate appetite in fish, specifically in O. niloticus. Therefore, this study aimed to evaluate if exposure to different salinities causes modulation of the expression of genes related to appetite regulation and affects growth rates and the systematic physiology of tilapia.
2 Materials and methods
2.1 Animals and conditions
The fish used in this study were obtained from the Laboratory of Pisciculture of the Barragem do Chasqueiro Fish Farming (Arroio Grande, Brazil-32°14′15 ″S/53°05′13″ W). The specimens, with initial mean weight and length of 200 ± 8.3 g and 18.5 ± 5.3 cm respectively, were fed twice a day with a commercial diet (Supra, 38% crude protein) until apparent satiety. The fish were kept in plastic tanks with a nominal capacity of 1,000 L filled with 650 L water. The tanks used were opaque to reduce visual stress. Approximately 2/3 of the water in each tank was renewed once a week. The water quality parameters during the acclimation period were as follows: temperature of 24.0 ± 0.34°C; dissolved oxygen level of 9.85 ± 0.1 mg O2. L−1; salinity of 0 ± 0.21 ppt; pH of 7.04 ± 0.19; and total ammonia level lower than 0.3 mg NH3 L−1.
2.2 Experimental design and sample collection
After 4 weeks of acclimation, fish were randomly distributed into three salinity groups: two experimental groups exposed to 6 and 12 ppt of salt (NaCl) and a control group with fresh water (0 ppt). The salinity levels were obtained by increasing salinity per day until they reached 6 and 12 ppt. The salinity levels mentioned above were maintained throughout the experimental period by regular salt applications, followed by its measurement through a salinometer (Kasvi, Brazil) to ensure the required salinity level daily. The chosen concentrations are within the minimum mortality range (El-Leithy et al., 2019). The experimental groups were exposed for 21 days, and the exposition of all the groups was performed in plastic tanks in triplicate (totaling 9 tanks) with ten animals per tank (n = 90 animals) maintained under the same conditions. The water quality parameters were measured daily during the experimental period and were held as follows: Temperature of 24.5 ± 0.40°C; dissolved oxygen level of 11 ± 0.1 mg O2. L−1; pH of 7.27 ± 0.26; and total ammonia level lower than 0.3 mg NH3 L−1. At the end of the experiment, all fish were anesthetized in a benzocaine bath (50 mg·L−1) and euthanized by cranial spinal section. Their brain and posterior intestine were collected and were used for sequencing, molecular characterization, and gene expression analysis of target genes. The tissues were preserved in liquid nitrogen until their use for molecular biology processing and analyses. Blood samples were collected from the branchial branch artery using 26 G needles attached to heparinized syringes and centrifuged at 2,000×g for 10 min to separate plasma and blood cells (ambient temperature). The plasma osmolality was measured using an automated osmometer (Vapro® Vapor Pressure Osmometer, United States). For flow-cytometry analysis, 20 μl of the blood sample was added to 1 ml of fetal bovine serum (FBS) and stored at 4°C in the dark until use, and the glucose measurement was performed with the Accu-Chek Active Kit (Roche, CH), using 5 μl of blood. The Ethics and Animal Experimentation Committee of Universidade Federal de Pelotas approved the use of animals and all these handling practices (process no 23110.014105/2020-56).
2.3 Performance
Fish were individually weighed at the beginning and end of the experimental period. The weight was used to calculate the survival, weight gain, and specific growth rate (Kang’ombe et al., 2008).
Survival (%) = (final number of fish—initial number of fish)/initial number of fish x 100
Weight gain (g) (WG) = FW- IW
Specific growth rate (%/day) (SGR) = 100 (ln FW—ln IW)/Δt.
FW is the final weight, IW is the initial weight, and Δt is the number of days between samplings.
2.4 RNA extraction and cDNA synthesis
Total RNA from tissue samples was extracted using TRI Reagent (Sigma, United States), following the manufacturer’s instructions with few modifications. RNA concentration and purity were measured by UV-light spectrophotometry using the NanoVue™ equipment (GE Healthcare Life Sciences, United States), and the samples were then standardized by concentration. Only the samples presenting high purity (OD260/280 ≥ 2.0 nm) were used in the following procedures. According to the manufacturer’s recommendation, RNA samples were treated with DNase using DNA-free™ Kit (Invitrogen™, United States). First-strand cDNA synthesis was performed with 2 µg of total RNA using the High-Capacity cDNA Reverse Transcription Kit (Applied Biosystems, United States) according to the manufacturer’s protocol. The cDNA samples were stored at −20°C until further use.
2.5 Target genes in appetite regulation and osmoregulation process
The target genes related to the main hormones that play a critical role in appetite regulation were as follows: Neuropeptide Y (npy); Peptide YY (pyy); Cocaine and Amphetamine Regulated Transcript (cart); Cholecystokinin (cck). Genes related to osmotic stress were also analyzed: Sodium-Potassium ATPase (nka) and Co-transporter Na+/ K+/2Cl– (nkcc). Their functions are listed in Table 1.
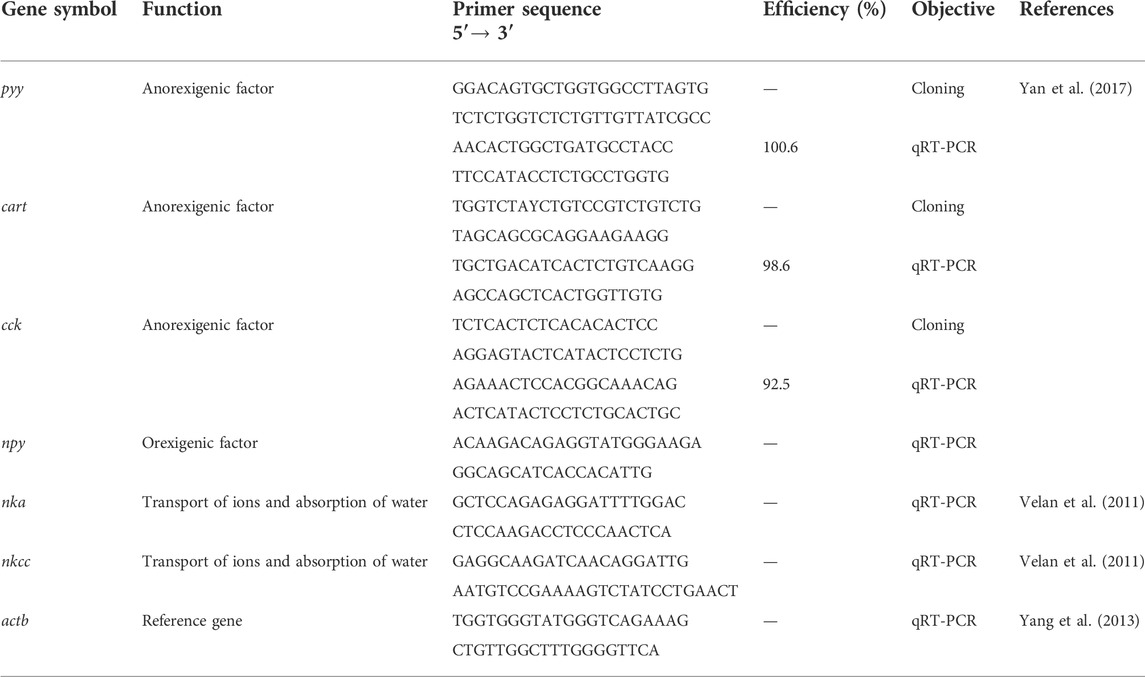
TABLE 1. Target genes in appetite regulation, osmoregulation process, and primer sequences used in this study.
2.6 Sequencing and molecular characterization of target genes
The gene fragments were amplified by polymerase chain reaction (PCR) using primers designed by the PriFi online tool (https://services.birc.au.dk/prifi/) after the alignment of known sequences deposited for each gene in GenBank. The PCR parameters were as follows: an initial denaturation step for 1 min at 94°C, followed by 35 cycles at 94°C for 30 s, 55.2–65.5°C (depending on the primer sequence) for 30 s, and 72°C for 1 min, with a final extension of 5 min at 72°C. The fragments were sequenced using the Applied Biosystems 3500 Genetic Analyzer® automatic sequencer (Life Technologies, United States).
2.7 Sequence analysis
The partial sequences of the cart, cck, and pyy genes identified in this study were deposited in GenBank. The translation of sequenced nucleotides to amino acid sequences and the open reading frame (ORF) identification were performed using the ExPASy bioinformatics resource portal (https://www.expasy.org/). The conserved domains and sites were mapped using the UniProt database (https://www.uniprot.org/).
2.8 Gene expression analysis
Gene expression was analyzed by quantitative polymerase chain reaction (qPCR), and the primers used in this study (Table 1) were designed using the Primer3 online tool (https://primer3.ut.ee/http://bioinfo.ut.ee/primer3–0.4.0/) and the sequences of the identified fragments. The qPCR assay was performed using CFX96 Touch™ Real-Time PCR Detection System (Bio-Rad, United States) and GoTaq® RT-qPCR Master Mix (Promega, United States). The amplification conditions were 95°C for 10 min, 40 cycles at 95°C for 15 s, and 60°C for 60 s, followed by the requirements needed to calculate the melting curve. The 2–ΔΔCT method was used to normalize the fold change in gene expression using actb as a reference gene for normalization (Yang et al., 2013).
2.9 Flow cytometry analysis
Flow cytometry analyses were performed using Attune® (Acoustic Focusing Flow Cytometer, Applied Biosystems, United States) with violet laser (UV 405 nm-450/40, VL-1). To evaluate the effect of different salinities exposure on the systemic physiology of O. niloticus, erythrocytes were washed with 500 µl of FBS, stained with Hoechst 33,342 (16.2 mM), and assayed for reactive oxygen species (ROS), lipid peroxidation (LPO), membrane fluidity, and DNA fragmentation index (DFI) (Martinez-Alborcia et al., 2012). Cell debris were discarded by scatter plots of forward scatter × side scatter and negative fluorescence of Hoechst 33,342. To read all parameters, the fluorophore-stained cells were added into calcium- and magnesium-free phosphate-buffered saline (80 g·L−1 of NaCl, 11.5 g·L−1 of KCl, 24 g·L−1 of Na2HPO4, 2 g·L−1 of KH2PO4 dissolved in deionized water). A total of 20,000 cells were measured during each analysis.
2.9.1 ROS evaluation
For the evaluation of ROS produced by the blood cells, 10 µl of previously collected and stored blood sample was added to 20 µl of saline solution containing 2 µM 2′,7′-dichlorofluorescein diacetate, and 5 µM propidium iodide (PI) fluorescent probes (Sigma-Aldrich Co., United States). The samples were analyzed after incubation for 60 min at 22°C in the dark. Only live cells (PI negative) were selected and measured for ROS production by the median intensity of the emitted green fluorescence.
2.9.2 LPO evaluation
The LPO was quantified using 1 µM of the lipid peroxidation sensor 4,4-difluoro-5-(4-phenyl-1,3-butadienyl)-4-bora-3a,4a-diaza-s-indacene-3-undecanoic acid (C11-BODIPY) in 100 µl of the sample. It was incubated for 2 h at room temperature (20°C). The rate of lipoperoxidation was calculated by the median intensity of green fluorescence (peroxidized lipid)/median green fluorescence intensity + median red fluorescence (non-peroxidized lipid) × 100.
2.9.3 Membrane fluidity evaluation
Erythrocyte membrane fluidity was analyzed by hydrophobic merocyanine 540 dye (M540) at a final concentration of 2.7 M (Sigma-Aldrich, United States) and YO-PRO, which fluoresces green, at a final concentration of 0.1 M (Invitrogen, United States). Only live cells (YO- PRO negative) were selected and classified into high fluidity cells (high M540 concentration) and low fluidity cells (low M540 concentration).
2.9.4 DNA damage evaluation
To evaluate DNA damage in erythrocytes, 10 µl of blood sample was added to 5 µl of 0.01 M Tris-HCl, 0.15 M NaCl, and 0.001 M EDTA (pH 7.2) and to 10 µl of Triton 1X (Triton X-100, 1%, v/v) 30 s later. Then, 50 µl of acridine orange dye (2 mg·ml−1, #A6014, Sigma-Aldrich, United States) was added to the sample, followed by incubation from 30 s up to 2 min before each reading. The DNA of erythrocytes was classified as undamaged (green fluorescence emission) or damaged (orange/red fluorescence emission). The DNA fragmentation index (DFI) percentage was obtained by the median of red fluorescence intensity/(median of the red + green fluorescence intensities) × 100.
2.10 Statistical analysis
The evaluated parameters, which presented normal distribution and homogeneous variance with or without transformations, were analyzed by one-way analysis of variance (ANOVA), followed by Tukey’s post-test with a significance level of 5%. The results from gene expression, ROS, LPO, membrane fluidity, and DFI were expressed as mean ± standard error of the mean (SEM).
3 Results
3.1 Effects of 21 days of different salinity exposure on nile tilapia growth performance
The final weight, weight gain, and specific growth rate were lower (p < 0.05) in the groups exposed to 6 and 12 ppt compared to the control group, as shown in Table 2. Furthermore, the plasma osmolality and the blood glucose showed an increase (p < 0.05) in the fish exposed to 12 ppt compared to fish from the control and 6 ppt groups. The survival was significantly lower in the group exposed to 12 ppt compared to the other groups.
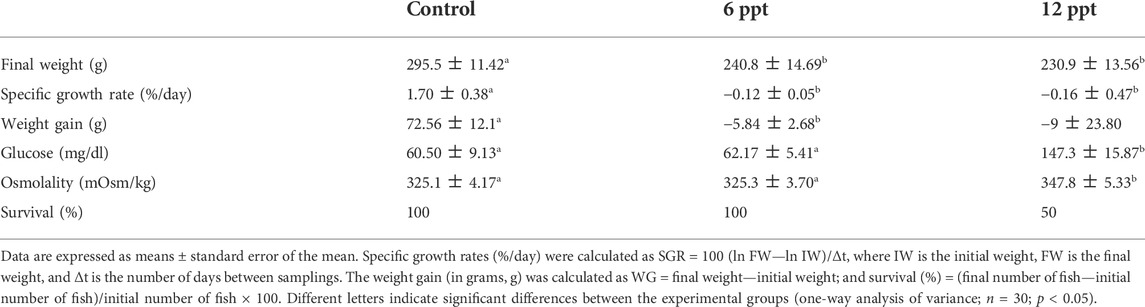
TABLE 2. Effects of salinity exposure on Nile tilapia growth performance.
3.2 Sequencing and molecular characterization
The length of cart, cck, and pyy amplified fragments from O. niloticus was 306, 453, and 237 bp, respectively. They were sequenced and deposited under the GenBank accession numbers MW556307.1, MW556308.1, and MW556314.1, respectively.
The partial sequence of cck cDNA codes for 136 amino acids on ORF +1. The fragment belongs to the gastrin/cholecystokinin family and has a signal peptide between amino acids 1 and 19 and a gastrin domain between amino acids 4 and 136. The partial sequence of cart cDNA codes for 102 amino acids on ORF +1. The fragment belongs to the cart family and has a signal peptide between amino acids 1 and 15. The partial sequence of pyy cDNA codes for 79 amino acids on ORF +. The fragment belongs to the NPY family and has a signal peptide between amino acids 1 and 18.
3.3 Gene expression analysis
3.3.1 Brain
The mRNA expression of cart and cck in the brain of the fish exposed to 6 ppt and 12 ppt was higher (p < 0.05) than in fish from the control group (Figures 1A,D). The mRNA expression of npy in the brain of fish exposed to 12 ppt was lower than in control and 6 ppt groups (Figure 1B). Furthermore, the pyy mRNA expression in the brain of fish from the 12 ppt group was higher (p < 0.05) than in fish from the other groups (Figure 1C).
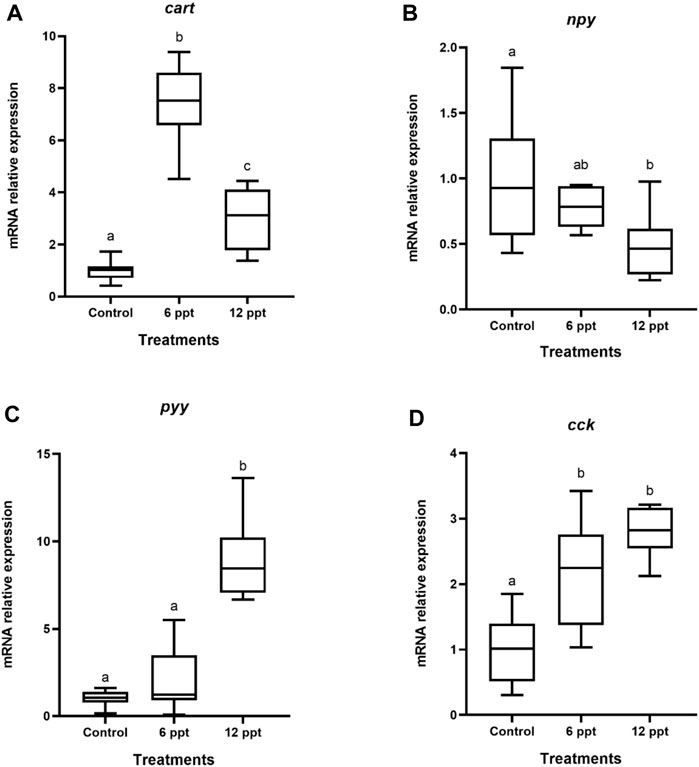
FIGURE 1. Gene expression in the brain of Oreochromis niloticus in the control group and those exposed to 6 and 12 parts per thousand (ppt) of salt for 21 days. The relative expression of the cart (A), npy (B), pyy (C), and cck (D) mRNA was evaluated by quantitative polymerase chain reaction and normalized using the actb gene. The values are expressed as mean ± standard error of the mean. Different letters indicate significant differences between the experimental groups (one-way analysis of variance; n = 12; p < 0.05)
3.3.2 Intestine
In the intestine, the mRNA expression of cck of the fish exposed to 6 ppt was higher (p < 0.05) than that in the fish from another group (Figure 2A). The mRNA expression of npy in the intestine of the fish exposed to 12 ppt was significantly lower than that in the fish from the control group and those exposed to 6 ppt (Figure 2B).
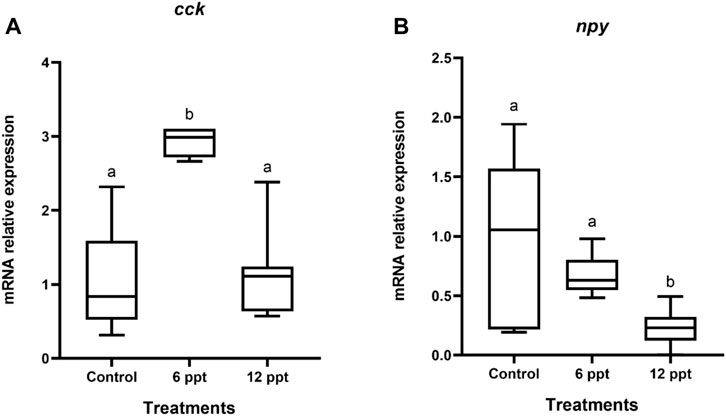
FIGURE 2. Gene expression in the intestine of Oreochromis niloticus in the control group and those exposed to 6 and 12 parts per thousand (ppt) of salt for 21 days. The relative expression of cck (A) and npy (B) mRNA was evaluated by quantitative polymerase chain reaction and normalized using the actb gene. The values are expressed as mean ± standard error of the mean. Different letters indicate significant differences between the experimental groups (one-way analysis of variance; n = 12; p < 0.05)
The mRNA expression of nka and nkcc in the intestine of the fish exposed to 12 ppt was higher (p < 0.05) than that in the fish from another group (Figures 3A,B).
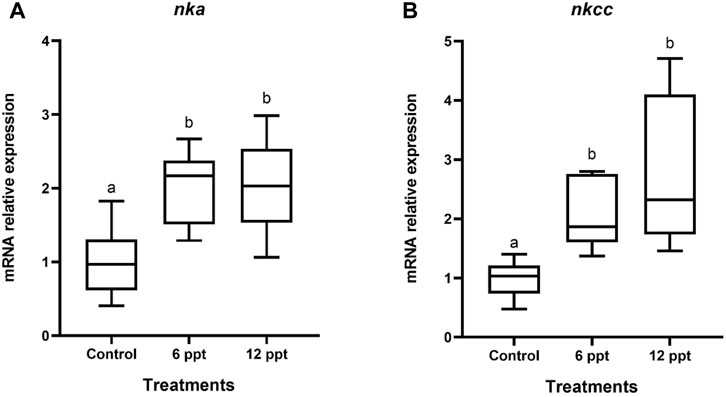
FIGURE 3. Gene expression in the intestine of Oreochromis niloticus in the control group and those exposed to 6 and 12 parts per thousand (ppt) of salt for 21 days. The relative expression of nka (A) and nkcc (B) mRNA was evaluated by quantitative polymerase chain reaction and normalized using the actb gene. The values are expressed as mean ± standard error of the mean. Different letters indicate significant differences between the experimental groups (one-way analysis of variance; n = 12; p < 0.05).
3.4 Flow cytometry analysis
The exposure of Nile tilapia for 21 days to12 ppt increased (p < 0.05) the ROS (Figure 4A) and LPO levels in erythrocytes (Figure 4B). The membrane fluidity levels in the erythrocytes of fish exposed to 12 ppt showed a significant decrease (Figure 4C). Further, both the concentrations of salinity induced a significant increase (p < 0.05) in the DFI of erythrocytes compared with the control group (Figure 4D).
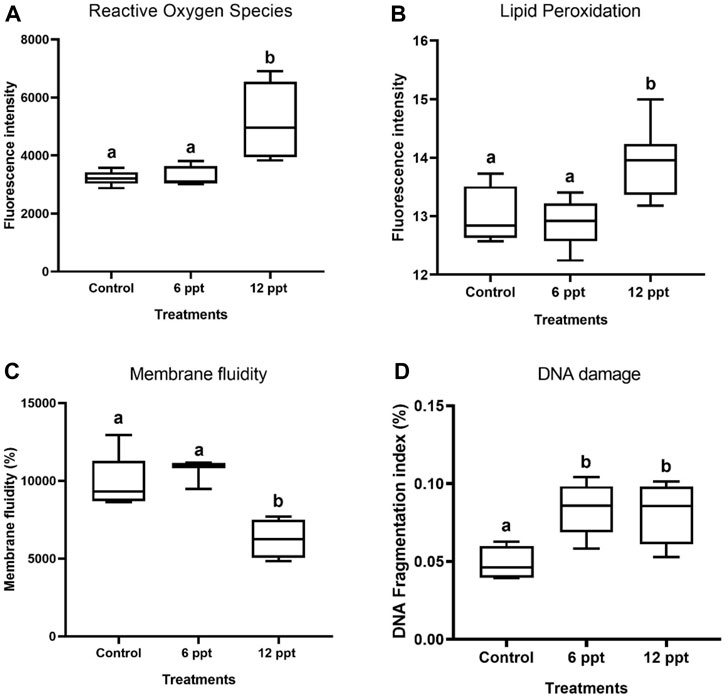
FIGURE 4. The oxidative effects in terms of reactive oxygen species production (A), lipid peroxidation (B), membrane fluidity (C), and DNA fragmentation index (%) (D) in the erythrocytes of Oreochromis niloticus in control and in the groups of fish exposed to 6 and 12 parts per thousand (ppt) of salt, as evaluated by flow cytometry.
4 Discussion
In the present study, the mRNA partial sequences of cart, cck, and pyy in O. niloticus were identified and characterized successfully. Furthermore, this was the first study to evaluate the effects of different salinities on the expression of genes related to appetite in Nile tilapia.
The significant decrease in final body weight, specific growth, and weight found in our study is in line with the report of other authors who observed that increased salinity negatively affected O. niloticus growth, as well as feed intake and feed conversion ratio in other fish species (Luz et al., 2008; Gan et al., 2016). Researchers suggest that decreased growth in increasing salinity environments is related to reduced food consumption (appetite) (Yan et al., 2004). It is known that feeding in vertebrates is regulated by several factors, including a wide range of orexigenic or anorexigenic hormones, which were analyzed in this study.
Among the anorexigenic hormones, cart mRNA is highly expressed in the brain, stomach, and intestine (Ahmadian-Moghadam et al., 2018; Zhang et al., 2018). Here, we observed an increase in the expression of cart in the brain, corroborating the report by other authors that this gene may be related to increased appetite. Central administration of Cart inhibits food intake in mice (Kristensen et al., 1998), rats (Stanley et al., 2001) and fish (Volkoff and Peter, 2000).
Npy and Pyy have been extensively studied in several species because of their roles in the mechanism of feeding behavior (Volkoff et al., 2005). Npy injections increase feeding in goldfish (Narnaware and Peter, 2001) and zebrafish (Yokobori et al., 2012). Moreover, Npy treatments have also been shown to stimulate fish growth/growth hormone (GH) secretion both in vitro and in vivo (Assan et al., 2021). According to what we observed, salinity caused a decrease in the expression of npy in the brain and intestine, which could impact appetite modulation in these organs. In turn, Pyy is known to function as an anorexigenic indicator and has been recognized in several fish species, including Atlantic salmon (Salmo salar) and goldfish (Carassius auratus) (Murashita et al., 2009; Gonzalez and Unniappan, 2010). The increased expression of pyy in the brain indicates that this anorexigenic pathway may have been activated by salinity. Cck plays an essential role in food regulation. Here, cck had its expression increased by salinity. The literature has already reported that oral Cck administration inhibits feed intake in fish (Rubio et al., 2008). Collectively, these results support the hypothesis that salinity causes modulation in appetite-regulating genes.
Plasma glucose level is one of the most common stress indicators (Pankhurst, 2011; Soengas, 2014). An increase in blood glucose levels in groups exposed to the 12 ppt of salt was observed in the present study. Overall, published data suggest that the fish neural system that controls food intake also responds to stressful situations, increasing plasma glucose and cortisol levels (Conde-Sieira et al., 2018, 2010). It is known that distinct brain regions integrate endocrine and metabolic information to elaborate a coordinated response using neural effector pathways that modulate food intake. These areas contain specialized neurons that use glucose as a signaling molecule. Therefore, glucose-stimulated (GE) neurons increase, while glucose-inhibited (GI) neurons decrease their firing rate as glucose levels increase (Marty et al., 2007). It is already known that neurons in glucose detection areas produce peptides involved in controlling food intake in mammals. Literature data suggest that the arcuate nucleus neurons in the hypothalamus that produce Npy appear to be GI. In contrast, the neurons that produce Cart appear to be GE, resulting in increased cart expression and decreased npy expression when glucose levels rise, which is in line with the results shown in this study (Dunn-Meynell et al., 2002; Mobbs et al., 2005; Conde-Sieira et al., 2018).
Another standard stress indicator is the blood cortisol level. In fish, one of the responses to stress caused by high salinities involves activation of the hypothalamic-pituitary-interrenal (HPI) axis, which starts with the production of corticotropin-releasing factor (CRF) and culminates in the production of cortisol. Mohamed et al., 2021 observed that blood cortisol levels were increased in fish exposed to higher salinity while investigating the physiological effects of salt stress on Nile tilapia. Previous studies suggest that this responsiveness to stressors is maintained under chronic stress (Gorissen and Flik, 2016) and that higher doses of cortisol profoundly inhibit the feeding behavior of goldfish (Bernier et al., 2004) and sea bass (Leal et al., 2011).
Oxidative parameters in the blood are frequently used to assess fish health (Bojarski and Witeska, 2020). Therefore, to evaluate whether the chosen salinities caused any damage to Nile tilapia blood cells, cell integrity analyzes were performed by flow cytometry. This was the first study that evaluated ROS, lipid peroxidation, membrane fluidity, and DNA fragmentation in blood cells of O. niloticus exposed to different salinities using a flow cytometer. It was possible to observe an increase in ROS levels in the higher salinity group. In normal physiological states, there is a balance between pro-oxidant production and antioxidant defenses. When an imbalance in favor of pro-oxidant output occurs, the antioxidant defenses can no longer neutralize the elevated levels of reactive oxygen species. Studies have already shown that salt stress induces the overproduction of ROS, which can disrupt metabolism and weaken the immune system, eventually leading fish to death (Liu et al., 2007). It is known that an imbalance in ROS and antioxidative enzymes production, leading to a bigger concentration of ROS, can increase lipid peroxidation, and this was observed in the present study. Our result corroborates with other authors who reported the increase in membrane damage caused by salinity (Sinha et al., 2014; Gan et al., 2016; Mohamed et al., 2021).
The change in membrane fluidity observed in the present study may have occurred because cell membranes are susceptible to disturbance from salinity changes. Sodium interacts with membrane lipid components, and increases in the concentration of sodium ions near the membrane lipids can alter membrane geometry and modulate the interaction with other macromolecules nearby (Evans and Kültz, 2020). We also observed an increase in the rate of genomic DNA damage, which could have been due to the increased ROS in the blood, or as a direct response to salinity exposure. DNA is a cellular macromolecule whose structure and function can be affected by changes in intra and extracellular ion concentrations that accompany salt stress (Fiol and Kültz, 2007). Due to its negative charge, DNA becomes susceptible to interaction with cations, such as Na+, which can increase or decrease in abundance after the change in salinity. However, deviation from the optimal concentration of intracellular cations can result in irregular interactions with nucleic acids and changes in DNA structure and function (Várnai and Zakrzewska, 2004). Consistent with the destabilizing effect of sodium on nucleic acids, high levels of sodium cause DNA strand breaks in various organisms (Evans and Kültz, 2020). Previous studies demonstrated that fish positively regulate transcripts and proteins indicative of DNA damage as part of the salinity stress response. The presence of widespread strand breaks in marine organisms results from living in high sodium environments. These DNA strand breaks persist until salinity is reduced, emphasizing hyperosmotic stress’s harmful effects (Dmitrieva et al., 2006; Whitehead et al., 2013).
The intestine displays important functions for absorbing nutrients and, as a barrier to the external environment, it has the additional function of maintaining the necessary absorption of the active fluid in seawater (Grosell, 2010). Increased active fluid absorption in seawater is associated with increased Na+, K+-ATPase (NKA) activity throughout the intestinal canal. The co-transporter Na+/K+/2Cl– (NKCC) together with NKA, contributes to the transport of ions and absorption of water. Here, an increase in the expression of nka and nkcc genes was observed, showing that the fish were under osmotic stress. These results agree with Mohamed et al. (2021), who observed a significant increase in the gene expression of nka in O. niloticus in groups with salt stress after 10 days of exposure. Similar results were also reported in rainbow trout (Oncorhynchus mykiss) and Mozambique tilapia. (Kammerer et al., 2009; Kammerer and Kültz, 2009; Gilmour et al., 2012).
From the analysis performed, it was possible to observe an increase in glucose and oxidative damage in O. niloticus blood cells exposed to 12 ppt. Furthermore, after 21 days, we observed modulation in the expression of cart, npy, pyy, cck, nka, and nkcc. These adaptive salinity responses may have helped to decrease appetite in tilapia since the anorexigenic genes were upregulated while the orexigenic factors were deregulated. Consequently, this modulation may have contributed to the decrease in weight gain, specific growth rate, and final weight.
The first death was observed in the middle of the experimental period. At the end of 21 days, we observed 50% of mortality in 12 ppt group, probably due to the harmful effects on Nile tilapia physiology, reinforcing the damage caused by salinity in this species. It also provides essential data on impact of salinity on Nile tilapia’s physiology, which has never been described before. More comprehensive studies are still needed to better understand the effects of salinity on gene expression in Nile tilapia. However, the knowledge generated in this study can serve as a basis for selecting individuals or for the genetic improvement of Nile tilapia through genetic engineering.
Data availability statement
The datasets presented in this study can be found in online repositories. The names of the repository/repositories and accession number(s) can be found in the article/supplementary material.
Ethics statement
The animal study was reviewed and approved by Ethics Committee of Animal Experimentation of the Federal University of Pelotas.
Author contributions
VC: Conceptualization, Project admnistration, Funding acquisition, Supervision. Writing—Review and Editing. AM: Conceptualization, Methodology, Investigation, Formal analysis, Data curation, Writing—Original Draft. EK, EB; ED, TS, and LN: Investigation, Resources, Software, Validation. AJ, CC, MR, GC, LS, and WD: Investigation, Formal analysis, Data Curation, Writing—Review and Editing. All authors provided critical feedback and helped shape the research, analysis, and manuscript.
Funding
This study was supported by Fundação de Amparo à pesquisa do Estado do Rio Grande do Sul (FAPERGS-FAPESP #19/2551-0000953-3) and was financed in part by the Coordenação de Aperfeiçoamento de Pessoal de Nível Superior—Brasil (CAPES) Finance Code 001 and AUXPE #2537/2018. VFC, LAS, ASVJ, CDC are also individually supported by Conselho Nacional de Desenvolvimento Científico e Tecnológico.
Conflict of interest
The authors declare that the research was conducted in the absence of any commercial or financial relationships that could be construed as a potential conflict of interest.
Publisher’s note
All claims expressed in this article are solely those of the authors and do not necessarily represent those of their affiliated organizations, or those of the publisher, the editors and the reviewers. Any product that may be evaluated in this article, or claim that may be made by its manufacturer, is not guaranteed or endorsed by the publisher.
References
Ahmadian-Moghadam, H., Sadat-Shirazi, M.-S., and Zarrindast, M.-R. (2018). Cocaine- and amphetamine-regulated transcript (cart): A multifaceted neuropeptide. Peptides 110, 56–77. doi:10.1016/j.peptides.2018.10.008
Assan, D., Mustapha, U. F., Chen, H., Li, Z., Peng, Y., and Li, G. (2021). The roles of neuropeptide Y (npy) and peptide YY (pyy) in teleost food intake: A mini review. Life 11, 547. doi:10.3390/life11060547
Beardmore, J. A., Mair, G. C., and Lewis, R. I. (2001). Monosex male production in finfish as exemplified by tilapia: Applications, problems, and prospects. Aquac. Reproductive Biotechnol. Finfish Aquac. 197, 283–301. doi:10.1016/S0044-8486(01)00590-710.1016/b978-0-444-50913-0.50015-1
Bernier, N. J., Bedard, N., and Peter, R. E. (2004). Effects of cortisol on food intake, growth, and forebrain neuropeptide Y and corticotropin-releasing factor gene expression in goldfish. General Comp. Endocrinol. 135, 230–240. doi:10.1016/j.ygcen.2003.09.016
Bojarski, B., and Witeska, M. (2020). Blood biomarkers of herbicide, insecticide, and fungicide toxicity to fish-a review. Environ. Sci. Pollut. Res. 27, 19236–19250. doi:10.1007/s11356-020-08248-8
Conde-Sieira, M., Agulleiro, M. J., Aguilar, A. J., Míguez, J. M., Cerdá-Reverter, J. M., and Soengas, J. L. (2010). Effect of different glycaemic conditions on gene expression of neuropeptides involved in control of food intake in rainbow trout; interaction with stress. J. Exp. Biol. 213, 3858–3865. doi:10.1242/jeb.048439
Conde-Sieira, M., Chivite, M., Míguez, J. M., and Soengas, J. L. (2018). Stress effects on the mechanisms regulating appetite in teleost fish. Front. Endocrinol. 9, 631. doi:10.3389/fendo.2018.00631
Cruz Vieira, A. B., Weber, A. A., Ribeiro, Y. M., Luz, R. K., Bazzoli, N., and Rizzo, E. (2019). Influence of salinity on spermatogenesis in adult Nile tilapia (Oreochromis niloticus) testis. Theriogenology 131, 1–8. doi:10.1016/j.theriogenology.2019.03.013
Dmitrieva, N. I., Ferraris, J. D., Norenburg, J. L., and Burg, M. B. (2006). The saltiness of the sea breaks DNA in marine invertebrates: Possible implications for animal evolution. Cell Cycle 5, 1320–1323. doi:10.4161/cc.5.12.2867
Dunn-Meynell, A. A., Routh, V. H., Kang, L., Gaspers, L., and Levin, B. E. (2002). Glucokinase is the likely mediator of glucosensing in both glucose-excited and glucose-inhibited central neurons. Diabetes 51, 2056–2065. doi:10.2337/diabetes.51.7.2056
El-Leithy, A. A. A., Hemeda, S. A., El Naby, W. S. H. A., El Nahas, A. F., Hassan, S. A. H., Awad, S. T., et al. (2019). Optimum salinity for Nile tilapia (Oreochromis niloticus) growth and mRNA transcripts of ion-regulation, inflammatory, stress- and immune-related genes. Fish. Physiol. Biochem. 45, 1217–1232. doi:10.1007/s10695-019-00640-7
El-Sayed, A.-F. M., Mansour, C. R., and Ezzat, A. A. (2005). Effects of dietary lipid source on spawning performance of Nile tilapia (Oreochromis niloticus) broodstock reared at different water salinities. Aquaculture 248, 187–196. doi:10.1016/j.aquaculture.2005.04.024
Evans, T. G., and Kültz, D. (2020). The cellular stress response in fish exposed to salinity fluctuations. J. Exp. Zool. 333, 421–435. doi:10.1002/jez.2350
FAO (2020). The state of world Fisheries and aquaculture 2020: Sustainability in action, the state of world Fisheries and aquaculture (SOFIA). Rome, Italy: FAO. doi:10.4060/ca9229en
Fiol, D. F., and Kültz, D. (2007). Osmotic stress sensing and signaling in fishes. FEBS J. 274, 5790–5798. doi:10.1111/j.1742-4658.2007.06099.x
Gan, L., Xu, Z. X., Ma, J. J., Xu, C., Wang, X. D., Chen, K., et al. (2016). Effects of salinity on growth, body composition, muscle fatty acid composition, and antioxidant status of juvenile Nile tilapiaOreochromis niloticus(Linnaeus, 1758). J. Appl. Ichthyol. 32, 372–374. doi:10.1111/jai.12997
Gilmour, K. M., Perry, S. F., Esbaugh, A. J., Genz, J., Taylor, J. R., and Grosell, M. (2012). Compensatory regulation of acid-base balance during salinity transfer in rainbow trout (Oncorhynchus mykiss). J. Comp. Physiol. B 182, 259–274. doi:10.1007/s00360-011-0617-8
Gonzalez, R., and Unniappan, S. (2010). Molecular characterization, appetite regulatory effects and feeding related changes of peptide YY in goldfish. General Comp. Endocrinol. 166, 273–279. doi:10.1016/j.ygcen.2009.09.008
Gorissen, M., and Flik, G. (2016). “The endocrinology of the stress response in fish,” in Fish physiology (Elsevier), 75–111. doi:10.1016/B978-0-12-802728-8.00003-5
Grosell, M. (2010). “The role of the gastrointestinal tract in salt and water balance,” in Fish physiology, the multifunctional gut of fish. Editors M. Grosell, A. P. Farrell, and C. J. Brauner (Academic Press), 135–164. doi:10.1016/S1546-5098(10)03004-9
He, A., Luo, Y., Yang, H., Liu, L., Li, S., and Wang, C. (2011). Complete mitochondrial DNA sequences of the nile tilapia (Oreochromis niloticus) and blue tilapia (Oreochromis aureus): Genome characterization and phylogeny applications. Mol. Biol. Rep. 38, 2015–2021. doi:10.1007/s11033-010-0324-7
Iwama, G. K., Takemura, A., and Takano, K. (1997). Oxygen consumption rates of tilapia in fresh water, sea water, and hypersaline sea water. J. Fish Biol. 51, 886–894. doi:10.1111/j.1095-8649.1997.tb01528.x
Kammerer, B. D., and Kültz, D. (2009). Prolonged apoptosis in mitochondria-rich cells of tilapia (Oreochromis mossambicus) exposed to elevated salinity. J. Comp. Physiol. B 179, 535–542. doi:10.1007/s00360-008-0333-1
Kammerer, B. D., Sardella, B. A., and Kültz, D. (2009). Salinity stress results in rapid cell cycle changes of tilapia (Oreochromis mossambicus) gill epithelial cells. J. Exp. Zool. 311A, 80–90. doi:10.1002/jez.498
Kang’ombe, Jeremiah, and Joseph A., Brown. (2008). Effect of salinity on growth, feed utilization, and survival of Tilapia rendalli under laboratory conditions. Journal of Applied Aquaculture 20.4, 256–271.
Kristensen, P., Judge, M. E., Thim, L., Ribel, U., Christjansen, K. N., Wulff, B. S., et al. (1998). Hypothalamic CART is a new anorectic peptide regulated by leptin. Nature 393, 72–76. doi:10.1038/29993
Leal, E., Fernández-Durán, B., Guillot, R., Ríos, D., and Cerdá-Reverter, J. M. (2011). Stress-induced effects on feeding behavior and growth performance of the sea bass (Dicentrarchus labrax): A self-feeding approach. J. Comp. Physiol. B 181, 1035–1044. doi:10.1007/s00360-011-0585-z
Liu, Y., Wang, W.-N., Wang, A.-L., Wang, J.-M., and Sun, R.-Y. (2007). Effects of dietary vitamin E supplementation on antioxidant enzyme activities in Litopenaeus vannamei (Boone, 1931) exposed to acute salinity changes. Aquaculture 265, 351–358. doi:10.1016/j.aquaculture.2007.02.010
Luz, R. K., Martínez-Álvarez, R. M., De Pedro, N., and Delgado, M. J. (2008). Growth, food intake regulation and metabolic adaptations in goldfish (Carassius auratus) exposed to different salinities. Aquaculture 276, 171–178. doi:10.1016/j.aquaculture.2008.01.042
Martinez-Alborcia, M. J., Valverde, A., Parrilla, I., Vazquez, J. M., Martinez, E. A., and Roca, J. (2012). Detrimental effects of non-functional spermatozoa on the freezability of functional spermatozoa from boar ejaculate. PLOS ONE 7, e36550. doi:10.1371/journal.pone.0036550
Marty, N., Dallaporta, M., and Thorens, B. (2007). Brain glucose sensing, counterregulation, and energy homeostasis. Physiology 22, 241–251. doi:10.1152/physiol.00010.2007
Mobbs, C. V., Isoda, F., Makimura, H., Mastaitis, J., Mizuno, T., Shu, I.-W., et al. (2005). Impaired glucose signaling as a cause of obesity and the metabolic syndrome: The glucoadipostatic hypothesis. Physiology Behav. 85, 3–23. doi:10.1016/j.physbeh.2005.04.005
Mohamed, N. A., Saad, M. F., Shukry, M., El-Keredy, A. M. S., Nasif, O., Van Doan, H., et al. (2021). Physiological and ion changes of Nile tilapia (Oreochromis niloticus) under the effect of salinity stress. Aquac. Rep. 19, 100567. doi:10.1016/j.aqrep.2020.100567
Murashita, K., Kurokawa, T., Nilsen, T. O., and Rønnestad, I. (2009). Ghrelin, cholecystokinin, and peptide YY in Atlantic salmon (Salmo salar): Molecular cloning and tissue expression. General Comp. Endocrinol. 160, 223–235. doi:10.1016/j.ygcen.2008.11.024
Narnaware, Y. K., and Peter, R. E. (2001). Neuropeptide Y stimulates food consumption through multiple receptors in goldfish. Physiology Behav. 74, 185–190. doi:10.1016/S0031-9384(01)00556-X
Ninh, N. H., Thoa, N. P., Knibb, W., and Nguyen, N. H. (2014). Selection for enhanced growth performance of Nile tilapia ( Oreochromis niloticus ) in brackish water (15-20 ppt) in Vietnam. Aquaculture 428-429, 1–6. doi:10.1016/j.aquaculture.2014.02.024
Pankhurst, N. W. (2011). The endocrinology of stress in fish: An environmental perspective. General Comp. Endocrinol. 170, 265–275. doi:10.1016/j.ygcen.2010.07.017
Rahmah, S., Liew, H. J., Napi, N., and Rahmat, S. A. (2020). Metabolic cost of acute and chronic salinity response of hybrid red tilapia Oreochromis sp. larvae. Aquac. Rep. 16, 100233. doi:10.1016/j.aqrep.2019.100233
Rønnestad, I., Gomes, A. S., Murashita, K., Angotzi, R., Jönsson, E., and Volkoff, H. (2017). Appetite-controlling endocrine systems in teleosts. Front. Endocrinol. 8, 73. doi:10.3389/fendo.2017.00073
Rubio, V. C., Sánchez-Vázquez, F. J., and Madrid, J. A. (2008). Role of cholecystokinin and its antagonist proglumide on macronutrient selection in European sea bass Dicentrarchus labrax, L. Physiology Behav. 93, 862–869. doi:10.1016/j.physbeh.2007.12.001
Sinha, A. K., AbdElgawad, H., Giblen, T., Zinta, G., De Rop, M. D., Asard, H., et al. (2014). Anti-oxidative defences are modulated differentially in three freshwater teleosts in response to ammonia-induced oxidative stress. PLOS ONE 9, e95319. doi:10.1371/journal.pone.0095319
Soengas, J. L. (2014). Contribution of glucose- and fatty acid sensing systems to the regulation of food intake in fish. A review. General Comp. Endocrinol. 205, 36–48. doi:10.1016/j.ygcen.2014.01.015
Stanley, S. A., Small, C. J., Murphy, K. G., Rayes, E., Abbott, C. R., Seal, L. J., et al. (2001). Actions of cocaine- and amphetamine-regulated transcript (CART) peptide on regulation of appetite and hypothalamo-pituitary axes in vitro and in vivo in male rats. Brain Res. 893, 186–194. doi:10.1016/S0006-8993(00)03312-6
Tran-Ngoc, K. T., Schrama, J. W., Le, M. T. T., Nguyen, T. H., Roem, A. J., and Verreth, J. A. J. (2017). Salinity and diet composition affect digestibility and intestinal morphology in Nile tilapia (Oreochromis niloticus). Aquaculture 469, 36–43. doi:10.1016/j.aquaculture.2016.11.037
Varnai, P., and Zakrzewska, K. (2004). DNA and its counterions: A molecular dynamics study. Nucleic Acids Res. 32, 4269–4280. doi:10.1093/nar/gkh765
Velan, A., Hulata, G., Ron, M., and Cnaani, A. (2011). Comparative time-course study on pituitary and branchial response to salinity challenge in Mozambique tilapia (Oreochromis mossambicus) and Nile tilapia (O. niloticus). Fish. Physiol. Biochem. 37, 863–873. doi:10.1007/s10695-011-9484-1
Verdegem, M. C. J., Hilbrands, A. D., and Boon, J. H. (1997). Influence of salinity and dietary composition on blood parameter values of hybrid red tilapia, Oreochromis niloticus (Linnaeus) x O. mossambicus (Peters). Aquac Res. 28, 453–459. doi:10.1046/j.1365-2109.1997.00880.x
Volkoff, H., Canosa, L. F., Unniappan, S., Cerdá-Reverter, J. M., Bernier, N. J., Kelly, S. P., et al. (2005). Neuropeptides and the control of food intake in fish. General Comp. Endocrinol. 142, 3–19. doi:10.1016/j.ygcen.2004.11.001
Volkoff, H., and Peter, R. E. (2000). Effects of CART peptides on food consumption, feeding and associated behaviors in the goldfish, Carassius auratus: Actions on neuropeptide Y- and orexin A-induced feeding. Brain Res. 887, 125–133. doi:10.1016/S0006-8993(00)03001-8
Whitehead, A., Zhang, S., Roach, J. L., and Galvez, F. (2013). Common functional targets of adaptive micro- and macro-evolutionary divergence in killifish. Mol. Ecol. 22, 3780–3796. doi:10.1111/mec.12316
Yan, M., Li, Z., Xiong, B., and Zhu, J. (2004). Effects of salinity on food intake, growth, and survival of pufferfish (Fugu obscurus). J. Appl. Ichthyol. 20, 146–149. doi:10.1046/j.1439-0426.2003.00512.x
Yan, P., Jia, J., Yang, G., Wang, D., Sun, C., and Li, W. (2017). Duplication of neuropeptide Y and peptide YY in Nile tilapia Oreochromis niloticus and their roles in food intake regulation. Peptides 88, 97–105. doi:10.1016/j.peptides.2016.12.010
Yang, C. G., Wang, X. L., Tian, J., Liu, W., Wu, F., Jiang, M., et al. (2013). Evaluation of reference genes for quantitative real-time RT-PCR analysis of gene expression in Nile tilapia (Oreochromis niloticus). Gene 527, 183–192. doi:10.1016/j.gene.2013.06.013
Yokobori, E., Azuma, M., Nishiguchi, R., Kang, K. S., Kamijo, M., Uchiyama, M., et al. (2012). Neuropeptide Y stimulates food intake in the zebrafish, Danio rerio. J. Neuroendocrinol. 24, 766–773. doi:10.1111/j.1365-2826.2012.02281.x
Zakariah Mi, M., Wahab, W., and Jasmani, S. (2013). Histopathological and behavioral changes in Oreochromis sp. after exposure to different salinities. J. Fish. Livest. Prod. 01. doi:10.4172/2332-2608.1000103
Keywords: CART, PYY, NPY, CCK, gene expression, food intake
Citation: Martins AWS, Dellagostin EN, Blödorn EB, Silveira TLR, Sampaio LA, Komninou ER, Varela Junior AS, Corcini CD, Nunes LS, Remião MH, Collares GL, Domingues WB and Campos VF (2022) Exposure to salinity induces oxidative damage and changes in the expression of genes related to appetite regulation in Nile tilapia (Oreochromis niloticus). Front. Genet. 13:948228. doi: 10.3389/fgene.2022.948228
Received: 19 May 2022; Accepted: 15 August 2022;
Published: 08 September 2022.
Edited by:
Paolo Franchini, Sapienza University of Rome, ItalyReviewed by:
Tereza Manousaki, Hellenic Centre for Marine Research (HCMR), GreeceSuvra Roy, Central Inland Fisheries Research Institute (ICAR), India
Copyright © 2022 Martins, Dellagostin, Blödorn, Silveira, Sampaio, Komninou, Varela Junior, Corcini, Nunes, Remião, Collares, Domingues and Campos. This is an open-access article distributed under the terms of the Creative Commons Attribution License (CC BY). The use, distribution or reproduction in other forums is permitted, provided the original author(s) and the copyright owner(s) are credited and that the original publication in this journal is cited, in accordance with accepted academic practice. No use, distribution or reproduction is permitted which does not comply with these terms.
*Correspondence: Vinicius F. Campos, ZmFyaWFzY2FtcG9zQGdtYWlsLmNvbQ==