 Zebin Yao1†
 Shuisheng Long1
 Chun Wang1Chengqin Huang1Hairui Zhang1Liao Jian1
 Jingru Huang1Yusong Guo1,2,3
 Zhongdian Dong1,2,3
 Zhongduo Wang1,2,3*†
- 1Guangdong South China Sea Key Laboratory of Aquaculture for Aquatic Economic Animals, Fisheries College, Guangdong Ocean University, Zhanjiang, China
- 2Guangdong Provincial Engineering Laboratory for Mariculture Organism Breeding, Fisheries College, Guangdong Ocean University, Zhanjiang, China
- 3Guangdong Provincial Key Laboratory of Pathogenic Biology and Epidemiology for Aquatic Economic Animals, Fisheries College, Guangdong Ocean University, Zhanjiang, China
The DMY gene is deleted in all males of the Sanya population (SY-medaka) of the Hainan medaka, Oryzias curvinotus, as recently reported by us. However, due to limited knowledge regarding their population genetic background, it is difficult to explore the possible evolutionary pathway. Herein, we resequenced the whole genome of four populations, including SY-medaka. A total of 56 mitogenomes and 32,826,105 SNPs were identified. We found that the genetic differentiation is highest between SY-medaka and the other populations. The results of the population history of the O. curvinotus suggest that the SY-medaka has been in a bottleneck period recently. Further analysis shows that SY-medaka are the most strongly affected by environmental selection. Moreover, we screened some potential genomic regions, and the genes contained in these regions may explain the potential mechanism of the selection process of the SY-medaka. In conclusion, our study can provide new clues for the adaptation process of medaka in the new environment of Sanya.
Introduction
The Oryzias has always been a species of interest for genetics and evolutionary biology, and research on the genetic diversity of Oryzias has been reported continuously. In terms of morphology and physiology, when the medaka was first studied, it was found that there were significant differences in the average number of anal fins of Oryzias latipes in different regions (Egami, 1954), while O. latipes in high latitudes grew faster than those in low latitudes (Yamahira and Takeshi, 2008). Genetic diversity among medaka has also been observed at the cytogenetic level; for example, there are differences in karyotypes among related species (Parenti, 2008). In addition, it was also found that Oryzias has two different sex determination systems: XX/XY and ZZ/ZW (Naruse et al., 2011). However, most relevant reports focus on O. latipes, the first reported teleost with a male sex-determining gene, dmy (Hirayama et al., 2010; Spivakov et al., 2014; Katsumura et al., 2019; Sutra et al., 2019).
As a closely related species of O. latipes, O. curvinotus inhabits mangrove forests along the coast of the South China Sea (Figures 1, 2). Moreover, O. curvinotus is the second species in genus Oryzias containing dmy (Matsuda et al., 2003). Especially, we have found that males of the Sanya population (SY-medaka) from Hainan Island generally lack dmy gene, which is obviously different from mainland populations such as the Gaoqiao population (GQ-medaka) (Dong et al., 2021). In addition, some phenomena of physiological differences have also been observed, for example, the population differences in the speeds of body color change (Supplementary Figure S2, unpublished) and the inconsistent growth rates (Wang, 2020) (Supplementary Figure S3). Obviously, the SY population of O. curvinotus may be different from other populations both in physiological and genetic levels. In particular, geographically, the SY-medaka is separated from the mainland population by the Qiongzhou Strait, which might hinder the gene flows of medaka because of the small body size, the low migrating ability and the bunched eggs by the filaments. Additionally, the climatic conditions also are different, such as water temperature by the latitudinal differences (Supplementary Figure S1). Thus, it is easy to associate external environmental factors with the effects on the various geographic population of the O. curvinotus. However, the lack of knowledge regarding population genetic background makes it difficult to reveal the biological mechanism of the above phenomena in O. curvinotus. Therefore, there is an urgent need to investigate the available gene pool and population genetics of O. curvinotus.
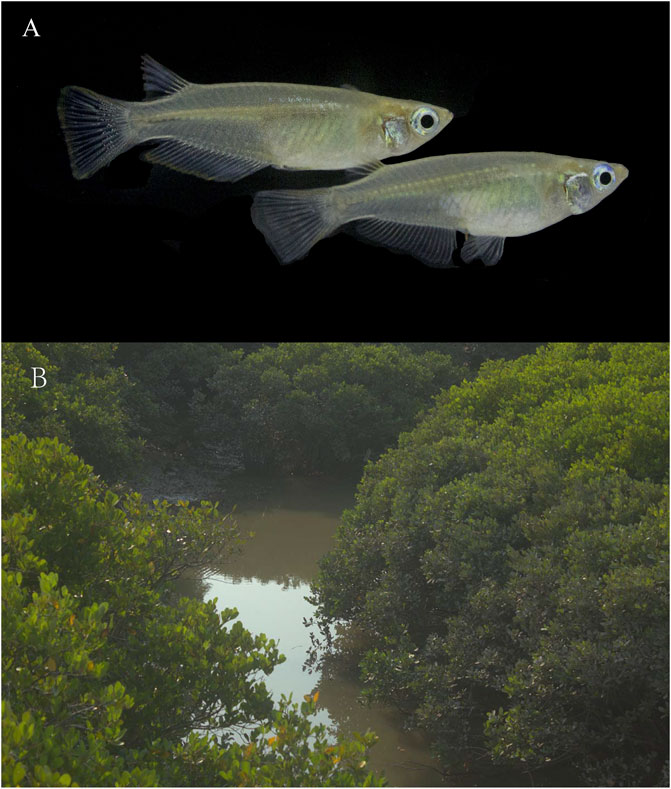
FIGURE 1. Oryzias curvinotus. (A) Male (upper) and female (lower) Oryzias curvinotus form Sanya. (B) Natural habitat of Hainan medaka.
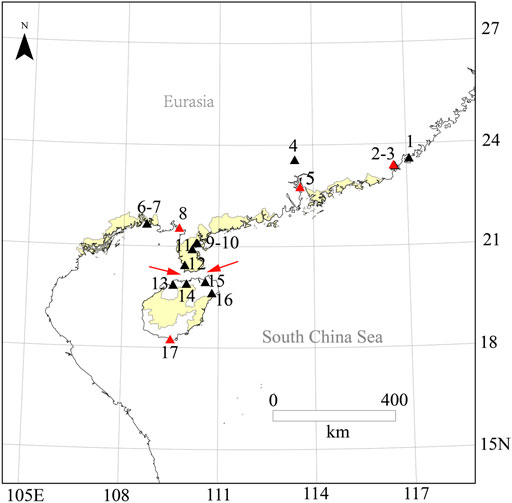
FIGURE 2. Species distribution of O. curvinotus. Species distribution map for O. curvinotus and some new investigation sites; 1, Raoping; 2, Dahao; 3, Niutianyang (ST); 4, Conghua; 5, Nansha (JWM); 6, Zhonggui; 7, Yamchow; 8, Gaoqiao (GQ); 9, Huguang; 10, Donghai dao; 11, Fucheng; 12, Leizhou; 13, Lingao County; 14, Chengmai; 15, Dongzhaigang; 16, Wenchang; 17, Sanya (SY); The location IDs are in common with Supplementary Table S2; Four collection sites of O. curvinotus for WGS are marked with red triangles. The red arrow refers to the Qiongzhou Strait.
Previous studies of genetic diversity and population structure have often been based on mitochondrial genome (mtDNA) (Hirayama et al., 2010; Mokodongan and Yamahira, 2015). But mtDNA was considered insufficient to fully describe population structure and history because of its single locus (Katsumura et al., 2019). Single nucleotide polymorphisms (SNPs) are considered an effective genetic marker for researching the genetic diversity and adaptive evolution of species. In recent years, as sequencing technology has become more mature and economical, the nuclear genomes of a large number of species have been successfully assembled. Whole genome sequencing (WGS) and SNPs detection have also been widely used. In vertebrates, SNPs occur almost once in every 1,000 nucleotides on average in human DNA, and some are strongly correlated with traits or genetic diseases (Kujovich, 2011; Ji et al., 2012; Ezzeddini et al., 2021). In addition, SNPs in many animals such as fish are associated with environmental adaptation. Recently, many potential genes related to environmental adaptation in fish have been discovered by using SNPs (Jones et al., 2012; Araki et al., 2018; Gaither, Gkafas, De Jong, et al., 2018; Narum et al., 2018; Onainor, 2019; Cádiz et al., 2020), which can usually provide some new clues for species evolution and environmental adaptation research.
Here, we performed a batch of whole-genome re-sequencing of the wild O. curvinotus from four geographic groups at different latitudes with the aim of obtaining a high density of SNPs and also analyzed the population structure and evolutionary history of O. curvinotus at the nuclear gene level.
Materials and methods
Sampling and sequencing
All the 56 wild individuals sequenced in this study were collected from four geographical locations (Figure 2, Supplementary Table S2) along the south coast of China with mangroves, of which Shantou (ST, E116.57° N23.38°), Jiuwangmiao (JWM, E113.58° N22.76°), and Gaoqiao (GQ, E109.74° N21.55°) are located in Guangdong Province, and Sanya (SY, E109.50° N18.25°) is located in Hainan Province.
After collection of each population, all the samples were euthanized and stored in absolute ethanol. Genomic DNA was extracted using the phenol-chloroform method. The fragment size of the sequencing library was 350 bp, and sequencing was conducted on the Illumina HiSeq Xten platform using terminal pairing (PE) 150 bp reads. The sequencing depth of each sample was ×10. The resequencing raw data of all samples in this study have been uploaded to the NCBI Sequence Reading Archive (SRA) with storage number SRR17331594-SRR17331649.
Read mapping and variant calling
Before mapping the resequenced data to the reference genome, we filtered the adapter sequence and low-quality reads of all original data to obtain high-quality clean data. BWA software (parameters: mem, -T 4, -K 32, -M) was used to compare sequencing results to the reference genome (GQ-medaka, Sequences have been submitted to GenBank, PRJNA821560) of O. curvinotus, and GATK4 (MarkDuplicates) software was used to remove PCR duplication (McKenna et al., 2010; Li, 2013).
The standard process of GATK4 software was used to identify variation and extract SNPs. High quality SNP data was filtered using GATK4 (VariantFiltration, default parameters) and VCFtools (parameters: -max-missing 0.5, -maf 0.01, -minDP 3, -minQ 30) (Danecek et al., 2011).
Annotation
Gene-based SNP annotation was performed according to the annotation of the O. curvinotus genome using the package ANNOVAR (Wang et al., 2010). Based on the genome annotation, SNPs were categorized as occurring in exonic regions (overlapping with a coding exon), intronic regions (overlapping with an intron), splice sites (within 2 bp of a splicing junction), upstream and downstream regions (within a 2 kb region upstream or downstream from the transcription start site), or intergenic regions. SNPs in coding exons were further grouped as either synonymous SNPs or nonsynonymous SNPs. Additionally, mutations causing gain or loss of a stop codon were also classified as nonsynonymous SNPs. It should be noted that the statistical results for SNP classification may be redundant due to the overlap of genes.
Phylogenetic tree
The P-distance matrix was calculated based on the all SNPs data by VCF2Dis (https://github.com/BGI-shenzhen/VCF2Dis) and the NJ-tree was built with 1000 bootstrap by PHYLIP 3.69 (http://evolution.genetics.washington.edu/phylip.html).
Mitochondrial genome assembly and mtDNA tree
The open source toolkit, GetOrganelle (Jin et al., 2018) were used to assemble the mitochondrial genome based on the reads from the resequenced datasets. Each dataset of 56 samples was completely assembled into a circular sequence. The assembly results were confirmed to be accurate by re-mapping to the assembled mitochondrial sequence. Mitochondrial sequences of other species of the Oryzias were obtained from NCBI (Supplementary Table S3), multiple alignment were performed using the muscle method, and the maximum likelihood (ML) tree was built with 1000 bootstrap by MEGA (Kumar et al., 2018).
Principal component analysis
All SNPs of 56 individuals were used for principal component analysis by GCTA software (Yang et al., 2011). The first three important principal components were retained and graphed. The discrete points reflect the real structure of the population to a certain extent.
Population structure
To analyze the population structure, the program Admixture was used to estimate ancestry number in a model-based manner from all SNP genotype datasets. To explore the convergence of individuals, we predefined the number of genetic clusters from K = 3 to K = 6.
Linkage disequilibrium analysis
To estimate and compare the pattern of linkage disequilibrium (LD) of each population, the squared correlation coefficient (r2) values between any two SNPs within 100 kb were computed by using the software PopLDdecay (Zhang et al., 2019). For plotting the LD attenuation curve, the SNP data of 56 individuals were divided into four groups according to geographical location, and the average r2 of each group was calculated.
Demographic history reconstruction
PSMC software was used to construct the historical dynamics of the four populations of O. curvinotus (Li and Durbin, 2011). PSMC is based on the results of individual resequencing alignment and considers all heterozygous loci of an individual, not just SNPs. When estimating the population historical dynamics of O. latipes, it is assumed that the doubling time of each generation is 0.67 years and the mutation rate is 2.5 × 10⁻⁸ (Spivakov et al., 2014). However, the estimation results of our data based on these parameters are not very reliable. Therefore, in this study, to ensure that all possible results are considered, we used as many parameters as possible for estimation. According to the sexual maturity time of O. curvinotus and field investigation, multiple values were used for the mutation rate, ranging from 0.25 × 10⁻⁸ to 2.5 × 10⁻⁸, and the generation intervals used were 0.25, 0.33, 0.5, 0.66, or 1 year. Default values were taken for other parameters.
Polymorphism levels and selection analyses
FST values between populations were calculated using vcftools software. In order to identify potential selected genes, we counted the θπ ratios and FST values in 40 kb windows in 20 kb steps. For comparing groups, the regions with maximum FST values (top 5%, as outliers) and maximum θπ ratio (top 5%, as outliers) were identified as selected regions. We used clusterProfiler to preform KEGG enrichment analysis on the candidate selective gene located in selected regions.
Results
Sequencing results and single nucleotide polymorphism identification and annotation
In this research, O. curvinotus from the four geographical groups are abbreviated as ST-medaka, JWM-medaka, GQ-medaka, and SY-medaka. Genome mapping of all individuals across the O. curvinotus’s 800 Mb genome resulted in an average of 98.21% sequencing coverage (Supplementary Table S1). Through identification and screening, we identified a total of 32,826,105 SNPs. Among them, 875,581 loci were located in exonic regions, 509,253 were synonymous variations, and 355,894 were nonsynonymous variations. Other basic statistical results are shown in Table 1.
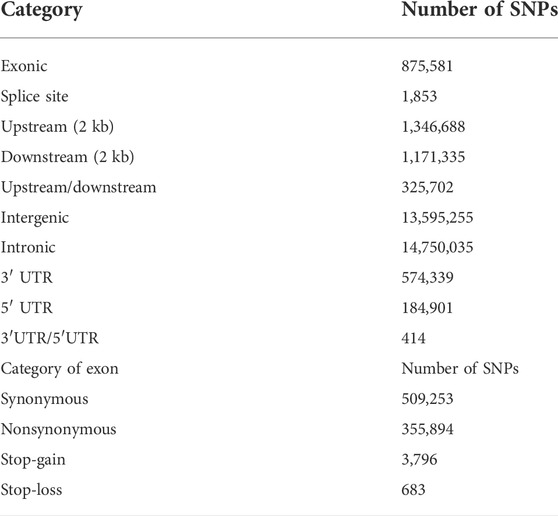
TABLE 1. Statistics for SNP annotation results.
Population genetic structure and phylogeny
The population genetic structure (Figure 3A) shows the population structure of the 56 individuals for population numbers (K) from 1 to 6. When K is equal to 2, 3 continental population are grouped, SY-medaka was separated. When K is equal to 3 or 4, ST-medaka and JWM-medaka are grouped. Although JWM-ST and JWM-GQ are almost equal in geographical straight-line distance, JWM-medaka was grouped with GQ-medaka. When K is equal to 4 or 5, JWM-medaka and ST-medaka are forced to be separated. When K is 4 or 6, the ancestral sequences of SY-medaka are separated, while the GQ-medaka can always be clearly separated. Statistical support for the different number of clusters was evaluated based on fivefold cross-validation implemented in Admixture (Supplementary Figure S4). The grouping of subgroups at the CV-error minimum is relatively reasonable. Based on the value at the CV-error minimum, the four populations of O. curvinotus are divided into three subgroups.
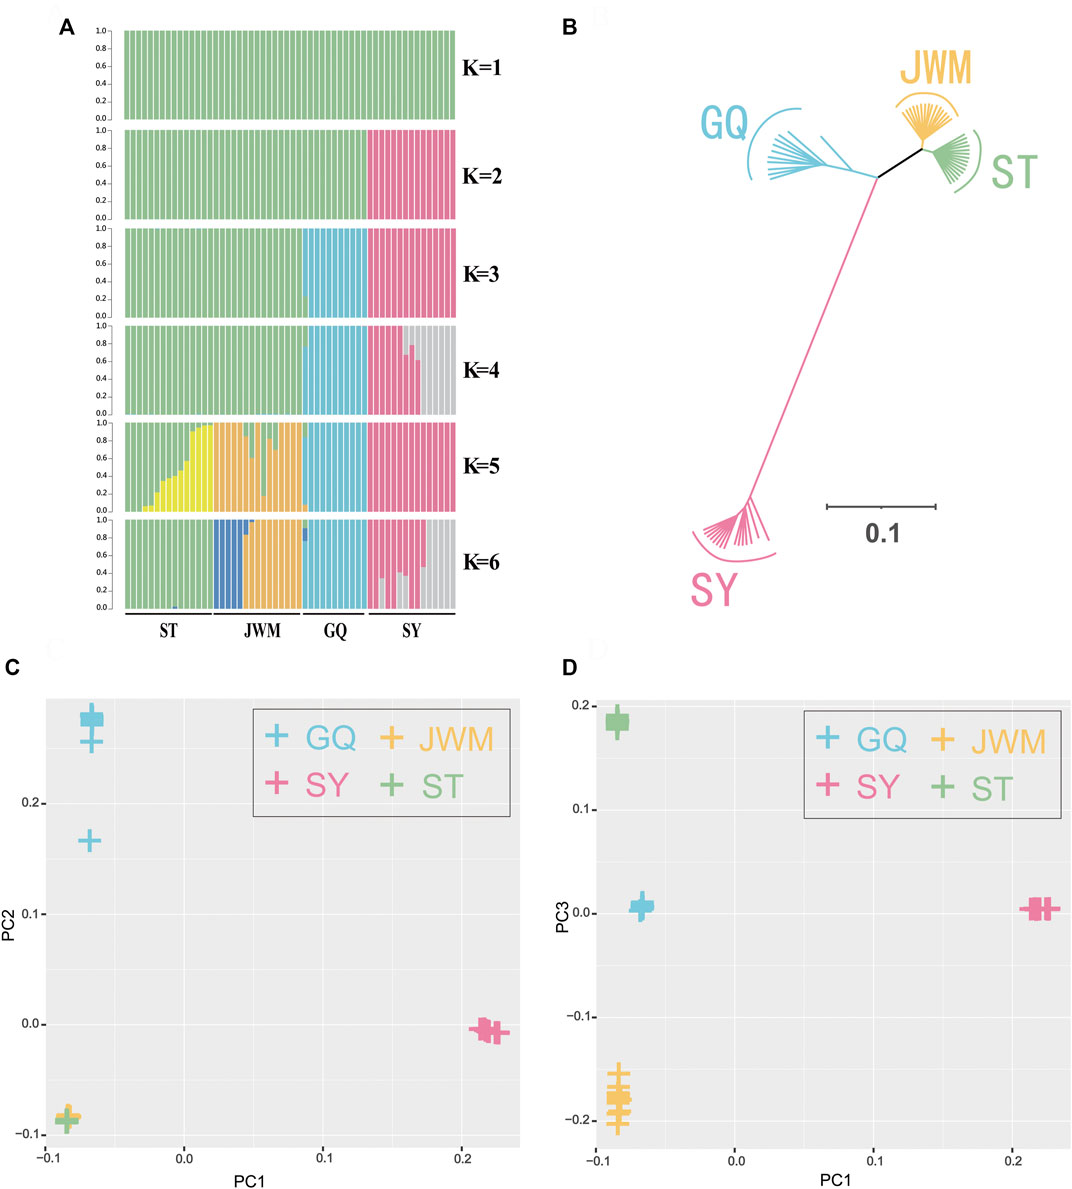
FIGURE 3. Population genetics. (A) Genetic structure of the O. curvinotus as inferred by Admixture analysis. The number of populations (K) from 1 to 6 is shown. Each color represents a different hypothetical ancestor. (B) Unrooted tree generated by the neighbor-joining method with 1000 bootstrap. (C,D) The principal component analysis (PCA) of all individuals.
The VCF2Dis software was used to calculate the genetic distance between all individuals, and the neighbor-joining (NJ) method was used to construct the evolutionary tree. The unrooted tree (Figure 3B, Supplementary Figure S9) demonstrates that the genetic distance between ST-medaka and JWM-medaka is the shortest, and their genetic distance with SY-medaka is the longest, followed by their distance to GQ-medaka. Based on the complete mitochondrial sequence, we constructed the ML tree (Figure 4). Here, other species of Oryzias were used as the outgroup. Apart from the clustering of one individual (ST 16) that was different from the NJ tree based on SNPs, all other individuals formed clusters with other local individuals. This demonstrates that the genetic structure analysis based on SNPs is reliable. In addition, the result of ML tree indicate that O. curvinotus first differentiated into two branche. One branch includes ST-medaka and JWM-medaka, and the other branch includes GQ-medaka and SY-medaka.
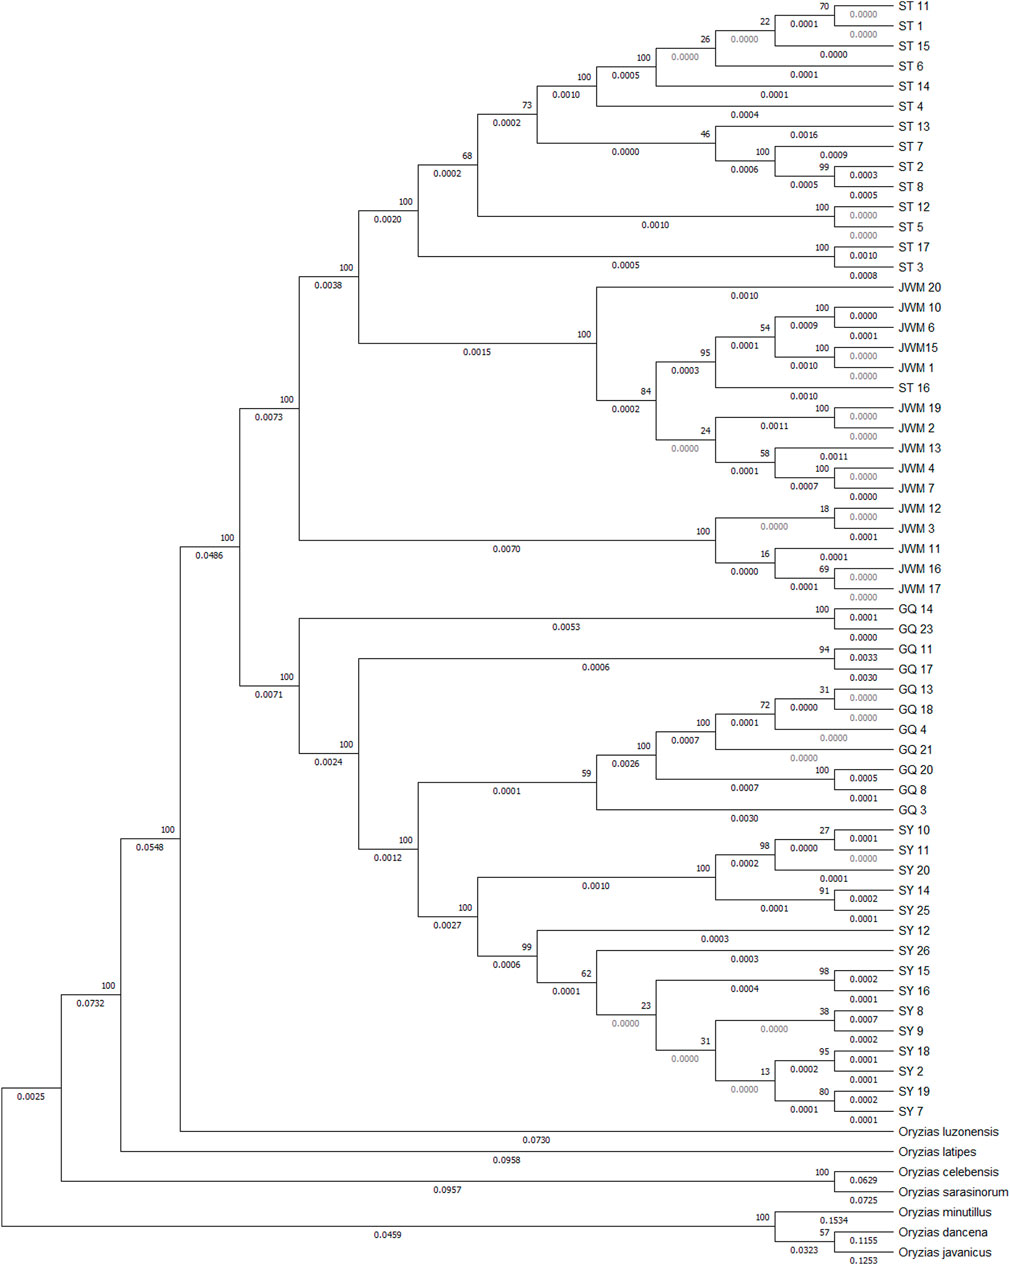
FIGURE 4. Based on the ML tree of mitochondrial whole sequences, some other fish of the Oryizas genus were used as outgroups. The bootstrap value (above branch) and branch lengths (below branch) are shown here.
The first three principal components, namely first principal component (PC1), second principal component (PC2), third principal component (PC3) were extracted and plotted. In particular, the PC1 (variance explained = 48.44%) separated the SY-medaka from the other populations, the PC2 (variance explained = 11.93%) separated the GQ-medaka from the other populations (Figure 3C). The PC3 (variance explained = 2.70%) indicated that ST-medaka and JWM-medaka were separated (Figure 3D). The PC3 were extracted and plotted. The variance interpretation sum of the first three principal components was 63.07%.
Population history of O. curvinotus
In Figure 5, we show the estimation results of historical population dynamics for different possible generation intervals and nucleic acid mutation rates. The results show that the historical dynamic results of most O. curvinotus are similar, and some poor results only appear for more extreme parameter values. Taking the estimate of g = 0.67, μ = 2.5 × 10⁻⁸ as an example, the effective population sizes of all subgroups of medaka were basically the same until about 100,000 years ago, when the common ancestor of them had not yet diverged. Therefore, the effective population sizes dating back to this period are basically the same. During the period from about 40,000 to 100,000 years ago, the population size changes showed two trends, one is an upward trend containing SY-medaka and GQ-medaka, and the other is a downward trend containing JWM-medaka and ST-medaka, suggesting that two branches of the medaka diverged during this period. While the trends in effective population sizes of WM-medaka and ST-medaka remained consistent and the population sizes were very similar from approximately 10,000 to 40,000 years ago. In contrast, the trends of the other two populations were clearly distinguished, with GQ-medaka showing an upward and then a downward trend, while SY-medaka showed a sharp decline. All four populations of the O. curvinotus live along the coast of the South China Sea, but the demographic changes of several of them are very different, which may be due to the different effects of geological events and climatic environmental changes on them.
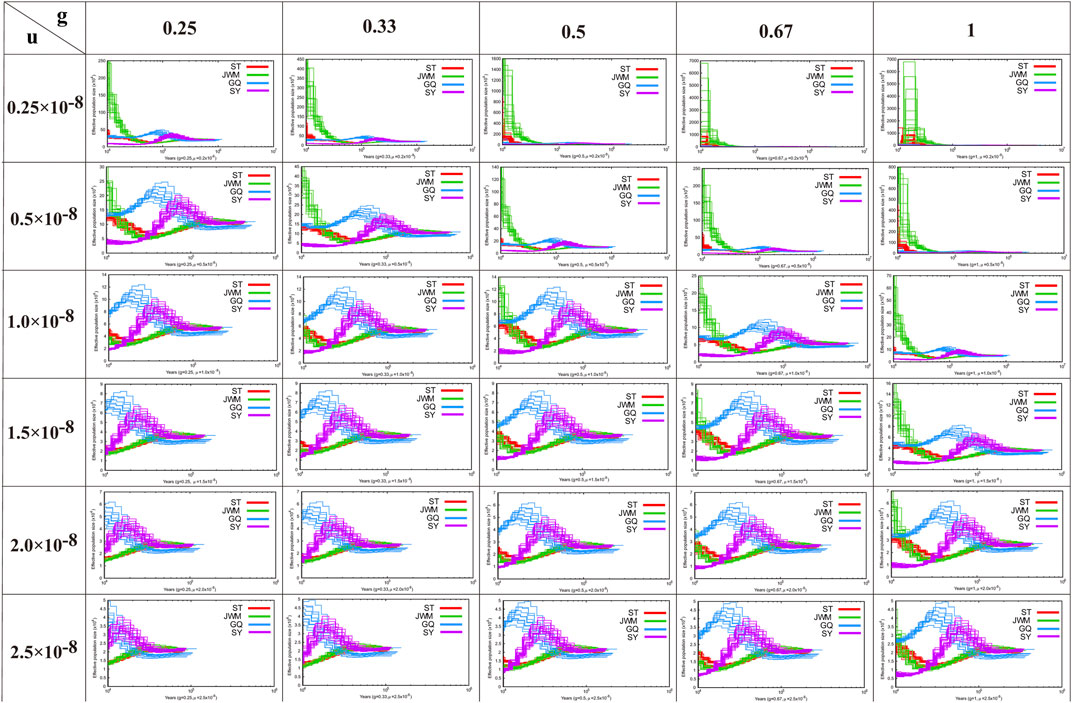
FIGURE 5. The results of the analysis of the demographic history of the O. curvintous are presented. Multiple values ranging from 0.25 × 10⁻⁸ to 2.5 × 10⁻⁸ were used for mutation rates (u). The generation intervals (g) were 0.25, 0.33, 0.5, 0.66, and 1 year based on the sexual maturity time of the medaka and field surveys.
Linkage disequilibrium analysis
The LD attenuation diagram (Figure 6A) shows that the LD attenuation speed of each O. curvinotus population is very fast and stabilized at an attenuation distance of about 20 kb. In addition, the decay rates of the ST-medaka, JWM-medaka, and GQ-medaka are similar, but significantly lower than that of SY-medaka, indicating that SY-medaka may be under stronger selection pressure. It is worth noting that the LD value of the final convergence of the four groups is correlated with the latitude. At lower latitudes, the stable LD value of each group was higher.
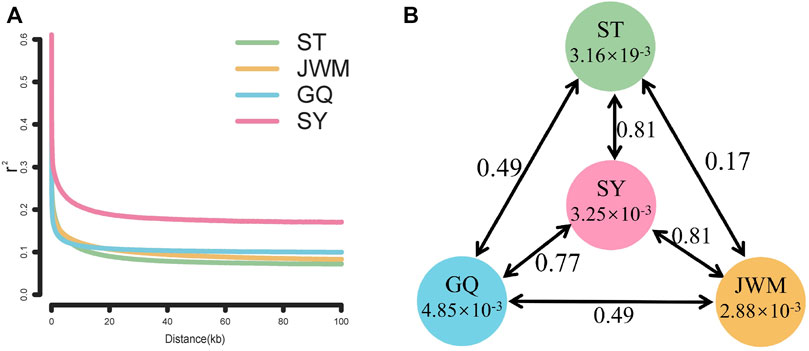
FIGURE 6. (A) Linkage disequilibrium patterns of four populations. (B) FST values among populations and θπ in each population.
θπ and differentiation index (FST)
Genome-wide scans were performed using the sliding-window approach, then θπ and FST were calculated between the populations (Supplementary Figures S5, S6). The results showed that SY-medaka had the highest FST value of 0.81 with the other populations, and the smallest FST between the ST-medaka and JWM-medaka (Figure 6B). In addition, GQ-medaka had the highest θπ of 4.85 × 10⁻³, SY-medaka was the second highest at 3.25 × 10⁻³, ST-medaka and JWM-medaka were the least at 3.16 × 19−3 and 2.88 × 10⁻³, respectively. The results indicated that SY-medaka produced a large genetic differentiation. Furthermore, that of SY-medaka depicted a highly genetically differentiated population from other populations, suggesting that SY-medaka may have been subjected to strong selection.
Selected gene
In order to identify potential selected genes in SY-medaka, and to detect regions with significant signatures of a selective sweep, we considered the distribution of the θπ ratios and FST values. We selected windows simultaneously with significant high θπ ratios and significant high FST values of the empirical distribution as regions with strong selective sweep signals along the genome (Figure 7, Supplementary Figures S7). Through the intersection of the top 5% windows of FST values and θπ ratios, we screened some strong selection signals of the three subpopulations, in which 136 genes were obtained by comparing ST to SY (ST-SY), 65 genes were obtained for JWM-SY, 303 genes were obtained for GQ-SY, and 39 candidate genes were obtained by taking the intersection of the three groups of genes (Figure 8). 39 selected genes of SY-medaka participate in multiple biological processes, which may indicate the potential processes through which O. curvinotus have adapted to the new environment of Sanya. We found that the annotation information of six genes was incomplete, and their specific functions need to be further studied. We performed KEGG enrichment analysis on the other 33 candidate genes to further explore the potential mechanism by which O. curvinotus adapted to the new environment of Sanya (Table 2). KEGG enrichment results showed that 12 genes were enriched in KEGG pathways, and only three genes (EVM.Model.Chr6.217, EVM.Model.Chr23.722, and EVM. Model.Chr23.721) were significantly enriched in two pathways (ko04711: circadian rhythm—fly; ko04620: Toll-like receptor signaling pathway).
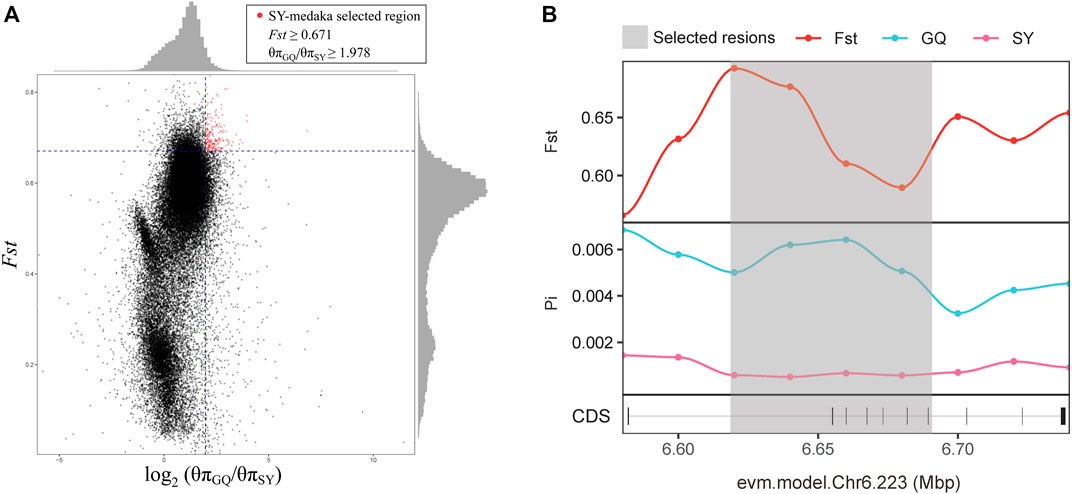
FIGURE 7. (A)The distribution of the θπ ratios (θπGQ-medaka/θπSY-medaka) and FST values (GQ-SY), calculated in 20-kb windows sliding in 10-kb step. Data points on the right of the vertical dashed line (corresponding to the 5% left tail of the empirical θπ ratio distribution), and above the horizontal dashed line (5% right tail of the empirical FST distribution) were identified as selected regions for SY-medaka (red points). (B) Examples of genes with strong selective sweep signals in GQ-medaka and SY-medaka. FST and θπ values are plotted using a 10-kb sliding window. Shaded genomic regions were the regions with strong selective signals for SY-medaka.
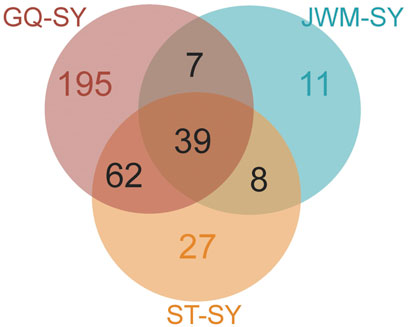
FIGURE 8. Venn diagram showing the intersection of the number of genes subject to selection in SY-medaka relative to other populations.
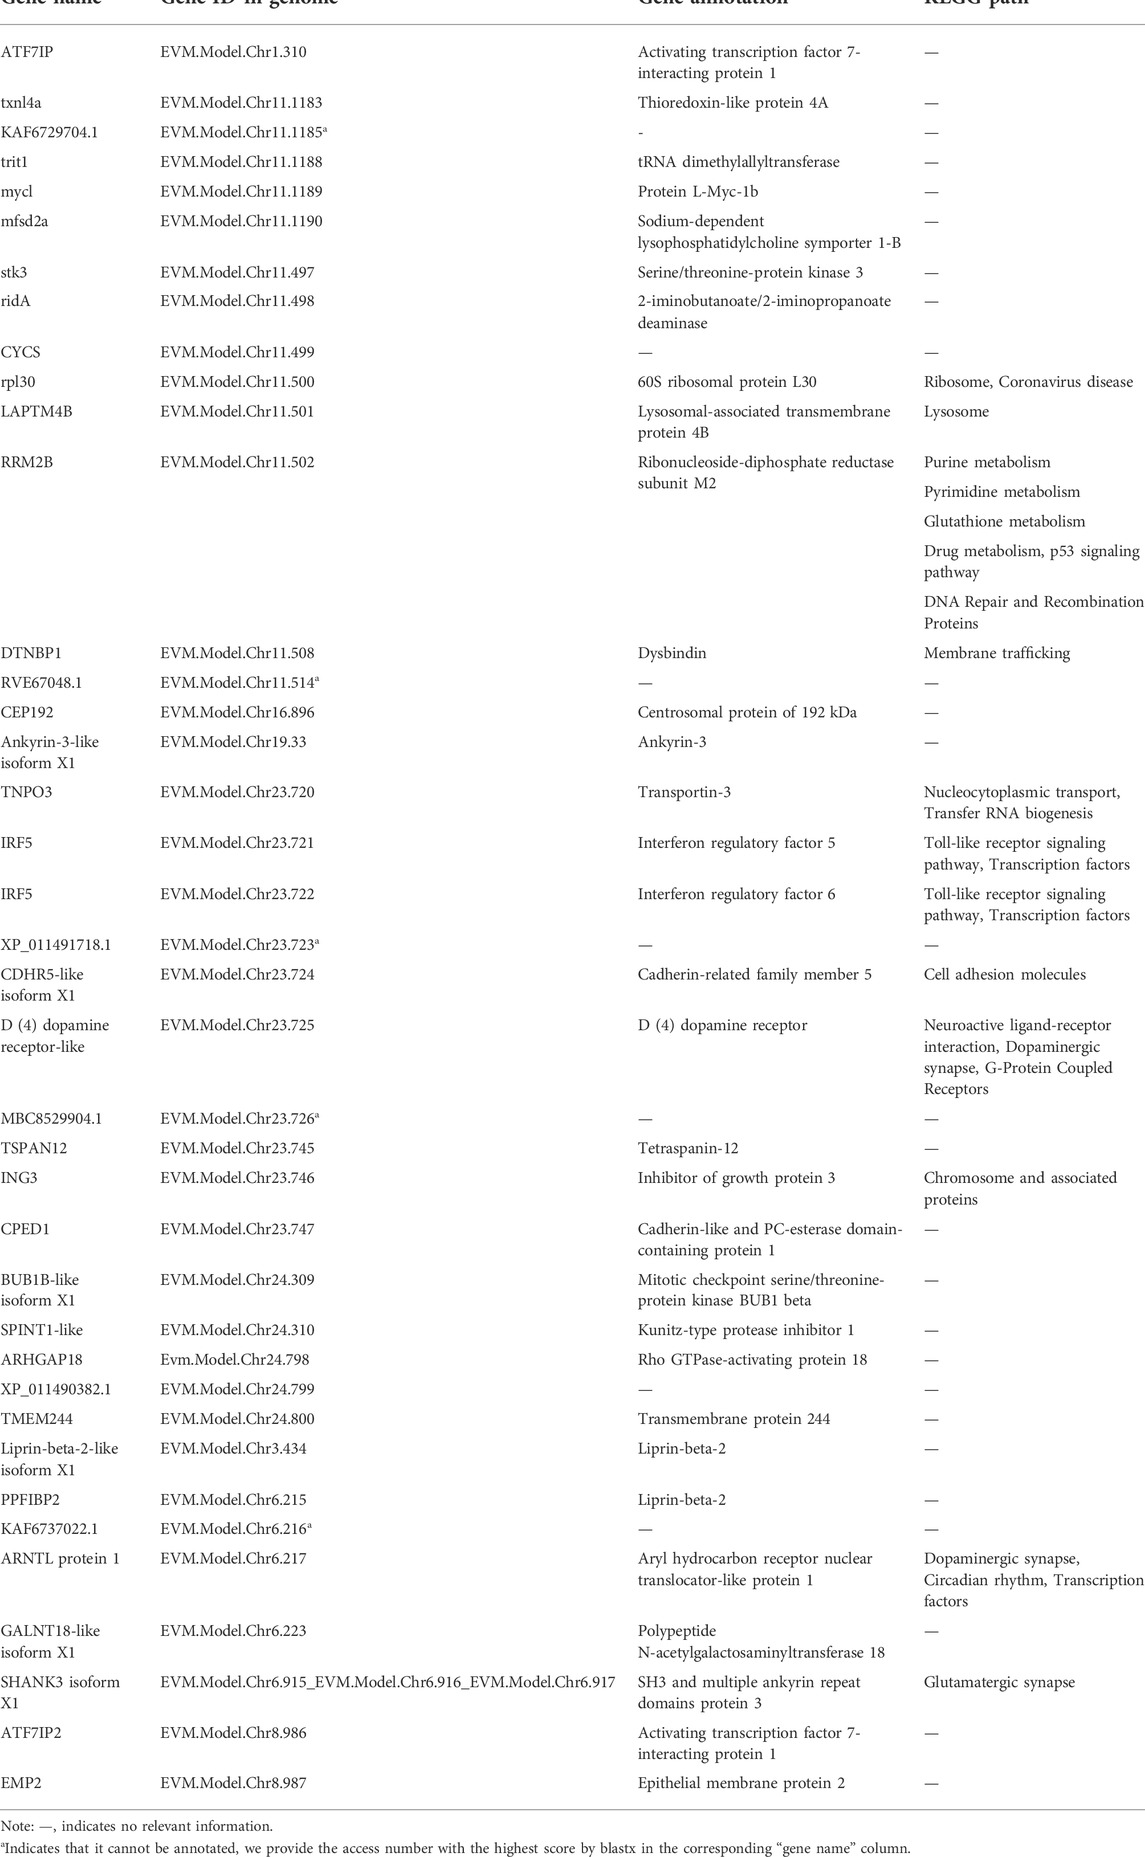
TABLE 2. Functional pathway enrichment for selected genes of SY-medaka.
Discussion
Population genetic structure and genetic differentiation of O. curvinotus
We have assessed for the first time the population genetic structure and population history of the O. curvinotus, and found that the O. curvinotus can be divided into three subgroups, with the ST-medaka and JWM-medaka forming a subgroup located in the east, and the GQ-medaka and SY-medaka each forming a separate subgroup, which we suggest is the result of local subgroups adapting to their respective habitats.
We found that the genetic divergence of SY-medaka from other geographic groups is large, which may result from different environmental differences, and that such environmental differences are likely to be latitude-related. It has been shown that O. latipes in high latitudes grew faster than those in low latitudes (Yamahira and Takeshi, 2008). Similar results were observed in O. curvinotus, and other physiological indicators such as heart rate were also found to differ between geographic groups at different latitudes (Wang, 2020) (Supplementary Figures S8, unpublished). We also found that the genetic differentiation of FST between geographic groups showed some correlation with their latitudinal span (Figure 9), suggesting a genetic basis for the physiological differences between geographic groups at different latitudes. Interestingly, the rate of LD decay also shows some correlation with latitude. In the O. curvinotus, LD decays particularly rapidly, reaching a steady state at r2 at about 20 kb, which is probably due to the very short generation interval (about 3–6 months). The same situation exists in O. latipes (Spivakov et al., 2014; Katsumura et al., 2019). This indicates that the fishes of Oryzias have some commonalities, which do not change with environmental factors.
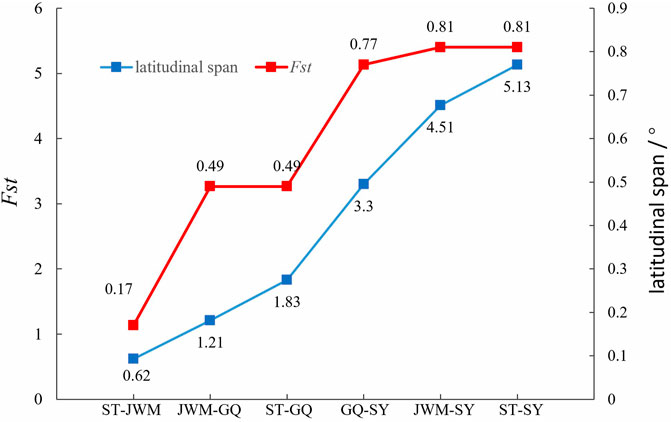
FIGURE 9. The relation between FST between geographic groups and their latitudinal span.
In addition, SY-medaka is a special and interesting population. SY-medaka decayed more rapidly amongst the four geographic groups, significantly more than in the other groups, which we attribute to the effects of long-term environmental selection pressures on SY-medaka.
Population history and selective pressures of O. curvinotus
Previous studies have suggested that the latipes group (comprising O. latipes, O. curvinotus and O. luzonensis) arose in 27.3 Mya and that O. latipes formed in 9.2 Mya, on the basis of which the species formation and population divergence of the O. curvinotus would have occurred within 9.2 million years (Rabosky et al., 2018). Geological evidence suggests that Hainan Island, where SY-medaka is located, was initially closely linked to Eurasia. However, due to the influence of the Indian plate on Eurasia, Hainan Island separated and drifted to its present location. This process occurred at about 65 Mya-24 Mya (Guanghe, 2018), suggesting that Hainan Island was completely detached from the mainland by the time the O. curvinotus formed. The separation of Hainan Island indirectly led to the creation of the Qiongzhou Strait, a necessary precondition for the geographic isolation of SY-medaka from other groups, however this geographic isolation was unstable and subject to sea-level elevation.
Some paleoceanographic data demonstrate that the sea level has been changing continuously throughout history, with the last drastic change occurring about 20,000 years ago (Ganopolski et al., 2010; Hertzberg, 2015; Peter et al., 2009). The global sea level continued to decline due to the advent of the Last Glacial Period, the coastline of the Eurasian continent moved southward, and the bottom of the Qiongzhou Strait emerged. The decline of the sea level not only completely separated the groups of O. curvinotus, but also turned the original water surface into land. Only the low-lying and river channels are still covered with water, which obviously restricts the living space of O. curvinotus. This is consistent with the historical changes that occurred in the populations we analyzed. Since about 100,000 years ago, each group has undergone population decline. During the Last Glacial Period, there was a decline in the population number of the four populations, but the population size of the JWM-medaka and GQ-medaka in Shantou recovered or even exceeded their prior numbers. However, the populations of SY-medaka and GQ-medaka, despite historically experiencing a short population increase, have been decreasing ever since, and both populations seemed to be in a bottleneck period. However, SY-medaka declined the most, to a much greater extent than GQ-medaka, and there was no trend of population recovery in many estimation results. Not only that, but we also found that the population size change of the Southern population of O. latipes during the Last Glacial Period was perfectly in line with our speculation that the population of Japanese Southern medaka started to decline at the onset of the Last Glacial Period and began to expand almost simultaneously with the end of the ice age (Spivakov et al., 2014), thus we suggest that the ice age affected the sea level and thus the population size of all Oryzias species. Unfortunately, however, for our data, PSMC can only estimate up to the last 10,000 years, and it remains to be further explored whether GQ-medaka and SY-medaka will show expansion after the bottleneck, like the population groups or O. latipes.
At the same time, we found that the trends in population change of ST-medaka and JWM-medaka were almost the same, while the change trends of GQ-medaka and SY-medaka were almost the same, although their population levels differed greatly. The ML tree constructed based on mitochondria also reflects that GQ-medaka and SY-medaka are closely related, indicating that they have a common ancestor. However, the NJ tree based on nuclear SNPs revealed that GQ-medaka and SY-medaka are far from each other. Therefore, we believe that SY-medaka was subjected to strong selection that resulted in GQ-medaka and SY-medaka having a common ancestor while being genetically distant.
Potential environmental factors acting as selection pressures on SY-medaka
In terms of possible environmental factors acting as selective pressures on SY-medaka, we only considered temperature and ultraviolet light. Because O. curvinotus is mainly distributed along the coast of southern China, the climatic conditions of the four sampling points are almost the same, except that the light and temperature may have been different. Using climate data collected from the Weather Spark website from 1 January 1980, to 31 December 2016, we compared the climate and weather changes of Shantou, Guangzhou (representing Jiuwangmiao), Gaoqiao, and Sanya within 1 year (“Weather Spark, 2018.). While there were no regional differences in the average daily short-wave solar energy, differences were observed for water temperature. Except for the July–September period, the monthly average water temperature in Sanya was higher than in the other three geographical locations (Supplementary Figures S1), especially from January to February in the cold season, suggesting that the water temperature difference caused by different latitudes may be an important factor by which environmental selection for O. curvinotus occurs.
Selected genes of SY-medaka
39 selected genes of SY-medaka participate in multiple biological processes, which may indicate the potential processes through which O. curvinotus have adapted to the new environment of Sanya. Among them, the circadian rhythm pathway may provide possible clues for environmental stress factors. In mammals, heat stress can regulate circadian rhythm through a series of physiological reactions (Hertzberg, 2015), to make the body adapt to this thermal environment. In addition, UV stress research has found that clock genes can regulate the circadian clock to mediate sequential and hierarchical interactions between the heat shock response and tumor inhibition mechanisms, thereby protecting cells from UV stress (Kawamura et al., 2018). Of course, further experiments are needed to verify whether the O. curvinotus also responds to environmental changes through these mechanisms. Other genes may also be related to some potential mechanisms. For example, we found that many genes are closely related to cell growth and death. The expression of stk3, ing3, trit1, and laptm4b may inhibit cell growth and induce apoptosis (Golovko et al., 2000; Nagashima et al., 2003; Yarham et al., 2014; Blom et al., 2015; Wang et al., 2020), and cep192 and bub1b may play an important role in mitosis (Chan et al., 1999; Zhu et al., 2008; Joukov et al., 2014). Further research is required to better understand their roles and possible mechanisms.
Although many genes lack annotation information and related pathway research, we believe that positive selection of these genes is very important for the adaptation of SY-medaka to the new environment. Furthermore, these genes provide us with an important research basis and research direction. We also note that the genome mapping rate of SY-medaka is about 1% lower than that of other populations, suggesting that more genes are selected against and not found in SY-medaka. It is difficult to identify these genes through the GQ-medaka genome. Therefore, we have started an SY-medaka genome project at the time of writing this paper, which is expected to further explore the environmental adaptation process of SY-medaka.
Conclusion
In this study, we performed WGS on 56 O. curvinotus individuals from four geographic locations, identified 32,826,105 SNPs. The population genetic structure analysis showed that the O. curvinotus can be divided into three subgroups. Among them, ST-medaka and JWM-medaka were the most closely related, while the SY-medaka was the most divergent from the other populations. The results of the population history of the O. curvinotus suggest that the SY-medaka has been in a bottleneck period recently and a variety of evidence shows that them were subjected to continuous strong selection pressure. By selective screening, we also identified some potential gene regions that were subject to significant positive selection in the SY-medaka. Candidate genes located in these regions may play important roles in biological processes such as circadian rhythm and cell cycle regulation, which may suggest potential adaptive processes that occurred in the new Sanya environment. Our study provides a genetic basis for the study of environmental adaptation of medaka.
Data availability statement
The resequencing raw data of all samples in this study have been uploaded to the NCBI Sequence Reading Archive (SRA) with storage number of PRJNA792300. Genome sequences have been submitted to GenBank (PRJNA821560). SNPs data for all samples have been submitted to Dryad, https://doi.org/10.5061/dryad.r2280gbf7. The complete mitochondrial sequence was submitted in fasta format in the Supplementary Material.
Ethics statement
The animal study was reviewed and approved by the Approval of Animal Use Protocol, Institutional Animal Care and Use Committees, Fisheries college of Guangdong Ocean University.
Author contributions
ZY: Conceptualization, Data curation, Supervision, Funding acquisition, Software, Methodology, Writing—original draft and Writing—editing. SL and CW: Data curation, Methodology, Resources, Software, and Visualization. CH, HZ, and LJ: Data curation, Formal analysis, Investigation, Resources, Software and Supervision. JH: Data curation, Formal analysis, Investigation. YG and ZD: Conceptualization, Formal analysis; Funding acquisition; Project administration, Resources, Supervision, Validation and Writing—original draft. ZW: Conceptualization, Data curation, Formal analysis, Methodology, Project administration, Software, Supervision and Writing—original draft.
Funding
This project was supported by Guangdong-Guangxi Joint Fund (No. 2020A1515410009) from Ministry of Science and Technology of China, the Natural Science Foundation of China (No. 31972794), National Natural Science Foundation of China Youth Fund (No. 41806195), the National Natural Science Foundation of Guangdong (No. 2022A1515011441).
Acknowledgments
We are grateful to Jin Gao and Benben Miao for their helpful input regarding data analysis.
Conflict of interest
The authors declare that the research was conducted in the absence of any commercial or financial relationships that could be construed as a potential conflict of interest.
Publisher’s note
All claims expressed in this article are solely those of the authors and do not necessarily represent those of their affiliated organizations, or those of the publisher, the editors and the reviewers. Any product that may be evaluated in this article, or claim that may be made by its manufacturer, is not guaranteed or endorsed by the publisher.
Supplementary material
The Supplementary Material for this article can be found online at: https://www.frontiersin.org/articles/10.3389/fgene.2022.946006/full#supplementary-material
References
Araki, K., Aokic, J., Kawase, J., Hamada, K., Ozaki, A., Fujimoto, H., et al. (2018). Whole genome sequencing of greater amberjack ( Seriola dumerili ) for SNP identification on aligned scaffolds and genome structural variation analysis using parallel resequencing. Int. J. Genomics 2018, 7984292–7984312. doi:10.1155/2018/7984292
Blom, T., Li, S., Dichlberger, A., Bäck, N., Kim, Y. A., Loizides-Mangold, U., et al. (2015). LAPTM4B facilitates late endosomal ceramide export to control cell death pathways. Nat. Chem. Biol. 11 (10), 799–806. doi:10.1038/nchembio.1889
Cádiz, M. I., López, M. E., Díaz-Domínguez, D., Cáceres, G., Yoshida, G. M., Gomez-Uchida, D., et al. (2020). Whole genome re-sequencing reveals recent signatures of selection in three strains of farmed Nile tilapia (Oreochromis niloticus). Sci. Rep. 10 (1), 11514–14. doi:10.1038/s41598-020-68064-5
Chan, G. K. T., Jablonski, S. A., Sudakin, V., Hittle, J. C., and Yen, T. J. (1999). Human BUBR1 is a mitotic checkpoint kinase that monitors CENP-E functions at kinetochores and binds the cyclosome/APC. J. Cell Biol. 146 (5), 941–954. doi:10.1083/jcb.146.5.941
Danecek, P., Auton, A., Abecasis, G., Albers, C. A., Banks, E., DePristo, M. A., et al. (2011). The variant call format and VCFtools. Bioinformatics 27 (15), 2156–2158. doi:10.1093/bioinformatics/btr330
Dong, Z., Li, X., Yao, Z., Wang, C., Guo, Y., Wang, Q., et al. (2021). Oryzias curvinotus in Sanya does not contain the male sex-determining gene dmy. Animals. 11 (5), 1327. doi:10.3390/ani11051327
Egami, N. (1954). Geographical variations in the male characters of the fish, Oryzias latipes. Annot. Zool. Jpn. 27 (1), 7–12.
Ezzeddini, R., Somi, M. H., Taghikhani, M., Moaddab, S.-Y., Masnadi Shirazi, K., Shirmohammadi, M., et al. (2021). Association of Foxp3 rs3761548 polymorphism with cytokines concentration in gastric adenocarcinoma patients. Cytokine 138, 155351. doi:10.1016/j.cyto.2020.155351
Gaither, M. R., Gkafas, G. A., de Jong, M., Sarigol, F., Neat, F., Regnier, T., et al. (2018). Genomics of habitat choice and adaptive evolution in a deep-sea fish. Nat. Ecol. Evol. 2 (4), 680–687. doi:10.1038/s41559-018-0482-x
Ganopolski, A., Calov, R., and Claussen, M. (2010). Simulation of the last glacial cycle with a coupled climate ice-sheet model of intermediate complexity. Clim. Past. 6 (2), 229–244. doi:10.5194/cp-6-229-2010
Golovko, A., Hjälm, G., Sitbon, F., and Nicander, B. (2000)., 258. Netherlands, 85–93. doi:10.1016/s0378-1119(00)00421-2Cloning of a human tRNA isopentenyl transferaseGene1–2
Hertzberg, M. (2015). Climate change reconsidered II — physical science. Energy & Environ. 26, 547–553. The Heartland Institute. doi:10.1260/0958-305x.26.3.547
Hirayama, M., Mukai, T., Miya, M., Murata, Y., Sekiya, Y., Yamashita, T., et al. (2010). Intraspecific variation in the mitochondrial genome among local populations of Medaka Oryzias latipes. Gene 457 (1–2), 13–24. doi:10.1016/j.gene.2010.02.012
Ji, G., Long, Y., Zhou, Y., Huang, C., Gu, A., and Wang, X. (2012). Common variants in mismatch repair genes associated with increased risk of sperm DNA damage and male infertility. BMC Med. 10 (1), 49. doi:10.1186/1741-7015-10-49
Jin, J. J., Yu, W. Bin, Yang, J. B., Song, Y., DePamphilis, C. W., Yi, T. S., et al. (2018). GetOrganelle: A fast and versatile toolkit for accurate de novo assembly of organelle genomes. BioRxiv 21 (1), 1–31.
Jones, F. C., Grabherr, M. G., Chan, Y. F., Russell, P., Mauceli, E., Johnson, J., et al. (2012). The genomic basis of adaptive evolution in threespine sticklebacks. Nature 484 (7392), 55–61. doi:10.1038/nature10944
Joukov, V., Walter, J. C., and De Nicolo, A. (2014). The Cep192-organized aurora A-Plk1 cascade is essential for centrosome cycle and bipolar spindle assembly. Mol. Cell 55 (4), 578–591. doi:10.1016/j.molcel.2014.06.016
Katsumura, T., Oda, S., Mitani, H., and Oota, H. (2019). Medaka population genome structure and demographic history described via genotyping-by-sequencing. G3 Genes 9 (1), 217–228. doi:10.1534/g3.118.200779
Kawamura, G., Hattori, M., Takamatsu, K., Tsukada, T., Ninomiya, Y., Benjamin, I., et al. (2018). Cooperative interaction among BMAL1, HSF1, and p53 protects mammalian cells from UV stress”, Communications Biology. Commun. Biol. 1 (1), 204–209. doi:10.1038/s42003-018-0209-1
Kujovich, J. L. (2011). Factor V leiden thrombophilia. Genet. Med. 13 (1), 1–16. Official Journal of the American College of Medical Genetics, United States. doi:10.1097/GIM.0b013e3181faa0f2
Kumar, S., Stecher, G., Li, M., Knyaz, C., and Tamura, K. (2018). Mega X: Molecular evolutionary genetics analysis across computing platforms. Mol. Biol. Evol. 35, 1547–1549. doi:10.1093/molbev/msy096
Li, H. (2013). Aligning sequence reads, clone sequences and assembly contigs with BWA-MEM. Cambridge: ArXiv Preprint ArXiv:1303.3997.
Li, H., and Durbin, R. (2011). Inference of human population history from individual whole-genome sequences. Nature 475 (7357), 493–496. doi:10.1038/nature10231
Matsuda, M., Sato, T., Toyazaki, Y., Nagahama, Y., Hamaguchi, S., and Sakaizumi, M. (2003). Oryzias curvinotus has DMY, a gene that is required for male development in the medaka, O. latipes. Zool. Sci. 20 (2), 159–161. doi:10.2108/zsj.20.159
McKenna, A., Hanna, M., Banks, E., Sivachenko, A., Cibulskis, K., Kernytsky, A., et al. (2010). The genome analysis toolkit: A MapReduce framework for analyzing next-generation DNA sequencing data. Genome Res. 20 (9), 1297–1303. doi:10.1101/gr.107524.110
Mokodongan, D. F., and Yamahira, K. (2015). Origin and intra-island diversification of Sulawesi endemic Adrianichthyidae. Mol. Phylogenet. Evol. 93, 150–160. doi:10.1016/j.ympev.2015.07.024
Nagashima, M., Shiseki, M., Pedeux, R. M., Okamura, S., Kitahama-Shiseki, M., Miura, K., et al. (2003). A novel PHD-finger motif protein, p47ING3, modulates p53-mediated transcription, cell cycle control, and apoptosis. Oncogene 22 (3), 343–350. doi:10.1038/sj.onc.1206115
Narum, S. R., Di Genova, A., Micheletti, S. J., and Maass, A. (2018). Genomic variation underlying complex life-history traits revealed by genome sequencing in Chinook salmon. Proc. Biol. Sci. 285 (1883), 20180935. doi:10.1098/rspb.2018.0935
Naruse, K., Tanaka, M., and Takeda, H. (2011). in Medaka: A model for organogenesis, human disease, and evolution. Editors N. Kiyoshi, T. Minoru, and T. Hiroyuki. 1st ed. (Tokyo: Springer Science & Business Media). available at. doi:10.1007/978-4-431-92691-7
Onainor, E. R. (2019). Neutral and adaptive drivers of genomic change in introduced brook trout (Salvelinus fontinalis) populations revealed by pooled whole-genome re-sequencing 1, 105–112.
Parenti, L. R. (2008). A phylogenetic analysis and taxonomic revision of ricefishes, Oryzias and relatives (Beloniformes, Adrianichthyidae). Zoological J. Linn. Soc. 154 (3), 494–610. doi:10.1111/j.1096-3642.2008.00417.x
Parenti, L. (2012). The IUCN red list of threatened species 2012”, IUCN. en: RLTS.T181194A1708251. available at. doi:10.2305/IUCN.UK.2012-1
Peter, U., Clark, A. S., Dykejeremy, D., Shakunanders, E. C., Jorie, C., Barbara, W., et al. (2009). The last glacial maximum”, science. Am. Assoc. Adv. Sci. 325 (5941), 710–714.
Rabosky, D. L., Chang, J., Title, P. O., Cowman, P. F., Sallan, L., Friedman, M., et al. (2018). An inverse latitudinal gradient in speciation rate for marine fishes. Nature 559 (7714), 392–395. doi:10.1038/s41586-018-0273-1
Setiamarga, D. H. E., Miya, M., Yamanoue, Y., Azuma, Y., Inoue, J. G., Ishiguro, N. B., et al. (2009). Divergence time of the two regional medaka populations in Japan as a new time scale for comparative genomics of vertebrates. Biol. Lett. 5 (6), 812–816. doi:10.1098/rsbl.2009.0419
Spark, Weather (2018). The weather year round anywhere on earth. https://weatherspark.com (Accessed December 1, 2021).
Spivakov, M., Auer, T. O., Peravali, R., Dunham, I., Dolle, D., Fujiyama, A., et al. (2014). Genomic and phenotypic characterization of a wild medaka population: Towards the establishment of an isogenic population genetic resource in fish. G3 (Bethesda) 4 (3), 433–445. doi:10.1534/g3.113.008722
Sutra, N., Kusumi, J., Montenegro, J., Kobayashi, H., Fujimoto, S., Masengi, K. W. A., et al. (2019). Evidence for sympatric speciation in a Wallacean ancient lake”, Evolution. Evolution 73 (9), 1898–1915. doi:10.1111/evo.13821
Wang, C. (2020). Comparison of phenotypes of three geographical populations of oryzias curvinotus and preliminary investigation of its sex determining genes”. Zhangjiang: Guangdong Ocean University. master’s thesis.
Wang, K., Li, M., and Hakonarson, H. (2010). Annovar: Functional annotation of genetic variants from high-throughput sequencing data. Nucleic Acids Res. 38 (16), e164. doi:10.1093/nar/gkq603
Wang, X., Wang, F., Zhang, Z. G., Yang, X. M., and Zhang, R. (2020). STK3 suppresses ovarian cancer progression by activating NF- κ B signaling to recruit cd8+t-cells. J. Immunol. Res. 2020, 7263602. available at. doi:10.1155/2020/7263602
Yamahira, K., and Takeshi, K. (2008). Variation in juvenile growth rates among and within latitudinal populations of the medaka. Popul. Ecol. 50 (1), 3–8. doi:10.1007/s10144-007-0055-3
Yang, J., Lee, S. H., Goddard, M. E., and Visscher, P. M. (2011). Gcta: A tool for genome-wide complex trait analysis. Am. J. Hum. Genet. 88 (1), 76–82. doi:10.1016/j.ajhg.2010.11.011
Yarham, J. W., Lamichhane, T. N., Pyle, A., Mattijssen, S., Baruffini, E., Bruni, F., et al. (2014). Defective i6A37 modification of mitochondrial and cytosolic tRNAs results from pathogenic mutations in TRIT1 and its substrate tRNA. PLoS Genet. 10 (6), e1004424. doi:10.1371/journal.pgen.1004424
Zhang, C., Dong, S. S., Xu, J. Y., He, W. M., and Yang, T. L. (2019). PopLDdecay: A fast and effective tool for linkage disequilibrium decay analysis based on variant call format files. Bioinformatics 35 (10), 1786–1788. doi:10.1093/bioinformatics/bty875
Keywords: Oryzias curvinotus, population genetics, genetics structure, population history, positive selection
Citation: Yao Z, Long S, Wang C, Huang C, Zhang H, Jian L, Huang J, Guo Y, Dong Z and Wang Z (2022) Population genetic characteristics of Hainan medaka with whole-genome resequencing. Front. Genet. 13:946006. doi: 10.3389/fgene.2022.946006
Received: 17 May 2022; Accepted: 26 September 2022;
Published: 12 October 2022.
Edited by:
Rosane Garcia Collevatti, Universidade Federal de Goiás, BrazilReviewed by:
Mingyou Li, Shanghai Ocean University, ChinaKiyoshi Naruse, National Institute for Basic Biology, Japan
Shuying Li, Zhejiang University, China
Copyright © 2022 Yao, Long, Wang, Huang, Zhang, Jian, Huang, Guo, Dong and Wang. This is an open-access article distributed under the terms of the Creative Commons Attribution License (CC BY). The use, distribution or reproduction in other forums is permitted, provided the original author(s) and the copyright owner(s) are credited and that the original publication in this journal is cited, in accordance with accepted academic practice. No use, distribution or reproduction is permitted which does not comply with these terms.
*Correspondence: Zhongduo Wang, d2FuZ3pkQGdkb3UuZWR1LmNu
†ORCID: Zebin Yao, orcid.org/0000-0001-7746-0695; Zhongduo Wang, orcid.org/0000-0003-0835-4463