 Noman Qureshi
 Shaoyin Duan
- Department of Medical Imaging, Zhongshan Hospital, School of Medicine, Xiamen University, Xiamen, China
Previous studies have indicated that the airway epithelia of lung cancer-associated injury can extend to the nose and it was associated with abnormal gene expression. The aim of this study was to find the possible lung cancer-related genes from the nasal epithelium as bio-markers for lung cancer detection. WGCNA was performed to calculate the module–trait correlations of lung cancer based on the public microarray dataset, and their data were processed by statistics of RMA and t-test. Four specific modules associated with clinical features of lung cancer were constructed, including blue, brown, yellow, and light blue. Of which blue or brown module showed strong connection to genetic connectivity. From the brown module, it was found that HCK, NCF1, TLR8, EMR3, CSF2RB, and DYSF are the hub genes, and from the blue module, it was found that SPEF2, ANKFN1, HYDIN, DNAH5, C12orf55, and CCDC113 are the pivotal genes corresponding to the grade. These genes can be taken as the bio-markers to develop a noninvasive method of diagnosing early lung cancer.
Introduction
In recent 50 years, the morbidity and mortality of lung cancer have significantly increased, and the 5-year mortality rate is up to 80%. The main cause is lack of effective diagnostic tools to detect early lung cancer (Pisani et al., 1999). Although high-resolution CT (HRCT) and bronchoscopy increases the diagnostic sensitivity, the screening is not feasible because of high cost or complex operation (Gupta et al., 2009; Cannioto et al., 2018; Asaad Zebari and Emin Tenekeci, 2022). Despite low complications, bronchoscopy cannot identify the extent of cancer or the size and location of small or peripheral lung cancers (Khan et al., 2016). Previous studies have shown that some gene expression of epithelial cells in the entire bronchial airway is significantly different between normal people and smokers with lung cancer and proved that the existence of some pivotal genes in the nasal epithelium was closely related to lung cancer. These genes have been applied as biomarkers and classifiers to identify the lung cancers from benign diseases (Khan et al., 2016; Team, 2017). It was suggested that this analysis is an additional noninvasive and convenient detection approach for lung cancer.
The latest progress in gene interaction network methodology is to study the potential internal relationship between functional gene clusters and clinical features (Sun et al., 2017; Timmins and Ashlock, 2017). Identifying important modules related to clinical features is helpful to infer the tumor mechanism and establish new targets for diagnosis or therapy. Weighted gene co-expression network analysis (WGCNA) is an effective approach based on “guilt-by-association”. It is used for identifying gene modules as candidates for biomarkers. WGCNA creates in terms of large-scale gene expression reports and the identification of centrally sited genes or hub genes, which drive key cellular signaling pathways. The systematical biology method has been used to identify the hub genes in high-grade osteosarcoma and small cell lung cancer (SCLC) and to find potential therapeutic targets (Ning et al., 2016; Shakeel et al., 2020). This study was planned to make improvements in biology methods, which might increase the diagnostic efficiency of lung cancer at early stages, with low price and non-trauma.
Materials and Methods
Data Filtering
The expressional profile of GSE80796 was installed from the Gene Expression Omnibus (GEO) (http://www.ncbi.nlm.nih.gov/geo/). The data and clinical traits were reserved to analyze the difference in gene expression between the nasal epithelia of patients with less than 3 cm of early lung cancer and benign pulmonary nodule in different genders (6). Finally, there were a total of 197 samples, including 100 samples of benign pulmonary nodule (62 cases with tuberculoma, 23 with inflammatory pseudotumor, 9 with sclerosing hemangioma, and 6 with hamartoma) and 97 cases of early lung cancer (81 NSCLC and 16 SCLC).
Data Preprocessing and Identification of Genes
At first, chip data were downloaded, including the background correction, normalization preprocess, and calculation of gene expression values. Robust multi-array average (RMA) and R language (McCall et al., 2010) were applied in the affy package, and the ComBat method was used in adjustment for batch effects. Subsequently, differentially expressed genes (DEGs) of nasal epithelia between early lung cancer and benign pulmonary nodule were identified using t-test in the linear models for microarray data, and the top 3,600 DEGs in the order of |logFC| were chosen for the construction of WGCNA (Langfelder and Horvath, 2008).
Construction of a Clustering Tree for WGCNA
The WGCNA package in R language was used to construct the gene co-expression network analysis of nasal epithelia gene expression for both male and female and then continually to compare and screen the consensus modules of nasal epithelia gene expression in different genders.
Brief Process
The process contained the following steps: 1) created a correlation matrix of the pairs of genes from all samples. 2) Chose the proper soft threshold. 3) With the proper power value, performed the automatic network construction and module detection with the major parameters: max BlockSize of 5,000, min ModuleSize of 40, deep Split of 4, and merge CutHeight of 0.25. 4) Built a hierarchical clustering dendrogram of gene expression data for each dataset and identified the shared functional modules.
Calculation of the Correlation and Hub Gene Identification
In order to determine the correlation between gene expression modules and clinical traits, the age and smoking history (smoking time, pack/years) of patients with lung cancer were chosen and analyzed. As for the hub genes, Cytoscape software was used for constructing the scale-free WGCNA for selected modules (Shannon et al., 2003). The cytoHubba package from Cytoscape was performed to extract the top 20 hub genes selected by 12 different algorithms, and mutual hub genes were then chosen by comparison of the top 20 hub genes. In order to select gene modules, the pathway functional enrichment analyses, including the Gene Ontology (GO) and Kyoto Encyclopedia of Genes and Genomes (KEGG), were performed by the Database for Annotation, Visualization and Integrated Discovery (DAVID). These gene functions were analyzed at the molecular level.
Results
Screening of DEGs
Top 3,600 DEGs in the order of |logFC| were identified in the samples of early lung cancer by comparing with those of benign pulmonary nodule; there were 1,745 upregulated genes, and 1,855 downregulated genes.
Construction of Co-Expression Module of Lung Cancer
Cluster analysis of DEGs is clearly shown in Figure 1A. Those samples were cut whose expression level was higher than 50 (Figure 1B). The soft threshold is the most important parameter. First, the soft threshold was selected (Figure 2A). When the power value was equal to 9, the degree of independence was up to 0.9, and the average connectivity was high. Five different gene co-expression modules were identified and displayed in different colors (Figure 2B). The gray module contained all the modules that could not be allocated to other modules, and the interaction of the co-expression modules showed that the thermograph depicted the topological overlap matrix of all genes. By constructing the TOM, these genes in the blue module had the highest correlation (Figures 3A,B).
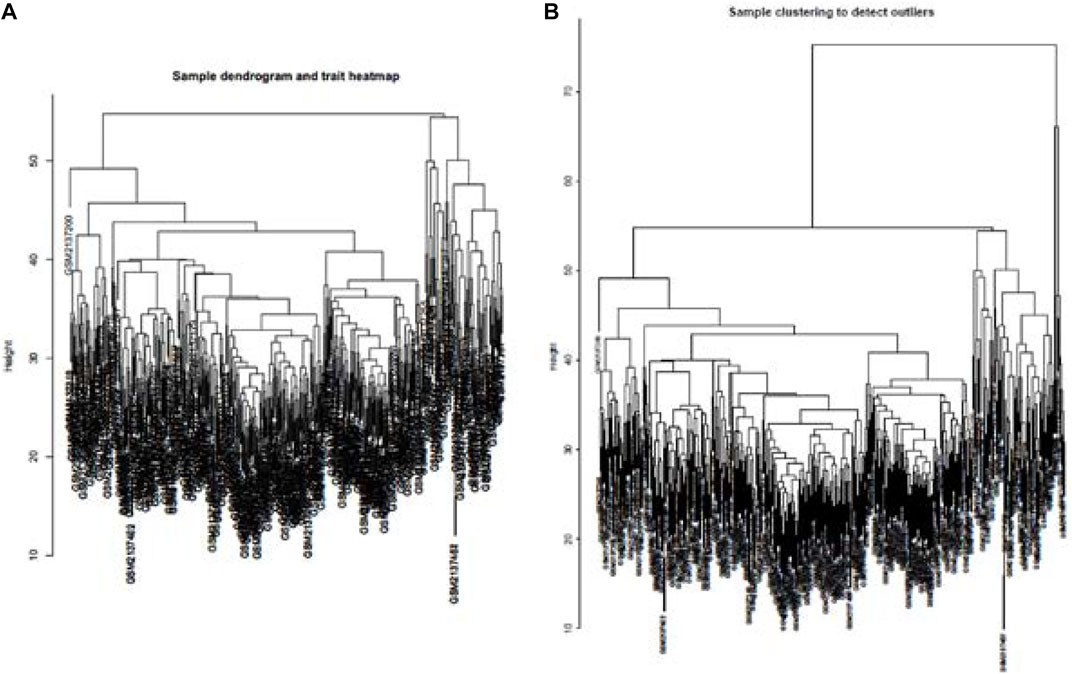
FIGURE 1. lustering all the samples in the input sets (A). Height of data >55 cannot be well clustered with other data. Therefore, as outliers, data with height >55 were removed. Dendrogram of residual samples was constructed as shown (B).
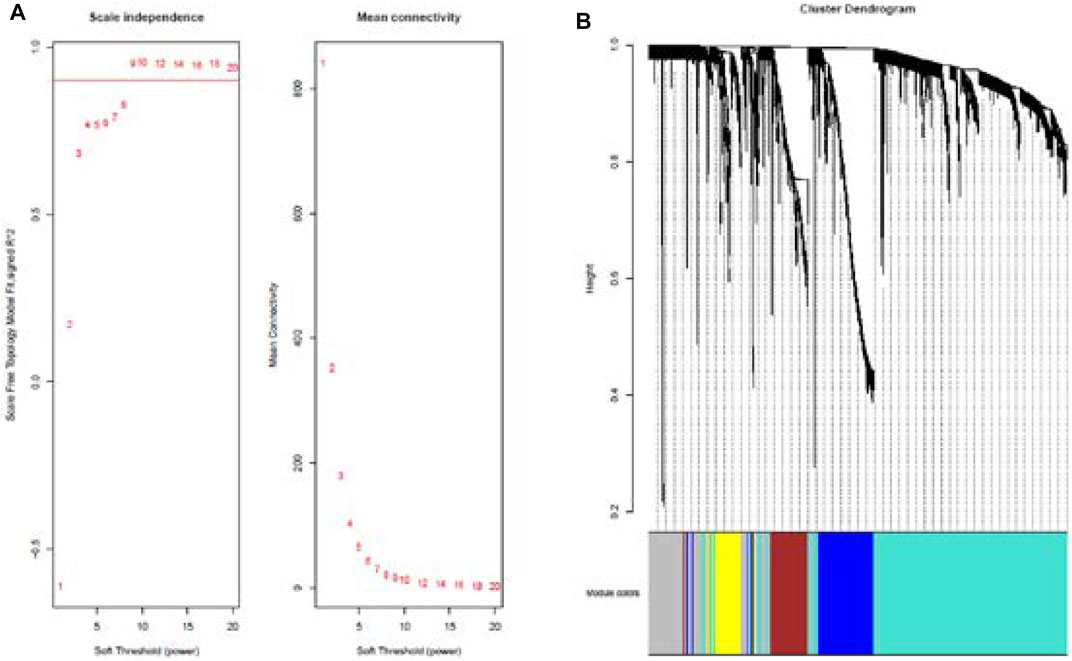
FIGURE 2. Analysis of network topology for various soft-thresholding powers (A). Summary network indices (y-axes) as functions of the soft-thresholding power (x-axes). Numbers in the plots indicate the corresponding soft-thresholding powers. The plots indicate that approximate scale-free topology is attained around the soft-thresholding power of 9 for the sets. Because the summary connectivity measures decline steeply with increasing soft-thresholding power, it is advantageous to choose the lowest power that satisfies the approximate scale-free topology criterion. Cluster dendrogram and co-expression network modules for differentially expressed genes in the nasal epithelium of lung cancer and benign pulmonary nodule (B). Gene dendrogram obtained by clustering the dissimilarity based on consensus topological overlap with the corresponding module colors indicated by the color row.
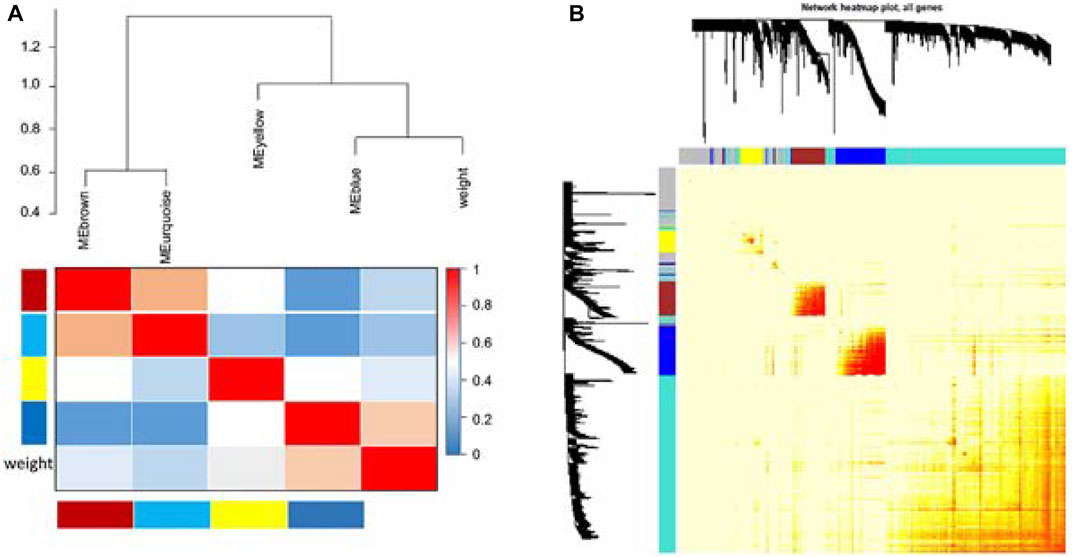
FIGURE 3. Comparisons between four modules. Genes in the blue module have the highest correlation (A). Average linkage hierarchical clustering with the topological overlap dissimilarity measure was used to identify gene co-expression modules. The gene network was visualized using a heatmap plot. Light color represents low overlap, while the progressively darker red color represents higher overlap. Blocks of darker colors along the diagonal are the modules. Gene dendrogram and module assignment are also shown along the left side and at the top (B).
Analysis of WGCNA Network
Consensus relationships of consensus module eigengenes and clinical traits were presented as weak mutual correlations (p > 0.05), while the consensus module eigengenes and clinical traits showed significant correlations (p < 0.05) in the male and female data, respectively, which verified the conclusion of heterogeneity related with gender. There were scatter plots of GS and MM of blue and brown module genes, which had the highest correlation in the blue module (Figure 4A). The module feature relationship is displayed in Figure 4B. Their clinical features included age, smoking years, tumor size, and lung cancer status. Cluster analysis showed that the blue module was significantly correlated with the clinical characteristics of lung cancer.
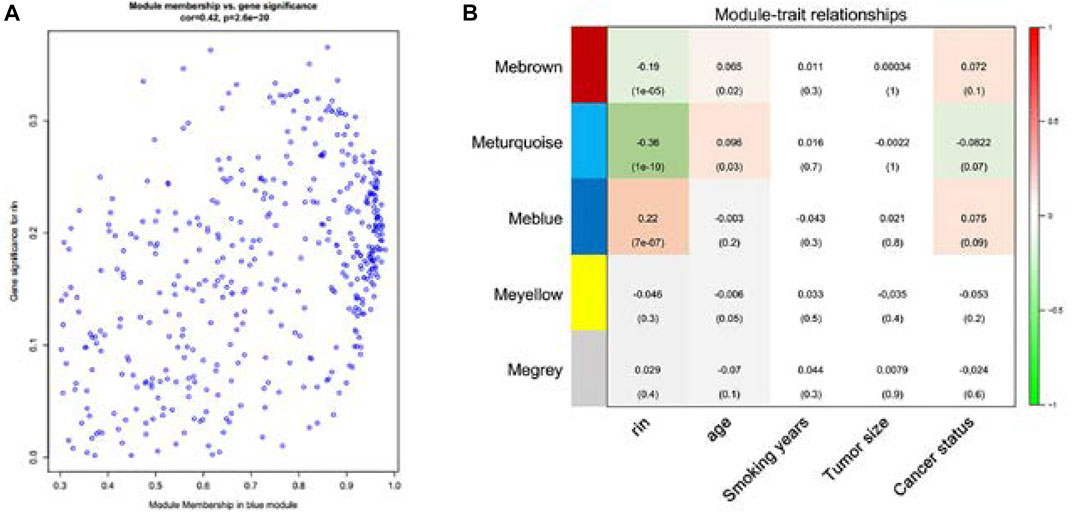
FIGURE 4. Scatterplot of gene significance (GS) for lung cancer status vs. module membership (MM) in the blue module (A). There is a highly significant correlation between GS and MM in the blue module. Correlation of gene co-expression modules with clinical traits in the training cohort (n = 196). Blue module is strongly correlated with early lung cancer, so the blue module was chosen to be further analyzed (B).
Gene Co-Expression and Hub Genes
In these genes, four specific modules of lung cancer were constructed as blue, brown, yellow, and light blue modules, and the blue and brown modules were strongly linked to genetic connectivity. Twelve algorithms of the cytoHubba package were used to calculate the hub genes and their connectivity in Cytoscape software. In the brown module, the hub genes identified were TLR8, HCK, NCF1, EMR3, CSF2RB, and DYSF; in the blue module, the pivotal genes identified were HYDIN, SPEF2, ANKFN1, DNAH5, C12orf55, and CCDC113 (Tables 1, 2). In every network, the color depth is directly proportional to its connectivity. Four specific modules associated with clinical features of lung cancer were constructed, including blue, brown, yellow, and light blue, of which blue or brown module showed strong connection to genetic connectivity (Figures 5A,B). TLR8, HCK, NCF1, EMR3, CSF2RB, and DYSF were the hub genes identified from the brown module, and HYDIN, SPEF2, ANKFN1, DNAH5, C12orf55, and CCDC113 were the pivotal genes identified from the blue module.
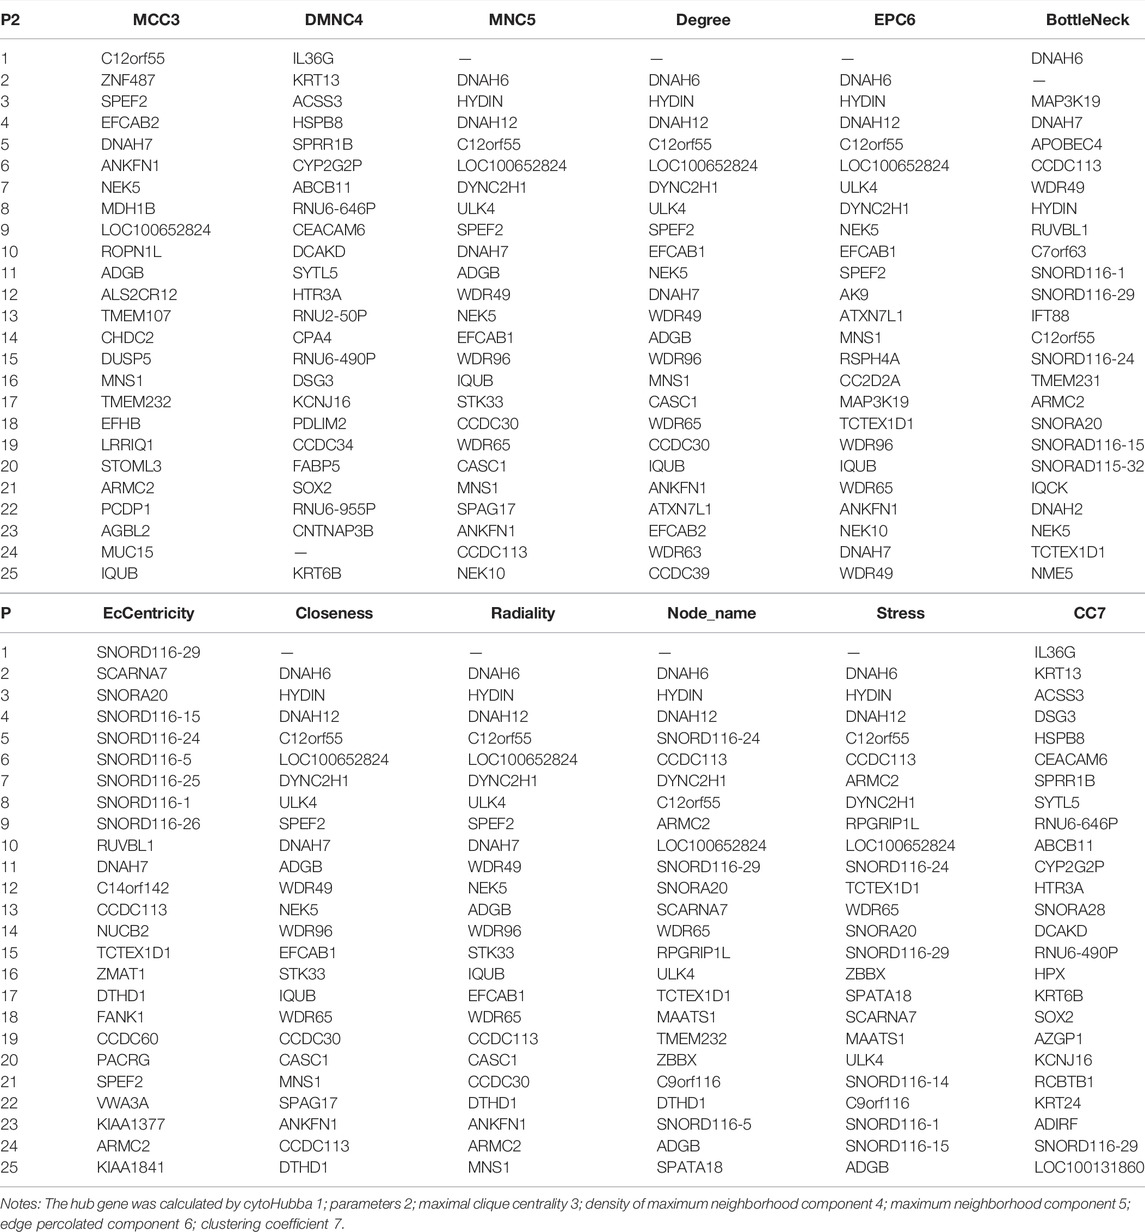
TABLE 1. Top 25 hub genes of the blue module through dataset 1.
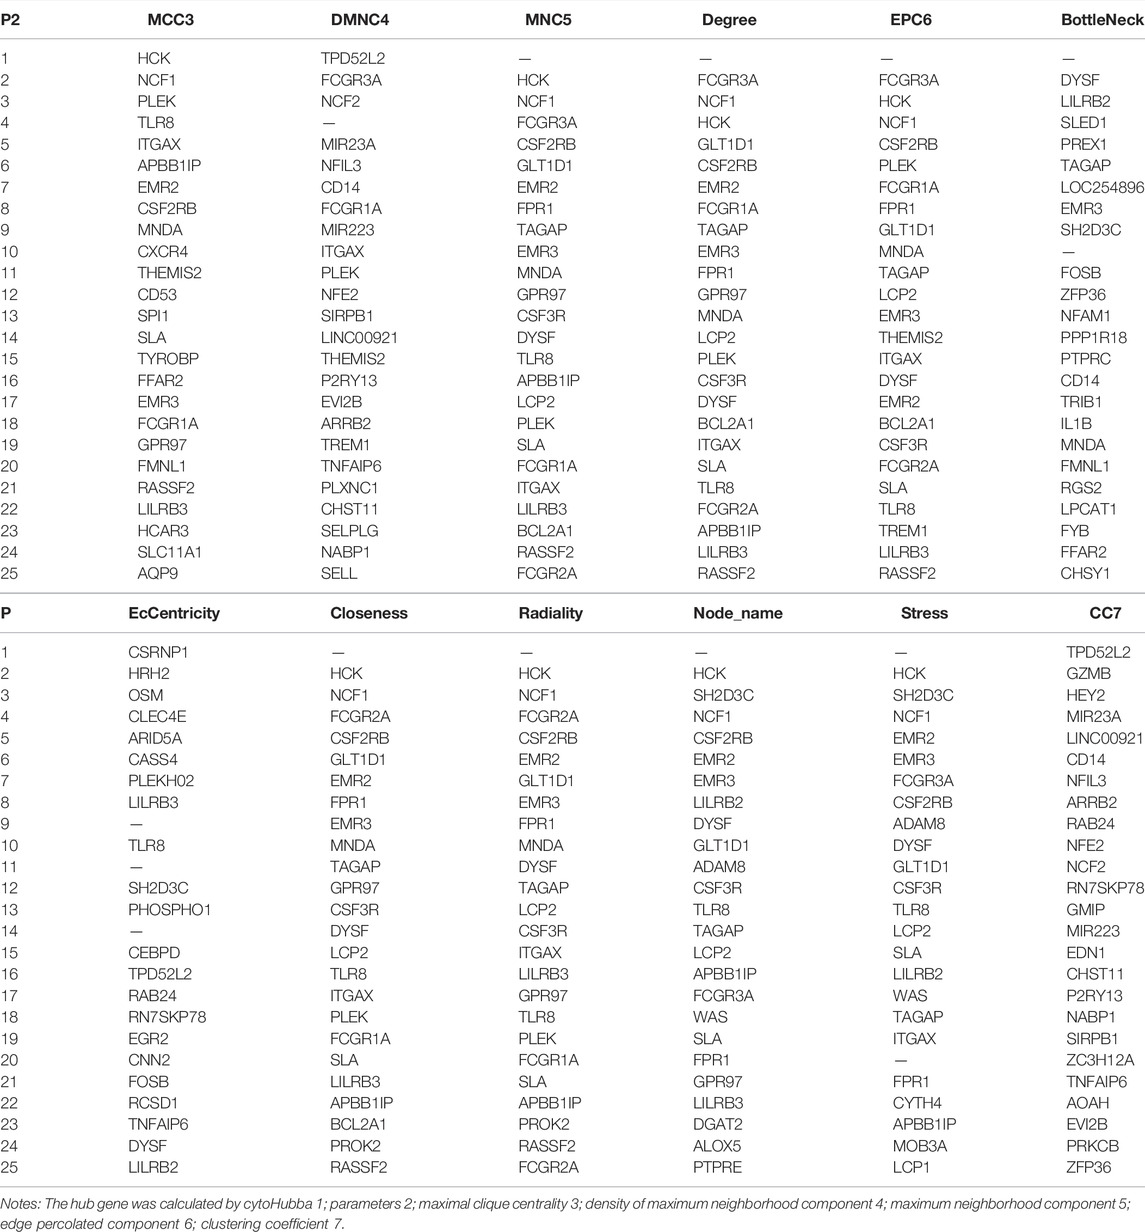
TABLE 2. Top 25 hub genes of the brown module through dataset 1.
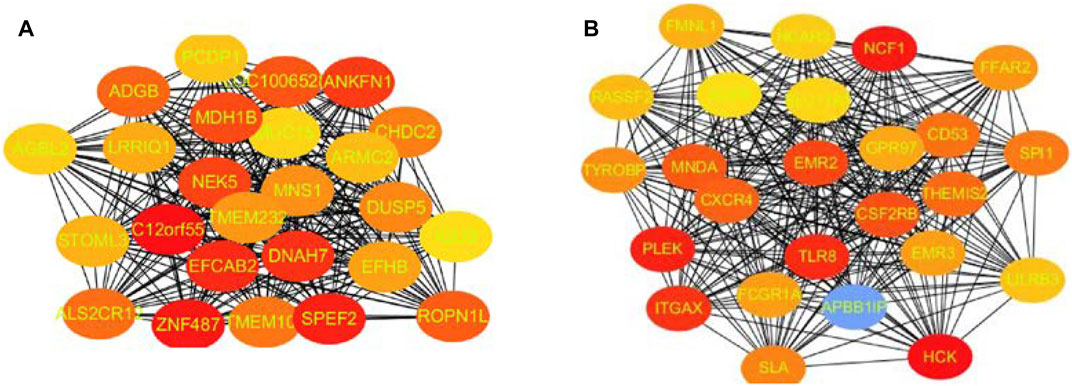
FIGURE 5. Top 25 hub genes calculated by MCC algorithms have strong correlations with early lung cancer. Progressively darker red color represents higher relationship in the blue module. C12orf55, ZNF487, EFCAB2, and ANKFN1 are the most closely related hub genes (A). The hub genes were identified by MCC in the brown module. NCF1, PLEK, TLR8, and HCK are the most closely related hub genes in the brown module (B).
Discussion
Main Goal for This Study
The aim of this study was to find the candidate genes by WGCNA. It could provide insights into the biology of early lung cancer and find the diagnostic biomarker by detecting the gene expression of nasal epithelia, which could make up for the shortage in postoperative pathological diagnosis and guide the clinical therapy. WGCNA has been used to not only construct gene networks and detect modules but also identify hub genes and select significant genes as biomarkers based on gene correlations. Module detection in WGCNA is used as a knowledge-independent process. However, empirical judgment and functional annotation would be more accurate, followed by the selection of a threshold for culling the network (Letovsky, 1987; Liu et al., 2015). WGCNA is considered a better prediction for hub genes when it comes to the biological process than the regression statical methods. Therefore, the construction of mutants will also help to detect the hub genes for prediction of lung cancer and to understand the role of specific genes in pathogenesis, which was overlooked in early lung cancer (Subudhi et al., 2015).
Technology and Method of WGCNA
WGCNA was applied to investigate 3,600 genes downloaded from a dataset at NCBI. First, the data were performed to obtain the gene expression consensus modules of nasal epithelia, module eigengenes, clinical traits, and their relationships. Second, we constructed the status-specific modules of lung cancer. Third, we identified the hub genes in brown and blue modules through cytoHubba in Cytoscape and detected the related genes in 12 algorithms. Lastly, we performed the gene enrichment analysis on GO and pathway terms.
New Results
WGCNA was used to investigate 3,600 genes downloaded from a dataset at NCBI. We obtained evidence about the changes of the hub gene expression in the feature gene module. The expressions of EMR3, NCF1, CSF2RB, DYSF, TLR8, and HCK in the lung cancer group were significantly different from those of the control group. The most significant difference in gene expression is EMR3, followed by NCF1, CSF2RB, DYSF, TLR8, and HCK.
About EMR3
EMR3 is one of the members of the epidermal growth factor 7 transmembrane protein family (EGF-TM7), which includes CD97, EMR1, EMR2, and EMR4 and is expressed in the immune system cells. Until now, its functions are unclear yet, as well as the ligand and downstream signal (Stacey et al., 2001). Some research studies found that EMR3 is mainly expressed in mature granulocytes, and other members from the EGF-TM7 family may mediate the cell migration and leukocyte migration (Matmati et al., 2007; Yona et al., 2008a; Yona et al., 2008b). Ari and Kane found that EMR3 is expressed in glioblastoma cells and can mediate cell migration and invasion. It has the highest level of neutrophils, monocytes, and macrophages in the peripheral blood of Crohn’s patients (Kane et al., 2010).
About NCF1
NCF1 is a major component of the nicotinamide adenine dinucleotide oxidase system; it can regulate the production of reactive oxygen species (ROS). NCF1 deficiency will lead to the reduction of ROS, which is associated with immune disorders (Bastos et al., 1995). NCF1-knock-out mice have increased leukocyte infiltration and morphological changes in the colonic mucosa, indicating that the absence of the NCF1 gene could aggravate colitis (El Naschie, 2004). In contrast, the upregulation of NCF1 gene expression might cause diminished or deficient ROS production that is detrimental to human health.
About CSF2RB and Others
CSF2RB is the common beta chain of the high-affinity receptor complexes for ligands of IL-3, IL-5E, and CSF. Research studies found that mutation of CSF2RA or CSF2RB can cause hereditary pulmonary alveolar proteinosis (PAP) (Takaki et al., 2016), and CSF2RB is a risk factor for schizophrenia and depression in the Han population of Chinese and a potential oncogene that can be targeted by several miRNAs for undergoing cell apoptosis (Chen et al., 2011). The DYSF gene is a 220-kD protein, which plays a major role in the regulation of plasma membrane repair. Fusion of DYSF with the ALK gene has been found to be associated with advanced lung cancer. As a single-stranded RNA sensor, the activation of TLR8 can also promote the survival and chemoresistance of lung cancer cells. The HCK gene belongs to the Src family of tyrosine kinase, which is mainly involved in the regulation of polymorphonuclear leukocytes. A recent study showed that in the Bai nationality of China, the polymorphism of the introns of the HCK gene is associated with lung function and airway abnormality (Espinoza-Fonseca, 2016).
Experimental Verification
Studies have proved that the existence of injury in the bronchial airway results in gene expression alterations in patients with lung cancer, and the airway epithelial injury associated with lung cancer extends to the nasal epithelium (Shannon et al., 2003). In the previous study, the downregulated genes CASP10 and CD177 and the upregulated genes BAK1, ST14, CD82, and MUC4 were detected as biomarkers for lung cancer by the joint sparse regression model (Loxham and Davies, 2017). Our study has detected some hub genes from gene expression of the nasal epithelium of early lung cancer by WGCNA. The most significant difference in gene expression was shown by EMR3, followed by NCF1, CSF2RB, DYSF, and so on. The results of qRT-PCR are in accordance with those of microarray analysis (Qureshi, 2018).
Clinical Application
This study may provide an additional proof for detecting early lung cancer by observing gene expression of the nasal epithelium, which indicates a great potential for clinical application (Lobato and O'Sullivan, 2018). The biomarker of nasal epithelium would be used as a reference for patients with small nodules at low risk of malignancy, which can be managed by CT screening (Petty, 2001; Cottin and Cordier, 2016). However, this study still has some limitations. It lacks further studies on the relationship between gene expression and pathological typing of lung cancer (Tang et al., 2018), so large-scale samples must be collected to have a better analysis in the future.
Data Availability Statement
The original contributions presented in the study are included in the article/Supplementary Materials; further inquiries can be directed to the corresponding author.
Author Contributions
All authors listed have made a substantial, direct, and intellectual contribution to the work and approved it for publication.
Conflict of Interest
The authors declare that the research was conducted in the absence of any commercial or financial relationships that could be construed as a potential conflict of interest.
Publisher’s Note
All claims expressed in this article are solely those of the authors and do not necessarily represent those of their affiliated organizations, or those of the publisher, the editors, and the reviewers. Any product that may be evaluated in this article, or claim that may be made by its manufacturer, is not guaranteed or endorsed by the publisher.
Acknowledgments
We sincerely thank for the support of personal research fund from Zhongshan Hospital of Xiamen University and the technical support from Xiamen JiKe Biotechnology Company Limited.
Abbreviations
DEGs, differentially expressed genes; GEO, Gene Expression Omnibus; GO, Gene Ontology; GS, gene significance; HRCT, high-resolution CT; KEGG, Kyoto Encyclopedia of Genes and Genomes; MM, module membership; MCC, modified Cam Clay; RMA, robust multi-array average; SYK, spleen tyrosine kinase; SCLC, small cell lung cancer; WGCNA, weighted gene co-expression network analysis.
References
Asaad Zebari, N., and Emin Tenekeci, M. (2022). Support System Based Computer-Aided Detection for Skin Cancer: A Review. Fusion Pract. Appl. 7 (1), 30–40. doi:10.54216/FPA.070103
Bastos, J., Steyaert, M., Roovers, R., Kinget, P., Sansen, W., Graindourze, B., et al. (1995). Mismatch Characterization of Small Size MOS Transistors. Proc. ICMTS 8, 271–276.
Cannioto, R., Etter, J. L., LaMonte, M. J., Ray, A. D., Joseph, J. M., Qassim, E. A., et al. (2018). Lifetime Physical Inactivity is Associated with Lung Cancer Risk and Mortality. Cancer Treat. Res. Commun. 14, 37–45. doi:10.1016/j.ctarc.2018.01.001
Chen, P., Huang, K., Zhou, G., Zeng, Z., Wang, T., Li, B., et al. (2011). Common SNPs in CSF2RB are Associated with Major Depression and Schizophrenia in the Chinese Han Population. World J. Biol. Psychiatry 12, 233–238. doi:10.3109/15622975.2010.544328
Cottin, V., and Cordier, J-F. (2016). Eosinophilic Lungs Disease. Murray and Nadel’s Textbook of Respiratory Medicine. 6th Edition. Philadelphia: Elsevier Saunders.
El Naschie, M. S. (2004). Small World Network, Topology and the Mass Spectrum of High Energy Particles Physics. Chaos Solit. Fractals 19, 689–697. doi:10.1016/s0960-0779(03)00337-0
Espinoza-Fonseca, L. M. (2016). Pathogenic Mutation R959W Alters Recognition Dynamics of Dysferlin Inner DysF Domain. Mol. BioSyst. 12, 973–981. doi:10.1039/c5mb00772k
Gupta, S., Siddiqui, S., Haldar, P., Raj, J. V., Entwisle, J. J., Wardlaw, A. J., et al. (2009). Qualitative Analysis of High-Resolution CT Scans in Severe Asthma. Chest 136, 1521–1528. doi:10.1378/chest.09-0174
Kane, A. J., Sughrue, M. E., Rutkowski, M. J., Phillips, J. J., and Parsa, A. T. (2010). EMR-3: A Potential Mediator of Invasive Phenotypic Variation in Glioblastoma and Novel Therapeutic Target. Neuroreport 21, 1018–1022. doi:10.1097/wnr.0b013e32833f19f2
Khan, K. A., Nardelli, P., Jaeger, A., O’Shea, C., Cantillon-Murphy, P., and Kennedy, M. P. (2016). Navigational Bronchoscopy for Early Lung Cancer: A Road to Therapy. Adv. Ther. 33, 580–596. doi:10.1007/s12325-016-0319-4
Langfelder, P., and Horvath, S. (2008). WGCNA: An R Package for Weighted Correlation Network Analysis. BMC Bioinforma. 9, 559. doi:10.1186/1471-2105-9-559
Letovsky, S. (1987). Cognitive Processes in Program Comprehension. J. Syst. Softw. 7, 325–339. doi:10.1016/0164-1212(87)90032-x
Liu, R., Cheng, Y., Yu, J., Lv, Q.-L., and Zhou, H.-H. (2015). Identification and Validation of Gene Module Associated with Lung Cancer through Coexpression Network Analysis. Gene 563, 56–62. doi:10.1016/j.gene.2015.03.008
Lobato, I. M., and O'Sullivan, C. K. (2018). Recombinase Polymerase Amplification: Basics, Applications and Recent Advances. TrAC Trends Anal. Chem. 98, 19–35. doi:10.1016/j.trac.2017.10.015
Loxham, M., and Davies, D. E. (2017). Phenotypic and Genetic Aspects of Epithelial Barrier Function in Asthmatic Patients. J. Allergy Clin. Immunol. 139, 1736–1751. doi:10.1016/j.jaci.2017.04.005
Matmati, M., Pouwels, W., van Bruggen, R., Jansen, M., Hoek, R. M., Verhoeven, A. J., et al. (2007). The Human EGF-TM7 Receptor EMR3 is a Marker for Mature Granulocytes. J. Leukoc. Biol. 81, 440–448. doi:10.1189/jlb.0406276
McCall, M. N., Bolstad, B. M., and Irizarry, R. A. (2010). Frozen Robust Multiarray Analysis (fRMA). Biostatistics 11, 242–253. doi:10.1093/biostatistics/kxp059
Ning, B., Xu, D. L., Gao, J. H., Wang, L. L., Yan, S. Y., and Cheng, S. (2016). Identification of Pathway-Related Modules in High-Grade Osteosarcoma Based on Topological Centrality of Network Strategy. Eur. Rev. Med. Pharmacol. Sci. 20, 2209–2220.
Petty, T. L. (2001). The Early Diagnosis of Lung Cancer. Dis. Mon. 47, 204–264. doi:10.1067/mcd.2001.116285
Pisani, P., Parkin, D. M., Bray, F., and Ferlay, J. (1999). Estimates of the Worldwide Mortality from 25 Cancers in 1990. Int. J. Cancer 83, 18–29. doi:10.1002/(sici)1097-0215(19990924)83:1<18::aid-ijc5>3.0.co;2-m
Qureshi, N. (2018). Identification of Significantly Different Modules between Gene Expression in Nasal Epithelial Cell and Lung Cancer by WGCNA Study and Experimental Verification (D). Xiamen CHINA: Xiamen University.
Shakeel, P. M., Tolba, A., Al-Makhadmeh, Z., and Jaber, M. M. (2020). Automatic Detection of Lung Cancer from Biomedical Data Set Using Discrete AdaBoost Optimized Ensemble Learning Generalized Neural Networks. Neural Comput. Applic. 32, 777–790. doi:10.1007/s00521-018-03972-2
Shannon, P., Markiel, A., Ozier, O., Baliga, N. S., Wang, J. T., Ramage, D., et al. (2003). Cytoscape: A Software Environment for Integrated Models of Biomolecular Interaction Networks. Genome Res. 13, 2498–2504. doi:10.1101/gr.1239303
Stacey, M., Lin, H.-H., Hilyard, K. L., Gordon, S., and McKnight, A. J. (2001). Human Epidermal Growth Factor (EGF) Module-Containing Mucin-Like Hormone Receptor 3 is a New Member of the EGF-TM7 Family that Recognizes a Ligand on Human Macrophages and Activated Neutrophils. J. Biol. Chem. 276, 18863–18870. doi:10.1074/jbc.m101147200
Subudhi, A. K., Boopathi, P. A., Pandey, I., Kaur, R., Middha, S., Acharya, J., et al. (2015). Disease Specific Modules and Hub Genes for Intervention Strategies: A Co-Expression Network Based Approach for Plasmodium Falciparum Clinical Isolates. Infect. Genet. Evol. 35, 96–108. doi:10.1016/j.meegid.2015.08.007
Sun, Q., Zhao, H., Zhang, C., Hu, T., Wu, J., Lin, X., et al. (2017). Gene Co-Expression Network Reveals Shared Modules Predictive of Stage and Grade in Serous Ovarian Cancers. Oncotarget 8, 42983–42996. doi:10.18632/oncotarget.17785
Takaki, M., Tanaka, T., Komohara, Y., Tsuchihashi, Y., Mori, D., Hayashi, K., et al. (2016). Recurrence of Pulmonary Alveolar Proteinosis after Bilateral Lung Transplantation in a Patient with a Nonsense Mutation in CSF2RB. Respir. Med. Case Rep. 19, 89–93. doi:10.1016/j.rmcr.2016.06.011
Tang, Q., Zhang, H., Kong, M., Mao, X., and Cao, X. (2018). Hub Genes and Key Pathways of Non-Small Lung Cancer Identified Using Bioinformatics. Oncol. Lett. 16, 2344–2354. doi:10.3892/ol.2018.8882
Team, A. S. (2017). Shared Gene Expression Alterations in Nasal and Bronchial Epithelium for Lung Cancer Detection. J. Natl. Cancer Inst. 109, djw327. doi:10.1093/jnci/djw327
Timmins, M., and Ashlock, D. (2017). Network Induction for Epidemic Profiles with a Novel Representation. Biosystems 162, 205–214. doi:10.1016/j.biosystems.2017.10.013
Yona, S., Lin, H.-H., Siu, W. O., Gordon, S., and Stacey, M. (2008). Adhesion-GPCRs: Emerging Roles for Novel Receptors. Trends Biochem. Sci. 33, 491–500. doi:10.1016/j.tibs.2008.07.005
Keywords: nasal epithelium, lung cancer, WGCNA, modules, hub gene
Citation: Qureshi N, Chi J, Qian Y, Huang Q and Duan S (2022) Looking for the Genes Related to Lung Cancer From Nasal Epithelial Cells by Network and Pathway Analysis. Front. Genet. 13:942864. doi: 10.3389/fgene.2022.942864
Received: 13 May 2022; Accepted: 13 June 2022;
Published: 18 July 2022.
Edited by:
Deepak Kumar Jain, Chongqing University of Posts and Telecommunications, ChinaReviewed by:
Dazhuang Li, Macau University of Science and Technology, Macao SAR, ChinaXiaotian Hao, Chongqing Technology and Business University, China
Xiao Su, Xijing University, China
Copyright © 2022 Qureshi, Chi, Qian, Huang and Duan. This is an open-access article distributed under the terms of the Creative Commons Attribution License (CC BY). The use, distribution or reproduction in other forums is permitted, provided the original author(s) and the copyright owner(s) are credited and that the original publication in this journal is cited, in accordance with accepted academic practice. No use, distribution or reproduction is permitted which does not comply with these terms.
*Correspondence: Shaoyin Duan, eG1kc3lAeG11LmVkdS5jbg==