 Yanran Ma
 Botao Fa
 Xin Yuan
 Yue Zhang
 Zhangsheng Yu
- 1Department of Bioinformatics and Biostatistics, School of Life Sciences and Biotechnology, Shanghai Jiao Tong University, Shanghai, China
- 2Department of Biochemistry and Molecular Biology, School of Basic Medical Sciences, Xi’an Jiaotong University, Xi’an, China
Background: The identification of the causal SNPs of complex diseases in large-scale genome-wide association analysis is beneficial to the studies of pathogenesis, prevention, diagnosis and treatment of these diseases. However, existing applicable methods for large-scale data suffer from low accuracy. Developing powerful and accurate methods for detecting SNPs associated with complex diseases is highly desired.
Results: We propose a score-based two-stage Bayesian network method to identify causal SNPs of complex diseases for case-control designs. This method combines the ideas of constraint-based methods and score-and-search methods to learn the structure of the disease-centered local Bayesian network. Simulation experiments are conducted to compare this new algorithm with several common methods that can achieve the same function. The results show that our method improves the accuracy and stability compared to several common methods. Our method based on Bayesian network theory results in lower false-positive rates when all correct loci are detected. Besides, real-world data application suggests that our algorithm has good performance when handling genome-wide association data.
Conclusion: The proposed method is designed to identify the SNPs related to complex diseases, and is more accurate than other methods which can also be adapted to large-scale genome-wide analysis studies data.
1 Introduction
Recently, the development of high throughput technology provides the possibility of genome-wide association studies (GWAS), and the investigation of associated single nucleotide polymorphisms (SNPs) is common. The original idea of GWAS is to genotype individuals from the case group and control group, respectively, compare the distributions of SNPs between these two groups and identify the SNPs associated with the disease (Barrett et al., 2014). But this method can only estimate a single locus at a time, which is not suitable for complex diseases. Different from the simple Mendelian disorder, there are always mass factors that influence complex diseases such as gene-gene interactions and gene-environment interactions. In many cases, the effects of genes are multi-locus and indeterminate. In such situations, single-locus analysis methods are likely to leave out some epistatic interactions. However, in the face of the epistatic interaction problem, dealing with all the possible combinations of SNPs can be an extremely time-consuming task. Therefore, designing robust and effective methods for multi-locus analysis is highly desired. Under the circumstances, we proposed a score-based two-stage Bayesian network (STS-BN) method for detecting causal SNPs, which is more accurate and stable compared to other existing methods.
Traditional methods for multi-locus analysis include a series of statistical approaches. A commonly used method is logistic regression, which has the advantage of model interpretability. But considering the model complexity, it's impractical to deal with the high-dimensional covariates and interactions. Moreover, with the exponential increase of possible combinations, more samples are needed to ensure the stability of the estimation of interaction effects (McKinney et al., 2006). In this situation, Park and Hastie proposed a new logistic regression method with a penalization on the size of the L2-norm of the coefficients to improve the adaptability of logistic regression methods for the SNP data (Park and Hastie, 2008). However, the time-consuming parameter estimation process is still a significant limitation (Han et al., 2010). The predictor-based design also makes this method easy to include false positives (Han and Chen, 2011). To speed up the computational process, BOOST combined the likelihood ratio test with a Boolean operation-based and multi-stage design (Wan et al., 2010). But this method can only detect the interaction between two loci, which limits its practical value. Multifactor dimensionality reduction (MDR) is also a popular method which constructs a contingency table for every possible SNPs combination (Ritchie et al., 2003). However, MDR-based methods with single-objective function might not yield favorable results due to potential model preferences and disease complexities. Therefore, a multiobjective MDR (MOMDR) method was proposed to improve detection success rates (Yang et al., 2018). Apart from these, some Bayesian methods were also developed. Early in 2004, Wacholder et al. mentioned that when analyzing a SNP, Bayesian methods could help us reduce the false positives due to the strategy of declaring statistical significance based on a p-value alone (Wacholder et al., 2004). Furthermore, Bayesian approaches can incorporate prior knowledge and quantify all information and uncertainties in the form of posterior distributions. Then considering the epistasis interaction, Zhang and Liu proposed the BEAM (Bayesian epistasis association mapping) algorithm (Zhang and Liu, 2007). This algorithm contains a Bayesian epistasis inference tool implemented via Markov chain Monte Carlo (MCMC) and the B statistic for evaluating statistical significance. The combination of two statistical tools from different schools of statistics gives users a comprehensive and complementary perspective. In addition, Bayesian methods have been further extended to more complex analyses, such as GWAS meta-analysis (Sun et al., 2022).
An alternative idea is to use machine learning methods. Chen et al. proposed four support vector machine (SVM) based algorithms to solve feature selection problems when detecting gene-gene interactions: SVM-RFA, SVM-RFE, SVM-Local, and SVM-GA (Chen et al., 2008). The first two approaches adopt the greedy search strategy. They build a set of nested feature subsets by adding or removing one gene at a time, based on the prediction accuracy at each iteration. SVM-local keeps searching the neighborhood of the current solution set to choose the best feature set. But this usually only reaches a local optimum (Chen et al., 2008). SVM-GA introduces genetic algorithms to complete the search process. In most cases, the determination of the optimal solution of machine learning methods is based on the prediction accuracy. But this cannot guarantee that the association is true (Han et al., 2010). Sometimes the addition of more loci is inclined to improve the accuracy of prediction, but leads to a higher false positive rate. Therefore, some approaches will perform statistical tests after the machine learning sections. For example, in the method proposed by Jiang et al. (2009), the B statistic is adopted to declare the statistical significance that the candidate SNPs are associated with the disease.
Utilizing network structure to estimate the relationship between variables is also a feasible idea (Han et al., 2010; Han and Chen, 2011; Yilmaz et al., 2019). Especially, Bayesian network is a common-used tool with a relatively strict theoretical basis. It is proposed by Pearl (1985). Then in the late 1980s, Pearl (1988) and Neapolitan (1990) summarized the relevant properties of Bayesian network and made it a new research field. In recent years, the application of Bayesian network has become more popular with many successful examples, such as analyzing gene expression data, predicting protein-protein interactions, and so on (Su et al., 2013; Lyu et al., 2021). Currently, several Bayesian network methods have been developed to detect epistatic interactions from GWAS data (Han et al., 2010; Han and Chen, 2011; Peng et al., 2021). For example, Han et al. adopted this concept into their algorithm, DASSO-MB, to investigate the Markov blanket of the disease in the Bayesian network and infer the associated loci (Han et al., 2010). Numerical experiments have shown that their method can reduce the rate of false positives. A similar idea was also used in the MBRFS algorithm (Li et al., 2016). Their research indicates that
Considering the difficulties in parameter estimation of the traditional methods and the high false positive rate of machine learning methods, Bayesian network methods seem more appropriate for detecting associated SNPs. But when learning the network structure, the stability of the constraint-based methods is affected by sample sizes, and the score-and-search methods are hard to use in high dimensional GWAS datasets. In this article, we proposed a Bayesian network method with a combination of constraint-based method and score-and-search method. First, we use the constraint-based method to get a smaller candidate set. After that, a score-and-search method is used to determine the final parent node set. Both computational feasibility and accuracy are taken into consideration in our algorithm. In simulation experiments, we compared our method with BEAM, BOOST, MOMDR, SVM, DASSO-MB and bNEAT. From the results, we can see both our method and bNEAT have good performance in terms of accuracy. However, bNEAT cannot handle the large volume of data in a real genome-wide association study, and our method is more robust than bNEAT when we randomly disturb the input SNPs sequence. In addition, we applied our algorithm to the real data from the Stanley Medical Research Institute Online Genomics Database (SMRIDB) and the UK Biobank, and finally found several SNPs associated with corresponding diseases.
2 Methods
2.1 Bayesian network
Bayesian network is a probabilistic graphical model and its structure is a directed acyclic graph (DAG),
Definition 1. (Faithfulness) A Bayesian network
Definition 2. (Markov blanket) The Markov blanket of variable
All the variables out of
Theorem 1. (local Markov property) A variable is conditionally independent of its nondescendant nodes given its parent nodeset. That is:
where
where
Theorem 2. Based on the assumption of faithfulness,
2.2 Structure learning methods
Another question is how to learn Bayesian network structure. Common approaches can be divided into two types: constraint-based methods and score-and-search methods. Generally, constraint-based methods utilize the dependence and independence relationships between variables to infer the network skeleton and then determine the direction of the edge using other Bayesian network properties. Score-and-search methods transform structure learning problems into model selection problems by treating Bayesian networks as probability models. They typically consist of a score function for evaluating the fitting effect and a search algorithm. The likelihood function can be used as the score function to reflect the fitness between the model and data. However, this may lead to over-fitting due to the lack of penalty term considering the model complexity. To avoid this, we think about some other common score functions.
Comparatively speaking, score-and-search methods can obtain more accurate results than constraint-based methods. Constraint-based methods are sensitive to the error of conditional independent tests, making their results unstable, especially when the sample sizes are small. However, given a score function, finding out the correct network structure is a tough problem. An inappropriate search program can easily lead to a local optimum or an NP-hard problem. Under this circumstance, it's a natural extension to combine these two types of methods in order to improve the performance of algorithms. This is not a fresh idea in the field of network structure learning. Many hybrid methods have been developed up to now and have been shown to perform well (Acid and de Campos, 2001; Tsamardinos et al., 2006). But this idea doesn’t often occur in GWAS. When identifying associated SNPs, combining the Bayesian network method with other art-of-state algorithms seems more popular. In this paper, we proposed a two-stage method to accomplish the combination of two methods. Looser criteria provided by the constraint-based method determine a candidate nodes set. After that a score-and-search procedure is used to find out genuinely associated nodes.
2.3 Algorithm
In order to balance the accuracy and feasibility, our algorithm is a score-based two-stage Bayesian network (STS-BN) method, where the idea of the constraint-based method and the score-and-search method are both used. The pseudo-code is given in Table 1. We input the disease node D and the set U containing all SNP nodes and then by calculating, we can gain a disease-associated SNPs set V, i.e., the parent nodes set of D. The whole algorithm can be divided into two parts. The first phase reduces the dimension of SNPs through the idea of constraint-based methods, filtering out some nodes which are neither parents nor children of disease node D via Theorem 2. In this stage, we use G-test to verify the independence and conditional independence of two variables. Compared to the chi-square test, G-values are additive and can be used for more elaborate statistical designs (McDonald, 2014). The general formula for G is:
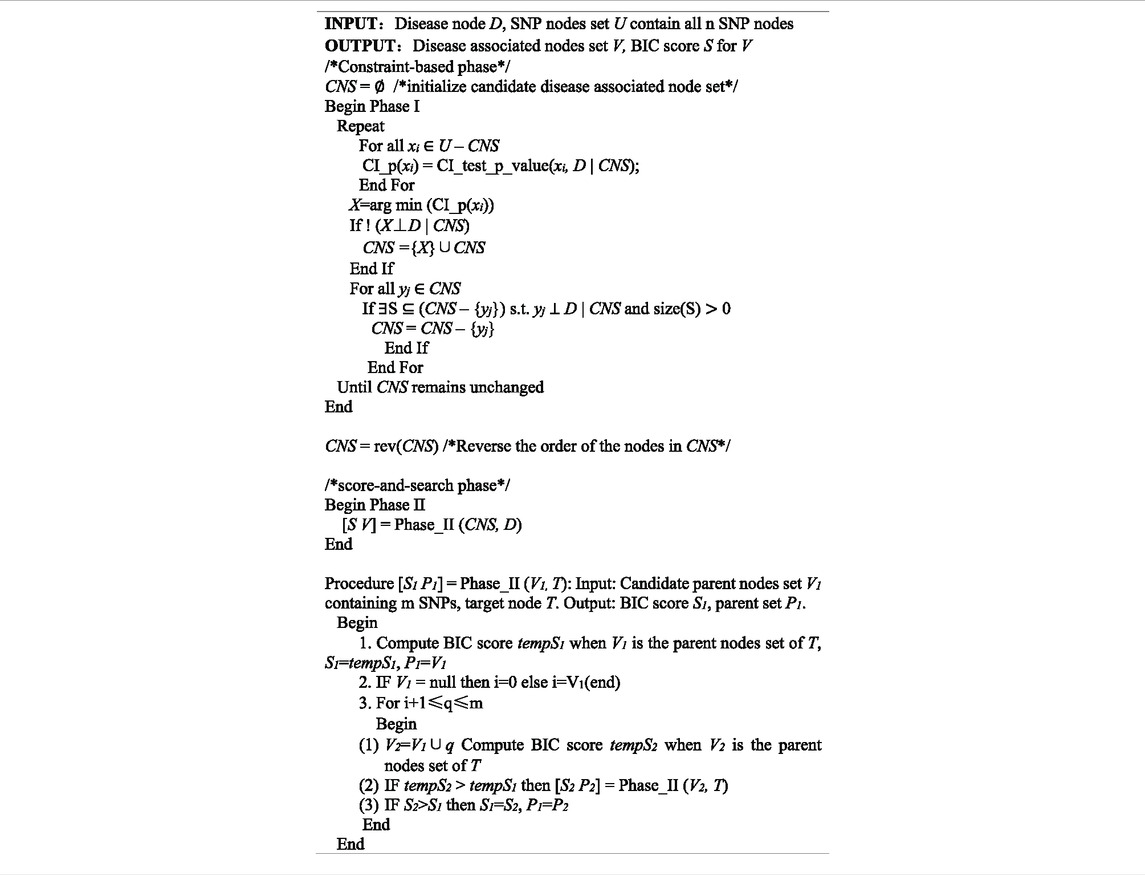
TABLE 1. STS-BN algorithm.
More specifically, the G-test of independence between two categorical variables
where
The degrees of freedom for the G-test between
When considering conditional independence, the G-test of conditional independence between two variables
where
The degrees of freedom will be:
In the second phase, a score-and-search process is utilized to analyze the candidate nodes set from phase I and finally select the parents set of the disease node. We consider the Bayesian information criterion (BIC) as our score function because it's a score equivalent, decomposable, and consistent scoring criterion (Nandy et al., 2018). To cater for the circumstance that the sample sizes of GWAS data are usually not big enough on account of high research cost, we adjust the coefficient of the penalty term (0.17 here) at the suggestion of Han and Chen (2011). To save time, we embed the greedy search in phase II, which might make the algorithm sensitive to different orders of input nodes. But in fact, the first phase of our algorithm can provide a proper order while decreasing the dimension, which greatly improves the stability of the whole algorithm.
3 Results
3.1 Simulation study
3.1.1 Materials
We compare the performance of our method and several other approaches using the simulated data sets generated from three common two-loci disease models (Marchini et al., 2005; Li and Chen, 2008), whose disease odds for every genotype are displayed in Table 2. In Model 1, two loci have an independent multiplicative genotype effect. In Model 2, there is also a multiplicative effect but it only appears when both two loci have the disease-associated allele. Model 3 is a typical threshold model where genotype effects appear equally as long as both two loci have the disease-associated allele.
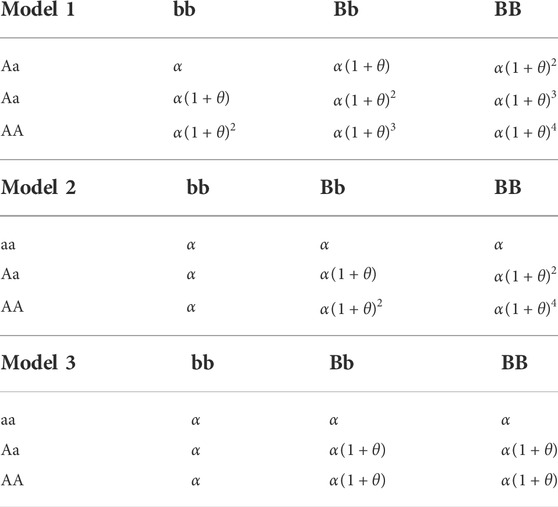
TABLE 2. Two-loci disease models.
We use
where
We can also calculate the conditional probability of the locus having linkage disequilibrium with the disease locus given the allele of the disease locus using
Once the parameters are prepared, we can generate the disease status in a 1:1 ratio and the genotype of the disease locus. According to the genotype of disease loci, its associated loci can also be generated.
In this study, we choose 36 sets of parameters as shown in Table 3 to guarantee the generality of the experiment.
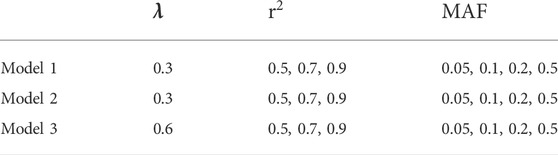
TABLE 3. Parameters.
For each parameter setting, we generate 50 datasets, each of which contains 2000 samples and 102 makers. Two markers are directly associated with the disease, and two markers are associated with these two disease-associated markers, respectively, but not directly associated with the disease. The cases and controls are generated in a ratio of 1:1. The MAF of each non-disease marker is randomly generated from a uniform distribution.
We compare our algorithm with BEAM, BOOST, MOMDR, SVM, DASSO-MB and bNEAT. To assess the outcome, we define power as the proportion of the datasets whose disease loci are detected accurately without any false positive. The powers of different methods are calculated and compared under our parameter setup.
BEAM detects the SNPs associated with disease via the Bayesian partition model. This method labels the SNPs as the members of group 0, group 1, and group 2, which contains the SNPs that have no effect on the disease, influence the disease independently, and have a joint influence on the disease with other SNPs, respectively. And then, MCMC simulations are used to estimate the posterior probability that each SNP belongs to different groups, and the B statistics are calculated for the test of significance. The software we used here is downloaded from http://www.fas.harvard.edu/∼junliu/BEAM/.
BOOST is a two-stage search method containing a screening stage and a testing stage. In the former stage, it uses a noniterative method to approximate the likelihood ratio statistic in evaluating all pairs of SNPs and select candidate SNP pairs by a threshold. Then in the testing stage, the classical likelihood ratio test is employed to measure the interaction effects of candidate SNP pairs (Wan et al., 2010). The software can be found at http://bioinformatics.ust.hk/BOOST.html.
MOMDR is a MDR-based method with a multiobjective function. This method considers the incorporated measures including correct classification and likelihood rates to detect epistatic interactions (Yang et al., 2018). The software can be found at https://goo.gl/M8dpDg.
As for support vector machines, we mimic the process in Jiang et al. (2009) instead of using the methods provided by Chen et al. (2008) for time-saving. Firstly, we rank the SNPs according to the mutual information between SNPs and disease status. Then, we select a candidate SNPs subset via a sliding window sequential forward feature selection algorithm where the accuracy rate for classification of SVM estimated by 10-fold cross-validation is used as criteria. Finally,
DASSO-MB is a constraint-based Bayesian network approach that uses conditional independence tests to detect the Markov blanket of the disease. The algorithm is given by Han et al. (2010) and we implement it in an R program.
bNEAT is another Bayesian network method that is designed on the basis of the score-and-search approach and is more suitable for small sample data. Although it outperforms DASSO-MB (Han and Chen, 2011), this algorithm is developed based on a greedy search program and is sensitive to improper input orders. And unfortunately, although designers try to reduce computational complexity consciously, this method still has difficulty in applying to the GWAS data directly. Its pseudo-code is shown in Han and Chen (2011) and we implement it in R, too.
3.1.2 Results
In order to quantify the performance of different methods, we define the criteria (here we name it power) as the ratio of the number of simulated datasets in which only the correct markers are detected without any false positive and the total amount of datasets under the same parameter configuration. In Figures 1–3, we use histograms to describe the simulation results. In most cases, the power of our method is closed to bNEAT, and is higher than the other methods. One of the reasons why SVM doesn’t work well might be that using prediction accuracy as the inclusive criteria of associated markers can introduce a lot of false positives. Also as listed in Table 4, in most cases, the change in power of our method is relatively small when two additional false positives are allowed to appear in the results. This suggests that our method can reduce the occurrence of false positives to some extent.
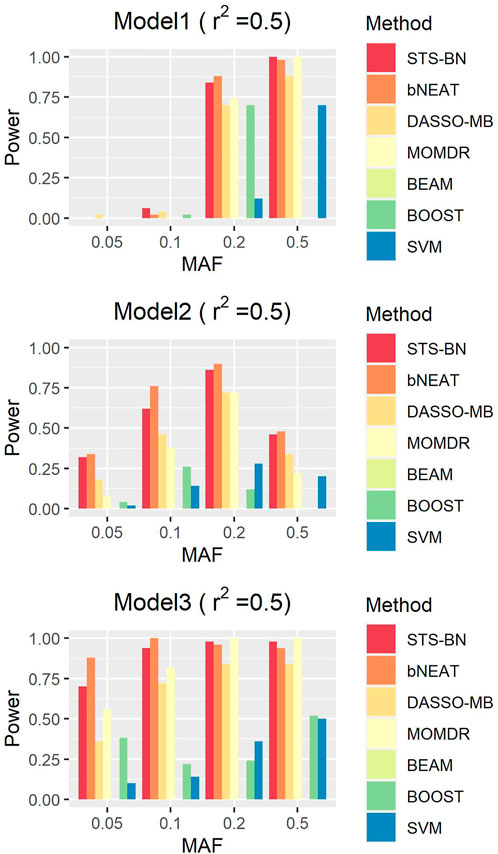
FIGURE 1. Performance comparison. Powers of STS-BN, bNEAT, DASSO-MB, MOMDR, BEAM, BOOST, SVM. (
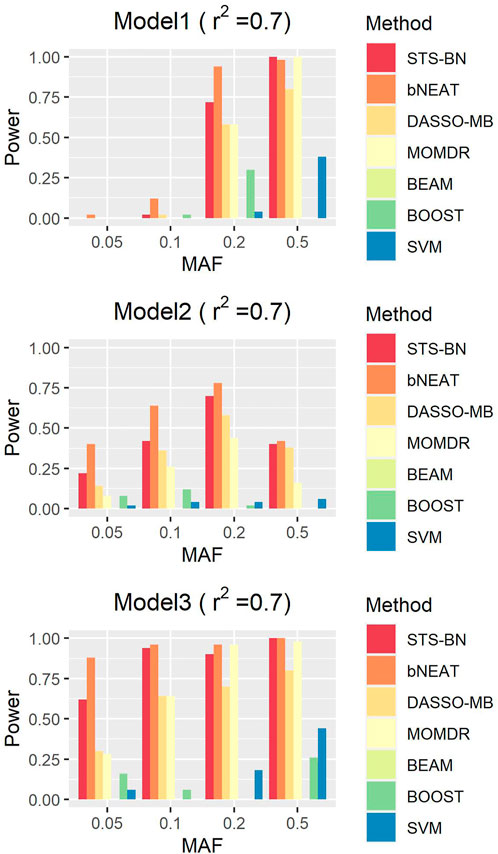
FIGURE 2. Performance comparison. Powers of STS-BN, bNEAT, DASSO-MB, MOMDR, BEAM, BOOST, SVM. (
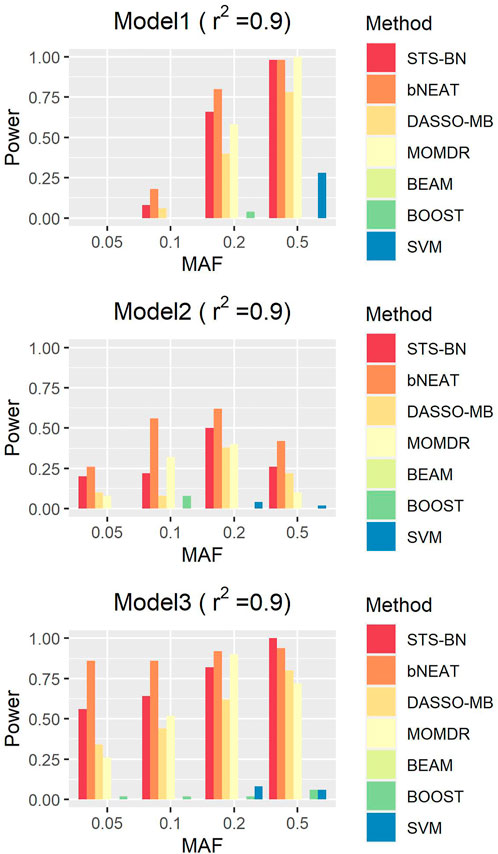
FIGURE 3. Performance comparison. Powers of STS-BN, bNEAT, DASSO-MB, MOMDR,BEAM, BOOST, SVM. (
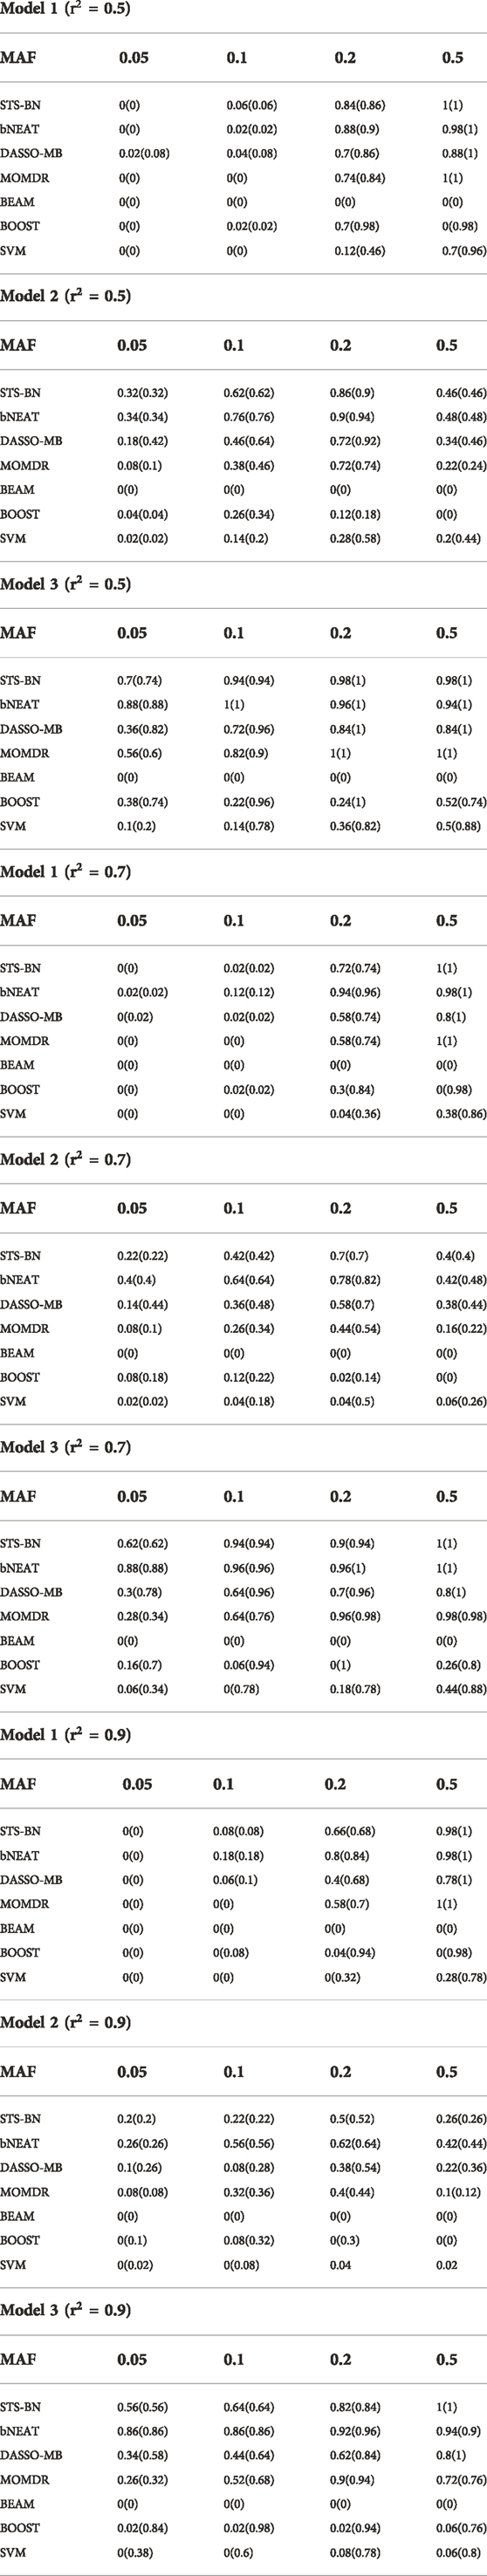
TABLE 4. Performance Comparison. Powers of simulations are given by this table. The percentage of the simulated datasets in which the correct markers are detected and at most two false positives are included is shown in the parentheses.
As mentioned above, though bNEAT usually performs well in some simulation experiments, it can hardly get good results when the input sequence is inappropriate. So, we randomly disturb the order of the makers in each dataset and reproduce the experiment. From the results in Figures 4–6, we can see that our algorithm far outperforms bNEAT. Under most configurations, the results of our method are the same as the former, while the accuracy of bNEAT is significantly reduced. This suggests that our method possesses higher stability than bNEAT.
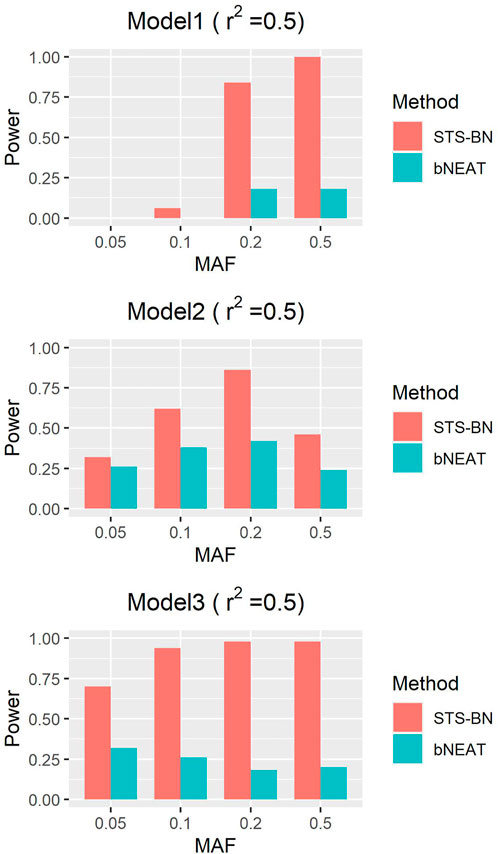
FIGURE 4. Performance comparison of STS-BN and bNEAT. The input orders of markers are randomly disturbed and
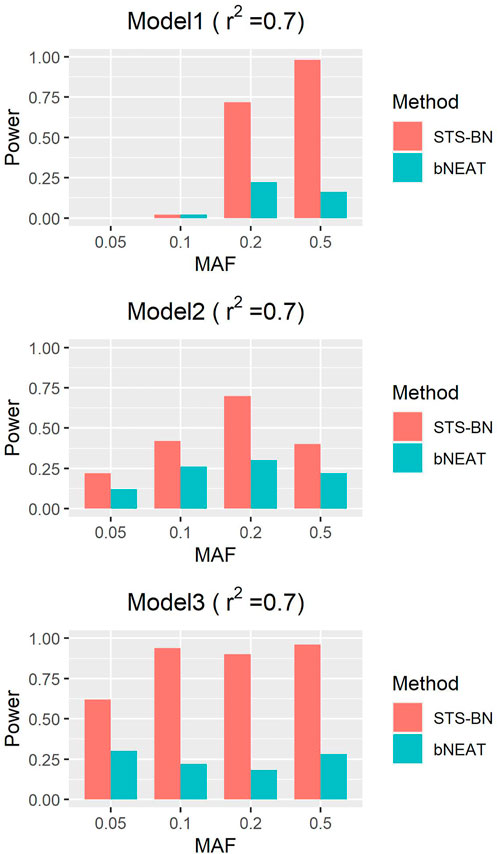
FIGURE 5. Performance comparison of STS-BN and bNEAT. The input orders of markers are randomly disturbed and
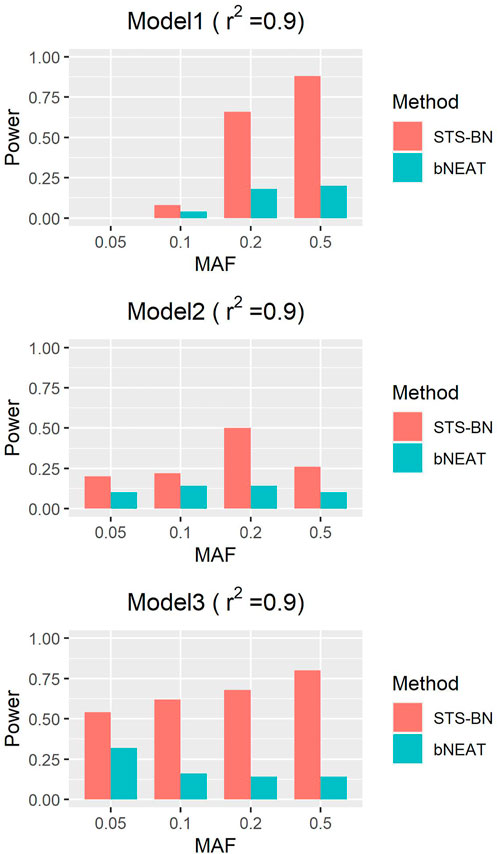
FIGURE 6. Performance comparison of STS-BN and bNEAT. The input orders of markers are randomly disturbed and
3.2 Application to real datasets
3.2.1 UK biobank lung cancer data
We apply our algorithm to the real data set to evaluate its adaptability to the real-world situation. The dataset we used is a lung cancer dataset extracted from the UK Biobank. The UK Biobank is a large-scale biomedical database and research resource containing in-depth genetic and health information from approximately 500,000 individuals from across the United Kingdom, aged between 40 and 69 at recruitment (Bycroft et al., 2018). Here we selected the patients with malignant neoplasm of bronchus and lung based on the ICD-10 code for the type of cancer. The controls were selected from the population, where we excluded the patients with malignant neoplasm of bronchus and lung or lung cancer based on ICD-10, ICD-9 or self-reported code, by R package “MatchIt” (Ho et al., 2011) according to the sex and age of the participants in a 1:1 ratio. Then, these people’s imputed genetic variation data on autosomes were extracted. Data preprocessing was completed by PLINK 2.0 (Chang, 2022). In this step, the variants with minor allele frequency
Using STS-BN to analyze the dataset, rs6534554 and rs10229375 were detected. The importance of the latter has been more evident in previous researches. According to dbSNP (Sherry et al., 2001), rs10229375 is the intro variant of STX1A and the 2 kb upstream variant of MIR4284. STX1A encodes a member of the syntaxin superfamily. This protein has been shown to be associated with different types of lung cancer (Graff et al., 2001; Zombori et al., 2021). In another study, STX1A was used to classify NSCLC (non-small cell lung cancer) patients into different prognostic groups (Lau et al., 2007). In addition, a recent study suggested that the up-regulation of MIR4284, i.e. microRNA 4284, was shown in NSCLC tissues and cell lines compared to the corresponding normal controls, and decreased expression of MIR4284 could inhibit tumor cell proliferation, migration and invasion (Tian et al., 2021).
3.2.2 SMRIDB data
Another experiment is conducted with a dataset downloaded from The Stanley Medical Research Institute Online Genomics Database (Higgs et al., 2006), which can be found at https://www.stanleygenomics.org/. This database collected the information of patients suffering from mental diseases such as schizophrenia and bipolar disorder. Schizophrenia is a devastating and debilitating form of chronic psychiatric disorder, which is expressed as a combination of psychotic symptoms and motivational and cognitive dysfunctions. As a cognitive and behavioural disorder, schizophrenia is ultimately about how the brain processes information. Besides, this disease involves subtle pathological changes in specific neural cell populations and cell-cell communication (Kahn et al., 2015).
To identify associated SNPs, we chose the dataset whose study ID is 20, and there are a total of 153 samples and 500,568 SNPs. After removing the missing data, we selected a control group of 48 samples and a case group including 44 patients with schizophrenia. Finally, we get a dataset containing 92 samples and 330,673 SNPs. Analyzing the dataset with STS-BN, we found three associated SNPs, rs11723575, rs1120408, and rs6062361. According to dbSNP (Sherry et al., 2001), rs1120408 and rs6062361 are intron variants of the diacylglycerol kinase beta (DGKB) gene and protein-L-isoaspartate (D-aspartate) O-methyltransferase domain containing 2 (PCMTD2) gene, respectively. DGKB gene codes a kind of protein that can phosphorylate diacylglycerol to phosphatidic acid, thus removing diacylglycerol. Phosphatidic acid functions both in signaling and phospholipid synthesis. DGKB is mainly expressed in the brain, especially the amygdala, caudate nucleus, and hippocampus within the adult brain (Caricasole et al., 2002). The expression of the PCMTD2 gene can also be found in the brain. This gene plays an important role in myelination and regulating neural differentiation. There are some clues that suggest PCMTD2 might be related to schizophrenia. A previous study (Zarrei et al., 2019) has shown that PCMTD2 is one of the neurodevelopmental disorders associated genes linked across more than one disorder, including schizophrenia. A case report (Kroepfl et al., 2008) also shows that the loss of the PCMTD2 gene seems to be responsible for severe intellectual disability. As we can see from above, both DGKB and PCMTD2 are closely related to the brain and have the possibility to be associated with schizophrenia. Unfortunately, there is little information about rs11723575 at present, but we can still believe that it’s an interesting site worth exploring.
4 Conclusion and discussion
In the era when data acquisition is getting easier and easier, the emergence and the development of data-driven methods have become a trend. Applying data-driven methods to GWAS data is crucial for understanding and predicting some complex traits. In this paper, we design a new algorithm based on Bayesian network to detect causal SNPs of complex diseases, which shows good stability and accuracy in simulation experiments. Furthermore, we have applied this algorithm to two real-world datasets and have gotten reasonable results within an acceptable time. That is, our method has the capacity to handle real GWAS data containing hundreds of thousands of SNPs.
Although the behavior of our algorithm is satisfactory, there are a few points worth discussing. For example, G-test may not be the best criteria for constraint-based structure learning methods which is used in the first phase of our algorithm. And the strategy of inclusion one by one makes it difficult to detect interactions without at least one single locus having an independent main effect. Besides, although the first phase can provide a proper input sequence for the second phase, the essence of the search program used in phase II is still a greedy search, which means the program is possible to trap in a local optimum. We will consider other measures of conditional independence in future studies. More advanced search algorithms both in Phase I and Phase II will also be adopted. Another issue is that only a few SNPs have been found in real data experiments. We speculate that this is due to our algorithm’s tendency to reduce false positives, which may result in an increase in false negatives. The lack of complexity of data preprocessing and disease classification may also have influenced the results to some extent. In addition, we can expand our study to the circumstance where gene-gene interactions and gene-environment interactions are considered at the same time so that we can have a more objective understanding of the complex disease.
Data availability statement
The code for our algorithm and all simulated data are available from https://github.com/YanranM/STS-BN. The SMRIDB dataset is download from the Stanley Medical Research Institute Online Genomics Database, which can be accessed at https://www.stanleygenomics.org. The UK Biobank dataset can be obtained from https://www.ukbiobank.ac.uk/ and our research is conducted with approved access to UK Biobank data under application ID 47192 and run ID 40687.
Author contributions
YM design and implemented the algorithm. YM, BF and XY participated in experiments based on simulated data and real data. YZ and ZY conceived the study and designed the experiments. All authors helped in drafting the manuscript and approved the final manuscript.
Funding
This work was funded by National Natural Science Foundation of China (11901387), Shanghai Philosophy and Social Sciences Planning Project (2018EJB006), and Fundamental Research Funds for the Central Universities (17X100040066).
Acknowledgments
We appreciate the support of SJTU Center of High Performance Computing for our experiments.
Conflict of interest
The authors declare that the research was conducted in the absence of any commercial or financial relationships that could be construed as a potential conflict of interest.
Publisher’s note
All claims expressed in this article are solely those of the authors and do not necessarily represent those of their affiliated organizations, or those of the publisher, the editors and the reviewers. Any product that may be evaluated in this article, or claim that may be made by its manufacturer, is not guaranteed or endorsed by the publisher.
References
Acid, S., and de Campos, L. M. (2001). A hybrid methodology for learning belief networks: Benedict. Int. J. Approx. Reason. 27, 235–262. doi:10.1016/s0888-613x(01)00041-x
Barrett, J. H., Taylor, J. C., and Iles, M. M. (2014). “Statistical perspectives for genome-wide association studies (GWAS),” in Clinical bioinformatics. Editor R. Trent (New York, NY: Humana Press).
Bycroft, C., Freeman, C., Petkova, D., Band, G., Elliott, L. T., Sharp, K., et al. (2018). The UK Biobank resource with deep phenotyping and genomic data. Nature 562, 203–209. doi:10.1038/s41586-018-0579-z
Caricasole, A., Bettini, E., Sala, C., Roncarati, R., Kobayashi, N., Caldara, F., et al. (2002). Molecular cloning and characterization of the human diacylglycerol kinase beta (DGKbeta) gene: Alternative splicing generates DGKbeta isotypes with different properties. J. Biol. Chem. 277, 4790–4796. doi:10.1074/jbc.M110249200
Chang, C. (2022). Plink 2.0. Available: http://www.cog-genomics.org/plink/2.0/.
Chen, S. H., Sun, J., Dimitrov, L., Turner, A. R., Adams, T. S., Meyers, D. A., et al. (2008). A support vector machine approach for detecting gene-gene interaction. Genet. Epidemiol. 32, 152–167. doi:10.1002/gepi.20272
Gogoshin, G., Boerwinkle, E., and Rodin, A. S. (2016). New algorithm and software (BNOmics) for inferring and visualizing bayesian networks from heterogeneous big biological and genetic data. J. Comput. Biol. 24, 340–356. doi:10.1089/cmb.2016.0100
Graff, L., Castrop, F., Bauer, M., HöFLER, H., and Gratzl, M. (2001). Expression of vesicular monoamine transporters, synaptosomal-associated protein 25 and syntaxin1: A signature of human small cell lung carcinoma. Cancer Res. 61, 2138–2144.
Han, B., and Chen, X.-W. (2011). bNEAT: a Bayesian network method for detecting epistatic interactions in genome-wide association studies. BMC Genomics 12, S9. doi:10.1186/1471-2164-12-S2-S9
Han, B., Park, M., and Chen, X.-W. (2010). A Markov blanket-based method for detecting causal SNPs in GWAS. BMC Bioinforma. 11, S5. doi:10.1186/1471-2105-11-S3-S5
Higgs, B. W., Elashoff, M., Richman, S., and Barci, B. (2006). An online database for brain disease research. BMC Genomics 7, 70. doi:10.1186/1471-2164-7-70
Ho, D., Imai, K., King, G., and Stuart, E. A. (2011). MatchIt: Nonparametric preprocessing for parametric causal inference. J. Stat. Softw. 42, 1–28. doi:10.18637/jss.v042.i08
Jiang, R., Tang, W., Wu, X., and Fu, W. (2009). A random forest approach to the detection of epistatic interactions in case-control studies. BMC Bioinforma. 10, S65. doi:10.1186/1471-2105-10-S1-S65
Kahn, R. S., Sommer, I. E., Murray, R. M., Meyer-Lindenberg, A., Weinberger, D. R., Cannon, T. D., et al. (2015). Schizophrenia. Nat. Rev. Dis. Prim. 1, 15067. doi:10.1038/nrdp.2015.67
Kroepfl, T., Petek, E., Schwarzbraun, T., Kroisel, P. M., and Plecko, B. (2008). Mental retardation in a girl with a subtelomeric deletion on chromosome 20q and complete deletion of the myelin transcription factor 1 gene (MYT1). Clin. Genet. 73, 492–495. doi:10.1111/j.1399-0004.2008.00982.x
Lau, S. K., Boutros, P. C., Pintilie, M., Blackhall, F. H., Zhu, C.-Q., Strumpf, D., et al. (2007). Three-gene prognostic classifier for early-stage non–small-cell lung cancer. J. Clin. Oncol. 25, 5562–5569. doi:10.1200/JCO.2007.12.0352
Li, H., Yuan, Z., Ji, J., Xu, J., Zhang, T., Zhang, X., et al. (2016). A novel Markov Blanket-based repeated-fishing strategy for capturing phenotype-related biomarkers in big omics data. BMC Genet. 17, 51. doi:10.1186/s12863-016-0358-5
Li, J., and Chen, Y. (2008). Generating samples for association studies based on HapMap data. BMC Bioinforma. 9, 44. doi:10.1186/1471-2105-9-44
Lyu, R., Sun, J., Xu, D., Jiang, Q., Wei, C., and Zhang, Y. (2021). GESLM algorithm for detecting causal SNPs in GWAS with multiple phenotypes. Brief. Bioinform. 22, bbab276. doi:10.1093/bib/bbab276
Marchini, J., Donnelly, P., and Cardon, L. R. (2005). Genome-wide strategies for detecting multiple loci that influence complex diseases. Nat. Genet. 37, 413–417. doi:10.1038/ng1537
McDonald, J. H. (2014). Handbook of biological statistics. 3rd ed. Baltimore, Maryland: Sparky House Publishing.
McKinney, B. A., Reif, D. M., Ritchie, M. D., and Moore, J. H. (2006). Machine learning for detecting gene-gene interactions: A review. Appl. Bioinforma. 5, 77–88. doi:10.2165/00822942-200605020-00002
Nandy, P., Hauser, A., and Maathuis, M. H. (2018). High-dimensional consistency in score-based and hybrid structure learning. Ann. Stat. 46, 3151–3183. doi:10.1214/17-aos1654
Neapolitan, R. E. (1990). Probabilistic reasoning in expert systems: Theory and algorithms. New York, NY, USA: John Wiley & Sons.
Park, M. Y., and Hastie, T. (2008). Penalized logistic regression for detecting gene interactions. Biostatistics 9, 30–50. doi:10.1093/biostatistics/kxm010
Pearl, J. (1985). “Bayesian networks: A model of self-activated memory for evidential reasoning,” in Proceedings of the 7th conference of the cognitive science society (Irvine, CA, USA: University of California).
Pearl, J. (1988). Probabilistic reasoning in intelligent systems: Networks of plausible inference. San Francisco, CA, USA: Morgan Kaufmann Publishers Inc.
Peng, Y. Z., Lin, Y., Huang, Y., Li, Y., Luo, G., and Liao, J. (2021). GEP-EpiSeeker: A gene expression programming-based method for epistatic interaction detection in genome-wide association studies. BMC Genomics 22, 910. doi:10.1186/s12864-021-08207-8
Ritchie, M. D., Hahn, L. W., and Moore, J. H. (2003). Power of multifactor dimensionality reduction for detecting gene-gene interactions in the presence of genotyping error, missing data, phenocopy, and genetic heterogeneity. Genet. Epidemiol. 24, 150–157. doi:10.1002/gepi.10218
Sherry, S. T., Ward, M. H., Kholodov, M., Baker, J., Phan, L., Smigielski, E. M., et al. (2001). dbSNP: the NCBI database of genetic variation. Nucleic Acids Res. 29, 308–311. doi:10.1093/nar/29.1.308
Su, C., Andrew, A., Karagas, M. R., and Borsuk, M. E. (2013). Using Bayesian networks to discover relations between genes, environment, and disease. BioData Min. 6, 6. doi:10.1186/1756-0381-6-6
Sun, J., Lyu, R., Deng, L., Li, Q., Zhao, Y., and Zhang, Y. (2022). SMetABF: A rapid algorithm for bayesian GWAS meta-analysis with a large number of studies included. PLoS Comput. Biol. 18, e1009948. doi:10.1371/journal.pcbi.1009948
Tian, P., Wang, Y., and Du, W. (2021). Ultrasound-targeted microbubble destruction enhances the anti-tumor action of miR-4284 inhibitor in non-small cell lung cancer cells. Exp. Ther. Med. 21, 551. doi:10.3892/etm.2021.9983
Tsamardinos, I., Brown, L. E., and Aliferis, C. F. (2006). The max-min hill-climbing Bayesian network structure learning algorithm. Mach. Learn. 65, 31–78. doi:10.1007/s10994-006-6889-7
Wacholder, S., Chanock, S., Garcia-Closas, M., El Ghormli, L., and Rothman, N. (2004). Assessing the probability that a positive report is false: An approach for molecular epidemiology studies. J. Natl. Cancer Inst. 96, 434–442. doi:10.1093/jnci/djh075
Wan, X., Yang, C., Yang, Q., Xue, H., Fan, X., Tang, N. L. S., et al. (2010). Boost: A fast approach to detecting gene-gene interactions in genome-wide case-control studies. Am. J. Hum. Genet. 87, 325–340. doi:10.1016/j.ajhg.2010.07.021
Yang, C.-H., Chuang, L.-Y., and Lin, Y.-D. (2018). Multiobjective multifactor dimensionality reduction to detect SNP–SNP interactions. Bioinformatics 34, 2228–2236. doi:10.1093/bioinformatics/bty076
Yilmaz, S., Tastan, O., and Cicek, E. (2019). Spadis: An algorithm for selecting predictive and diverse SNPs in GWAS. IEEE/ACM Trans. Comput. Biol. Bioinform. 18, 1208–1216. doi:10.1109/TCBB.2019.2935437
Zarrei, M., Burton, C. L., Engchuan, W., Young, E. J., Higginbotham, E. J., Macdonald, J. R., et al. (2019). A large data resource of genomic copy number variation across neurodevelopmental disorders. NPJ Genom. Med. 4, 26. doi:10.1038/s41525-019-0098-3
Zhang, L., Pan, Q., Wang, Y., Wu, X., and Shi, X. (2019). Bayesian network construction and genotype-phenotype inference using GWAS statistics. IEEE/ACM Trans. Comput. Biol. Bioinform. 16, 475–489. doi:10.1109/TCBB.2017.2779498
Zhang, Y., and Liu, J. S. (2007). Bayesian inference of epistatic interactions in case-control studies. Nat. Genet. 39, 1167–1173. doi:10.1038/ng2110
Keywords: Bayesian network, GWAS, two-stage method, epistasis, complex disease
Citation: Ma Y, Fa B, Yuan X, Zhang Y and Yu Z (2022) STS-BN: An efficient Bayesian network method for detecting causal SNPs. Front. Genet. 13:942464. doi: 10.3389/fgene.2022.942464
Received: 12 May 2022; Accepted: 16 August 2022;
Published: 15 September 2022.
Edited by:
Zhigang Li, University of Florida, United StatesReviewed by:
Andrei Rodin, City of Hope National Medical Center, United StatesHui Wei, Nanjing Forestry University, China
Copyright © 2022 Ma, Fa, Yuan, Zhang and Yu. This is an open-access article distributed under the terms of the Creative Commons Attribution License (CC BY). The use, distribution or reproduction in other forums is permitted, provided the original author(s) and the copyright owner(s) are credited and that the original publication in this journal is cited, in accordance with accepted academic practice. No use, distribution or reproduction is permitted which does not comply with these terms.
*Correspondence: Yue Zhang, eXVlLnpoYW5nQHNqdHUuZWR1LmNu; Zhangsheng Yu, eXV6aGFuZ3NoZW5nQHNqdHUuZWR1LmNu