 Dengying Liu1
 Zhong Xu2
 Wei Zhao1
 Shiyi Wang1Tuowu Li1Kai Zhu3Guanglei Liu3Xiaoduo Zhao3Qishan Wang4
 Yuchun Pan4*
 Peipei Ma1*
- 1Shanghai Key Laboratory of Veterinary Biotechnology, Department of Animal Science, School of Agriculture and Biology, Shanghai Jiao Tong University, Shanghai, China
- 2Hubei Key Laboratory of Animal Embryo and Molecular Breeding, Institute of Animal Husbandry and Veterinary, Hubei Provincial Academy of Agricultural Sciences, Wuhan, China
- 3Shanghai Dairy Cattle Breeding Centre Co, Ltd, Shanghai, China
- 4Department of Animal Breeding and Reproduction, College of Animal Science, Zhejiang University, Hangzhou, China
The aim of this study was to investigate the genetic parameters and genetic architectures of six milk production traits in the Shanghai Holstein population. The data used to estimate the genetic parameters consisted of 1,968,589 test-day records for 305,031 primiparous cows. Among the cows with phenotypes, 3,016 cows were genotyped with Illumina Bovine SNP50K BeadChip, GeneSeek Bovine 50K BeadChip, GeneSeek Bovine LD BeadChip v4, GeneSeek Bovine 150K BeadChip, or low-depth whole-genome sequencing. A genome-wide association study was performed to identify quantitative trait loci and genes associated with milk production traits in the Shanghai Holstein population using genotypes imputed to whole-genome sequences and both fixed and random model circulating probability unification and a mixed linear model with rMVP software. Estimated heritabilities (h2) varied from 0.04 to 0.14 for somatic cell score (SCS), 0.07 to 0.22 for fat percentage (FP), 0.09 to 0.27 for milk yield (MY), 0.06 to 0.23 for fat yield (FY), 0.09 to 0.26 for protein yield (PY), and 0.07 to 0.35 for protein percentage (PP), respectively. Within lactation, genetic correlations for SCS, FP, MY, FY, PY, and PP at different stages of lactation estimated in random regression model were ranged from -0.02 to 0.99, 0.18 to 0.99, 0.04 to 0.99, 0.04 to 0.99, 0.01 to 0.99, and 0.33 to 0.99, respectively. The genetic correlations were highest between adjacent DIM but decreased as DIM got further apart. Candidate genes included those related to production traits (DGAT1, MGST1, PTK2, and SCRIB), disease-related (LY6K, COL22A1, TECPR2, and PLCB1), heat stress–related (ITGA9, NDST4, TECPR2, and HSF1), and reproduction-related (7SK and DOCK2) genes. This study has shown that there are differences in the genetic mechanisms of milk production traits at different stages of lactation. Therefore, it is necessary to conduct research on milk production traits at different stages of lactation as different traits. Our results can also provide a theoretical basis for subsequent molecular breeding, especially for the novel genetic loci.
Introduction
Chinese Holstein cattle are derived from grading crossbreeding and selection between the local yellow cattle and Holstein, a breed that was mostly imported from Canada, the United States, France, and northern Europe and renamed by the Chinese Ministry of Agriculture in 1992 (Huang et al., 2010; Ferreri et al., 2011). Since then, China has continuously imported live proven cattle, frozen semen, and embryos from most temperate countries for use in crossbreeding aimed at improving the productivity of Chinese native cattle by combining the environmental adaptation features of Chinese cattle with the high milk yield (MY) potential of foreign cattle (Ferreri et al., 2011; Zhang and Sun, 2021). Therefore, the genetic architecture of the Chinese Holstein population is different from other populations. China occupies a larger area and a larger span of north–south latitudes. Accordingly, topography, climate, herd management system, and other environments vary greatly in different regions, and the different climatic zones have differential contributions to population genetic characteristics, with Holstein in different countries or provinces having its own genetic characteristics (Pérez-Cabal et al., 2012; Liu et al., 2019). The Shanghai Holstein cattle population is raised under a subtropical environment and an intensive pasture system that is maintained below the level of severe thermal stress throughout the day in the summer season. At the same time, Shanghai is the main center for providing Holstein semen to various farms throughout China. Currently, Shanghai Holstein cattle are susceptible to mastitis. The average number of lactations for Shanghai Holstein cattle was 2.23, which makes it difficult to maintain production efficiency and meet the demands of the dairy industry, and the MY is much less than that in the United States (Mao, 2015; Liu et al., 2021).
Since 1994, the Dairy Herd Improvement has been carried out in Shanghai, where millions of test day records are collected (Sun et al., 2008). Milk production and quality, including MY, fat yield (FY), fat percentage (FP), protein yield (PY), protein percentage (PP), and somatic cell score (SCS), are the most important traits in the dairy industry. There are complex traits influenced by management practices and environmental conditions and the physiological stages (e.g., age and stage of lactation) and genetic merits of the animals. Genetic parameters such as heritability are the core of breeding work to accelerate genetic progress and also the most important properties of a population (Meyer, 1989; Akanno and Ibe, 2005). Evaluating genetic parameters is the basis for research such as genome-wide association study (GWAS) and genome-wide selection. However, the heritability of a phenotype in GWAS is too low, resulting in the reduced possibility of detecting the actual association between single nucleotide polymorphisms (SNPs) and traits or non-detection (Shao et al., 2021). Recently, there has been considerable interest in using the random regression model (RRM) to model individual test-day records for the genetic evaluation of milk traits (Khanzadeh et al., 2013; Silva et al., 2020; Soumri et al., 2020).
GWAS is an effective method for identifying the genetic variations involved in complex traits. With the rapid development of high-throughput sequencing technology, many researchers have reported that the power of GWAS based on imputed whole-genome sequencing (WGS) variants on different traits in livestock, such as cattle (Sanchez et al., 2017), pig (Wu et al., 2019; Yan et al., 2021), and chicken (Ye et al., 2020), was improved. Compared to microarray, WGS data cover all SNPs, including causative mutations. However, sequencing thousands of individuals of interest is expensive. Imputation from SNP panels to WGS data is an attractive and less expensive approach to obtain WGS data. Selection of the imputation reference panel is very important for genomic prediction with imputed WGS data. Nowadays, numerous GWASs are conducted on cattle by using the 1000 Bull Genomes Project to impute WGS data on genotyped animals (Iheshiulor et al., 2016; Meuwissen et al., 2021).
Thus far, many researchers have studied the Holstein population in different countries and provinces, including the north of China (Ferreri et al., 2011; Jiang et al., 2012; Liu et al., 2020; Silva et al., 2020). A previous study of the Shanghai Holstein population used the genotyping by genome reducing and sequencing (GGRS) of 1,092 cattle and revealed some SNPs associated with MY, FP, PP, and SCS (Chen Z. et al., 2018), but the study had a small sample size and only conducted association analysis of part of milk production traits using GGRS data. The use of imputed WGS data has been shown that can increase GWAS power and ability to detect causal mutations of complex traits. Therefore, the aim of the present study was to estimate the genetic parameters for milk production and quality traits by using RRM and find new genetic loci by using imputed WGS and a much larger population. In this study, we emphasized the different physiological stages of the mammary gland across the lactation stage. To the best of our knowledge, this is the first time that a GWAS for milk production traits was conducted using imputed WGS data in the south of China, where the Holstein population is suffering heavy heat stress.
Material and methods
Data
To evaluate the genetic parameter of milk production traits, we collected the test-day records from the farms of Shanghai Bright Dairy and Food Co., Ltd. from primiparous cows born between 1995 and 2020 with the regular and standard performance of DHI. In total, there are 1,968,589 records for the first lactation of 305,031 cows from 260 farms with the following criteria (Aerts et al., 2021; Mbuthia et al., 2021): 1) age at first calving between 19 and 37 months; 2) test day from 5 to 305 DIM, of which only 12% records out of the range; 3) milk yield of 1.0–65 kg, fat percentage of 0.5–8.5%, protein percentage of 0.5–7.5%, SCC less than 2 million cells per milliliter (Yang et al., 2013); 4) a minimum of three test-day records were required for a cow observation to be included in the analysis (Soumri et al., 2020), of which one was before DIM 45 (Bignardi et al., 2009); 5) the calving date was required to be before December 2019 so that all cows had the opportunity to finish the complete first lactation. A summary of data set used in this analysis is given in Table 1. The somatic cell count (SCC) was log-transformed in SCS as follows: SCS = log2 (SCC/100) + 3; FY was calculated as (FP*MY)/100; PY was calculated as (PP*MY)/100. The distribution of phenotypes is illustrated in Supplementary Figure S1. DMU Trace program was used for tracing ancestors and creating the full pedigree of the animals (Madsen, 2012). The pedigree was built by tracing the ancestors back as far as possible by using the sire-dam structure. Consequently, the pedigrees included 529,011 animals in total, which was recorded during the 1985–2019 period, including 4,945 sires and 19,867 dams, respectively. The inbreeding coefficients for the individuals with test-day records were calculated by going back only three generations in the pedigree. This data set included 226,602 animals. Estimates of the inbreeding coefficient were obtained using the R package “nadiv” (Wolak, 2012).
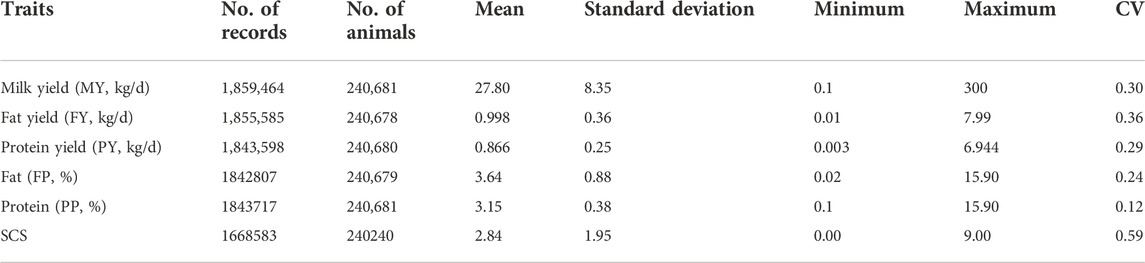
Table 1. Descriptive statistics of milk production and quality traits in Shanghai Holstein population.
Random regression test-day model
The derivative-free approach to multivariate analysis (DMU) package was used to estimate breeding values using the random regression test-day model (RRM) (Jakobsen et al., 2002a; Schaeffer, 2004). Due to problems with convergence, single trait RRM was used to estimate the genetic parameters for different traits. We considered herd-test date, calving month–age, and calving year–season as fixed effects, and individual additive genetic effects and permanent environment effects as random regression effects (Liu et al., 2020). Both random regressions were modeled using fifth-order Legendre polynomial. The model equation is as follows:
Here,
The variance-covariance matrix is as follows:
Here,
Genotyping, quality control, and imputation
Data from 3,489 genotyped animals were used in this study. In addition, 222 bulls from Run 2 of the 1000 Bull Genome Project were included (Daetwyler et al., 2014). The 3,489 animals were genotyped using different panels: GGP Bovine 50K chip (47,843 SNPs, GeneSeek Genomic Profiler, Neogen Corp., Lincoln, NE, United States, n = 294), GGP Bovine 150 K chip (140,668 SNPs, n = 1,744), GGP Bovine LD v4 (30,108 SNPs, n = 145), Illumina Bovine SNP50K v2 (54,609 SNPs, Illumina, San Diego, CA, United States, n = 1,100) and the extremely low-coverage whole genome sequencing with coverage at 0.5–1× (n = 206).
The extremely low-coverage whole genome sequencing used the Illumina Hiseq4000 platform to sequence the genomic DNA extracted from cow hair-follicle according to the manufacturer’s protocol. All of the raw sequence data were filtered using Fastp v0.20.0 (Chen S. et al., 2018) with default parameters and were then aligned to the pig genome build UMD3.1 using BWA mem algorithm implemented in samtools v1.10 (Li and Durbin, 2010). After removing PCR duplicates by Picard Tools v2.0.1 (http://broadinstitute.github.io/picard/), local realignment around indels and base quality scores recalculation were conducted using GATK v3.6 (McKenna et al., 2010) based on known indels and SNPs from in dbSNP database build 152. Sequenced individuals (n = 206) were used to carry out SNP calling via both bcftools v1.9 (Li, 2011) (set 1) and GATK UnifiedGenotyper (set 2), simultaneously. The overlapping SNPs between set 1 and set 2 were further filtered via GATK VQSR using known variants from the dbSNP database. Finally, a total of 12,396,463 autosomal SNPs with PASS flag and minor allele frequency (MAF) larger than 0.05 were retained. STITCH v1.5.3 (Davies et al., 2016) was used to impute the missing genotypes of the extremely low-coverage whole genome sequencing.
For all the genotype data, only the autosomal chromosomes and SNPs with known positions in the UMD 3.1 bovine assembly map were considered. Genotype quality control for all the panels excluded SNPs with a call rate lower than 0.90, SNPs with deviations from the Hardy–Weinberg equilibrium (p < 10–6) as calculated by means of the Fisher’s Exact Test, and SNPs with MAF lower than 0.05. For the quality control of the samples, animals with a call rate lower than 0.95 were excluded from the analysis.
The imputation of WGS genotypes from LD and 50K was performed in two steps. First, the LD and 50K genotypes were imputed to 150K, respectively. Then, in the second step, all imputed and real 150K genotypes were imputed to sequence data using 222 bulls from Run 2 of the 1000 Bull Genome Project (Daetwyler et al., 2014) and the UMD3.1 reference sequence. All the abovementioned steps used BEAGLE v4.1 (Browning and Browning, 2009) software. For the imputed extremely low-coverage whole genome sequencing, we used BEAGLE v4.1 to impute to WGS genotypes using 222 bulls as reference sequence described earlier.
All the genotypes imputed to WGS were merged using “bcftools merge--force-samples” (v1.3). We used Perl script to match phenotype samples ID with genotype samples ID to obtain the genotype file which has phenotype. Finally, genotype data were filtered by PLINK v1.9 with the parameters “--geno 0.1 --hwe 0.000001 --maf 0.05 --mind 0.05”. Only autosomal SNPs were considered in this study, and IDs without phenotypes were excluded.
Principal component analysis
To determine the level of population stratification, we plotted the population structure by PCA. Principal component analysis (PCA) was conducted using GCTA v64 (Yang et al., 2011) on 3,016 cows genotyped with 8,686,483 markers covering the whole genome to study the population structure. The first two eigenvectors are selected to make a scatter plot, and according to the results of the scatter plot, it can be known whether the population is divided into several subgroups.
GWAS analysis
We performed powerful GWAS analyses of six milk production traits (MY, FP, FY, PP, PY, and SCS) in different lactation stages (early lactation [TD7], peak lactation [TD35 and TD50], mid lactation [TD140], and late lactation [TD280]) in the Shanghai Holstein population using FarmCPU (Fixed and random model Circuitous Probability Unification) and MLM (mixed linear model) based on imputed WGS data with the rMVP software (Yin et al., 2021). FarmCPU method is a multi-locus linear mixed model which implements marker tests with associated markers as covariates in a fixed effect model and optimization on the associated covariate markers in a random effect model separately (Liu et al., 2016). As is known, population stratification is an important factor that can cause false positives in association studies. Therefore, the present study fitted the first three principal components (PCs) as covariate variables in the GWAS models to adjust for the population stratification. The model can be written as follows:
Here,
Here,
The MLM can be written as follows:
Here
As suggested by Ji et al. (2019), we used 5 × 10⁻⁸ and 5 × 10⁻⁶ as genome-wide and suggestive significance threshold to correct false positive findings due to multiple testing (Ji et al., 2019).
Enrichment analysis of candidate genes
We extended the positions of significant SNPs 150 Kb upstream and downstream and then updated to the Ensembl (UMD3.1 genome version). Identification of the closest genes to significant SNPs was obtained using Ensembl annotation of the UMD3.1 genome version. GO enrichment analysis and Kyoto Encyclopedia of Genes and Genomes (KEGG) enrichment analysis of the candidate genes were performed using the DAVID 6.8 Functional Annotation Tool (https://david.ncifcrf.gov/). In all analyses, the p-value < 0.05 was considered significantly different.
Another cost-effective approach to compare, confirm, and locate the most candidate genes related to important traits was to align our results with the QTLdb of UMD3.1, which contains 95,332 QTLs/associations. We identified all the QTLs (<1 Mb) that contained or overlapped with the candidate genes. After matching, the number and function of variants were identified, and these variants were used for subsequent analyses.
Results
Phenotypic and estimated genetic parameters
Supplementary Figure S1 shows that all the phenotypes follow normal distributions, which can be used for subsequent genome-wide association analysis. The range of inbreeding coefficient for 226,602 animals is 0–0.42. The number of inbred animals is 1,997. Heritabilities for milk yield, fat yield, protein yield, fat percentage, protein percentage, and SCS estimated with the random regression model for DIM are shown in Figure 1. The heritabilities for all phenotypes, except for PP, were reduced from early lactation, were lowest in the peak lactation stage, and increased gradually, remaining quite constant at the mid and late of the lactation stage. Generally, heritabilities for MY, FY, PY, FP, PP, and SCS ranged from 0.16–0.27, 0.11–0.23, 0.13–0.26, 0.12–0.22, 0.17–0.35, and 0.04–0.14 during the lactation, respectively. As expected, heritabilities for SCS are the lowest in all phenotypes.
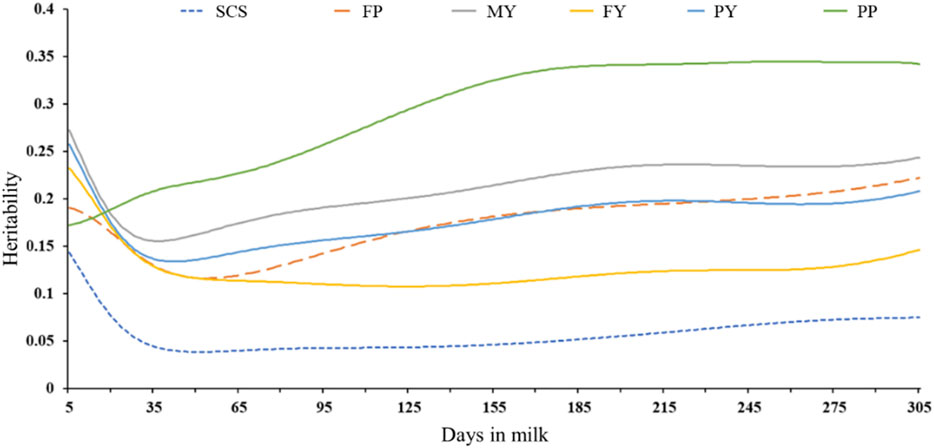
Figure 1. Heritabilities for milk yield, fat yield, protein yield, fat percentage, protein percentage, and SCS estimated with the random regression model for DIM.
Genetic correlations between test-day MY, test-day FY, test-day PY, test-day FP, test-day PP, and test-day SCS at different stages of lactation estimated in RRM are ranged from 0.04 to 0.99, 0.04 to 0.99, 0.01 to 0.99, 0.18 to 0.99, 0.33 to 0.99, and -0.02 to 0.99, respectively (Supplementary Table S1). For the six traits, the highest genetic correlation estimates were observed between adjacent test days and the lowest correlations between more distant test days. The genetic correlations for TD5 and TD7, TD50 and TD65, TD140 and TD95, TD125, TD155, TD185, TD215, TD280 and TD245, TD275, TD305 in all traits were larger than 0.95. For SCS, we obtained negative genetic correlations between TD5 and TD215 and TD245. In this study, we emphasized the different physiological stages of the mammary gland across lactation.
Imputation and quality control
The imputation accuracy was 0.95, which was evaluated by the internal information score generated by STITCH itself for the extremely low-coverage whole genome sequencing. The imputation accuracy for GGP Bovine LD v4 and GGP Bovine 50K imputed to GGP Bovine 150K was 0.98 and 0.99, respectively. Then the imputation accuracy for imputed GGP Bovine LD v4 and GGP Bovine 50K to WGS (222 bulls from Run 2 of the 1000 Bull Genome Project as reference panel) was 0.97 and 0.97, respectively. The accuracy for GGP Bovine 150K to WGS was 0.97. All the genotypes imputed to WGS were merged, and the final genotype data file contained 19,105,311 SNPs. After the filtration, 8,686,483 loci and 3,016 individuals were retained to be used in the GWAS. Figure 2 displayed the distribution of SNPs across all autosomes.
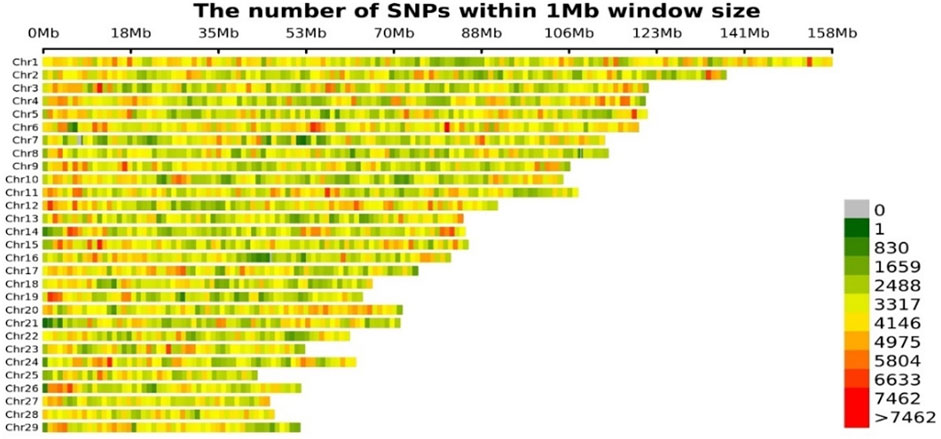
Figure 2. Distribution of SNPs in genome.
Population stratification assessment
The PCA revealed that the Shanghai Holstein population are subdivided into five differentiated groups by the first two principal components, which explained 17.25 and 10.96% of the genetic variability in the analysis, respectively, and about 28.21% of the variation is explained by the first three PCs together (Figure 3).
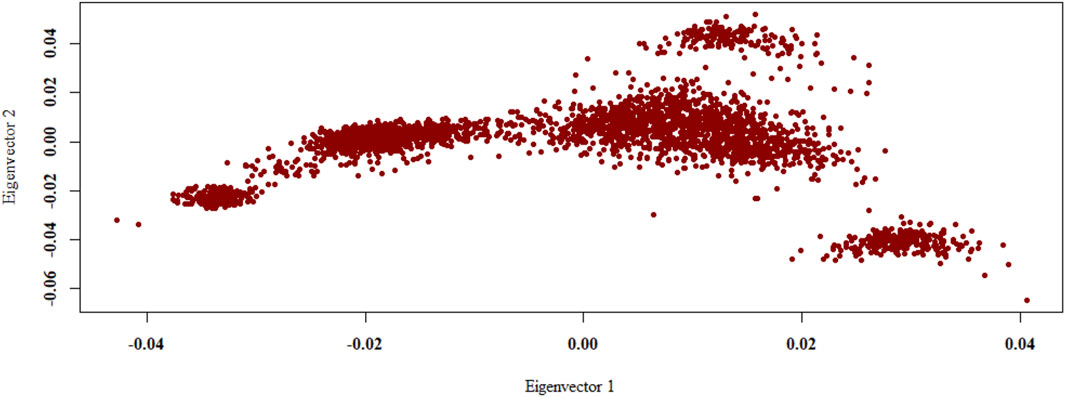
Figure 3. Population structure from the principal component analysis. Population structure is shown as a plot of the first two principal components (PCs). PCA was conducted with the 8,686,483 loci for 3,016 cows.
GWAS results
Due to the highest genetic correlation estimates being observed between adjacent test days, we only displayed the Manhattan plot of TD7 for all six traits (Figure 4). The Manhattan plot of TD35, TD50, TD140, and TD280 for all six traits are shown in Supplementary Figures S3–S6. The QQ plots are shown in Supplementary Figure S7. The lambda values ranged from 0.921 to 1.042, indicating lower stratification. TD7, TD35, TD50, TD140, and TD280 represented different physiological stages of the mammary gland across lactation (TD7 represented the early, TD50 represented the peak, and TD140 and TD280 represented mid and late lactation, respectively).
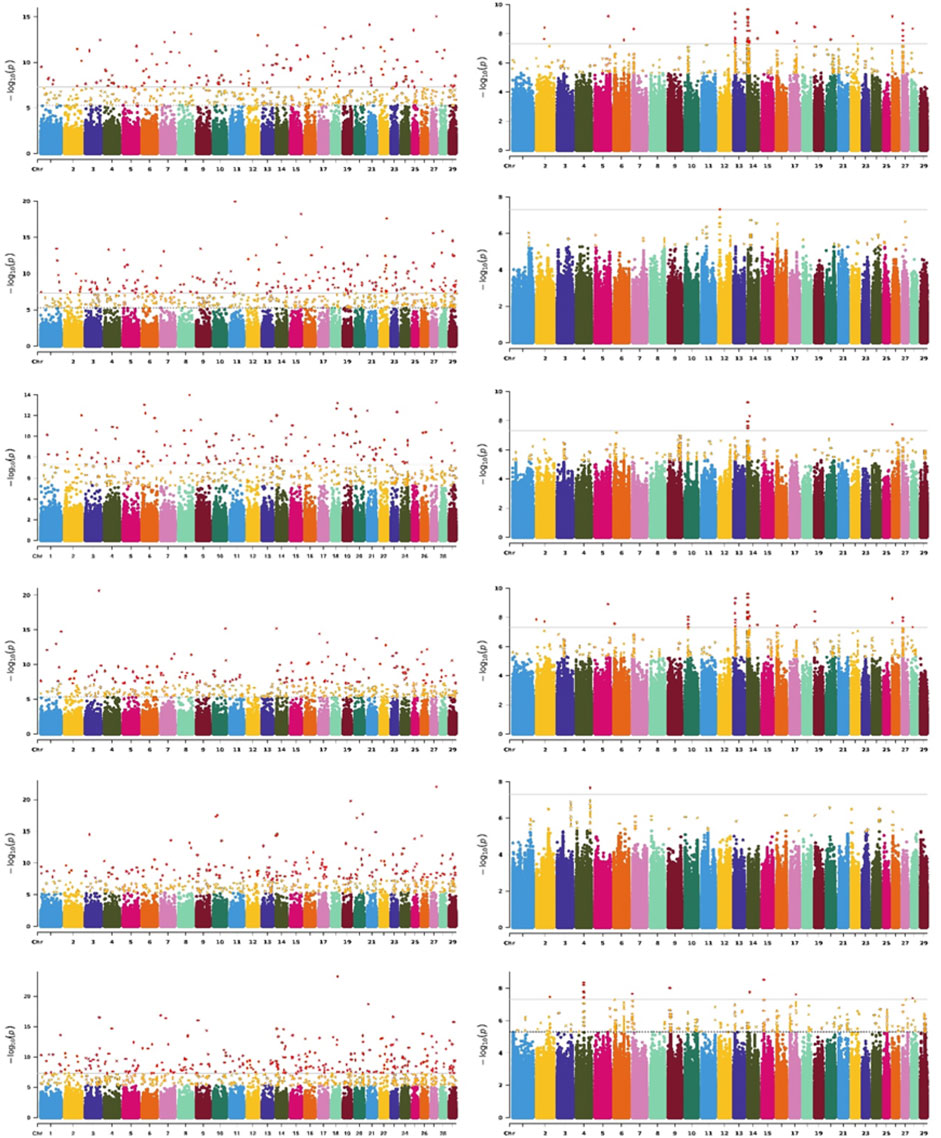
Figure 4. Significance
We used p-value < 5 × 10⁻⁸ as the threshold, a total of 984, 1,150, 1,291, 1,229, 1,018, and 1,477 significant SNPs detected by FarmCPU for all DIM of MY, FP, FY, PP, PY, and SCS, respectively. 279, 429, 36, 175, 85, and 42 SNPs were identified as significant by MLM for all DIM of MY, FP, FY, PP, PY, and SCS, respectively (Supplementary Table S2 and S3). There are 44, 30, 20, 16, 26, and 41 significant SNPs are both detected by FarmCPU and MLM for all DIM of MY, FP, FY, PP, PY, and SCS, respectively (Supplementary Table S4). We combined the significant SNPs identified by FarmCPU and MLM. Finally, we obtained a total of 1,241, 1,568, 1,316, 1,399, 1,087, and 1,503 significant SNPs (Supplementary Table S5). These findings are consistent with the results of genetic correlation, a large number of the same SNPs were found in mid and late lactation, while the SNPs found in early and peak lactation were mostly specific. The genes that were located within 150 Kb near the significant SNPs were identified as potential candidate genes for the traits investigated. The number of candidate genes identified is listed in Table 2.
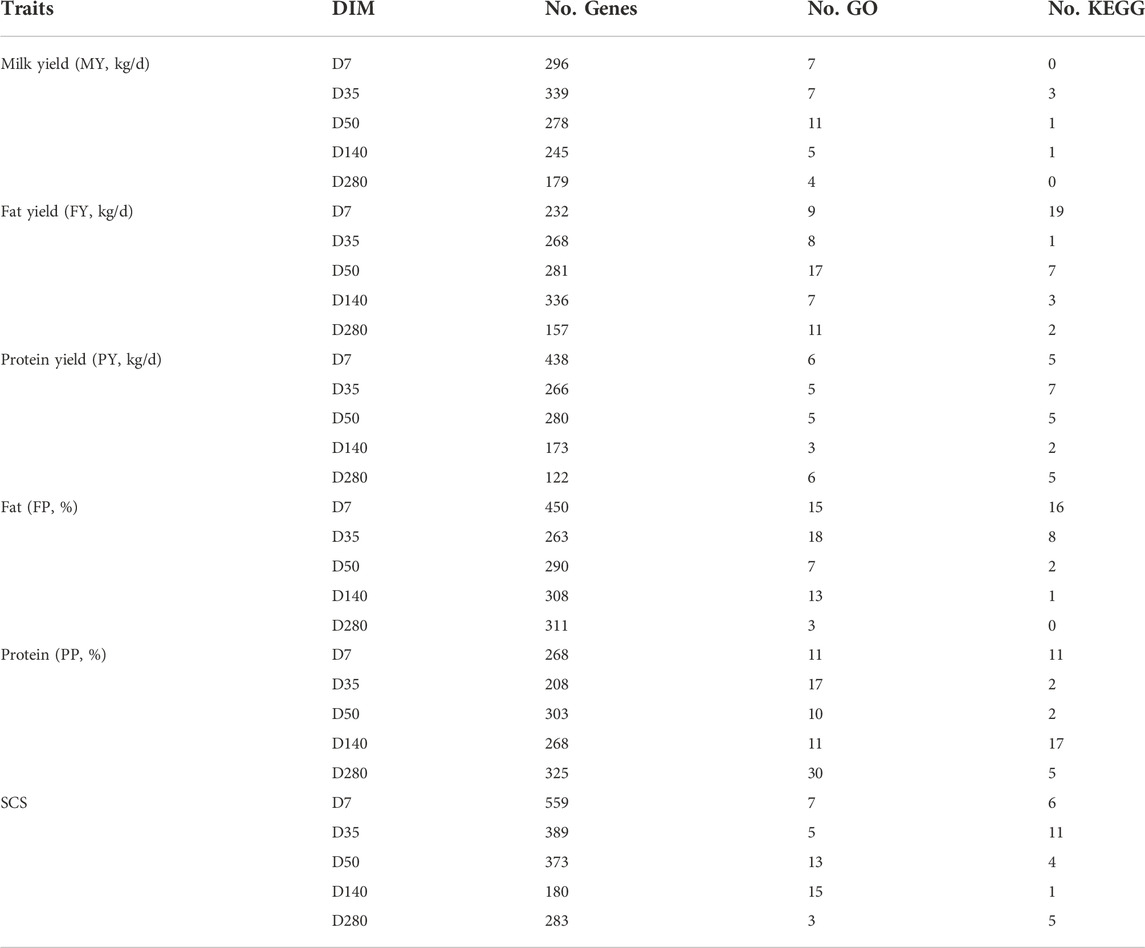
Table 2. Summary statistics for GO and KEGG associated with milk production in Shanghai Holstein population.
We paid more attention to the candidate genes which contained or were near to the most significant SNPs associated with different milk production in five lactation stages (TD7, TD35, TD50, TD140, and TD280). For MY, the candidate genes contained the most significant SNPs for TD7, TD35, TD50, TD140, and TD280 were GRM4, VEPH1, SCRIB, PLBD1, and LAMA3, respectively. For FP, the candidate genes contained the most significant SNPs for TD7, TD35, TD50, TD140, and TD280 were ATP2B2, NRP1, BOP1, DGAT1, and DGAT1, respectively. The most significant SNP associated with FP at early lactation was BTA22:55263235 (p-value = 2.37E-18). The most significant SNPs for FP at mid and late lactation both were BTA14:1801116 (for TD140: p-value = 6.96E-56; for TD280:p-value = 7.47E-59). For FY, the candidate genes contained the most significant SNPs for TD7, TD35, TD50, TD140, and TD280 were DSP, MAML3, PRKG1, WDR34, and SLC1A3, respectively. For PP, the candidate genes contained the most significant SNPs for TD7, TD35, TD50, TD140, and TD280 were DCLK2, AHCTF1, OCLN, MROH1, and HSF1, respectively. The most significant SNP associated with PP at late lactation was BTA14:1807140 (p-value = 1.26E-17). For PY, the candidate genes contained the most significant SNPs for TD7, TD35, TD50, TD140, and TD280 were CTNND2, CSMD3, WWOX, ARHGAP10, and LMAN2L, respectively. For SCS, the candidate genes contained the most significant SNPs for TD7, TD35, TD50, TD140, and TD280 were NFKBIE, ABCF1, MYZAP, TTLL7, and DNAH9, respectively.
We further identified the genes which were candidate genes for more than two lactation stages or traits. For MY, there were 18 candidate genes for at least two lactation stages, including NDST4, ICAM2, KCNMA1, LRP5, KALRN, IQCA1, MANBA, SCRIB, COL22A1, MORN1, APBA2, ZMYND8, WWOX, BFAR, CECR2, GALNT16, SPOP, and CPEB3. For FP, a total of 20 candidate genes for at least two lactation stages contained significant SNPs, including DGAT1, ADAMTS3, ZKSCAN7, CTNNA3, CDH23, ELM O 1, SLC15A5, ESR1, NRP1, BOP1, RPH3A, ATRNL1, FAM21A, MGST1, USH2A, WDR87, SYNRG, RANBP17, ANKRD55, and PRIM2. For FY, 11 genes associated with at least two lactation stages. For PP, 18 genes involved in at least two lactation stages, including ZMYND8, AHCTF1, TSHR, RALYL, RYR2, ORC2, MAP1S, MT O 1, NRP1, TECPR2, LRP5, NADSYN1, SMC5, KCNQ5, MAP2K6, OCLN, PBX1, and PRKG1. For PY, 15 candidate genes involved in at least two lactation stages, including WWOX, TMEM132C, NDST4, GUCY1A2, CTNND2, MANBA, MCC, KCNIP1, ITGA2, CTNNA3, SCRIB, CCDC33, MACROD2, PITPNB, and FDXR. For SCS, 27 candidate genes involved in at least two lactation stages, including PCDH15, ELM O 1, LDB2, SH3GL2, COL22A1, NUDCD1, HMCN1, CCDC63, GALNS, ADTRP, C1QTNF7, LPAR1, MYZAP, PLCB1, SLC38A9, LANCL2, SLC35F3, DKK2, KCNIP4, TRIM11, RERG, ACOXL, DDX54, DNAH9, ERICH1, MTA1, and B3GALNT2.
Functional annotation of candidate genes
The p-value adjusted using the Bonferroni approach (p-value < 0.05) was considered to be the threshold value for significantly enriched GO terms and pathways. As shown in Table 2, the number of GO terms and KEGG pathways were significantly enriched for six milk production traits across lactation in Shanghai Holstein. In the current study, gene set enrichment analyses revealed that several terms, such as response to external stimulus (GO:0048870), detection of stimulus (GO:0051606), negative regulation of response to stimulus (GO:0048585), and development process were found for almost all traits in almost all lactation stages (Supplementary Table S6–S11). It is interesting that feeding behavior (GO:0007631) was identified for milk yield. For FP, the GO term analysis identified the immune effector process (GO:0002252) and immune response (GO:0003823) in peak lactation. In addition, sexual reproduction (GO:0019953) and reproductive process (GO:0022414) were identified in mid lactation (Supplementary Table S6). For MY, the GO terms were most involved in the biological process and cellular component, such as intracellular (GO:0005622), regulation of signaling (GO:0023051), and plasma membrane part (GO:0044459) (Supplementary Table S8). For PP, several GO terms related to the development and growth process were identified several in peak and late lactation. 2 GO terms related to reproduction were identified in late lactation (Supplementary Table S9). For SCS, response to chemical (GO:0042221) was identified in peak and mid lactation. In late lactation, the GO terms were related to growth (Supplementary Table S11). The pathways significantly enriched are listed in Supplementary Table S12–S17, of which several pathways were implicated in signal transduction, including the MAPK signaling pathway (bta04010), Rap1 signaling pathway (bta04015), Ras signaling pathway (bta04014), chemokine signaling pathway (bta04062), Jak-STAT signaling pathway (bta04630), oxytocin signaling pathway (bta04921), and sphingolipid signaling pathway (bta04071); one pathway, olfactory transduction (bta04740), was identified in PP in early lactation and SCS in peak and mid lactation and MY in mid lactation. One pathway was associated with PY, namely, inflammatory mediator regulation of TRP channels (bta04750).
The number and function of variants identified using QTL annotation are listed in Table 3. The significant SNPs associated with MY in late lactation and PP in mid and late lactation were mainly overlapped with milk-related and production-related QTL regions. The SNPs were identified variants and were used for subsequent analyses.
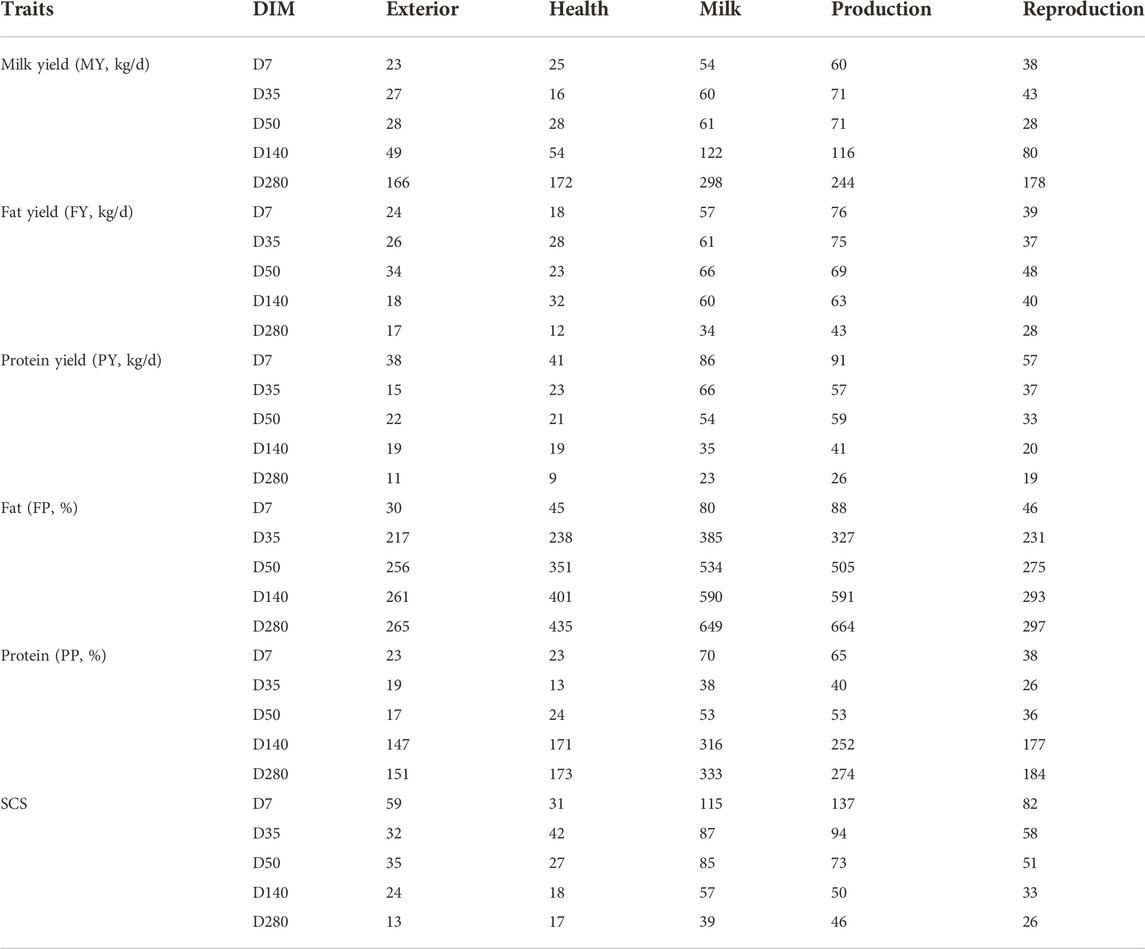
Table 3. Number of significant SNPs for QTL annotation with different DIM of milk production.
Discussion
In this research, we estimated various genetic parameters in a large population of Shanghai Holstein that had been regularly measured for six major dairy traits throughout lactation since 1995. This estimation was performed by using a random regression model for the first time in Shanghai. Currently, there are many studies for different Holstein populations (Buaban et al., 2021; Salimiyekta et al., 2021; Fathoni et al., 2022; Sungkhapreecha et al., 2022). We found that the genetic correlation between different test days for milk production was less than one, implying that the different test days had a different additive genetic variance. Oliveira H. et al. (2019) demonstrated that distinct genomic regions affect milk production traits across test days in a whole lactation (Oliveira H. R. et al., 2019). Compared with the genetic correlation estimated in this study, the genetic correlations between TD5 and TD7, TD95 to TD185, and TD245 to TD305 were all extremely high. This means that genetic improvement of one test day of milk production traits could result in a correlated response in the correlated traits. Although there have been many GWAS analyses of milk production traits, elucidating the molecular mechanisms of these traits in other populations can provide new insights into understanding the genetic basis of these traits in dairy cows. Our study subdivided milk production traits during lactation and, more precisely, found significant SNPs that affected different test days.
Currently, there are many studies on the submodels in the random regression test day model. The results of these studies showed that the lactation curves of milk production traits obtained by different researchers were also quite different (El Faro et al., 2008; Zhou and Zhang, 2021; Paiva et al., 2022). Since 1994, with the application of Legendre polynomials in the random regression test day model, research on its order has continued. Li J. et al. (2020) found that for local Chinese Holstein populations, models with third-, fourth-, and fifth-order of Legendre polynomials (LP) led to similar estimates of genetic parameters and predictive ability. Models with higher order obtained lower Akaike information criterion (AIC) and Bayesian information criterion (BIC) values, which was in line with previous studies (Pereira et al., 2013). This means models with LP5 fit data best regardless of complexity. Costa et al. (2008) used fifth-order Legendre polynomial to fit two random effects. Also, RRM based on Legendre polynomials is sensitive to too few records per cow, especially for estimating extreme values of the lactation curve. At the same time, to avoid non-convergence in the RRM due to too few records per cow, we eliminated individuals with fewer than three records when filtering the data.
In our study, except for FP, other traits showed that heritability reached its maximum in early lactation. The heritability of MY varied from 0.16 to 0.27, with the lowest value in peak lactation. In general, the trend for MY heritabilities was like the trend found by Kheirabadi (2019) and Jamrozik and Schaeffer (2012). Kheirabadi (2019) reported that the heritabilities of MY increased with stage of lactation from 0.05 to 0.09 for DIM 5 to 0.24 to 0.25 for DIM 305 for the Iran Holstein population. Jamrozik and Schaeffer (2012) reported that the heritabilities expressed daily were relatively uniform across DIM, except for DIM ranging from 5 to 25. Several studies have reported that the heritabilities of MY in early and late lactation were larger than the value in peak lactation, which is consistent with our results. SCS can reflect the health of the mammary glands, but the low heritability of SCS is an important factor limiting mastitis-resistant breeding. In our research, the heritabilities for DIM ranged from 0.04 (TD51) to 0.14 (TD5). Jamrozik and Schaeffer (2012) found that SCS reached a maximum value in the early lactation, then gradually decreased, and reached a minimum at the peak lactation, then increased steadily and slowly across the lactation. Zakizadeh and Jafari (2014) reported that the heritabilities varied from 0.04 (in early lactation) to 0.136 (in late lactation) for SCS.
We analyzed the genetic correlation between different test days and found that it was highest (close to 1) on adjacent test days but gradually decreased with increasing DIM intervals, which was consistent with previous studies. Jakobsen et al. (2002a) found a genetic correlation between different test days greater than 0.4 (Jakobsen et al., 2002b). Elahi Torshizi et al. (2016) reported that the genetic correlation between different test days varied from 0.47 to 0.98 (Elahi Torshizi, 2016). There was a significant negative genetic correlation between milk production traits in early and late lactation. These negative genetic correlations may be due to difficulties in modeling milk production traits in early lactation when cows are experiencing postpartum stress and lack of energy. Soumri et al. (2020) found the genetic correlation for SCS between test days from -0.11 to 0.99 by using fifth-order Legendre polynomial to fit random effects, which is like the findings in our research (-0.02 to 0.99 across the whole lactation for SCS) (Soumri et al., 2020). The genetic correlation for different DIM is not 1, which means that the additive genetic variance in different DIM is different, which also means that the RRM is used to analyze longitudinal data (e.g., milk production traits). Also, the extremely high genetic correlation between TD95 to TD185 and TD245 to TD305 can explain why the measurement and recording of milk production traits during some test days can be simplified without compromising the reliability of parameter estimates using the RRM.
SNP chips are customized chips based on existing SNP information, and new SNP cannot be found. The coverage of genotyping-by-sequencing accounts for only about 5% of the whole genome and many SNPs are missed. WGS can find SNPs on a genome-wide scale without causing the omission of SNPs (Ye et al., 2018). Compared with SNP chips and GBS, GWAS based on WGS has significant advantages, including that WGS is based on the entire genome to scan and detect SNPs, and the mapping is more accurate (Wu et al., 2019). Therefore, the use of WGS data is expected to improve the detection of QTL, such as the GWAS by using 234 bulls’ WGS data in the 1000 Bull Genomes Project (Daetwyler et al., 2014). Although the cost of WGS has decreased, sequencing a large number of individuals for WGS data is still exorbitant. With the development of genotype imputation software, a low-cost method to increase the number of animals with WGS data has been proposed by imputing the lower-density microarray data to the WGS level. Recently, GWAS using imputed WGS data has been widely used in different livestock, such as pigs (Li X. et al., 2020), chickens (Ni et al., 2017; Visscher et al., 2017), cattle (Van Binsbergen et al., 2015; Zhang et al., 2016), and horses (Asadollahpour Nanaei et al., 2020). Especially for cattle, many studies have detected significant important candidate genes by using imputed WGS data in GWAS (Chen N. et al., 2018). In our research, we imputed low- and medium-density SNP chips and GGRS by using a high-coverage WGS-based imputation reference panel (222 bulls from Run 2 of the 1000 Bull Genome project) to WGS data, which is consistent with imputation strategies used in other studies. It has been shown that the use of imputed WGS data in cattle is effective in detecting significant SNPs peaks that were not previously found when using high-density SNP chips in GWAS (Yoshida and Yáñez, 2022). Simultaneously, some authors detected significant SNPs in almost all autosomes by using the imputed WGS data to conduct GWAS on milk production traits, which is in line with our results. In this study, these SNPs identified on different DIM partially overlapped (Sanchez et al., 2017). At the same time, we used a very strict significance threshold (Bonferroni correction treats all variants as independent) that may reduce detection power but minimizes the risk of false positive QTLs.
The genes found in at least two lactation stages or traits and contained or near the most significant SNPs associated with milk production traits were the most important candidate genes in our study. For all six traits studied, there are many common candidate genes detected in TD35 and TD50, such as seven genes among 20 candidate genes for FP, which may be due to the relatively close lactation interval of TD35 and TD50, and the high genetic correlation (greater than 0.9); thus, the mechanisms affecting the traits are similar. NDST4 is associated with milk fever in the U.S. Holstein cattle (Cavani et al., 2022). In a previous study of milk production traits in Canadian Holstein at different lactation stages, SCRIB on BTA14 was a candidate gene for MY and was associated with TD95 to TD215 of PY (Oliveira et al., 2018). Jiang et al. (2010) found that COL22A1 was an important candidate gene for MY, FP, and PY by conducting GWAS in Chinese Holstein cattle (Jiang et al., 2010). DGAT1 was detected in the mid and late lactation of FP, which mainly had positive effects on FY and negative effects on MY and PY. Studies have reported that MGST1 and SLC15A5 are associated with FY (Jiang et al., 2019). ADAMTS3 was detected in early, mid, and late lactation, and ADAMTS3 has been reported to be associated with MY and PY. It is worth noting that ADAMTS3 is also significantly associated with the longevity of cows (Mészáros et al., 2014). TECPR2 is related to the heat resistance traits of Chinese cattle, and SNPs located in the gene can be used as molecular markers for Chinese cattle breeding (Ma et al., 2021). Also, TECPR2 was found to be a candidate gene for SCS in Thai Holstein cattle (Buaban et al., 2022). PRKG1 plays a key role in lipolysis and is an important candidate gene for fatty acids in milk (Shi et al., 2019, 1). Meanwhile, PRKG1 was associated with tick resistance in cattle. Our study further supports the importance of this gene in disease resistance traits (Alshawi et al., 2019). TMEM132C, CTNND2, and PCDH15 have been found to be associated with milk production traits (Yodklaew et al., 2017, 2017; Gan et al., 2020). HMCN1 is known to be associated with age-related macular degeneration, and polymorphisms within the HMCN1 gene are associated with diabetes in humans (Fisher et al., 2007). This reflects a consistent increase in SCS with age and the progression of lactation, which is consistent with the findings of this study. DKK2 is involved in adipocyte lipogenesis, which may play a role in fat secretion in milk (Li et al., 2010). ACOXL is associated with lipid metabolism and glucose pathways (Klein et al., 2020). PLCB1 plays multiple biological roles in human diseases, such as inflammation, cell proliferation, and schizophrenia. DNAH9 affects milk’s volatile fatty acid content (Nakamura et al., 2018). B3GALNT2 was found in a GWAS study of milk production traits in Danish Jersey and Holstein cattle by Poulsen et al. (Buitenhuis et al., 2014). A previous study showed that ATP2B2 is associated with milk production traits and mastitis (Ogorevc et al., 2009), and the most significant SNP (BTA22:55263235, p-value = 2.37E-18) in the GWAS of TD7 FP is located in the intronic region of ATP2B2. PLBD1 is an important candidate gene for fatty acid composition in milk (Atashi et al., 2020). The most significant SNP for PP of TD280 was BTA14:1807140 with a p-value = 1.26E-17, which was located on HSF1, and HSF1 plays a crucial role in heat stress response. A previous study found an SNP in the 3′-UTR (g.4693G>T) of HSF1 that was related to thermo tolerance in Chinese Holstein cattle through association analysis (Li et al., 2011). NFKBIE may control the response to several bacterial and viral pathogens and vaccine responses (Lundbo et al., 2016).
Only a few studies have focused on time-dependent genetic associations in livestock to date, but the investigation of the association at certain lactation stages seems to be a promising approach to detect loci associated with milk production (Strucken et al., 2012). Thus, we analyzed how the genetic influence of genomic regions changes during the most critical stages of lactation in our study. We found that the genetic influence on milk production traits varies throughout lactation, which is crucial to enable more efficient genetic selection for these traits and for better management practices, especially for farms or breeders to select high-yielding or milk long-lasting dairy cows. Milk production is related to the stage of lactation, including early lactation, peak lactation, mid lactation, and late lactation. Early lactation is known to be a critical period, especially in high-yielding dairy cows (Deng et al., 2019). Selecting for maximum milk production during lactation early in lactation would improve persistency by lowering the rate of decrease after peak yield (Ferris et al., 1985). Peak milk yield plays a decisive role during the whole lactation period. Zhang et al. (2019) reported that for every 1 kg increase in peak milk production, the yield per primiparous cow increases by about 400 kg. The effect of heat stress on milk yield has been shown to be highest in mid or late lactation. Different genes may be involved in handling different disturbances, explaining the genetic difference among the milk production traits in different lactation stages (Poppe et al., 2021). Candidate genes were only detected at the beginning of lactation showed that the impact on milk production traits must be diminishing in late lactation and suggested that these genes are associated with lactogenesis at the onset of lactation. Candidate genes were detected for all stages of lactation, which could therefore play a role in the immune response of the mammary gland and prevents inflammation during lactation (Strucken et al., 2012). We can use a genomic selection model that combines with markers (significantly associated with different stages of lactation) fit as fixed effects selected from the results of a GWAS (Yin et al., 2020). For example, MROH1, an important candidate gene for milk protein composition, is located in a 1.85–2.11 Mb region on BTA14 that has been shown to be associated with 305-days and peak milk production in cows. In addition, the model for selecting is also important. RRM is a feasible alternative to yield more accurate selection and culling decisions. RRM provides information about the temporal variation of biological processes underlying the studied traits to exploit for management and breeding purposes (Oliveira H. et al., 2019).
Conclusion
In our study, an RRM with fifth-order of Legendre polynomials was an appropriate model for genetic evaluation of six milk production traits in Shanghai Holstein populations. The main results showed that genetic parameters and breeding values were successfully estimated. The results of genetic correlations demonstrated that combining the milk production traits tested on different lactation into a single trait can lead to inaccurate estimates of the genetic value of dairy cows. At the same time, the measurement and recording of milk for some adjacent lactation periods can be simplified without affecting the reliability of parameter estimation using RRM. Then, we detected significant SNPs and candidate genes associated with different traits in different lactation stages, mainly including milk-related genes (DGAT1, MGST1, PTK2, SCRIB, PRKG1, CTNND2, MROH1, ATP2B2, and DNAH9), disease-related genes (LY6K, COL22A1, TECPR2, KALRN, CYP7B1, HMCN1, and PLCB1), heat stress–related genes (ITGA9, NDST4, TECPR2, and HSF1), and reproduction-related genes (7SK and DOCK2). The genes and QTLs related to heat stress are important to investigate the mechanism of response to heat stress, such as ITGA9, which can act as an important gene for heat-resistant breeding of Shanghai Holstein.
Data availability statement
The data presented in the study are deposited in the Alphaindex repository (http://alphaindex.zju.edu.cn/alphaindex/index.php).
Ethics statement
The animal study was reviewed and approved by the Institutional Animal Care and Use Committee of Shanghai Jiao Tong University.
Author contributions
Conceptualization: DL and PM; Data curation: DL, SW, and TL; Formal analysis: DL; Methodology: DL, PM, and WZ; Software: DL; Supervision: YP; Writing—original draft: DL; Writing—review & editing: QW, YP, KZ, GL, XZ, and ZX.
Funding
The author(s) declare that financial support was received for the research and/or publication of this article. The project was supported by the Natural Science Foundation of Shanghai (22ZR1431500), the National Natural Science Foundation (Grant Nos 31872321, 31941007, 31972534, and 31701077), the Multidisciplinary Cross Research Foundation of Shanghai Jiao Tong University (Grant No. ZH2018QNA42), and the Fundamental Research Funds for the Central Universities (No. 2662020DKPY005).
Conflict of interest
Authors KZ, GL and XZ were employed by the company Shanghai Dairy Cattle Breeding Centre Co, Ltd.
The remaining authors declare that the research was conducted in the absence of any commercial or financial relationships that could be construed as a potential conflict of interest.
Publisher’s note
All claims expressed in this article are solely those of the authors and do not necessarily represent those of their affiliated organizations, or those of the publisher, the editors, and the reviewers. Any product that may be evaluated in this article, or claim that may be made by its manufacturer, is not guaranteed or endorsed by the publisher.
Supplementary material
The Supplementary Material for this article can be found online at: https://www.frontiersin.org/articles/10.3389/fgene.2022.940650/full#supplementary-material
References
Aerts, J., Piwczyński, D., Ghiasi, H., Sitkowska, B., Kolenda, M., and Önder, H. (2021). Genetic parameters estimation of milking traits in polish holstein-friesians based on automatic milking system data. Animals. 11, 1943. doi:10.3390/ani11071943
Akanno, E., and Ibe, S. (2005). Estimates of genetic parameters for growth traits of domestic rabbits in the humid tropics. Livest. Res. Rural Dev. 17, 86.
Alshawi, A., Essa, A., Al-Bayatti, S., and Hanotte, O. (2019). Genome analysis reveals genetic admixture and signature of selection for productivity and environmental traits in Iraqi cattle. Front. Genet. 10, 609. doi:10.3389/fgene.2019.00609
Asadollahpour Nanaei, H., Ayatollahi Mehrgardi, A., and Esmailizadeh, A. (2020). Whole-genome sequence analysis reveals candidate genomic footprints and genes associated with reproductive traits in Thoroughbred horse. Reproduction Domest. Animals 55, 200–208. doi:10.1111/rda.13608
Atashi, H., Salavati, M., De Koster, J., Ehrlich, J., Crowe, M., Opsomer, G., et al. (2020). Genome-wide association for milk production and lactation curve parameters in Holstein dairy cows. J. Animal Breed. Genet. 137, 292–304. doi:10.1111/jbg.12442
Bignardi, A. B., El Faro, L., Cardoso, V. L., Machado, P. F., and de Albuquerque, L. G. (2009). Random regression models to estimate test-day milk yield genetic parameters Holstein cows in Southeastern Brazil. Livest. Sci. 123, 1–7. doi:10.1016/j.livsci.2008.09.021
Browning, B. L., and Browning, S. R. (2009). A unified approach to genotype imputation and haplotype-phase inference for large data sets of trios and unrelated individuals. Am. J. Hum. Genet. 84, 210–223. doi:10.1016/j.ajhg.2009.01.005
Buaban, S., Lengnudum, K., Boonkum, W., and Phakdeedindan, P. (2022). Genome-wide association study on milk production and somatic cell score for Thai dairy cattle using weighted single-step approach with random regression test-day model. J. Dairy Sci. 105, 468–494. doi:10.3168/jds.2020-19826
Buaban, S., Prempree, S., Sumreddee, P., Duangjinda, M., and Masuda, Y. (2021). Genomic prediction of milk-production traits and somatic cell score using single-step genomic best linear unbiased predictor with random regression test-day model in Thai dairy cattle. J. Dairy Sci. 104, 12713–12723. doi:10.3168/jds.2021-20263
Buitenhuis, B., Janss, L. L., Poulsen, N. A., Larsen, L. B., Larsen, M. K., and Sørensen, P. (2014). Genome-wide association and biological pathway analysis for milk-fat composition in Danish Holstein and Danish Jersey cattle. BMC Genomics 15, 1112. doi:10.1186/1471-2164-15-1112
Cavani, L., Poindexter, M. B., Nelson, C. D., Santos, J. E. P., and Peñagaricano, F. (2022). Gene mapping, gene-set analysis, and genomic prediction of postpartum blood calcium in Holstein cows. J. Dairy Sci. 105, 525–534. doi:10.3168/jds.2021-20872
Chen, N., Cai, Y., Chen, Q., Li, R., Wang, K., Huang, Y., et al. (2018a). Whole-genome resequencing reveals world-wide ancestry and adaptive introgression events of domesticated cattle in East Asia. Nat. Commun. 9, 2337. doi:10.1038/s41467-018-04737-0
Chen, S., Zhou, Y., Chen, Y., and Gu, J. (2018b). fastp: an ultra-fast all-in-one FASTQ preprocessor. Bioinformatics 34, i884–i890. doi:10.1093/bioinformatics/bty560
Chen, Z., Yao, Y., Ma, P., Wang, Q., and Pan, Y. (2018c). Haplotype-based genome-wide association study identifies loci and candidate genes for milk yield in Holsteins. PLoS One 13, e0192695. doi:10.1371/journal.pone.0192695
Costa, A., Schwarzenbacher, H., Mészáros, G., Fuerst-Waltl, B., Fuerst, C., Sölkner, J., et al. (2019). On the genomic regions associated with milk lactose in Fleckvieh cattle. J. Dairy Sci. 102, 10088–10099. doi:10.3168/jds.2019-16663
Costa, C. N., Melo, C. M. R. de, Packer, I. U., Freitas, A. F. de, Teixeira, N. M., and Cobuci, J. A. (2008). Genetic parameters for test day milk yield of first lactation Holstein cows estimated by random regression using Legendre polynomials. R. Bras. Zootec. 37, 602–608. doi:10.1590/s1516-35982008000400003
Daetwyler, H. D., Capitan, A., Pausch, H., Stothard, P., van Binsbergen, R., Brøndum, R. F., et al. (2014). Whole-genome sequencing of 234 bulls facilitates mapping of monogenic and complex traits in cattle. Nat. Genet. 46, 858–865. doi:10.1038/ng.3034
Davies, R. W., Flint, J., Myers, S., and Mott, R. (2016). Rapid genotype imputation from sequence without reference panels. Nat. Genet. 48, 965–969. doi:10.1038/ng.3594
Deng, T., Liang, A., Liang, S., Ma, X., Lu, X., Duan, A., et al. (2019). Integrative analysis of transcriptome and GWAS data to identify the hub genes associated with milk yield trait in buffalo. Front. Genet. 10, 36. doi:10.3389/fgene.2019.00036
El Faro, L., Cardoso, V. L., and Albuquerque, L. G. de (2008). Variance component estimates applying random regression models for test-day milk yield in Caracu heifers (Bos taurus Artiodactyla, Bovidae). Genet. Mol. Biol. 31, 665–673. doi:10.1590/s1415-47572008000400011
Elahi Torshizi, M. (2016). Effects of season and age at first calving on genetic and phenotypic characteristics of lactation curve parameters in Holstein cows. J. Anim. Sci. Technol. 58, 8. doi:10.1186/s40781-016-0089-1
Fathoni, A., Boonkum, W., Chankitisakul, V., and Duangjinda, M. (2022). An appropriate genetic approach for improving reproductive traits in crossbred Thai–Holstein cattle under heat stress conditions. Vet. Sci. 9, 163. doi:10.3390/vetsci9040163
Ferreri, M., Gao, J., Wang, Z., Chen, L., Su, J., and Han, B. (2011). Chinese Holstein cattle shows a genetic contribution from native asian cattle breeds: A study of shared haplotypes and demographic history. Asian-Australas. J. Anim. Sci. 24, 1048–1052. doi:10.5713/ajas.2011.10461
Ferris, T. A., Mao, I. L., and Anderson, C. R. (1985). Selecting for lactation curve and milk yield in dairy cattle. J. Dairy Sci. 68, 1438–1448. doi:10.3168/jds.S0022-0302(85)80981-4
Fisher, S. A., Rivera, A., Fritsche, L. G., Keilhauer, C. N., Lichtner, P., Meitinger, T., et al. (2007). Case–control genetic association study of fibulin-6 (FBLN6 or HMCN1) variants in age-related macular degeneration (AMD). Hum. Mutat. 28, 406–413. doi:10.1002/humu.20464
Gan, Q., Li, Y., Liu, Q., Lund, M., Su, GuoSheng., and Liang, XueWu. (2020). Genome-wide association studies for the concentrations of insulin, triiodothyronine, and thyroxine in Chinese Holstein cattle. Trop. Anim. Health Prod. 52, 1655–1660. doi:10.1007/s11250-019-02170-z
Huang, J., Wang, H., Wang, C., Li, J., Li, Q., Hou, M., et al. (2010). Single nucleotide polymorphisms, haplotypes and combined genotypes of lactoferrin gene and their associations with mastitis in Chinese Holstein cattle. Mol. Biol. Rep. 37, 477–483. doi:10.1007/s11033-009-9669-1
Iheshiulor, O., Woolliams, J. A., Yu, X., Wellmann, R., and Meuwissen, T. (2016). Within- and across-breed genomic prediction using whole-genome sequence and single nucleotide polymorphism panels. Genet. Sel. Evol. 48, 15. doi:10.1186/s12711-016-0193-1
Jakobsen, J. H., Madsen, P., Jensen, J., Pedersen, J., Christensen, L. G., and Sorensen, D. A. (2002a). Genetic parameters for milk production and persistency for Danish holsteins estimated in random regression models using REML. J. Dairy Sci. 85, 1607–1616. doi:10.3168/jds.S0022-0302(02)74231-8
Jakobsen, J. H., Madsen, P., Jensen, J., Pedersen, J., Christensen, L. G., and Sorensen, D. A. (2002b). Genetic parameters for milk production and persistency for Danish holsteins estimated in random regression models using REML. J. Dairy Sci. 85, 1607–1616. doi:10.3168/jds.S0022-0302(02)74231-8
Jamrozik, J., and Schaeffer, L. R. (2012). Test-day somatic cell score, fat-to-protein ratio and milk yield as indicator traits for sub-clinical mastitis in dairy cattle: Indicator traits for sub-clinical mastitis. J. Animal Breed. Genet. 129, 11–19. doi:10.1111/j.1439-0388.2011.00929.x
Ji, J., Yan, G., Chen, D., Xiao, S., Gao, J., and Zhang, Z. (2019). An association study using imputed whole-genome sequence data identifies novel significant loci for growth-related traits in a Duroc × Erhualian F2 population. J. Animal Breed. Genet. 136, 217–228. doi:10.1111/jbg.12389
Jiang, J., Liu, J., Sun, D., Ma, P., Ding, X., Yu, Y., et al. (2010). Genome wide association studies for milk production traits in Chinese holstein population. PLoS One 5, e13661. doi:10.1371/journal.pone.0013661
Jiang, J., Ma, L., Prakapenka, D., VanRaden, P. M., Cole, J. B., and Da, Y. (2019). A large-scale genome-wide association study in U.S. Holstein cattle. Front. Genet. 10, 412. doi:10.3389/fgene.2019.00412
Jiang, L., Jiang, J., Wang, J., Ding, X., Liu, J., and Zhang, Q. (2012). Genome-wide identification of copy number variations in Chinese Holstein. PLOS ONE 7, e48732. doi:10.1371/journal.pone.0048732
Khanzadeh, H., Hossein-Zadeh, N. G., and Naserani, M. (2013). Estimation of genetic parameters and trends for milk fat and protein percentages in Iranian Holsteins using random regression test day model. Arch. Anim. Breed. 56, 487–496. doi:10.7482/0003-9438-56-047
Kheirabadi, K. (2019). Estimates of genetic trends for daily milk yield and somatic cell score of primiparous Holstein cattle in Iran. J. Appl. Animal Res. 47, 467–473. doi:10.1080/09712119.2019.1663741
Klein, S.-L., Scheper, C., May, K., and König, S. (2020). Genetic and nongenetic profiling of milk β-hydroxybutyrate and acetone and their associations with ketosis in Holstein cows. J. Dairy Sci. 103, 10332–10346. doi:10.3168/jds.2020-18339
Li, H. (2011). A statistical framework for SNP calling, mutation discovery, association mapping and population genetical parameter estimation from sequencing data. Bioinformatics 27, 2987–2993. doi:10.1093/bioinformatics/btr509
Li, H., and Durbin, R. (2010). Fast and accurate long-read alignment with Burrows–Wheeler transform. Bioinformatics 26, 589–595. doi:10.1093/bioinformatics/btp698
Li, H., Wang, Z., Moore, S., Schenkel, F., and Stothard, P. (2010). “Genome-wide scan for positional and functional candidate genes affecting milk production traits in Canadian Holstein cattle,” in Proc 9th WCGALP (Leipzig, Germany: Springer), 26.
Li, J., Gao, H., Madsen, P., Li, R., Liu, W., Bao, P., et al. (2020a). Impact of the order of Legendre polynomials in random regression model on genetic evaluation for milk yield in dairy cattle population. Front. Genet. 11, 586155. doi:10.3389/fgene.2020.586155
Li, Q.-L., Ju, Z.-H., Huang, J.-M., Li, J.-B., Li, R.-L., Hou, M.-H., et al. (2011). Two novel SNPs in HSF1 gene are associated with thermal tolerance traits in Chinese Holstein cattle. DNA Cell Biol. 30, 247–254. doi:10.1089/dna.2010.1133
Li, X., Ye, J., Han, X., Qiao, R., Li, X., Lv, G., et al. (2020b). Whole-genome sequencing identifies potential candidate genes for reproductive traits in pigs. Genomics 112, 199–206. doi:10.1016/j.ygeno.2019.01.014
Liu, D., Chen, Z., Zhang, Z., Sun, H., Ma, P., Zhu, K., et al. (2019). Detection of genome-wide structural variations in the Shanghai Holstein cattle population using next-generation sequencing. Asian-Australas. J. Anim. Sci. 32, 320–333. doi:10.5713/ajas.18.0204
Liu, D., Chen, Z., Zhao, W., Guo, L., Sun, H., Zhu, K., et al. (2021). Genome-wide selection signatures detection in Shanghai Holstein cattle population identified genes related to adaption, health and reproduction traits. BMC Genomics 22, 747. doi:10.1186/s12864-021-08042-x
Liu, L., Zhou, J., Chen, C. J., Zhang, J., Wen, W., Tian, J., et al. (2020). GWAS-based identification of new loci for milk yield, fat, and protein in Holstein cattle. Animals. 10, 2048. doi:10.3390/ani10112048
Liu, X., Huang, M., Fan, B., Buckler, E. S., and Zhang, Z. (2016). Iterative usage of fixed and random effect models for powerful and efficient genome-wide association studies. PLoS Genet. 12, e1005767. doi:10.1371/journal.pgen.1005767
López-Romero, P., and Carabaño, M. J. (2003). Comparing alternative random regression models to analyse first lactation daily milk yield data in Holstein–Friesian cattle. Livest. Prod. Sci. 82, 81–96. doi:10.1016/s0301-6226(03)00003-4
Lundbo, L. F., Harboe, Z. B., Clausen, L. N., Hollegaard, M. V., Sørensen, H. T., Hougaard, D. M., et al. (2016). Genetic variation in NFKBIE is associated with increased risk of pneumococcal meningitis in children. EBioMedicine 3, 93–99. doi:10.1016/j.ebiom.2015.11.048
Ma, X., Liu, Y., Sun, L., Hanif, Q., Qu, K., Liu, J., et al. (2021). A novel SNP of TECPR2 gene associated with heat tolerance in Chinese cattle. Anim. Biotechnol. 0, 1–8. doi:10.1080/10495398.2021.2011305
Madsen, P. (2012). “DMU trace, a program to trace the pedigree for a subset of animals from a large pedigree file,” in Center for quantitative genetics and genomics, department of molecular biology and genetics, aarhus university (Aarhus, Denmark: DMU).
Mao, J. (2015). Genetic analysis between type traits, milk production traits, SCS and longevity traits of Holstein cattle in Shanghai. Nangjing: Nangjing Agriculture University.
Mbuthia, J. M., Mayer, M., and Reinsch, N. (2021). Modeling heat stress effects on dairy cattle milk production in a tropical environment using test-day records and random regression models. Animal 15, 100222. doi:10.1016/j.animal.2021.100222
McKenna, A., Hanna, M., Banks, E., Sivachenko, A., Cibulskis, K., Kernytsky, A., et al. (2010). The genome analysis toolkit: A MapReduce framework for analyzing next-generation DNA sequencing data. Genome Res. 20, 1297–1303. doi:10.1101/gr.107524.110
Mészáros, G., Eaglen, S., Waldmann, P., and S, J. (2014). A genome wide association study for longevity in cattle. Open J. Genet. 04, 46–55. doi:10.4236/ojgen.2014.41007
Meuwissen, T., van den Berg, I., and Goddard, M. (2021). On the use of whole-genome sequence data for across-breed genomic prediction and fine-scale mapping of QTL. Genet. Sel. Evol. 53, 19. doi:10.1186/s12711-021-00607-4
Meyer, K. (1989). Estimation of genetic parameters. Rev. Mol. Quantitative Genet. Aproaches Honor Alan Robertson 1, 159–167.
Nakamura, H., Takahashi-Jitsuki, A., Makihara, H., Asano, T., Kimura, Y., Nakabayashi, J., et al. (2018). Proteome and behavioral alterations in phosphorylation-deficient mutant Collapsin Response Mediator Protein2 knock-in mice. Neurochem. Int. 119, 207–217. doi:10.1016/j.neuint.2018.04.009
Ni, G., Cavero, D., Fangmann, A., Erbe, M., and Simianer, H. (2017). Whole-genome sequence-based genomic prediction in laying chickens with different genomic relationship matrices to account for genetic architecture. Genet. Sel. Evol. 49, 8–14. doi:10.1186/s12711-016-0277-y
Ogorevc, J., Kunej, T., Razpet, A., and Dovc, P. (2009). Database of cattle candidate genes and genetic markers for milk production and mastitis. Anim. Genet. 40, 832–851. doi:10.1111/j.1365-2052.2009.01921.x
Oliveira, H., Brito, L., Lourenco, D., Silva, F., Jamrozik, J., Schaeffer, L., et al. (2019a). Invited review: Advances and applications of random regression models: From quantitative genetics to genomics. J. Dairy Sci. 102, 7664–7683. doi:10.3168/jds.2019-16265
Oliveira, H. R., Cant, J. P., Brito, L. F., Feitosa, F. L. B., Chud, T. C. S., Fonseca, P. A. S., et al. (2019b). Genome-wide association for milk production traits and somatic cell score in different lactation stages of Ayrshire, Holstein, and Jersey dairy cattle. J. Dairy Sci. 102, 8159–8174. doi:10.3168/jds.2019-16451
Oliveira, H., Silva, F., Brito, L., Jamrozik, J., Lourenco, D., and Schenkel, F. (2018). Genome-wide association study for milk, fat and protein yields in different lactation stages in Canadian Holstein and Jersey cattle. J. Dairy Sci. 102 (9), 8159–8174. doi:10.3168/jds.2019-16451
Paiva, J. T., Mota, R. R., Lopes, P. S., Hammami, H., Vanderick, S., Oliveira, H. R., et al. (2022). Random regression test-day models to describe milk production and fatty acid traits in first lactation Walloon Holstein cows. J. Animal Breed. Genet. 139, 398–413. doi:10.1111/jbg.12673
Pereira, R. J., Bignardi, A. B., El Faro, L., Verneque, R. S., Vercesi Filho, A. E., and Albuquerque, L. G. (2013). Random regression models using Legendre polynomials or linear splines for test-day milk yield of dairy Gyr (Bos indicus) cattle. J. Dairy Sci. 96, 565–574. doi:10.3168/jds.2011-5051
Pérez-Cabal, M. A., Vazquez, A. I., Gianola, D., Rosa, G. J. M., and Weigel, K. A. (2012). Accuracy of genome-enabled prediction in a dairy cattle population using different cross-validation layouts. Front. Genet. 3, 27. doi:10.3389/fgene.2012.00027
Poppe, M., Bonekamp, G., van Pelt, M. L., and Mulder, H. A. (2021). Genetic analysis of resilience indicators based on milk yield records in different lactations and at different lactation stages. J. Dairy Sci. 104, 1967–1981. doi:10.3168/jds.2020-19245
Salimiyekta, Y., Vaez-Torshizi, R., Abbasi, M. A., Emmamjome-Kashan, N., Amin-Afshar, M., Guo, X., et al. (2021). Random regression model for genetic evaluation and early selection in the Iranian Holstein population. Animals. 11, 3492. doi:10.3390/ani11123492
Sanchez, M.-P., Govignon-Gion, A., Croiseau, P., Fritz, S., Hozé, C., Miranda, G., et al. (2017). Within-breed and multi-breed GWAS on imputed whole-genome sequence variants reveal candidate mutations affecting milk protein composition in dairy cattle. Genet. Sel. Evol. 49, 68. doi:10.1186/s12711-017-0344-z
Schaeffer, L. R. (2004). Application of random regression models in animal breeding. Livest. Prod. Sci. 86, 35–45. doi:10.1016/S0301-6226(03)00151-9
Shao, B., Sun, H., Ahmad, M. J., Ghanem, N., Abdel-Shafy, H., Du, C., et al. (2021). Genetic features of reproductive traits in bovine and buffalo: Lessons from bovine to buffalo. Front. Genet. 12, 617128. doi:10.3389/fgene.2021.617128
Shi, L., Lv, X., Liu, L., Yang, Y., Ma, Z., Han, B., et al. (2019). A post-GWAS confirming effects of PRKG1 gene on milk fatty acids in a Chinese Holstein dairy population. BMC Genet. 20, 53. doi:10.1186/s12863-019-0755-7
Silva, D. A., Costa, C. N., Silva, A. A., Silva, H. T., Lopes, P. S., Silva, F. F., et al. (2020). Autoregressive and random regression test-day models for multiple lactations in genetic evaluation of Brazilian Holstein cattle. J. Anim. Breed. Genet. 137, 305–315. doi:10.1111/jbg.12459
Soumri, N., Carabaño, M. J., González-Recio, O., and Bedhiaf-Romdhani, S. (2020). Genetic parameters of somatic cell scores using random regression test-day models with Legendre polynomials in Tunisian dairy cattle. Livest. Sci. 241, 104178. doi:10.1016/j.livsci.2020.104178
Strucken, E. M., Bortfeldt, R. H., Tetens, J., Thaller, G., and Brockmann, G. A. (2012). Genetic effects and correlations between production and fertility traits and their dependency on the lactation-stage in Holstein Friesians. BMC Genet. 13, 108. doi:10.1186/1471-2156-13-108
Sun, X., Yang, J., and Luo, X. (2008). Correlation analysis of several milk producing traits measured by 305-day milk yield and production performance of Holstein cattle in Beijing. China Dairy Cattle 01, 24–26.
Sungkhapreecha, P., Chankitisakul, V., Duangjinda, M., Buaban, S., and Boonkum, W. (2022). Determining heat stress effects of multiple genetic traits in tropical dairy cattle using single-step genomic BLUP. Vet. Sci. 9, 66. doi:10.3390/vetsci9020066
Van Binsbergen, R., Calus, M. P., Bink, M. C., van Eeuwijk, F. A., Schrooten, C., and Veerkamp, R. F. (2015). Genomic prediction using imputed whole-genome sequence data in Holstein Friesian cattle. Genet. Sel. Evol. 47, 71–13. doi:10.1186/s12711-015-0149-x
Visscher, P. M., Wray, N. R., Zhang, Q., Sklar, P., Mccarthy, M. I., Brown, M. A., et al. (2017). 10 Years of GWAS discovery: Biology, function, and translation. Am. J. Hum. Genet. 101 (1), 5–22. doi:10.1016/j.ajhg.2017.06.005
Wolak, M. E. (2012). Nadiv: an R package to create relatedness matrices for estimating non-additive genetic variances in animal models. Methods Ecol. Evol. 3, 792–796. doi:10.1111/j.2041-210x.2012.00213.x
Wu, P., Wang, K., Zhou, J., Chen, D., Tang, G., Yang, X., et al. (2019). GWAS on imputed whole-genome resequencing from genotyping-by-sequencing data for farrowing interval of different parities in pigs. Front. Genet. 10, 1012. doi:10.3389/fgene.2019.01012
Yan, G., Liu, X., Xiao, S., Xin, W., Xu, W., Li, Y., et al. (2021). An imputed whole-genome sequence-based GWAS approach pinpoints causal mutations for complex traits in a specific swine population. Sci. China. Life Sci. 65, 781–794. doi:10.1007/s11427-020-1960-9
Yang, J., Lee, S. H., Goddard, M. E., and Visscher, P. M. (2011). Gcta: A tool for genome-wide complex trait analysis. Am. J. Hum. Genet. 88, 76–82. doi:10.1016/j.ajhg.2010.11.011
Yang, L., Yang, Q., Yi, M., Pang, Z. H., and Xiong, B. H. (2013). Effects of seasonal change and parity on raw milk composition and related indices in Chinese Holstein cows in northern China. J. Dairy Sci. 96, 6863–6869. doi:10.3168/jds.2013-6846
Ye, S., Chen, Z.-T., Zheng, R., Diao, S., Teng, J., Yuan, X., et al. (2020). New insights from imputed whole-genome sequence-based genome-wide association analysis and transcriptome analysis: The genetic mechanisms underlying residual feed intake in chickens. Front. Genet. 11, 243. doi:10.3389/fgene.2020.00243
Ye, S., Yuan, X., Lin, X., Gao, N., Luo, Y., Chen, Z., et al. (2018). Imputation from SNP chip to sequence: A case study in a Chinese indigenous chicken population. J. Anim. Sci. Biotechnol. 9, 30–12. doi:10.1186/s40104-018-0241-5
Yin, L., Zhang, H., Tang, Z., Xu, J., Yin, D., Zhang, Z., et al. (2021). rMVP: A memory-efficient, visualization-enhanced, and parallel-accelerated tool for genome-wide association study. Genomics Proteomics Bioinforma. 19, 619–628. doi:10.1016/j.gpb.2020.10.007
Yin, L., Zhang, H., Zhou, X., Yuan, X., Zhao, S., Li, X., et al. (2020). Kaml: Improving genomic prediction accuracy of complex traits using machine learning determined parameters. Genome Biol. 21, 146. doi:10.1186/s13059-020-02052-w
Yodklaew, P., Koonawootrittriron, S., Elzo, M. A., Suwanasopee, T., and Laodim, T. (2017). Genome-wide association study for lactation characteristics, milk yield and age at first calving in a Thai multibreed dairy cattle population. Agric. Nat. Resour. 51, 223–230. doi:10.1016/j.anres.2017.04.002
Yoshida, G. M., and Yáñez, J. M. (2022). Increased accuracy of genomic predictions for growth under chronic thermal stress in rainbow trout by prioritizing variants from GWAS using imputed sequence data. Evol. Appl. 15, 537–552. doi:10.1111/eva.13240
Zakizadeh, S., and Jafari, M. (2014). Genetic parameters for somatic cell count and clinical mastitis in the first lactation of Iranian Holstein cattle. J. Dairy Sci. 82, 2198–2204. doi:10.3168/jds.S0022-0302(99)75465-2
Zhang, Q., Guldbrandtsen, B., Thomasen, J. R., Lund, M. S., and Sahana, G. (2016). Genome-wide association study for longevity with whole-genome sequencing in 3 cattle breeds. J. Dairy Sci. 99, 7289–7298. doi:10.3168/jds.2015-10697
Zhang, S., and Sun, D. (2021). Past, now and future of dairy breeding industry. China Anim. Ind. 15, 22–26.
Zhang, S., Yan, T., Yu, S., and Guo, K. (2019). Research on lactation curve of dairy farms in Shanghai. Feed. Manag. 3, 43–48.
Keywords: Shanghai Holstein population, milk production traits, genetic parameter, genome-wide association study, different stages of lactation
Citation: Liu D, Xu Z, Zhao W, Wang S, Li T, Zhu K, Liu G, Zhao X, Wang Q, Pan Y and Ma P (2022) Genetic parameters and genome-wide association for milk production traits and somatic cell score in different lactation stages of Shanghai Holstein population. Front. Genet. 13:940650. doi: 10.3389/fgene.2022.940650
Received: 10 May 2022; Accepted: 04 August 2022;
Published: 05 September 2022.
Edited by:
Yunxia Zhao, Huazhong Agricultural University, ChinaReviewed by:
Wuttigrai Boonkum, Khon Kaen University, ThailandXiujin Li, Zhongkai University of Agriculture and Engineering, China
Navid Ghavi Hossein-Zadeh, University of Guilan, Iran
Copyright © 2022 Liu, Xu, Zhao, Wang, Li, Zhu, Liu, Zhao, Wang, Pan and Ma. This is an open-access article distributed under the terms of the Creative Commons Attribution License (CC BY). The use, distribution or reproduction in other forums is permitted, provided the original author(s) and the copyright owner(s) are credited and that the original publication in this journal is cited, in accordance with accepted academic practice. No use, distribution or reproduction is permitted which does not comply with these terms.
*Correspondence: Peipei Ma, cGVpcGVpLm1hQHNqdHUuZWR1LmNu; Yuchun Pan, cGFueXVjaHVuMTk2M0BhbGl5dW4uY29t