 Rui-Si Hu
 Jin Wu2
 Ying Zhang
94% of researchers rate our articles as excellent or good
Learn more about the work of our research integrity team to safeguard the quality of each article we publish.
Find out more
ORIGINAL RESEARCH article
Front. Genet., 22 July 2022
Sec. Computational Genomics
Volume 13 - 2022 | https://doi.org/10.3389/fgene.2022.935989
This article is part of the Research TopicMachine Learning For Biological Sequence AnalysisView all 13 articles
Computational prediction to screen potential vaccine candidates has been proven to be a reliable way to provide guarantees for vaccine discovery in infectious diseases. As an important class of organisms causing infectious diseases, pathogenic eukaryotes (such as parasitic protozoans) have evolved the ability to colonize a wide range of hosts, including humans and animals; meanwhile, protective vaccines are urgently needed. Inspired by the immunological idea that pathogen-derived epitopes are able to mediate the CD8+ T-cell-related host adaptive immune response and with the available positive and negative CD8+ T-cell epitopes (TCEs), we proposed a novel predictor called CD8TCEI-EukPath to detect CD8+ TCEs of eukaryotic pathogens. Our method integrated multiple amino acid sequence-based hybrid features, employed a well-established feature selection technique, and eventually built an efficient machine learning classifier to differentiate CD8+ TCEs from non-CD8+ TCEs. Based on the feature selection results, 520 optimal hybrid features were used for modeling by utilizing the LightGBM algorithm. CD8TCEI-EukPath achieved impressive performance, with an accuracy of 79.255% in ten-fold cross-validation and an accuracy of 78.169% in the independent test. Collectively, CD8TCEI-EukPath will contribute to rapidly screening epitope-based vaccine candidates, particularly from large peptide-coding datasets. To conduct the prediction of CD8+ TCEs conveniently, an online web server is freely accessible (http://lab.malab.cn/∼hrs/CD8TCEI-EukPath/).
Pathogen-derived antigen epitopes displayed on the surface of host antigen-presenting cells can be presented by major histocompatibility complex (MHC) molecules (also called human leukocyte antigen in humans) to the different subsets of T cells. Typically, MHC-I molecules present relatively fixed peptide lengths (usually 8–11 residues) to CD8+ T cells, thereby activating cytotoxic T lymphocytes to destroy invading pathogens (Trolle et al., 2016), whereas MHC-II molecules with an open peptide-binding groove have the ability to recognize peptides of highly variable lengths (usually 9–22 residues) that activate CD4+ helper or regulatory T cells (Holland et al., 2013). Obviously, antigen epitopes that trigger CD8+ T cells or CD4+ T cells bear essential differences during the process of host adaptive immune responses. Therefore, identifying what pathogen peptides will be presented to specific T cells is critical information for understanding infectious etiologies, developing diagnostic assays, and designing epitope-based vaccines against infectious agents.
Conventional approaches for T-cell epitope identification have depended entirely upon experimental technologies and experiences and are obviously time-consuming and costly. As a result, alternative computational approaches to implement antigen epitope identification have become powerful methods in immunology and vaccinology research and have significantly decreased the experimental load associated with epitope identification (Brusic et al., 2004; Zhang et al., 2012). To date, most T-cell epitope prediction tools have been developed using machine learning algorithms to train various experimental data, which are generally available in specialized epitope databases, such as the Immune Epitope Database (IEDB) (Vita et al., 2019). Since the first computational approach for epitope prediction was introduced more than 30 years (Sette et al., 1989), the performance of prediction methods in recent years has obtained significant advancement with the accumulation of positive epitope data, the development of machine learning algorithms, and the reduction of computational cost. These advancements are seen in the development of machine learning models to identify T-cell epitopes in various infectious agents, including pathogenic prokaryotes (such as bacteria) (Pamer et al., 1991; Nagpal et al., 2018; Zadeh Hosseingholi et al., 2020), viruses (Bukhari et al., 2021; Sharma et al., 2021; Xu et al., 2021), and pathogenic eukaryotes (such as parasitic protozoans) (Goodswen et al., 2014; Goodswen et al., 2021).
Among infectious agents, eukaryotic pathogens have evolved into several distinct phylogenetic lineages and bear resourceful abilities to affect a wide range of hosts, including humans and animals, resulting in significant effects on the aspects of global public health and considerable economic loss to the agricultural community (Haldar et al., 2006). Since a high level of MHC polymorphism in infected hosts and a large number of unknown functional proteins exist in eukaryotic pathogens (Hu et al., 2022), this undoubtedly produces challenges for T-cell epitope identification. Although presently some available software systems for in silico T-cell epitope prediction have been developed, including the NetCTL server (Larsen et al., 2005), the NetMHCpan server (Jurtz et al., 2017), and the MHCflurry server (O’Donnell et al., 2018), there is no guarantee that all these tools produce good quality predictions (Resende et al., 2012; Bordbar et al., 2020; Zawawi et al., 2020). Moreover, a general analysis of MHC-peptide binding prediction, overlooking specific patterns of MHC-presented peptides recognized by different types of T-cell receptors, may lead to lower predictive accuracy.
Given the wealth of state-of-the-art machine learning algorithms available and public experimental data, it is necessary to keep comparing the performance of different methods reciprocally and develop effective tools for the identification of T-cell epitopes in pathogen biology research. In the present study, based on MHC-I T-cell peptides collected from the IEDB database and experimentally validated neoantigen epitopes available from previous Review articles, we developed a novel machine learning-based method to identify CD8+ T-cell immunogenic epitopes in eukaryotic pathogens. Our method adopted the best hybrid feature descriptor and classifier to establish a prediction model and finally achieved an accuracy of 79.255% in ten-fold cross-validation and an accuracy of 78.169% in the independent test. Finally, a user-friendly web server named CD8TCEI-EukPath was developed, which will be helpful for scientists to rapidly screen epitope-based vaccine candidates from a plethora of mass spectrometry peptidome data.
Eukaryotic pathogens (Eukpaths), such as protozoans and fungi, are important causative agents that cause serious infectious diseases in humans and animals; however, there is a lack of systematic collection of Eukpath-derived antigenic epitopes associated with the host immune response. Additionally, many previous works have pointed out that stringent datasets are considered important for the performance of a predictive model. In particular, peptide sequences for most T-cell epitopes (TCEs) usually have a short length, which easily leads to biased estimates if peptide sequences in a dataset have high similarity.
The present study collected datasets concerning positive and negative CD8+ TCEs available from the IEDB database (http://www.iedb.org/), following the search strategy: Eukaryote T-cell and class I MHC restriction (accessed on 15 October 2021). After data processing, 809 TCEs and 1,715 non-TCEs for Eukpaths were retained as positive and negative datasets, respectively. A detailed description of Eukpaths is included in Supplementary Table S1. In addition, we also obtained 371 experimentally determined peptide sequences for host CD8+ T cells that are described in the latest Review articles, in which have gave a detailed list regarding peptide sequences in three important parasites [i.e., Plasmodium falciparum (Heide et al., 2019), Toxoplasma gondii (Javadi Mamaghani et al., 2019), and Trypanosoma cruzi (Ferragut et al., 2021)] and, eventually, a total of 1,180 TCEs were reorganized as the positive dataset.
Before dividing the positive and negative datasets into training and testing sets, we performed data preprocessing, such as removing repeat sequences and sequences with high sequence identity. Repeat peptide sequences in the positive sample were removed using SeqKit software (Shen et al., 2016), and peptide sequences in positive and negative samples with more than 90% sequence identity were removed using the CD-HIT Suite server (Huang et al., 2010). Finally, a total of 706 TCEs from the positive dataset were retained, and an equal number of non-TCEs were randomly selected from negative datasets.
Regarding machine learning, training datasets are used to train a predictive model, and based on evaluation through testing sets, an optimal classifier was selected. We randomly selected 80% of datasets from both positive and negative samples as training sets and the remaining 20% as testing sets. Note that the training and testing sets can be downloaded from http://lab.malab.cn/∼hrs/CD8TCEI-EukPath/download.html.
A modeling overview of the proposed approach is illustrated in Figure 1. CD8TCEI-EukPath allows users to utilize a large volume of peptide sequences, such as peptide-coding datasets available from mass spectrometry peptidomics, to serve as input sequences. First, each sequence is subjected to the feature representation based on the proposed hybrid feature scheme. Regarding machine learning modeling, hybrid feature identification is a useful approach for improving prediction performance and has been extensively applied to the identification of specific peptide sequences, such as anticancer T-cell antigen epitopes (Wei et al., 2018; Beltran Lissabet et al., 2019; Charoenkwan et al., 2020; Jiao et al., 2021). The detailed hybrid feature representation method can be seen in the subsequent Section 2.3. Then, hybrid features for each sequence are transmitted to the well-trained prediction model. In the final evaluation of the models, we choose the LightGBM (LGBM) classifier as the optimal training model. Eventually, the LGBM-based model will give an estimated score in the prediction results to differentiate TCEs from non-TCEs. If the prediction possibility of more than 50% is considered to indicate the true TCE and lower values indicate non-TCEs, the prediction possibility is calculated with a range from 0 to 100%.
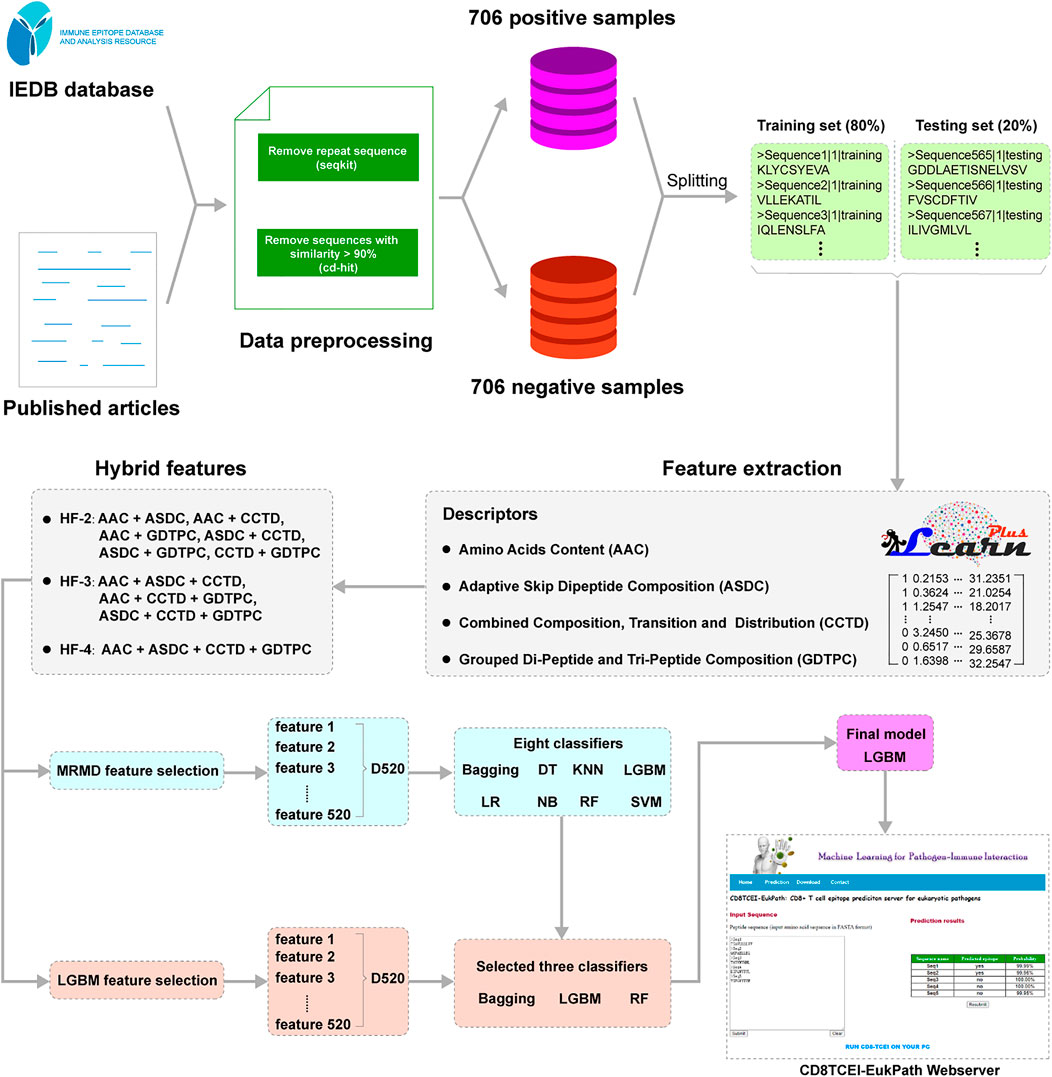
FIGURE 1. A technology roadmap of the machine learning model proposed in this study.
Protein or peptide sequences are composed of amino acids. In the standard amino acid alphabet, 20 different amino acids can be represented as {A, C, D, E, F, G, H, I, K, L, M, N, P, Q, R, S, T, V, W, and Y}. To establish a machine learning model, an essential step is to extract amino acid features from protein or peptide sequences, typically regarding structural and physicochemical properties of amino acids through a transformation from sequence to numerical vector (Chen et al., 2018; Chen et al., 2020; Chen et al., 2021). In this study, the iLearnPlus platform (Chen et al., 2021) was used to conduct feature extraction of the peptide sequence, as described below.
1) Amino Acid Composition (AAC). AAC is a commonly used descriptor that has been successfully applied to protein classification and anticancer peptide prediction (Bhasin and Raghava, 2004; Wei et al., 2018; Jiao et al., 2021). AAC is encoded based on calculating the occurrence frequency of each amino acid in a peptide sequence. The frequencies of AAC can be calculated as follows:
where
2) Adaptive Skip Dinucleotide Composition (ASDC). The ASDC descriptor is a modified dipeptide composition proposed by Wei et al., 2017a and Wei et al., 2017b. This descriptor has the advantage that it not only fully considers the relevant information between adjacent residues but also considers the intermediate residue. For a given protein or peptide sequence, this descriptor can generate 400-dimensional feature vectors (fv) that are presented by:
In the formula, fvi indicates the occurrence frequency of all possible dipeptide pairs with ≤ M−1 intervening amino acids.
3) Combined Composition, Transition, and Distribution (CCTD). The CCTD features represent a global description of amino acids’ structural or physicochemical attributes, such as hydrophobicity, normalized van der Waals volume, polarity, polarizability, charge, secondary structures, and solvent accessibility of a peptide sequence (Dubchak et al., 1995; Tomii and Kanehisa, 1996; Dubchak et al., 1999). The CCTD contains three descriptors, namely, composition (C), transition (T), and distribution (D).
• Composition: The composition descriptor computes the percentage frequency of polar (RKEDQN), neutral (GASTPHY), and hydrophobic (CLVIMFW) residues in a given peptide sequence. It can be calculated as follows:
N (i) represents the number of amino acid type i in the encoded sequence, and L represents the length of the peptide sequence.
• Transition: The transition descriptor indicates the percentage frequency of amino acids that transition between the three groups, i.e., polar, neutral, and hydrophobic groups. The formula can be defined as follows:
where
• Distribution: The distribution descriptor describes the distribution of amino acids for each of the three groups (polar, neutral, and hydrophobic) in the sequence. There are five descriptor values for each group, and they are the corresponding position fractions in the entire sequence concerning first residues, 25% residues, 50% residues, 70% residues, and 100% residues.
4) Grouped Di-Peptide/Tri-Peptide Composition (GDTPC). The 20 different amino acids can be categorized into five classes, including aliphatic group–g1 (GAVLMI), aromatic group–g2 (FYW), positively charged group–g3 (KRH), negatively charged group–g4 (DE), and uncharged group–g5 (STCPNQ), according to their physicochemical properties, such as hydrophobicity, charge and molecular size of amino acids in a peptide sequence (Lee et al., 2011). In this study, the grouped di-peptide composition (GDPC) and the grouped tri-peptide composition (GTPC) are combined to present the feature vector in the peptide sequence. The GDPC is a variation of the di-peptide composition descriptor and can generate 25 descriptors (Chen et al., 2018; Chen et al., 2021). It is defined as follows:
where
The GTPC is also a variation of the tri-peptide composition descriptor, and a total of 125 descriptors can be generated for a given peptide sequence (Chen et al., 2018; Chen et al., 2021). It is defined as follows:
where
Feature selection is an important process that can effectively reduce the number of redundant variables and the computational cost as well as solve overfitting problems in machine learning modeling. A variety of feature selection tools have been developed and applied to the identification of peptide sequences (Wang et al., 2013; Zou et al., 2016; Jung et al., 2019; He et al., 2020; Meng et al., 2020; Mostafa et al., 2020). For the first method applied to the optimal feature selection, we decided to utilize the MRMD tool (http://lab.malab.cn/soft/MRMD3.0/index.html) (Zou et al., 2016; He et al., 2020) following the PageRank strategy. MRMD is a feature ranking method based on function distance calculated by Pearson’s correlation coefficient to measure the independence of every feature and generates a sub-feature set with a low redundancy but strong relevance with the target class. The second method was the LGBM algorithm (Ke et al., 2017), which was used to select the best feature subsets based on the ranking of feature significance calculated by the LGBM classifier. Finally, the features selected by the MRMD and LGBM methods were used for modeling.
In this study, eight popular machine learning algorithms were used, including Bagging, decision tree (DT), neighbors (KNN), light gradient boosting machine (LGBM), logistic regression (LR), GaussianNB (NB), random forest (RF) and support vector machines (SVM), to select a suitable algorithm for machine learning modeling. These algorithms are built into the scikit-learn toolkit package (Pedregosa et al., 2011), which can run in the Python program. Based on the feature selection matrix generated from the MRMD program, with regard to the eight algorithms, default hyperparameters were used for the initial evaluation during the process of classification performance. Additionally, we optimized the hyperparameters and selected the three most suitable classifiers, namely, RF, LGBM, and Bagging, for further comparative analysis. The best parameters were determined by grid search techniques, and the detailed settings are compiled in Supplementary Table S2.
For each predictive model, the quality was evaluated by measurement metrics for ten-fold cross-validation and an independent test method. In terms of measurement metrics, we used four standard evaluation metrics, namely, sensitivity (Se), specificity (Sp), accuracy (Acc), and Matthew correlation coefficient (MCC), to evaluate a model’s performance. These metrics were formulated as follows:
where TP, TN, FP, and FN indicate the sample numbers of true positives, true negatives, false-positives, and false negatives, respectively. The Se of a test is also called the true positive rate and refers to the proportion of samples that are correctly classified as positive samples in the dataset among all real positive samples. The Sp of a test is also called the true negative rate and is the proportion of samples that are correctly classified as negative samples in the dataset among all real negative samples. Another two metrics, Acc and MCC, can comprehensively evaluate the performance of a predictor on balanced data. The Acc metric represents the ratio of a sample number of correct predictions to all numbers of input samples, but the MCC metric takes the ratio of positive and negative elements into account. Therefore, for unbalanced data, MCC would display a better predictive quality than Acc (Chicco and Jurman, 2020).
Additionally, the area under the receiver operating characteristic (auROC, or AUC) curve was introduced to evaluate the performance of a predictor. The auROC curve is plotted with a true positive rate on the Y-axis and the false-positive rate on the X-axis, with values ranging from 0 to 1. Having the auROC curve near the upper left or an auROC curve value = 1 reflects perfect prediction, while having an auROC curve value of 0.5 suggests random prediction of a model.
In terms of peptide length, antigen epitopes that are presented to CD8+ T cells by MHC-I molecules are typical peptides between 8 and 11 amino acids in length, and occasionally a few noncanonical lengths overstep this range (Trolle et al., 2016). Additionally, the sequence characteristics of T-cell epitopes should largely reflect the specific binding ability to the MHC allele in the process of eliciting immune responses induced by pathogen infection. Motivated by these observations, we first investigated the length distribution of positive T-cell epitope sequences. The results are illustrated in Figure 2A, which shows the main distribution of sequence length is 9-mer peptides and that much longer peptides reach a length of up to 35 aa. As shown in Figure 2B, we also observed significant preferences in terms of amino acid appearance frequency between TCEs and non-TCEs, especially for leucine (L). Previous evidence has demonstrated that L is an important amino acid to mediate the adaptive immune response; specifically, L can play a role in T-cell activation and proliferation of immune cells (Ananieva et al., 2016). This implies that the preference of L in positive TCEs is essential feature information, in which the role of L not only serves as a biological activator of T-cell immunity but also may contribute to discriminating TCEs from non-TCEs.
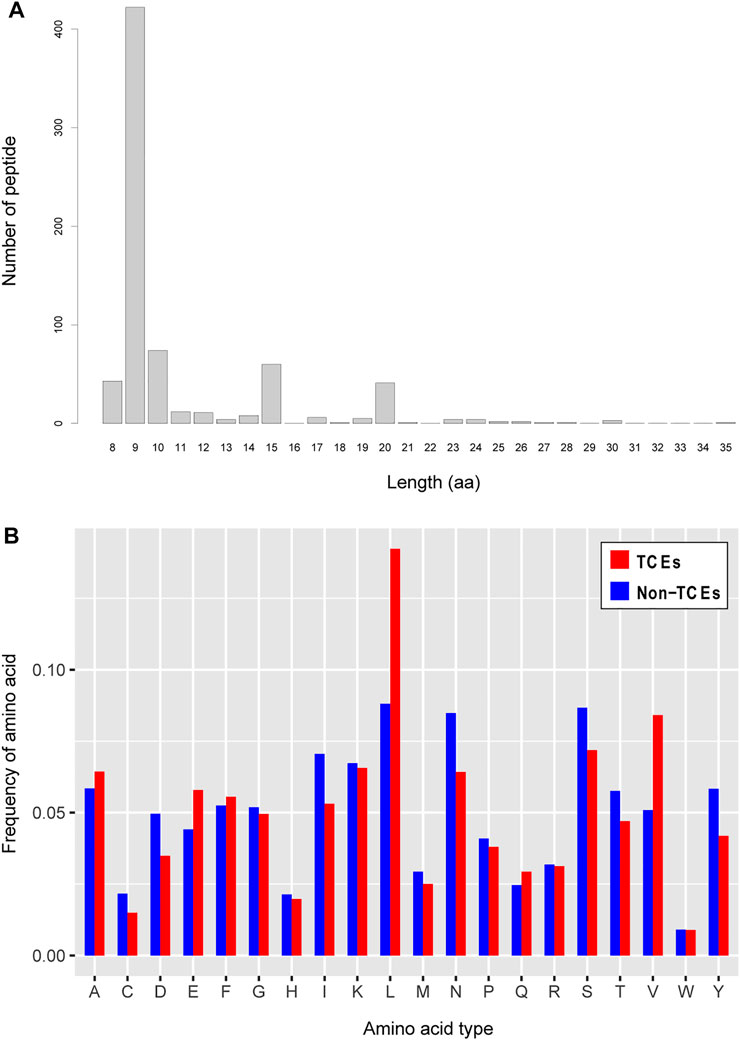
FIGURE 2. Analysis of amino acid sequence features. (A) Length distribution of the positive CD8+ T-cell epitopes. The horizontal axis represents the length of amino acids, and the vertical axis represents the number of epitopes in positive samples. (B) Distribution features of amino acid types with respect to the positive and negative CD8+ T-cell epitopes. The horizontal axis represents the twenty amino acids, and the vertical axis represents the occurrence frequency of an amino acid in all sequences.
In our scheme on feature learning, we evaluated the performance of individual feature descriptors by the utilization of eight extensively used machine learning classifiers, i.e., Bagging, DT, KNN, LGBM, LR, NB, RF, and SVM. These models were evaluated thoroughly by ten-fold cross-validation, and their performances were compared reciprocally. A detailed summary of these evaluation results is compiled in Supplementary Table S3, and the Acc values of all classifiers are shown in Table 1. Given that each descriptor has a fair comparison with the eight classifiers, as shown in Table 1, we noticed that in each feature descriptor, there were three classifiers, namely, Bagging, LGBM, and RF, that had better performances than other classifiers (the best Acc values are highlighted in bold font). In the results of ten-fold cross-validation, the LGBM classifier had the best performance on five feature descriptors (AAC, ASDC, CTDC, CTDT, and CTDD), followed by the RF classifier on three feature descriptors (AAC, GDPC, and GTPC); however, in the individual test result, there were four feature descriptors (CTDC, CTDT, CTDD, and GDPC) on the RF classifier that had the best performance, followed by two feature descriptors (ASDC and GTPC) on the LGBM classifier and one feature descriptor (AAC) on the Bagging classifier. Remarkably, the feature descriptor ASDC worked on the LGBM classifier and was able to obtain the best prediction results in both ten-fold cross-validation and the independent test, with Acc values of 75.443% and 76.761%, respectively. Therefore, the LGBM classifier can be chosen as the most suitable classifier for model deployment, if only a single feature descriptor is being considered.

TABLE 1. The accuracy (Acc) results of a single feature descriptor classified by different machine learning algorithms.
Compared to machine learning techniques, in general, the sequence feature is a more critical element to achieve high accuracy in biological sequence classification, especially for the extensive applications of combining hybrid multisource features in machine learning modeling (Zhang et al., 2016; Mohan et al., 2019; Charoenkwan et al., 2020; Ao et al., 2021; Jiao et al., 2021). Based on the feature descriptors mentioned in Section 3.2, we combined similar feature types as a hybrid group, including CTDC + CTDT + CTDD (CCTD) and GDPC + GTPC (GDTPC), and the performances of four groups (AAC, ASDC, CCTD, and GDTPC) were compared thoroughly on the eight classifiers using ten-fold cross-validation. The detailed prediction results are summarized in Supplementary Table S2, and we reconfirmed that LGBM is a satisfactory classifier to differentiate TCEs from non-TCEs. To compare the performances of various hybrid features, as shown in Table 2, the prediction results of the LGBM classifier were generated based on the ten-fold cross-validation and independent test. Strikingly, the majority of prediction results of LGBM using hybrid features had an Acc value of more than 75%, which indicated that the prediction ability was greatly improved when compared to the single features. We also observed from Table 2 that the ten-fold cross-validation results of the AAC + ASDC + CCTD + GDTPC combination in particular, with metric values of 79.255% Acc, 0.585 MCC, 77.837% Se, and 80.674% Sp outperformed all the single or hybrid features, and therefore, this combination feature was selected for the subsequent analyses.
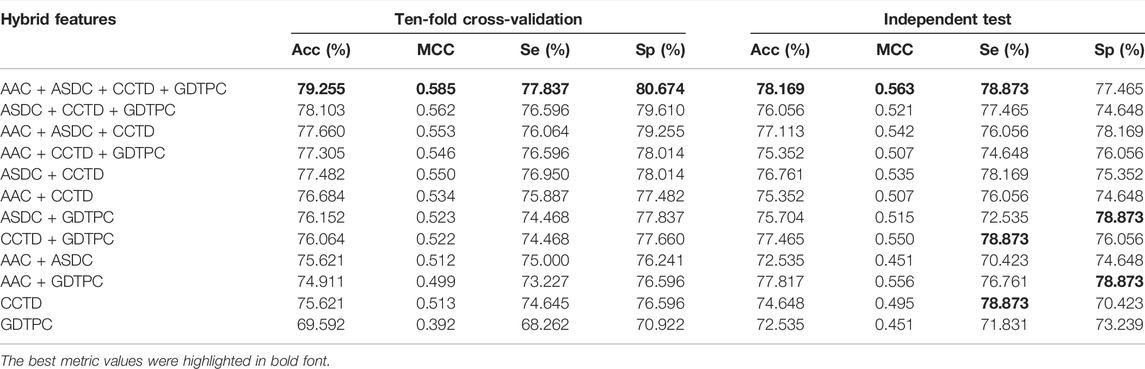
TABLE 2. The classification results of different hybrid feature combinations detected by the LGBM classifier.
Various feature selection technologies can be used for representation learning features. In the present study, we compared two feature selection technologies (MRMD and LGBM) by calculating the feature importance values, including the PageRank-based value for MRMD and Gini-based feature importance value for LGBM. Among the feature list results obtained by the two methods, we selected the top 520 features and employed the incremental feature selection (IFS) strategy to determine the optimal feature vector spaces, which are subsequently predicted on LGBM, RF, and Bagging classifiers.
As shown in Table 3, the ten-fold cross-validation results suggested that the MRMD + LGBM combination yielded the best prediction capability, with 79.255% Acc, 0.585 MCC, and 80.674% Sp, compared to the other five models (LGBM + LGBM, MRMD + RF, LGBM + RF, MRMD + Bagging, and LGBM + Bagging), except that the Se of MRMD + LGBM of 77.837% was lower than that of the LGBM + LGBM model; however, an independent test indicated that the MRMD + LGBM model was better than the other five combinations in all metrics. Furthermore, a separate AUC curve analysis is shown in Figure 3 and further illustrated that the MRMD + LGBM model with an AUC value of 0.840 in ten-fold cross-validation and an AUC value of 0.836 in the independent test outperformed the other five models.
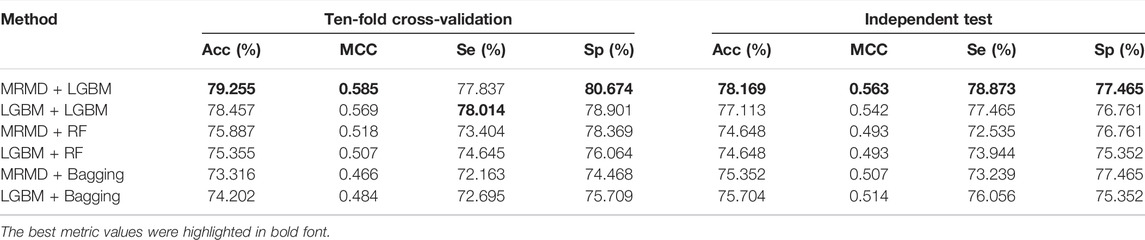
TABLE 3. A comparison of classification results by a pairwise combination of two feature selection techniques (MRMD and LGBM) and three optimal classifiers (LGBM, RF, and Bagging).
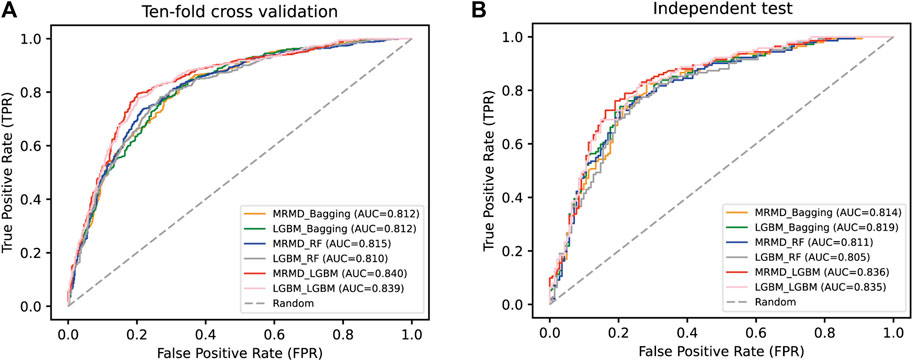
FIGURE 3. A comparison of the AUC curve in ten-fold cross-validation (A) and independent test (B). Results were by a pairwise combination of two feature selection techniques (MRMD and LGBM) and three optimal classifiers (LGBM, RF, and Bagging).
The optimal feature vector spaces detected by the IFS strategy suggested that the maximum accuracy of the LGBM + LGBM model was 78.457% with 89 features, which was less than the maximum accuracy of the MRMD + LGBM model of 79.255% with 420 features Figure 4. In the case of evaluating the computational cost of both models and considering the stability and robustness of the models, the MRMD + LGMB combination was finally selected as the best strategy for modeling and webserver development.
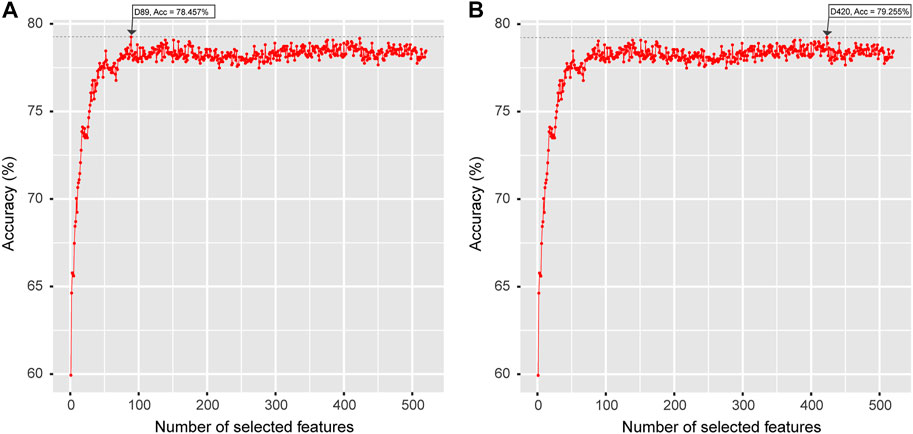
FIGURE 4. The optimal feature sets selected by LGBM feature importance ranking (A) and a well-established MRMD strategy (B). The horizontal axis represents the number of selected features, and the vertical axis represents the accuracy value calculated by the LGBM classifier.
A user-friendly web server called CD8TCEI-EukPath was developed, and the users can freely enter the homepage via the link http://lab.malab.cn/∼hrs/CD8TCEI-EukPath/. The prediction interface can be accessed by clicking the “Prediction” or “CD8TCEI-EukPath” hyperlink, where the users can utilize amino acid sequences (FASTA format) to identify whether the input sequences are CD8TCEs or non-CD8TCEs. Briefly, the users should use short peptide sequences (generally 8–11 aa in length), paste the FASTA sequences in the left box, and click the “Submit” button for calculation. Immediately, the prediction results will be shown in the right box, which includes the protein name, predicted epitope (yes or no), and probability of belonging to CD8+ TCEs. If starting a new task, the users can click the “Resubmit” button and/or click the “Clear” button and paste new sequences to conduct computational predictions. Note that the computing resources of the webserver are limited for high-volume predictions, and the maximum number of sequences should be 1,000 at a time. In addition, using the established model, we also provided the prediction results of five important pathogen species (Plasmodium, Toxoplasma, Trypanosoma, Leishmania, and Giardia) based on the available mass spectrometry peptidome data obtained from the ProteomeXchange database (http://www.proteomexchange.org/). These prediction results can be downloaded freely from our web server and need to be further evaluated by MHC-peptide binding predictions and biological experiments.
By comparing the performances of various single feature descriptors and hybrid feature descriptors using eight different classifiers, we selected a set of best features (AAC + ASDC + CCTD + GDTPC) and a satisfactory classifier (LGBM) for machine learning modeling. Following the state-of-the-art feature selection strategy of MRMD 3.0, we developed an effective sequence-based predictor named CD8TCEI-EukPath, capable of rapidly identifying eukaryotic pathogen-derived antigen epitopes for host CD8+ T cells from large peptide-coding datasets. As a first sequence-based predictor to identify T-cell epitopes in eukaryotic pathogens, CD8TCEI-EukPath achieved 79.255% Acc in ten-fold cross-validation and 78.169% Acc, 0.563 MCC, 78.873% Se and 77.465% Sp in the independent test. Meanwhile, a user-friendly web server was developed in the present work. We believe that this tool is helpful for scientists to evaluate the immunogenicity of a given peptide sequence before performing biological experiments. The current tool only applies to the identification of CD8+ T-cell epitopes in eukaryotic pathogens. In future works, we will apply deep representation learning features and state-of-the-art classification algorithms for CD4+ T-cell epitope and B-cell epitope prediction. By leveraging machine learning models to develop auxiliary tools, their combinations will assist in the development of peptide-based vaccines.
The original contributions presented in the study are included in the article/Supplementary Material, further inquiries can be directed to the corresponding author/s.
XZ and YZ contributed to the conception of the study; R-SH built the model and wrote the original manuscript; JW and LZ participated in the data analysis. The authors read and approved the final manuscript.
This work was supported by the grant from the National Natural Science Foundation of China (62101353 and 62101354), and the Special Science Foundation of Quzhou (2021D004).
XZ was employed by the company Beidahuang Industry Group General Hospital.
The remaining authors declare that the research was conducted in the absence of any commercial or financial relationships that could be construed as a potential conflict of interest.
The handling editor QZ declared a past co-authorship with the author RSH.
All claims expressed in this article are solely those of the authors and do not necessarily represent those of their affiliated organizations, or those of the publisher, the editors and the reviewers. Any product that may be evaluated in this article, or claim that may be made by its manufacturer, is not guaranteed or endorsed by the publisher.
The Supplementary Material for this article can be found online at: https://www.frontiersin.org/articles/10.3389/fgene.2022.935989/full#supplementary-material
Ananieva, E. A., Powell, J. D., and Hutson, S. M. (2016). Leucine Metabolism in T Cell Activation: mTOR Signaling and beyond. Adv. Nutr. 7, 798S–805S. doi:10.3945/an.115.011221
Ao, C., Yu, L., and Zou, Q. (2021). RFhy-m2G: Identification of RNA N2-Methylguanosine Modification Sites Based on Random Forest and Hybrid Features. Methods S1046-2023 (21), 00142–0. doi:10.1016/j.ymeth.2021.05.016
Beltrán Lissabet, J. F., Herrera Belén, L., and Farias, J. G. (2019). TTAgP 1.0: A Computational Tool for the Specific Prediction of Tumor T Cell Antigens. Comput. Biol. Chemistry 83, 107103. doi:10.1016/j.compbiolchem.2019.107103
Bhasin, M., and Raghava, G. P. S. (2004). Classification of Nuclear Receptors Based on Amino Acid Composition and Dipeptide Composition. J. Biol. Chemistry 279, 23262–23266. doi:10.1074/jbc.M401932200
Bordbar, A., Bagheri, K. P., Ebrahimi, S., and Parvizi, P. (2020). Bioinformatics Analyses of Immunogenic T-Cell Epitopes of LeIF and PpSP15 Proteins from Leishmania Major and Sand Fly Saliva Used as Model Antigens for the Design of A Multi-Epitope Vaccine to Control Leishmaniasis. Infect. Genet. Evol. 80, 104189. doi:10.1016/j.meegid.2020.104189
Brusic, V., Bajic, V. B., and Petrovsky, N. (2004). Computational Methods for Prediction of T-Cell Epitopes-A Framework for Modelling, Testing, and Applications. Methods 34, 436–443. doi:10.1016/j.ymeth.2004.06.006
Bukhari, S. N. H., Jain, A., Haq, E., Khder, M. A., Neware, R., Bhola, J., et al. (2021). Machine Learning-Based Ensemble Model for Zika Virus T-Cell Epitope Prediction. J. Healthc. Eng. 2021, 1–10. doi:10.1155/2021/9591670
Charoenkwan, P., Nantasenamat, C., Hasan, M. M., and Shoombuatong, W. (2020). iTTCA-Hybrid: Improved and Robust Identification of Tumor T Cell Antigens by Utilizing Hybrid Feature Representation. Anal. Biochemistry 599, 113747. doi:10.1016/j.ab.2020.113747
Chen, Z., Zhao, P., Li, C., Li, F., Xiang, D., Chen, Y.-Z., et al. (2021). iLearnPlus: A Comprehensive and Automated Machine-Learning Platform for Nucleic Acid and Protein Sequence Analysis, Prediction and Visualization. Nucleic Acids Res. 49, e60. doi:10.1093/nar/gkab122
Chen, Z., Zhao, P., Li, F., Leier, A., Marquez-Lago, T. T., Wang, Y., et al. (2018). iFeature: A Python Package and Web Server for Features Extraction and Selection from Protein and Peptide Sequences. Bioinformatics 34, 2499–2502. doi:10.1093/bioinformatics/bty140
Chen, Z., Zhao, P., Li, F., Marquez-Lago, T. T., Leier, A., Revote, J., et al. (2020). iLearn: An Integrated Platform and Meta-Learner for Feature Engineering, Machine-Learning Analysis and Modeling of DNA, RNA and Protein Sequence Data. Brief. Bioinform 21, 1047–1057. doi:10.1093/bib/bbz041
Chicco, D., and Jurman, G. (2020). The Advantages of the Matthews Correlation Coefficient (MCC) over F1 Score and Accuracy in Binary Classification Evaluation. BMC Genomics 21, 6. doi:10.1186/s12864-019-6413-7
Dubchak, I., Muchnik, I., Holbrook, S. R., and Kim, S. H. (1995). Prediction of Protein Folding Class Using Global Description of Amino Acid Sequence. Proc. Natl. Acad. Sci. U.S.A. 92, 8700–8704. doi:10.1073/pnas.92.19.8700
Dubchak, I., Muchnik, I., Mayor, C., Dralyuk, I., and Kim, S.-H. (1999). Recognition of a Protein Fold in the Context of the SCOP Classification. Proteins 35, 401–407. doi:10.1002/(sici)1097-0134(19990601)35:4<401:aid-prot3>3.0.co;2-k
Ferragut, F., Acevedo, G. R., and Gómez, K. A. (2021). T Cell Specificity: A Great Challenge in Chagas Disease. Front. Immunol. 12, 674078. doi:10.3389/fimmu.2021.674078
Goodswen, S. J., Kennedy, P. J., and Ellis, J. T. (2021). Applying Machine Learning to Predict the Exportome of Bovine and Canine Babesia Species that Cause Babesiosis. Pathogens 10, 660. doi:10.3390/pathogens10060660
Goodswen, S. J., Kennedy, P. J., and Ellis, J. T. (2014). Vacceed: A High-Throughput In Silico Vaccine Candidate Discovery Pipeline for Eukaryotic Pathogens Based on Reverse Vaccinology. Bioinformatics 30, 2381–2383. doi:10.1093/bioinformatics/btu300
Haldar, K., Kamoun, S., Hiller, N. L., Bhattacharje, S., and Van Ooij, C. (2006). Common Infection Strategies of Pathogenic Eukaryotes. Nat. Rev. Microbiol. 4, 922–931. doi:10.1038/nrmicro1549
He, S., Guo, F., Zou, Q., and HuiDing, fnm. (2021). MRMD2.0: A Python Tool for Machine Learning with Feature Ranking and Reduction. Cbio 15, 1213–1221. doi:10.2174/1574893615999200503030350
Heide, J., Vaughan, K. C., Sette, A., Jacobs, T., and Schulze Zur Wiesch, J. (2019). Comprehensive Review of Human Plasmodium Falciparum-Specific CD8+ T Cell Epitopes. Front. Immunol. 10, 397. doi:10.3389/fimmu.2019.00397
Holland, C. J., Cole, D. K., and Godkin, A. (2013). Re-Directing CD4+ T Cell Responses with the Flanking Residues of MHC Class II-Bound Peptides: The Core Is Not Enough. Front. Immunol. 4, 172. doi:10.3389/fimmu.2013.00172
Hu, R.-S., Hesham, A. E.-L., and Zou, Q. (2022). Machine Learning and its Applications for Protozoal Pathogens and Protozoal Infectious Diseases. Front. Cell. Infect. Microbiol. 12 (12), 882995. doi:10.3389/fcimb.2022.882995
Huang, Y., Niu, B., Gao, Y., Fu, L., and Li, W. (2010). CD-HIT Suite: A Web Server for Clustering and Comparing Biological Sequences. Bioinformatics 26, 680–682. doi:10.1093/bioinformatics/btq003
Javadi Mamaghani, A., Fathollahi, A., Spotin, A., Ranjbar, M. M., Barati, M., Aghamolaie, S., et al. (2019). Candidate Antigenic Epitopes for Vaccination and Diagnosis Strategies of Toxoplasma Gondii Infection: A Review. Microb. Pathog. 137, 103788. doi:10.1016/j.micpath.2019.103788
Jiao, S., Zou, Q., Guo, H., and Shi, L. (2021). iTTCA-RF: A Random Forest Predictor for Tumor T Cell Antigens. J. Transl. Med. 19, 449. doi:10.1186/s12967-021-03084-x
Jung, Y., Zhang, H., and Hu, J. (2019). Transformed Low-Rank ANOVA Models for High-Dimensional Variable Selection. Stat. Methods Med. Res. 28, 1230–1246. doi:10.1177/0962280217753726
Jurtz, V., Paul, S., Andreatta, M., Marcatili, P., Peters, B., and Nielsen, M. (2017). NetMHCpan-4.0: Improved Peptide-MHC Class I Interaction Predictions Integrating Eluted Ligand and Peptide Binding Affinity Data. J. I. 199, 3360–3368. doi:10.4049/jimmunol.1700893
Ke, G., Meng, Q., Finley, T., Wang, T., Chen, W., Ma, W., et al. (2017). LightGBM: A Highly Efficient Gradient Boosting Decision Tree. Adv. neural Inf. Process. Syst. 30, 3146–3154.
Larsen, M. V., Lundegaard, C., Lamberth, K., Buus, S., Brunak, S., Lund, O., et al. (2005). An Integrative Approach to CTL Epitope Prediction: A Combined Algorithm Integrating MHC Class I Binding, TAP Transport Efficiency, and Proteasomal Cleavage Predictions. Eur. J. Immunol. 35, 2295–2303. doi:10.1002/eji.200425811
Lee, T.-Y., Lin, Z.-Q., Hsieh, S.-J., Bretaña, N. A., and Lu, C.-T. (2011). Exploiting Maximal Dependence Decomposition to Identify Conserved Motifs from A Group of Aligned Signal Sequences. Bioinformatics 27, 1780–1787. doi:10.1093/bioinformatics/btr291
Meng, C., Wu, J., Guo, F., Dong, B., and Xu, L. (2020). CWLy-pred: A Novel Cell Wall Lytic Enzyme Identifier Based on an Improved MRMD Feature Selection Method. Genomics 112, 4715–4721. doi:10.1016/j.ygeno.2020.08.015
Mohan, S., Thirumalai, C., and Srivastava, G. (2019). Effective Heart Disease Prediction Using Hybrid Machine Learning Techniques. IEEE access 7, 81542–81554. doi:10.1109/ACCESS.2019.2923707
Mostafa, S. S., Morgado-Dias, F., and Ravelo-García, A. G. (2020). Comparison of SFS and mRMR for Oximetry Feature Selection in Obstructive Sleep Apnea Detection. Neural Comput. Applic 32, 15711–15731. doi:10.1007/s00521-018-3455-8
Nagpal, G., Usmani, S. S., and Raghava, G. P. S. (2018). A Web Resource for Designing Subunit Vaccine against Major Pathogenic Species of Bacteria. Front. Immunol. 9, 2280. doi:10.3389/fimmu.2018.02280
O’donnell, T. J., Rubinsteyn, A., Bonsack, M., Riemer, A. B., Laserson, U., and Hammerbacher, J. (2018). MHCflurry: Open-Source Class I MHC Binding Affinity Prediction. Cell. Syst. 7, 129–132 e124. doi:10.1016/j.cels.2018.05.014
Pamer, E. G., Harty, J. T., and Bevan, M. J. (1991). Precise Prediction of A Dominant Class I MHC-Restricted Epitope of Listeria Monocytogenes. Nature 353, 852–855. doi:10.1038/353852a0
Pedregosa, F., Varoquaux, G., Gramfort, A., Michel, V., Thirion, B., Grisel, O., et al. (2011). Scikit-learn: Machine Learning in Python. J. Mach. Learn. Res. 12, 2825–2830.
Resende, D. M., Rezende, A. M., Oliveira, N. J., Batista, I. C., Corrêa-Oliveira, R., Reis, A. B., et al. (2012). An Assessment on Epitope Prediction Methods for Protozoa Genomes. BMC Bioinforma. 13, 309. doi:10.1186/1471-2105-13-309
Sette, A., Buus, S., Appella, E., Smith, J. A., Chesnut, R., Miles, C., et al. (1989). Prediction of Major Histocompatibility Complex Binding Regions of Protein Antigens by Sequence Pattern Analysis. Proc. Natl. Acad. Sci. U.S.A. 86, 3296–3300. doi:10.1073/pnas.86.9.3296
Sharma, G., Rana, P. S., and Bawa, S. (2021). Hybrid Machine Learning Models for Predicting Types of Human T-Cell Lymphotropic Virus. IEEE/ACM Trans. Comput. Biol. Bioinf. 18, 1524–1534. doi:10.1109/TCBB.2019.2944610
Shen, W., Le, S., Li, Y., and Hu, F. (2016). SeqKit: A Cross-Platform and Ultrafast Toolkit for FASTA/Q File Manipulation. PLoS One 11, e0163962. doi:10.1371/journal.pone.0163962
Tomii, K., and Kanehisa, M. (1996). Analysis of Amino Acid Indices and Mutation Matrices for Sequence Comparison and Structure Prediction of Proteins. Protein Eng. Des. Sel. 9, 27–36. doi:10.1093/protein/9.1.27
Trolle, T., Mcmurtrey, C. P., Sidney, J., Bardet, W., Osborn, S. C., Kaever, T., et al. (2016). The Length Distribution of Class I-Restricted T Cell Epitopes Is Determined by Both Peptide Supply and MHC Allele-specific Binding Preference. J. I. 196, 1480–1487. doi:10.4049/jimmunol.1501721
Vita, R., Mahajan, S., Overton, J. A., Dhanda, S. K., Martini, S., Cantrell, J. R., et al. (2019). The Immune Epitope Database (IEDB): 2018 Update. Nucleic Acids Res. 47, D339–D343. doi:10.1093/nar/gky1006
Wang, J., Zhang, D., and Li, J. (2013). PREAL: Prediction of Allergenic Protein by Maximum Relevance Minimum Redundancy (mRMR) Feature Selection. BMC Syst. Biol. 7 (Suppl. 5), S9. doi:10.1186/1752-0509-7-S5-S9
Wei, L., Tang, J., and Zou, Q. (2017a). SkipCPP-Pred: An Improved and Promising Sequence-Based Predictor for Predicting Cell-Penetrating Peptides. BMC Genomics 18, 742. doi:10.1186/s12864-017-4128-1
Wei, L., Xing, P., Su, R., Shi, G., Ma, Z. S., and Zou, Q. (2017b). CPPred-RF: A Sequence-Based Predictor for Identifying Cell-Penetrating Peptides and Their Uptake Efficiency. J. Proteome Res. 16, 2044–2053. doi:10.1021/acs.jproteome.7b00019
Wei, L., Zhou, C., Chen, H., Song, J., and Su, R. (2018). ACPred-FL: A Sequence-Based Predictor Using Effective Feature Representation to Improve the Prediction of Anti-cancer Peptides. Bioinformatics 34, 4007–4016. doi:10.1093/bioinformatics/bty451
Xu, Z., Luo, M., Lin, W., Xue, G., Wang, P., Jin, X., et al. (2021). DLpTCR: An Ensemble Deep Learning Framework for Predicting Immunogenic Peptide Recognized by T Cell Receptor. Brief. Bioinform 22. doi:10.1093/bib/bbab335
Zadeh Hosseingholi, E., Neghabi, N., Molavi, G., Gheibi Hayat, S. M., and Shahriarpour, H. (2020). In Silico Identification and Characterization of Antineoplastic Asparaginase Enzyme from Endophytic Bacteria. IUBMB Life 72, 991–1000. doi:10.1002/iub.2237
Zawawi, A., Forman, R., Smith, H., Mair, I., Jibril, M., Albaqshi, M. H., et al. (2020). In Silico Design of A T-Cell Epitope Vaccine Candidate for Parasitic Helminth Infection. PLoS Pathog. 16, e1008243. doi:10.1371/journal.ppat.1008243
Zhang, J., Ju, Y., Lu, H., Xuan, P., and Zou, Q. (2016). Accurate Identification of Cancerlectins through Hybrid Machine Learning Technology. Int. J. Genomics 2016, 1–11. doi:10.1155/2016/7604641
Zhang, L., Udaka, K., Mamitsuka, H., and Zhu, S. (2012). Toward More Accurate Pan-specific MHC-Peptide Binding Prediction: A Review of Current Methods and Tools. Briefings Bioinforma. 13, 350–364. doi:10.1093/bib/bbr060
Keywords: eukaryotic pathogens, T-cell epitopes, machine learning, hybrid features, LightGBM
Citation: Hu R-S, Wu J, Zhang L, Zhou X and Zhang Y (2022) CD8TCEI-EukPath: A Novel Predictor to Rapidly Identify CD8+ T-Cell Epitopes of Eukaryotic Pathogens Using a Hybrid Feature Selection Approach. Front. Genet. 13:935989. doi: 10.3389/fgene.2022.935989
Received: 04 May 2022; Accepted: 24 May 2022;
Published: 22 July 2022.
Edited by:
Quan Zou, University of Electronic Science and Technology of China, ChinaCopyright © 2022 Hu, Wu, Zhang, Zhou and Zhang. This is an open-access article distributed under the terms of the Creative Commons Attribution License (CC BY). The use, distribution or reproduction in other forums is permitted, provided the original author(s) and the copyright owner(s) are credited and that the original publication in this journal is cited, in accordance with accepted academic practice. No use, distribution or reproduction is permitted which does not comply with these terms.
*Correspondence: Xun Zhou, emhvdXh1bjIwMjIwNDI4QDE2My5jb20=; Ying Zhang, emhhbmd5aW5nMDIxMjEwQDE2My5jb20=
Disclaimer: All claims expressed in this article are solely those of the authors and do not necessarily represent those of their affiliated organizations, or those of the publisher, the editors and the reviewers. Any product that may be evaluated in this article or claim that may be made by its manufacturer is not guaranteed or endorsed by the publisher.
Research integrity at Frontiers
Learn more about the work of our research integrity team to safeguard the quality of each article we publish.