 Cheng Zeng1,2‡
 Yu Liu3‡
 Rong He4
 Xiaohuan Lu5
 Yuyang Dai1
 Guoping Qi1Jingsong Liu1Jianzhong Deng1,2Wenbin Lu1,2Jianhua Jin1,2*Qian Liu1,2*†
- 1Department of Oncology, Wujin Hospital Affiliated with Jiangsu University, Changzhou, Jiangsu, China
- 2Department of Oncology, Wujin Clinical College of Xuzhou Medical University, Changzhou, Jiangsu, China
- 3Department of Internal Medicine, School of Medicine, Dalian Medical University, Dalian, Liaoning, China
- 4Cancer Institute, The Affiliated People’s Hospital of Jiangsu University, Zhenjiang, Jiangsu, China
- 5Department of Gastrointestinal Surgery, Union Hospital, Tongji Medical College, Huazhong University of Science and Technology, Wuhan, China
Background: Cellular senescence is a novel hallmark of cancer associated with patient outcomes and tumor immunotherapy. However, the value of cellular senescence-related long non-coding RNAs (lncRNAs) in predicting prognosis and immunotherapy response for stomach adenocarcinoma (STAD) patients needs further investigation.
Methods: The transcriptome and corresponding clinical information of STAD and cellular senescence-related genes were, respectively, downloaded from the Cancer Genome Atlas (TCGA) and CellAge databases. Differential expression analysis and coexpression analysis were performed to obtain cellular senescence-related lncRNAs. Univariate regression analysis and least absolute shrinkage and selection operator (LASSO) Cox analysis were conducted to establish the cellular senescence-related lncRNA prognostic signature (CSLPS). Next, the survival curve, ROC curve, and nomogram were developed to assess the capacity of predictive models. Moreover, principal component analysis (PCA), gene set enrichment analysis (GSEA), tumor microenvironment (TME), tumor mutation burden (TMB), microsatellite instability (MSI), and tumor immune dysfunction and exclusion (TIDE) score analysis were performed between high- and low-risk groups.
Results: A novel CSLPS involving fifteen lncRNAs (REPIN1-AS1, AL355574.1, AC104695.3, AL033527.2, AC083902.1, TYMSOS, LINC00460, AC005165.1, AL136115.1, AC007405.2, AL391152.1, SCAT1, AC129507.1, AL121748.1, and ADAMTS9-AS1) was developed. According to the nomogram, the risk model based on the CSLPS was an independent prognostic factor and could predict 1-, 3-, and 5-year overall survival for STAD patients. GSEA suggested that the high-risk group was mainly associated with Toll-like receptor, JAK/STAT, NOD-like receptor, and chemokine signaling pathways. Further analysis revealed that STAD patients in the low-risk group with better clinical outcomes had a higher TMB, higher proportion of high microsatellite instability (MSI-H), better immune infiltration, and lower TIDE scores.
Conclusion: A fifteen-CSlncRNA prognostic signature could predict survival outcomes, and patients in the low-risk group may be more sensitive to immunotherapy.
Introduction
Gastric cancer is the fifth most common malignant tumor globally, with over a million new cases in 2020 (Sung et al., 2021). Due to the insidious early symptoms of gastric cancer, most patients have entered the advanced stage at the time of diagnosis, making it the third leading cause of cancer-associated death (Smyth et al., 2020). Stomach adenocarcinoma (STAD) has a high mortality rate and is the most common histological type of gastric cancer. Precision medicine and immunotherapy have recently become hot spots in gastric cancer treatment. However, response rates of immune checkpoint inhibitors remain low (Yarchoan et al., 2017). Therefore, it is urgent to identify potential and beneficial individuals to increase the effect of immunotherapy on gastric cancer.
Cellular senescence, characterized by irreversible cell cycle arrest, is an essential aging phenotype and can accelerate organismal aging (Calcinotto et al., 2019). Studies have shown that cellular senescence is related to many diseases, including atherosclerosis, osteoporosis, glaucoma, neurodegeneration, and type 2 diabetes (Calcinotto et al., 2019). Recently, there has been growing interest in the role of cellular senescence in tumors. However, the role of cellular senescence in tumorigenesis and development remains controversial (Kowald et al., 2020). On the one hand, cellular senescence can activate innate and adaptive immune responses to limit tumorigenesis through the senescence-associated secretory phenotype (SASP), releasing large amounts of cytokines and chemokines (Reimann et al., 2010; Vicente et al., 2016), and on the other hand, the accumulation of senescent cells escaping immune clearance can promote tumor progression and drive tumor vascularization by the SASP, which recruits tumor-infiltrating MDSCs and senescent fibroblasts and promotes cancer stemness (Krtolica et al., 2001; Coppé et al., 2006; Jackson et al., 2012; Milanovic et al., 2018). Intriguingly, in the early stage of hepatic carcinoma, cellular senescence acts as a tumor suppressor, while in the late stage, SASP promotes tumor progression by inhibiting immune surveillance (Eggert et al., 2016). Therefore, it is necessary to further explore the role of cellular senescence in tumor immunity.
Long non-coding RNAs (lncRNAs) are composed of more than 200 nucleotides in length but do not encode proteins. LncRNAs play a vital role in the development of various tumors (Goodall and Wickramasinghe, 2021), and differentially expressed lncRNAs can affect the progression of gastric cancer and are potential markers of gastric cancer diagnosis, prognosis, and drug resistance (Yuan et al., 2020). Previous studies have shown that lncRNAs play an essential role in cellular senescence. For example, LINC00673 knockdown can trigger cellular senescence in a p53-dependent manner and inhibit lung cancer cell proliferation (Roth et al., 2018). Overexpression of lncRNA PLK4 inhibits tumor progression of hepatocellular carcinoma by promoting YAP-mediated cellular senescence (Jia et al., 2020). The NF-κB/HOTAIR (lncRNA) positive feedback loop contributes to cellular senescence in ovarian cancer (Özeş et al., 2016). The TCGA database contains transcriptome data and corresponding clinical data of 30 types of cancer (El-Arabey et al., 2020), and some researchers have constructed lncRNA signatures based on the TCGA database to predict the prognosis of tumor patients and guide individualized treatment (Qing et al., 2022). However, cellular senescence-related lncRNA in STAD has not yet been elucidated.
Our study established and validated a risk signature based on cellular senescence-related lncRNA and explored its prognostic value for STAD patients. Then, the differences in potential signaling pathways, TME, TMB, MSI, and TIDE scores between high- and low-risk groups were further analyzed. We expected our findings to provide a new perspective for predicting prognosis and individualized immunotherapy in STAD patients.
Materials and methods
Data collection
Gene expression profiles for 407 samples (32 normal stomach tissue samples and 375 stomach adenocarcinoma samples) and corresponding clinical and survival information were downloaded from the TCGA database (https://portal.gdc.cancer.gov/). After excluding samples with missing survival time and survival time less than 30 days, the entire set, including 337 STAD cases, was randomly divided into a training set (n = 169, Supplementary Table S1) and a testing set (n = 168, Supplementary Table S2). The training set was utilized to build the risk model, and the testing set and entire set were used to verify the risk model. A total of 279 cellular senescence-related genes were obtained from the CellAge database (https://genomics.senescence.info/cells/, Supplementary Table S3).
Identification of differentially expressed cellular senescence-related lncRNAs (DECSlncRNAs) in STAD
Differentially expressed lncRNAs (DElncRNAs) and cellular senescence-related genes (DECSGs) between 32 normal stomach tissue samples and 375 stomach adenocarcinoma samples were obtained with adjusted p < 0.05 and | log2-fold change (FC)| > 1 using the R package limma (Ritchie et al., 2015). Next, Pearson’s correlation analysis was performed to screen cellular senescence-related lncRNAs (CSlncRNAs) based on DECSGs and lncRNAs with |R|>0.4 and p < 0.001. Finally, DECSlncRNAs were obtained by overlapping DElncRNAs and CSlncRNAs.
Establishment and validation of the cellular senescence-related lncRNA prognostic signature for STAD
Univariate Cox regression analysis was performed to obtain potential prognostic DECSlncRNAs with the threshold of p < 0.05. Then, LASSO Cox regression analysis was executed to reduce overfitting lncRNAs with 10-fold cross-validation and 1,000 repeated times. The risk score of each STAD patient was calculated based on the expression levels and regression coefficients of cellular senescence-related lncRNAs. The formula was as follows: Risk score = β lncRNA1 × exp lncRNA1 + ß lncRNA2 × exp lncRNA2 + … + ß lncRNAn × exp lncRNAn. Patients were divided into high- and low-risk groups based on the median risk score.
To compare overall survival (OS) between the high- and low-risk groups in training, testing , and the entire set, Kaplan–Meier survival analysis was performed using the R packages survminer and survival (Zhao et al., 2021). Subgroup analysis for the OS of STAD patients was also performed based on clinicopathological characteristics. ROC curves were constructed, and the area under the curve (AUC) values were calculated using the R package survival ROC (Heagerty et al., 2000).
Independent prognostic and nomogram analysis
We performed univariate and multivariate Cox regression analyses to explore whether the risk score could be an independent prognostic factor for STAD patients. Age, gender, grade, clinical stage, tumor size (T), distance metastasis (M), lymph node metastasis (N), and risk score were included for analysis. To predict the survival of STAD patients at 1, 3, and 5 years, a nomogram integrating the risk score and clinicopathological factors was created using the R package rms (Xu et al., 2021). Calibration curves were plotted to detect the predictive performance of the nomograms for OS.
Principal component analysis and gene set enrichment analysis
PCA is a commonly used unsupervised learning method that can reduce the dimension of multidimensional data and extract the main feature components of the data (Ringnér, 2008). To explore the distribution of high- and low-risk patients, we performed PCA based on the whole-genome, CSlncRNAs, and the CSLPS, including 15 cellular senescence-related lncRNAs.
GSEA software (version 4.1.0) was utilized to explore potential biological functions in high- and low-risk groups. The c2. cp.kegg.v7.4. symbols.gmt were used for annotated gene sets. A total of one thousand permutations were performed, and the normalized enrichment score (NES) was calculated based on the Affymetrix chip platform. Normal p-value < 0.05 and a false discovery rate (FDR q-value) < 0.25 were regarded as significantly enriched (Subramanian et al., 2005).
Investigation of the immune landscape
The ESTIMATE algorithm was utilized to explore the difference in the TME between high- and low-risk groups. XCELL, TIMER, QUANTISEQ, MCPCOUNTER, EPIC, CIBERSORT-ABS, and CIBERSORT algorithms were utilized to analyze the correlation between immune components and risk scores based on CSLPS. Moreover, single-sample GSEA (ssGSEA) was used to analyze 16 infiltrating immune cells and 13 immune functions between high- and low-risk groups using the R package gsva (Hänzelmann et al., 2013). We also performed immune checkpoint-related gene differential expression analysis between the two subgroups.
Immunotherapy response analysis
The mutation data of STAD patients were also downloaded from the TCGA database and analyzed using the R package Maftools (Mayakonda et al., 2018). The TMB difference between the high- and low-risk groups was compared. Then, patients were divided into high- and low-TMB groups according to the best cut-off TMB values. Survival analysis was performed based on tumor mutation burden status and risk score. Furthermore, we downloaded the microsatellite status data from TCIA (http://tcia.at/) and compared the differences between high- and low-risk groups. The tumor immune dysfunction and exclusion (TIDE) algorithm was utilized to explore the immunotherapy response in STAD patients using the website (http://tide.dfci.harvard.edu/).
Statistical analysis
R software (version 4.1.2) was used for statistical analyses. The Wilcoxon test was used to compare clinicopathological characteristics, TME, TMB, MSI, and TIDE scores between high- and low-risk groups. The Kaplan–Meier curve was used to compare survival between different groups. Univariate and multivariate Cox regression analyses were used to analyze independent prognostic factors. ROC curves were used to assess the predictive power of the CSLPS. p < 0.05 was considered statistically significant. *, p < 0.05; **p < 0.01; ***p < 0.001.
Results
Identification of differentially expressed cellular senescence-related lncRNAs (DECSlncRNAs)
The research process is shown in Figure 1. From the TCGA database, we downloaded 32 normal stomach tissue samples and 375 stomach adenocarcinoma samples. Then, the 279 genes obtained from the CellAge database were compared in 32 normal stomach tissue samples and 375 stomach adenocarcinoma samples to explore the expression of cellular senescence-related genes in STAD patients. Among them, 47 genes were upregulated, whereas 23 were downregulated (Supplementary Table S4). A total of 595 cellular senescence-related lncRNAs were obtained from coexpression analysis based on 70 cellular senescence-related genes via the criteria |R|>0.4 and p < 0.001 (Figure 2A; Supplementary Table S5). Then, 393 DECSlncRNAs were identified by overlapping with 3625 DElncRNAs in STAD (Figures 2B,C; Supplementary Table S6).
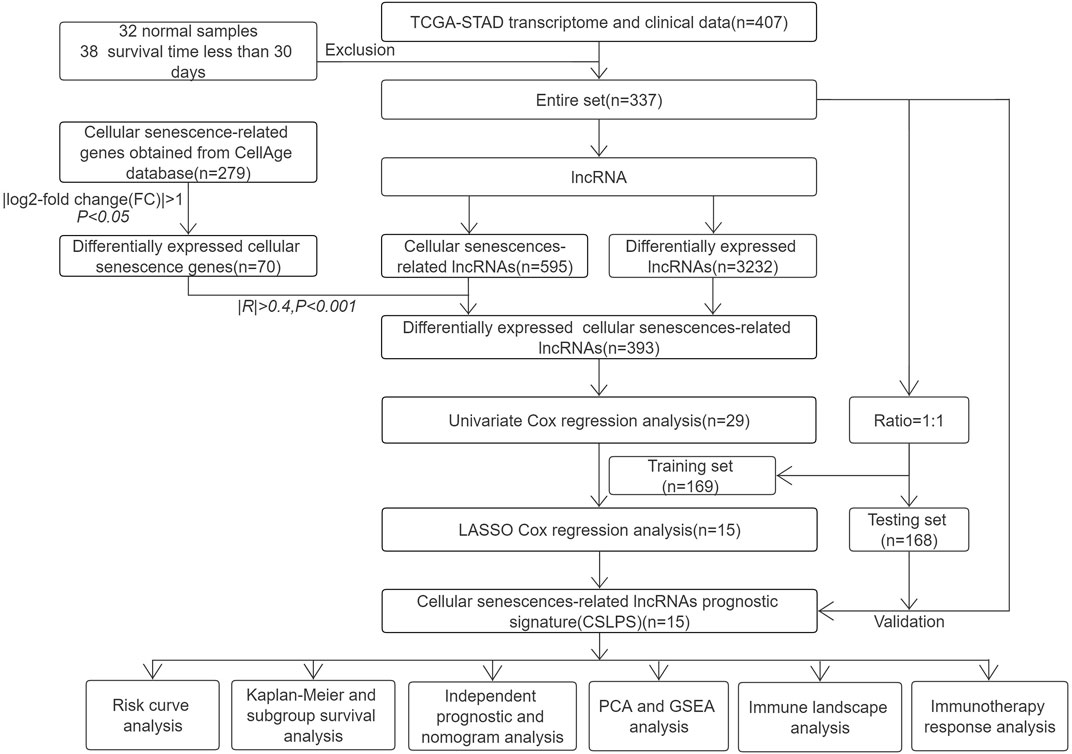
FIGURE 1. Flow chart of the study.
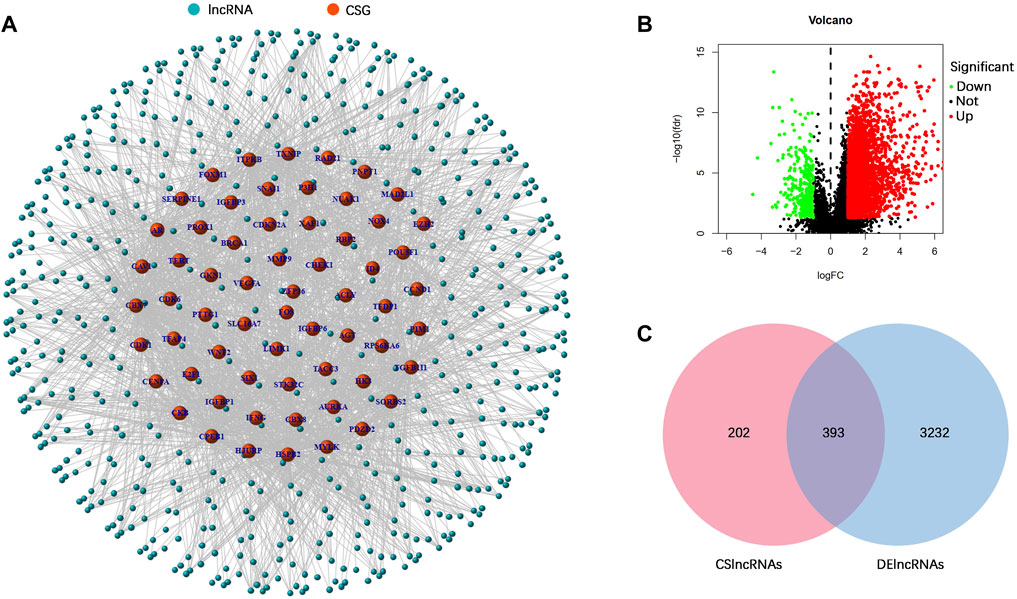
FIGURE 2. Identification of differentially expressed cellular senescence-related lncRNAs. (A) Coexpression analysis of lncRNAs and differentially expressed cellular senescence-related genes. (B) Volcano plot of differentially expressed lncRNAs in the TCGA–STAD dataset. (C) Venn diagram of DElncRNAs and cellular senescence-related lncRNAs.
Construction and validation of the cellular senescence-related lncRNA prognostic signature
After excluding samples with a survival time of less than 30 days, 337 out of 375 STAD samples were set as the entire set. No statistical differences in clinicopathological factors were observed between the training and testing sets (Table 1). Univariate Cox regression analysis showed that 29 lncRNAs were significantly associated with OS (p < 0.05, Figure 3A). To reduce overfitting of lncRNAs, LASSO Cox regression analysis was performed, and 15 of the 29 lncRNAs were chosen to construct CSLPS based on 1,000 times 10-fold cross-validation and the optimal value (Figures 3B,C; Table 2). The Sankey diagram displayed that six were protective and nine were risk lncRNAs (Figure 3D). Among them, AC007405.2, AL033527.2, AL136115.1, AL355574.1, REPIN1-AS1, and TYMSOS are potential protective factors, but AL391152.1, AC005165.1, AC083902.1, AC104695.3, AC129507.1, ADAMTS9-AS1, AL121748.1, LINC00460, and SCAT1 are underlying hazardous indicators. Risk score was calculated according to the formula: risk score = (−0.0056 × REPIN1-AS1) + (−0.0779 × AL355574.1) + (0.1341 × AC104695.3) + (−0.5803 × AL033527.2) + (0.7814 × AC083902.1) + (−0.1343 × TYMSOS) + (0.0129 × LINC00460) + (0.0104 × AC005165.1) + (−0.6483 × AL136115.1) + (−0.2790 × AC007405.2) + (0.8521 × AL391152.1) + (0.0659 × SCAT1) + (0.7297 × AC129507.1) + (1.8695 × AL121748.1) + (−0.9227 × ADAMTTS9-AS1).
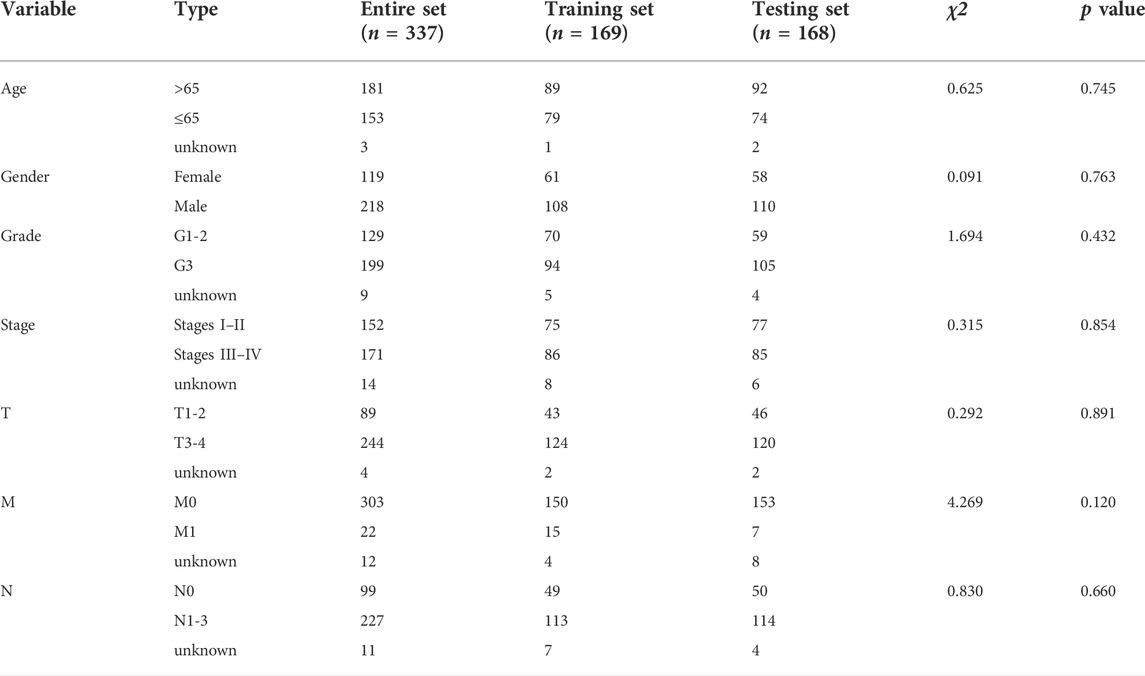
TABLE 1. Clinical features in the training set, testing set, and entire set.
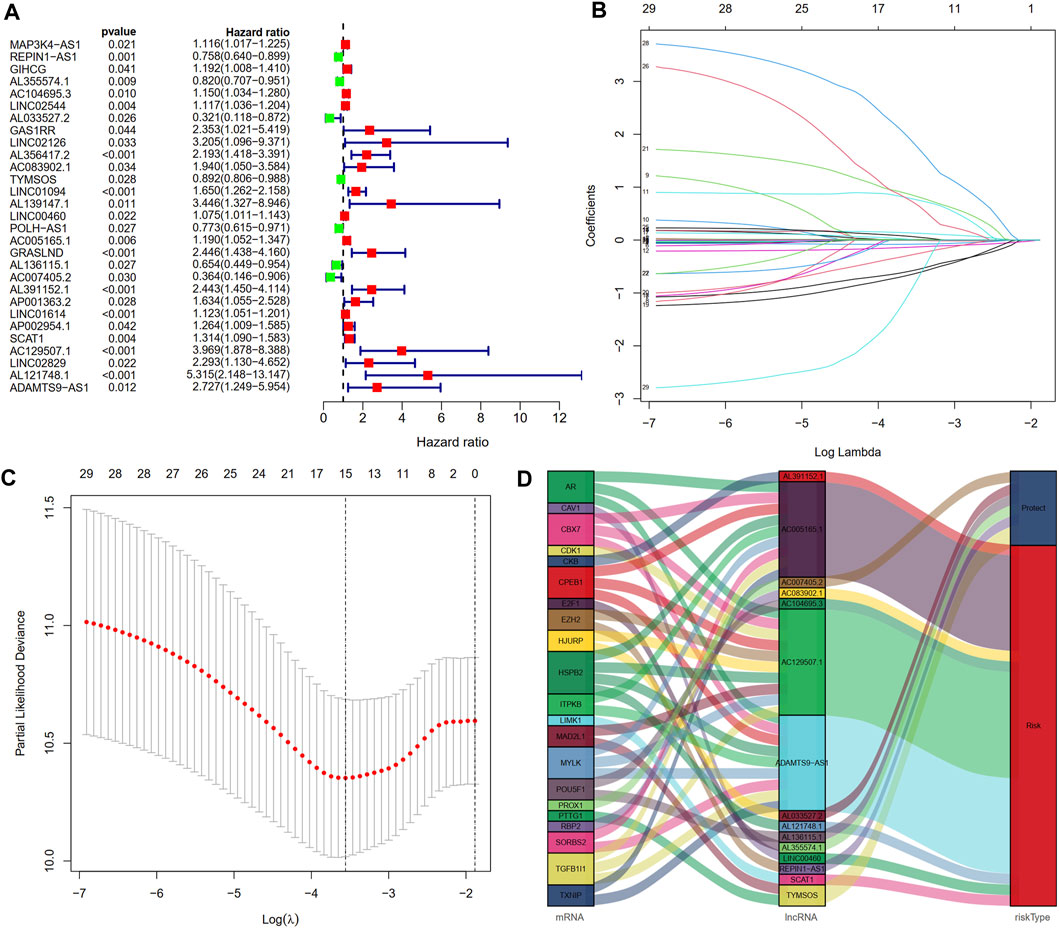
FIGURE 3. Construction of a cellular senescence-related lncRNA prognostic model. (A) Twenty-nine cellular senescence-related prognostic lncRNAs were obtained by univariate Cox regression analysis. (B,C) Cellular senescence-related lncRNA prognostic signature (CSLPS) was identified by the LASSO Cox regression analysis. (D) Sankey diagram of cellular senescence-related genes and lncRNAs.
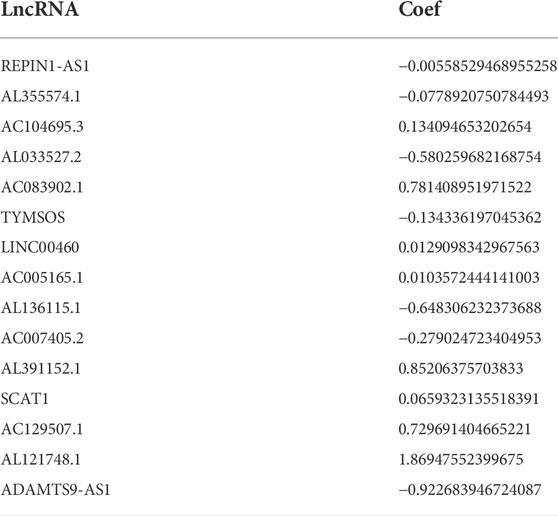
TABLE 2. Regression coefficients of 15 cellular senescence-related lncRNAs.
According to the median value of the risk score, STAD patients were divided into high- and low-risk groups. As shown in Figures 4A,B, the risk score was positively associated with the number of deaths. The Kaplan–Meier survival analysis indicated that STAD patients in the high-risk group had significantly shorter OS time than those in the low-risk group (Figure 4C). The 1-, 3-, and 5-year AUC values were 0.741, 0.819, and 0.865, respectively (Figure 4D). Moreover, the AUC value of the risk score at 1 year was higher than that of age, gender, grade, stage, T, M, and N (Figure 4E). At the same time, we performed the same analysis in two validation sets. Similar results were observed in the testing and entire sets (Figures 4F–O). Taken together, our established CSLPS shows good performance in predicting survival outcomes of STAD patients.
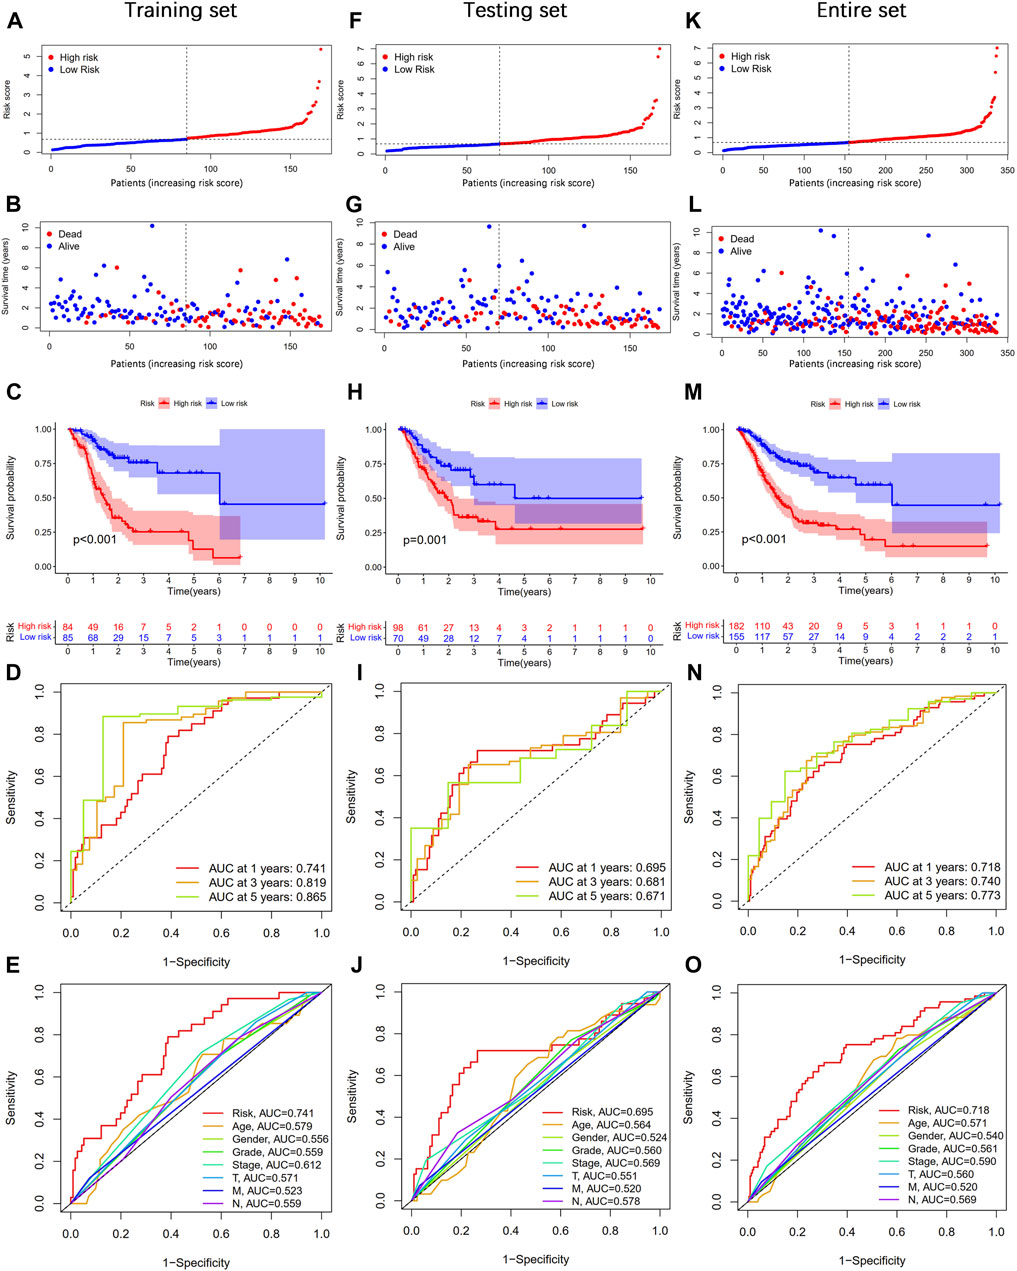
FIGURE 4. Prognosis value of the cellular senescence-related lncRNA prognostic signature (CSLPS). (A) Distribution of risk score, (B) survival status, (C) Kaplan–Meier survival curves, (D) the 1-, 2-, and 3-year ROC curves, (E) and the 1-year ROC curves of risk score and clinical characteristics in the training set. (F–O) Validation sets, including the testing set and the entire set, were analyzed similarly.
Subgroup survival analysis
To further explore whether the CSLPS was associated with the clinicopathological features of STAD patients, we performed a subgroup survival analysis. The subgroups were divided by age (>65 years or ≤ 65 years), sex (female or male), grade (G1-2 or G3), M stage (M0 or M1), N stage (N0 or N1-3), TNM stage (stages I–II or stages III–IV), and T stage (T1-2 or T3-4). We found that the OS time of high-risk group STAD patients was significantly shorter than that of low-risk group STAD patients in all the subgroups (Figure 5).
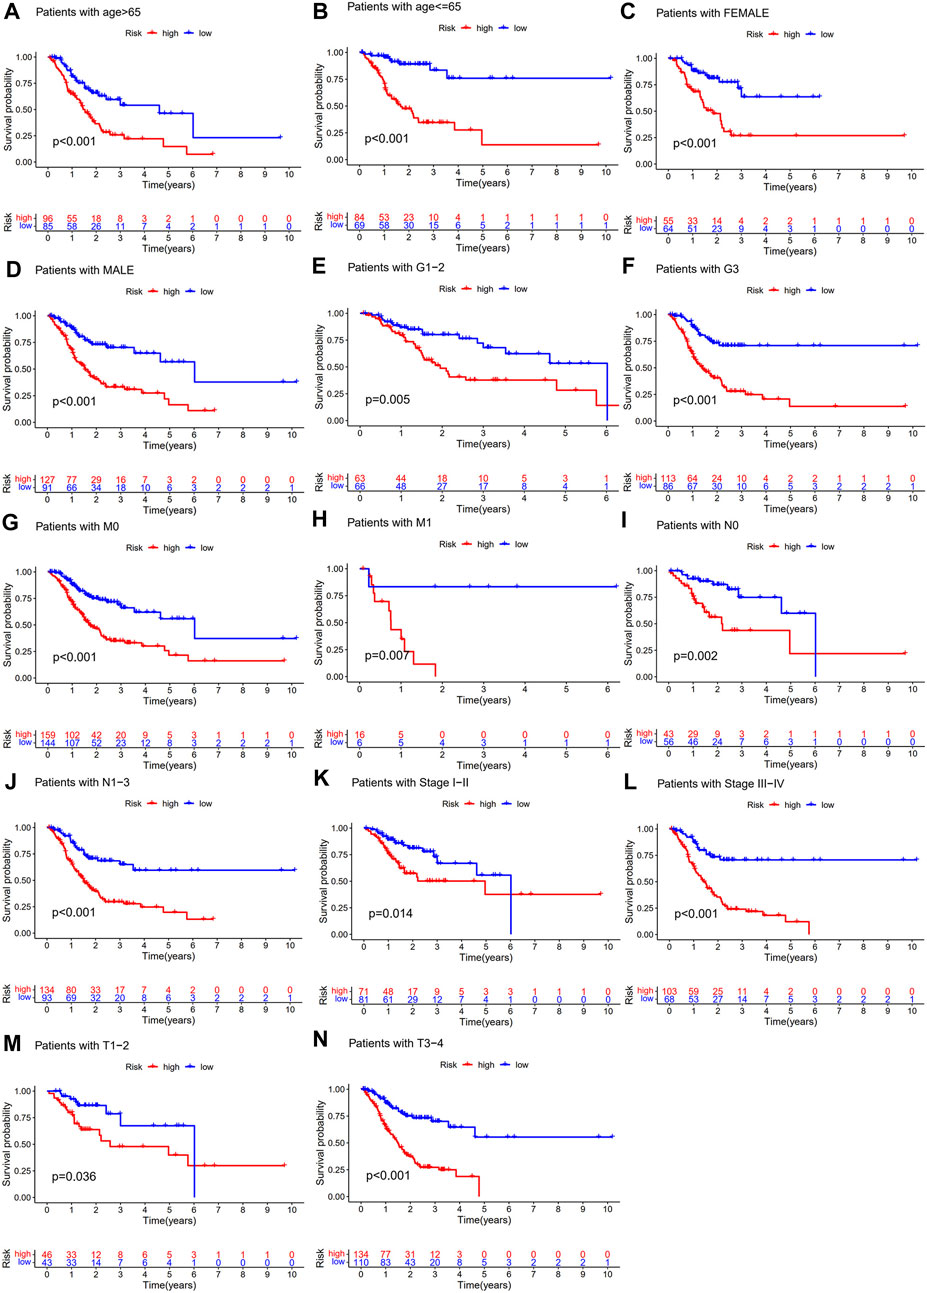
FIGURE 5. Subgroup survival analysis of the cellular senescence-related lncRNA prognostic model. Kaplan–Meier survival analysis for (A) age >65 years, (B) age ≤ 65 years, (C) female, (D) male, (E) G1-2, (F) G3, (G) M0, (H) M1, (I) N0, (J) N1-3, (K) stages I–II, (L) stages III–IV, (M) T1-2, and (N) T3-4 between high- and low-risk groups.
Independent prognostic and nomogram analysis
We conducted univariate and multivariate Cox regression analyses to explore whether CSLPS could be an independent prognostic factor for STAD patients. Univariate Cox regression analysis showed that age (HR = 1.019, 1.001–1.037, p = 0.036), stage (HR = 1.496, 1.199–1.867, p < 0.001), N stage (HR = 1.315, 1.120–1.545, p < 0.001), and risk score (HR = 1.468, 1.288–1.673, p < 0.001) predicted worse OS (Figure 6A). Furthermore, multivariate Cox regression analysis verified that the risk score (HR = 1.542, 1.330–1.787, p < 0.001) based on CSLPS was an independent prognostic factor in STAD patients (Figure 6B). To further improve the predictive value of the CSLPS in STAD patients, we constructed a nomogram taking into account age, gender, stage, grade, T, N, M, and risk score to predict OS at 1, 3, and 5 years (Figure 6C). The 1-, 3-, and 5-year calibration curves demonstrated good agreement between predicted and observed OS (Figure 6D).
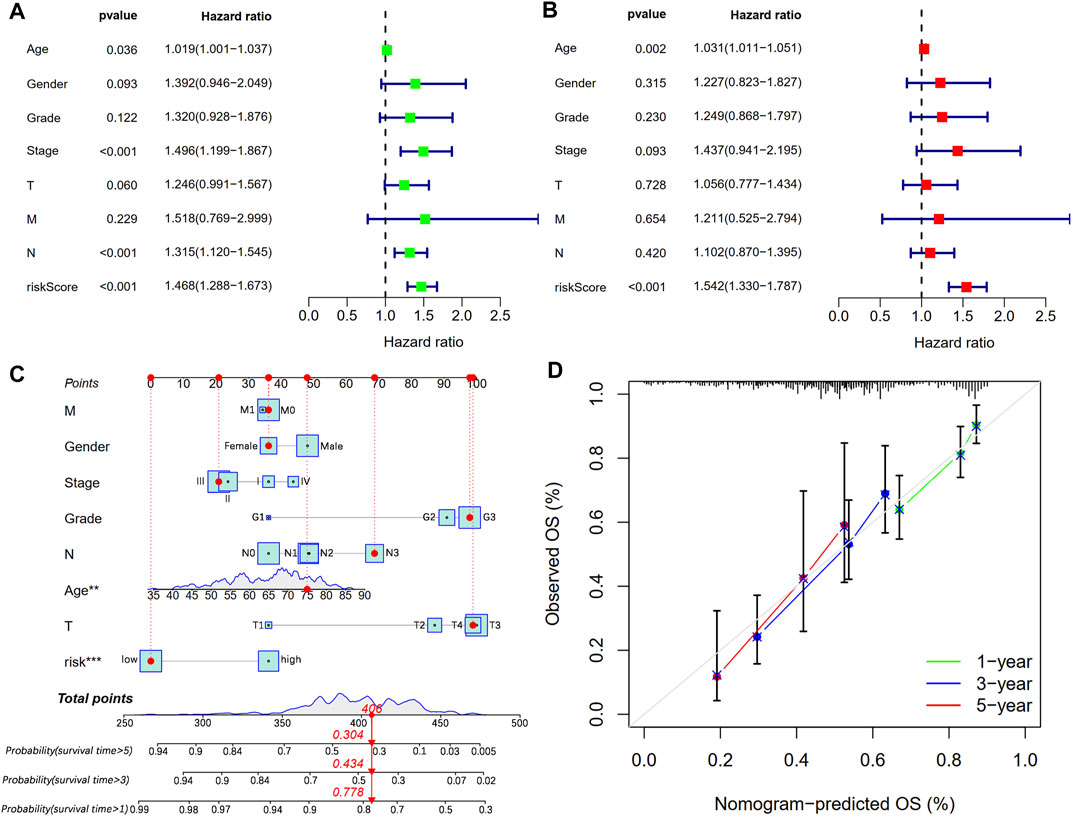
FIGURE 6. Independent prognostic analysis and prognostic nomogram establishment. (A) Univariate and (B) multivariate Cox regression analyses of clinical features and risk score with OS. (C) Nomogram to predict STAD patients’ outcomes in 1, 3, and 5 years. (D) Calibration curves for 1-, 3-, and 5-year OS.
Principal component analysis and gene set enrichment analysis
PCA visualization analysis based on the whole genome and CSlncRNAs showed that the distribution of the high-risk group and the low-risk group was scattered (Figures 7A,B), while visualization analysis based on the 15 lncRNAs in CSLPS showed that the high- and low-risk groups had significantly different distributions (Figure 7C). PCA further verified the grouping ability of CSLPS, including 15 CSlncRNAs. Next, GSEA was utilized to explore the potential biological functions of patients in high- and low-risk groups based on the CSLPS. The results suggested that the high-risk group was associated with the Toll-like receptor signaling pathway, JAK/STAT signaling pathway, NOD-like receptor signaling pathway, chemokine signaling pathway, and cytokine–cytokine receptor interaction (Figures 8A–E). In contrast, the low-risk group was related to glycosylphosphatidylinositol GPI anchor biosynthesis (Figure 8F).
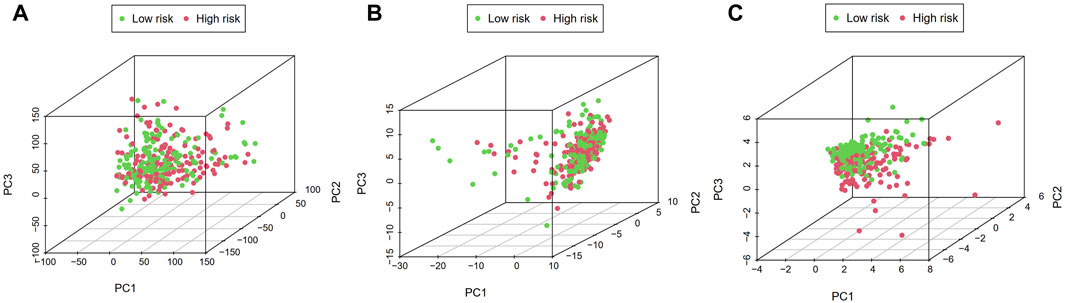
FIGURE 7. Principal component analysis (PCA). Distribution of high- and low-risk groups based on the (A) whole-genome, (B) cellular senescence-related lncRNAs, and (C) the risk model including fifteen cellular senescence-related lncRNAs.
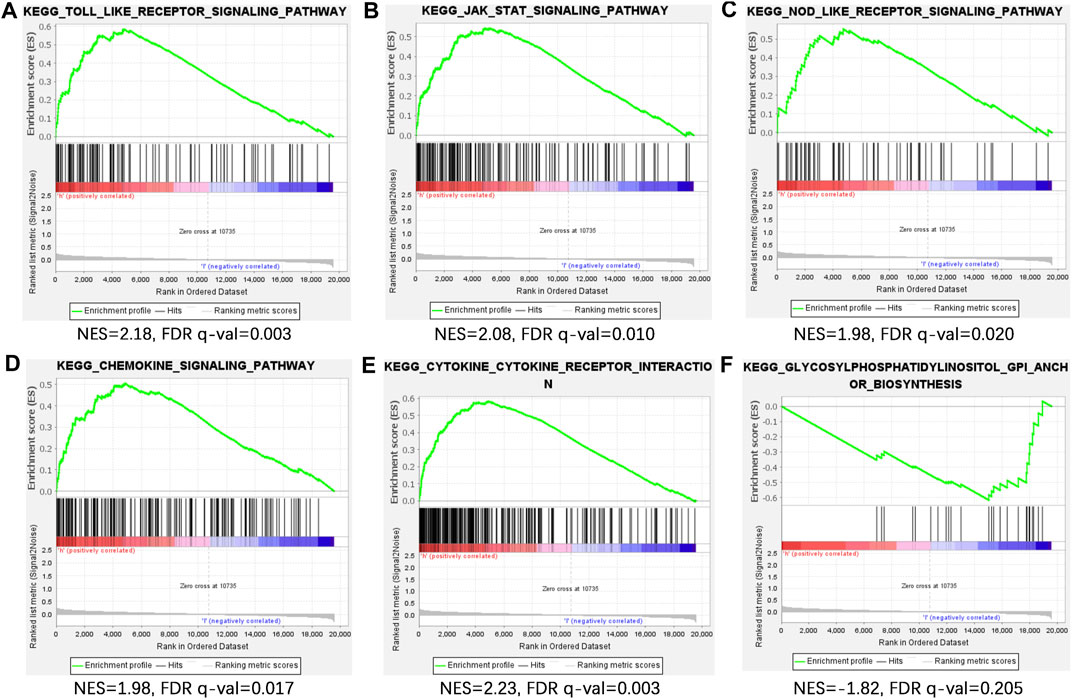
FIGURE 8. Gene set enrichment analysis (GSEA) of CSLPS. (A) Toll-like receptor signaling pathway, (B) JAK/STAT signaling pathway, (C) NOD-like receptor signaling pathway, (D) chemokine signaling pathway, (E) and cytokine–cytokine receptor interaction were activated in the high-risk group. (F) Glycosylphosphatidylinositol GPI anchor biosynthesis was activated in the low-risk group.
Immune landscape analysis
To explore the relevance of our established CSLPS to the immune landscape, we first explored differences in the TME between high- and low-risk groups. ESTIMATE analysis showed that the high-risk group had higher stromal, immune, and ESTIMATE scores (Figure 9A). Then, we explored the correlation between risk scores and immune cell infiltration. A bubble chart based on seven different algorithms showed that the risk score was positively correlated with myeloid dendritic cells, cancer-associated fibroblasts, M2 macrophages, B cells, hematopoietic stem cells, T cell CD8+, and mast cells while negatively correlated with NK cells, M1 macrophage, T cell CD4+ Th1, and T cell CD4+ Th2 (all p < 0.05, Figure 9B, Supplementary Table S7). In addition, ssGESA was applied to explore the difference between the two subgroups of 16 immune cells and 13 immune-related pathways. We found that B cells, DCs, iDCs, macrophages, mast cells, neutrophils, NK cells, pDCs, T helper cells, TIL, Treg, CCR, parainflammation, and type Ⅱ IFN response were more enriched in the high-risk group, while the MHC class Ⅰ is less enriched in the high-risk group (Figures 9C,D). Finally, we analyzed the expression levels of the immune checkpoint-related genes between the two subgroups. The results showed that TNFSF14, CD28, CD276, TNFSF18, CD80, CD40LG, BTLA, LAIR1, NRP1, CD86, TNFRSF8, CD200, CD48, PDCD1LG2, and CD200R1 genes were more highly expressed in the high-risk group, while TNFSF9 and TNFRSF14 were lower expressed in the high-risk group (Figure 9E). The aforementioned findings indicate that high-risk group patients present an immunosuppressive microenvironment.
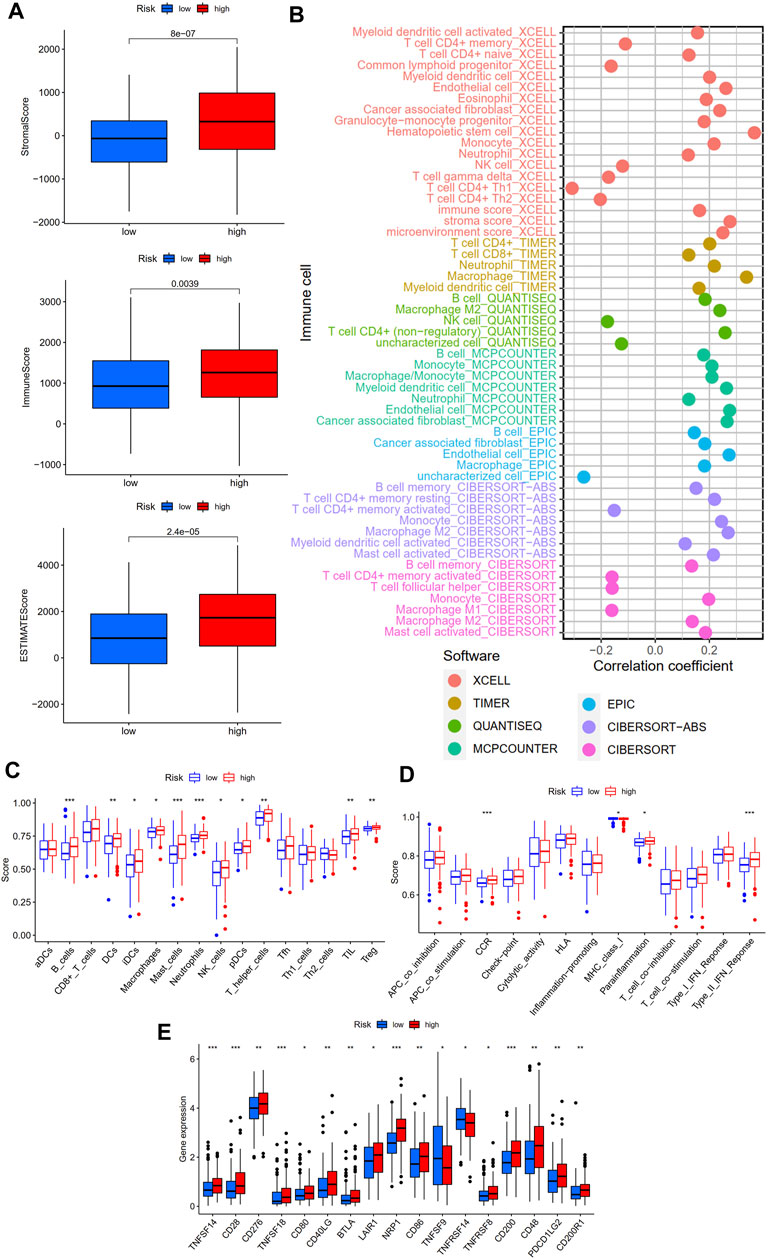
FIGURE 9. Immune landscape of the cellular senescence-related lncRNAs model. (A) Tumor microenvironment analysis between high- and low-risk groups by ESTIMATE. (B) Correlation analysis of immune components and risk scores based on XCELL, TIMER, QUANTISEQ, MCPCOUNTER, EPIC, CIBERSORT-ABS, and CIBERSORT algorithms. (C) Sixteen immune cells and (D) 13 immune-related functions between the high- and low-risk groups by ssGSEA. (E) Expression of immune checkpoint-related genes between the high- and low-risk groups. *p < 0.05; **, p < 0.01; ***p < 0.001.
Immunotherapy response analysis
TMB and MSI were considered predictive biomarkers of tumor immunotherapy response (Cristescu et al., 2018; Liu et al., 2019). As shown in Figure 10A, the most common type of mutation in high- and low-risk group patients was missense mutation, and the top three mutated genes were TTN, TP53, and MUC16. Intriguingly, TTN and MUC16 were more likely to be mutated in the low-risk group than in the high-risk group. Moreover, TMB was negatively associated with risk scores, and STAD patients in high-risk groups had a lower TMB than those in low-risk groups (Figures 10B,C). Survival analysis showed that STAD patients with a high TMB had better outcomes than those with a low TMB (Figure 10D), and the risk score reduced the prognostic value in the high-TMB group according to the survival analysis combined TMB and risk score (Figure 10E). In addition, the low-risk group had a lower proportion of patients with microsatellite stability (MSS) and a higher proportion of patients with high microsatellite instability (MSI-H) (Figure 10F; Supplementary Table S8). In addition, the TIDE score was a novel valuable predictive biomarker for tumor immunotherapy response, and patients with lower TIDE scores could benefit from immunotherapy and have a longer survival time (Jiang et al., 2018). Interestingly, we found that STAD patients in the low-risk group had lower TIDE scores and T-cell dysfunction scores than those in the high-risk group, but no statistical difference between the two subgroups in T cell exclusion was found (Figure 10G). The aforementioned results suggest that the low-risk group of STAD patients may be more effective for immunotherapy.
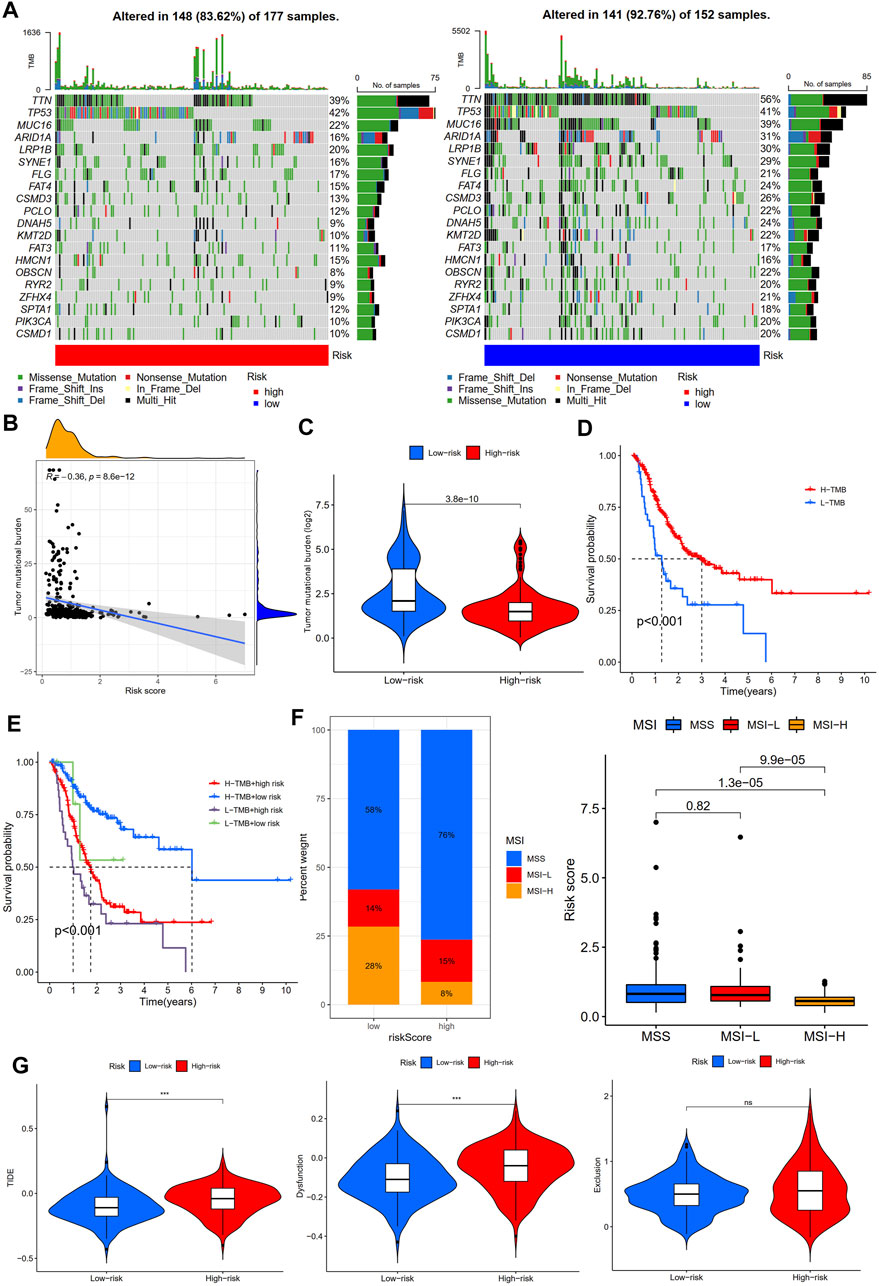
FIGURE 10. Immunotherapy response analysis between high- and low-risk groups. (A) Mutation profile of STAD patients in high- and low-risk groups. (B) Correlation analysis of TMB and risk scores. (C) Tumor mutation burden analysis between high- and low-risk groups. (D) Survival analysis between high- and low-tumor mutation burden (TMB) in STAD patients. (E) Survival analysis based on tumor mutation burden status and the risk score. (F) Microsatellite instability (MSI) analysis of STAD patients in high- and low-risk groups. (G) TIDE, dysfunction, and exclusion scores between high- and low-risk groups.
Discussion
STAD is a common malignant tumor of the digestive system with insidious onset and high mortality (Sung et al., 2021). Cellular senescence, a new hallmark of cancer, displays both antitumor and pro-tumor activity (Hanahan, 2022). LncRNA-related risk signatures have recently become a research hotspot due to their excellent predictive performance (Wang et al., 2021; Qing et al., 2022). However, prognostic signature based on cellular senescence-related lncRNAs has remained unexplored in STAD.
Our study first identified 393 differentially expressed cellular senescence-related lncRNAs through differential expression analysis and correlation analysis. Then, a prognostic signature containing fifteen lncRNAs was established using univariate Cox regression analysis and LASSO Cox regression analysis. Survival analysis and ROC curve analysis demonstrated that the prognostic signature has an excellent prognostic predictive ability in STAD in the training set. Meanwhile, we performed the same analysis in the two validation sets, namely, the testing set and the entire set and surprisingly obtained similar results. In addition, our subgroup survival analysis showed shorter overall survival in high-risk groups in each clinical subgroup. Furthermore, univariate and multivariate regression analyses showed that the risk score based on the fifteen lncRNAs was an independent prognostic factor for STAD patients. Immediately afterward, we constructed a nomogram using the risk score and clinicopathological characteristics, which can accurately and reliably predict the 1-, 3-, and 5-year survival rates of STAD patients. In recent years, ferroptosis and immune-related lncRNA prognostic models have shown good predictive ability (Guo et al., 2021; Yuan et al., 2021), and the prognostic model based on cellular senescence-related lncRNAs in this study has the same excellent predictive performance, which not only demonstrates the reliability of our study but also provides a basis for further exploring the role of the lncRNA/mRNA regulatory network in tumor cellular senescence.
Our established novel prognostic signature consists of fifteen cellular senescence-related lncRNAs. AC007405.2, AL033527.2, and AC083902.1 were identified for the first time. AL136115.1, AL355574.1, and REPIN1-AS1 were reported as favorable underlying factors for STAD patients (Chen et al., 2021; Zhang et al., 2021; Luo et al., 2022), while AL391152.1 (Liu et al., 2020), AC005165.1 (Wang et al., 2022), AC104695.3 (Zhang et al., 2021), and AC129507.1 (Zha et al., 2021) were risk lncRNAs for STAD patients, which is consistent with our results. ADAMTS9-AS1 can inhibit apoptosis and autophagy through the PI3K/AKT/mTOR signaling pathway and promote bladder cancer progression (Yang et al., 2021) while inhibiting colon cancer cell progression through the Wnt/β-catenin signaling pathway (Li et al., 2020). Curiously, ADAMTS9-AS1 has also promoted colorectal cancer cell proliferation and epithelial–mesenchymal transition (EMT) (Chen et al., 2020). However, there is no relevant research on ADAMTS9-AS1 in STAD. Lai et al. (2021) demonstrated that AL121748.1 was a ferroptosis-related lncRNA associated with immunotherapy responses in STAD patients. LINC00460 may play oncogenic roles and serve as a potential prognostic biomarker in various tumors (Dai et al., 2020), including colorectal cancer, gastric cancer, head and neck squamous cell carcinoma, and hepatocellular carcinoma (Jiang et al., 2019; Tu et al., 2019; Yang et al., 2020; Hou et al., 2021). In colorectal cancer, LINC00460 was overexpressed and promoted proliferation, migration, and invasion by enhancing HMGA1 mRNA stability (Hou et al., 2021). In gastric cancer, LINC00460 promoted tumor progression by silencing CCNG2 in an EZH2/LSD1-dependent manner (Yang et al., 2020). AL139352.1 and AL121748.1 were reported as risk factors and associated with poor prognosis in gastric cancer (Liu et al., 2020; Lai et al., 2021), which is consistent with our findings. Zhang et al. (2020) reported that a three-lncRNA signature, including SCAT1, could predict pathological response and outcome for esophageal squamous cell carcinoma patients.
To further explore the potential biological functions of the risk model, we first performed a PCA analysis. The results showed that STAD patients could be more clearly divided into two subgroups based on fifteen cellular senescence-related lncRNAs, demonstrating the prognostic signature’s superiority. Next, GSEA was performed to investigate the difference between the two subgroups. We found that the Toll-like receptor signaling pathway, JAK/STAT signaling pathway, NOD-like receptor signaling pathway, chemokine signaling pathway, and cytokine–cytokine receptor interaction were enriched in high-risk groups. The Toll-like receptor signaling pathway played a critical role in the innate and adaptive immune system and was expected to be a novel strategy for tumor immunotherapy (Aluri et al., 2021; Nouri et al., 2021). Interestingly, Hari et al. found that Toll-like receptor 2 could control the senescence-associated secretory phenotype (Hari et al., 2019). Similarly, Toll-like receptor 4 knockdown decreased cellular senescence by S100A9 (Shi et al., 2019). Other signaling pathways enriched in the high-risk groups were also related to immune regulation (Caruso et al., 2014; Griffith et al., 2014; Yoshimura et al., 2018). Therefore, we further explored the immune infiltration between high- and low-risk groups. We found that the high-risk group had higher stromal, immune, and ESTIMATE scores, indicating a different tumor microenvironment from the low-risk group. Macrophages are divided into two types, M1 and M2. Studies have shown that M1 macrophages can promote inflammatory responses and exert antitumor effects, while M2 macrophages induce an immunosuppressive microenvironment and promote tumor progression (Pan et al., 2020). Our findings showed that risk scores were positively correlated with M2 macrophages and negatively correlated with M1 macrophages. Patients with high-risk scores had shorter overall survival, which may be related to M2 macrophage infiltration. Furthermore, risk scores were positively correlated with cancer-associated fibroblasts (CAFs). CAFs interact with tumor-infiltrating immune cells by secreting various cytokines, growth factors, chemokines, exosomes, and other effector molecules, thereby forming an immunosuppressive TME, enabling cancer cells to evade the immune surveillance system (Liao et al., 2019). Studies have shown that MHC class I is a second “don’t eat me” signal on the surface of cancer cells, and low expression of MHC class I antigens hinders antigen presentation and promotes tumor cell immune escape (Yamamoto et al., 2020). Our study found that STAD patients in the high-risk group had lower expression of MHC class I antigens, suggesting that the poor clinical outcomes of STAD patients in the high-risk group might be related to the immune escape of tumor cells.
In recent years, targeted immune checkpoint therapy has been a milestone in treating gastric cancer, but the response rate of the overall population to immunotherapy is not high (Zhao et al., 2019). Therefore, screening out the population with a high response to immunotherapy is necessary for more precise treatment. Studies have shown that TMB, MSI, and TIDE scores are predictive markers of immunotherapy efficacy, and patients with high TMB, MSI-H, and low TIDE scores have a better response to immunotherapy and have more prolonged survival (Cristescu et al., 2018; Jiang et al., 2018; Liu et al., 2019). Studies have shown that when there is a loss of mismatch repair gene function in tumor cells, the wrongly replicated DNA cannot be repaired in time, which increases TMB and generates neoantigens (Picard et al., 2020). Immune cells can effectively recognize tumor cell neoantigens and form tumor-infiltrating lymphocytes, thereby inhibiting tumor growth. Our study found that the risk score was inversely correlated with the TMB, and patients in the low-risk group had a higher TMB. Therefore, we speculate that the more prolonged survival of STAD patients with a high TMB may be related to the antitumor immunity caused by more neoantigens. Survival analysis showed that the risk score based on CSLPS could affect the survival of STAD patients independently of TMB, which further demonstrated that the risk score was an independent prognostic factor for STAD patients and was consistent with the previous multivariate regression analysis. In addition, patients in the low-risk group had higher proportions of MSI-H and lower TIDE scores. The aforementioned results demonstrated that the risk score could reflect the immunotherapy response to a certain extent. Thus, our prognostic signature based on cellular senescence-related lncRNAs may provide novel perspectives in screening high-benefit populations of immunotherapy.
Our study has the following advantages: First, we screened out the differentially expressed and prognosis-related cellular senescence-related lncRNAs in STAD, which will provide clues for the subsequent exploration of the mechanism of lncRNAs in senescence. Second, we found significant differences in the tumor immune microenvironment between high- and low-risk groups, and patients in the high-risk group presented an immunosuppressive microenvironment, which provided a direction for exploring the reasons for the short overall survival of high-risk patients. Third, immunotherapy response analysis found that patients in the low-risk group had a higher response rate to immune checkpoint therapy, which would provide a reference for the selection of immunotherapy for STAD patients.
There are several limitations to our study: First, external verification and additional clinical STAD patients are needed further to confirm the performance of our established prognostic signature. Moreover, in vivo and in vitro experiments are required to understand the relationship between risk scores and TME, TMB, and MSI.
Conclusion
In conclusion, we developed a novel cellular senescence-related lncRNA prognostic signature, which could accurately predict the prognosis for STAD patients. Furthermore, low-risk groups displayed higher TMB, a higher proportion of MSI-H, and lower TIDE scores, implying more sensitivity to immunotherapy.
Data availability statement
Publicly available datasets were analyzed in this study. The names of the repository/repositories and accession number(s) can be found in the article/Supplementary Material.
Author contributions
All the authors participated in the conception and design of the study; protocol/project development—JJ and QL; data collection or management—CZ, YL, RH, and XL; data analysis—CZ, YL, YD, GQ, JL, JD, and WL; manuscript writing/editing—CZ. All the authors read and approved the manuscript. CZ and YL contributed equally to this work.
Funding
The work was supported by the National Natural Science Foundation of China, (grant number 81872275); by the Scientific Research Project of Jiangsu Commission of Health (M2020002); by the funds of Changzhou Sci & Tech Program, (grant number CJ20200004).
Acknowledgments
The authors gratefully acknowledge the multiple databases which provided the data.
Conflict of interest
The authors declare that the research was conducted in the absence of any commercial or financial relationships that could be construed as a potential conflict of interest.
Publisher’s note
All claims expressed in this article are solely those of the authors and do not necessarily represent those of their affiliated organizations, or those of the publisher, the editors, and the reviewers. Any product that may be evaluated in this article, or claim that may be made by its manufacturer, is not guaranteed or endorsed by the publisher.
Supplementary material
The Supplementary Material for this article can be found online at: https://www.frontiersin.org/articles/10.3389/fgene.2022.935056/full#supplementary-material
References
Aluri, J., Cooper, M. A., and Schuettpelz, L. G. (2021). Toll-like receptor signaling in the establishment and function of the immune system. Cells 10 (6), 1374. doi:10.3390/cells10061374
Calcinotto, A., Kohli, J., Zagato, E., Pellegrini, L., Demaria, M., and Alimonti, A. (2019). Cellular senescence: aging, cancer, and injury. Physiol. Rev. 99 (2), 1047–1078. doi:10.1152/physrev.00020.2018
Caruso, R., Warner, N., Inohara, N., and Núñez, G. (2014). NOD1 and NOD2: signaling, host defense, and inflammatory disease. Immunity 41 (6), 898–908. doi:10.1016/j.immuni.2014.12.010
Chen, W., Tu, Q., Yu, L., Xu, Y., Yu, G., Jia, B., et al. (2020). LncRNA ADAMTS9-AS1, as prognostic marker, promotes cell proliferation and EMT in colorectal cancer. Hum. Cell 33 (4), 1133–1141. doi:10.1007/s13577-020-00388-w
Chen, D., Wang, M., Xu, Y., Jiang, X., Xiong, L., Zhang, L., et al. (2021). A novel autophagy-related lncRNA prognostic signature associated with immune microenvironment and survival outcomes of gastric cancer patients. Int. J. Gen. Med. 14, 6935–6950. doi:10.2147/IJGM.S331959
Coppé, J.-P., Kauser, K., Campisi, J., and Beauséjour, C. M. (2006). Secretion of vascular endothelial growth factor by primary human fibroblasts at senescence. J. Biol. Chem. 281 (40), 29568–29574. doi:10.1074/jbc.M603307200
Cristescu, R., Mogg, R., Ayers, M., Albright, A., Murphy, E., Yearley, J., et al. (2018). Pan-tumor genomic biomarkers for PD-1 checkpoint blockade-based immunotherapy. Sci. (New York, N.Y.) 362 (6411), eaar3593. doi:10.1126/science.aar3593
Dai, C., Zhang, Y., Ni, H., Kuang, Y., and Xu, Z. (2020). Prognostic significance of LINC00460 overexpression in solid tumours: a meta-analysis. Postgrad. Med. J. 96 (1135), 286–295. doi:10.1136/postgradmedj-2019-137172
Eggert, T., Wolter, K., Ji, J., Ma, C., Yevsa, T., Klotz, S., et al. (2016). Distinct functions of senescence-associated immune responses in liver tumor surveillance and tumor progression. Cancer Cell 30 (4), 533–547. doi:10.1016/j.ccell.2016.09.003
El-Arabey, A. A., Abdalla, M., and Abd-Allah, A. R. (2020). SnapShot: TP53 status and macrophages infiltration in TCGA-analyzed tumors. Int. Immunopharmacol. 86, 106758. doi:10.1016/j.intimp.2020.106758
Goodall, G. J., and Wickramasinghe, V. O. (2021). RNA in cancer. Nat. Rev. Cancer 21 (1), 22–36. doi:10.1038/s41568-020-00306-0
Griffith, J. W., Sokol, C. L., and Luster, A. D. (2014). Chemokines and chemokine receptors: positioning cells for host defense and immunity. Annu. Rev. Immunol. 32, 659–702. doi:10.1146/annurev-immunol-032713-120145
Guo, Q., Zhang, X., Shen, T., and Wang, X. (2021). Identification of autophagy- and ferroptosis-related lncRNAs functioned through immune-related pathways in head and neck squamous carcinoma. Life (Basel, Switz. 11 (8), 835. doi:10.3390/life11080835
Hanahan, D. (2022). Hallmarks of cancer: New dimensions. Cancer Discov. 12 (1), 31–46. doi:10.1158/2159-8290.CD-21-1059
Hänzelmann, S., Castelo, R., and Guinney, J. (2013). GSVA: gene set variation analysis for microarray and RNA-seq data. BMC Bioinforma. 14, 7. doi:10.1186/1471-2105-14-7
Hari, P., Millar, F. R., Tarrats, N., Birch, J., Quintanilla, A., Rink, C. J., et al. (2019). The innate immune sensor Toll-like receptor 2 controls the senescence-associated secretory phenotype. Sci. Adv. 5 (6), eaaw0254. doi:10.1126/sciadv.aaw0254
Heagerty, P. J., Lumley, T., and Pepe, M. S. (2000). Time-dependent ROC curves for censored survival data and a diagnostic marker. Biometrics 56 (2), 337–344. doi:10.1111/j.0006-341x.2000.00337.x
Hou, P., Meng, S., Li, M., Lin, T., Chu, S., Li, Z., et al. (2021). LINC00460/DHX9/IGF2BP2 complex promotes colorectal cancer proliferation and metastasis by mediating HMGA1 mRNA stability depending on m6A modification. J. Exp. Clin. Cancer Res. 40 (1), 52. doi:10.1186/s13046-021-01857-2
Jackson, J. G., Pant, V., Li, Q., Chang, L. L., Quintás-Cardama, A., Garza, D., et al. (2012). p53-mediated senescence impairs the apoptotic response to chemotherapy and clinical outcome in breast cancer. Cancer Cell 21 (6), 793–806. doi:10.1016/j.ccr.2012.04.027
Jia, Y., Jin, H., Gao, L., Yang, X., Wang, F., Ding, H., et al. (2020). A novel lncRNA PLK4 up-regulated by talazoparib represses hepatocellular carcinoma progression by promoting YAP-mediated cell senescence. J. Cell. Mol. Med. 24 (9), 5304–5316. doi:10.1111/jcmm.15186
Jiang, P., Gu, S., Pan, D., Fu, J., Sahu, A., Hu, X., et al. (2018). Signatures of T cell dysfunction and exclusion predict cancer immunotherapy response. Nat. Med. 24 (10), 1550–1558. doi:10.1038/s41591-018-0136-1
Jiang, Y., Cao, W., Wu, K., Qin, X., Wang, X., Li, Y., et al. (2019). LncRNA LINC00460 promotes EMT in head and neck squamous cell carcinoma by facilitating peroxiredoxin-1 into the nucleus. J. Exp. Clin. Cancer Res. 38 (1), 365. doi:10.1186/s13046-019-1364-z
Kowald, A., Passos, J. F., and Kirkwood, T. B. L. (2020). On the evolution of cellular senescence. Aging Cell 19 (12), e13270. doi:10.1111/acel.13270
Krtolica, A., Parrinello, S., Lockett, S., Desprez, P. Y., and Campisi, J. (2001). Senescent fibroblasts promote epithelial cell growth and tumorigenesis: a link between cancer and aging. Proc. Natl. Acad. Sci. U. S. A. 98 (21), 12072–12077. doi:10.1073/pnas.211053698
Lai, D., Tan, L., Zuo, X., Liu, D., Jiao, D., Wan, G., et al. (2021). Prognostic ferroptosis-related lncRNA signatures associated with immunotherapy and chemotherapy responses in patients with stomach cancer. Front. Genet. 12, 798612. doi:10.3389/fgene.2021.798612
Li, N., Li, J., Mi, Q., Xie, Y., Li, P., Wang, L., et al. (2020). Long non-coding RNA ADAMTS9-AS1 suppresses colorectal cancer by inhibiting the Wnt/β-catenin signalling pathway and is a potential diagnostic biomarker. J. Cell. Mol. Med. 24 (19), 11318–11329. doi:10.1111/jcmm.15713
Liao, Z., Tan, Z. W., Zhu, P., and Tan, N. S. (2019). Cancer-associated fibroblasts in tumor microenvironment - accomplices in tumor malignancy. Cell. Immunol. 343, 103729. doi:10.1016/j.cellimm.2017.12.003
Liu, L., Bai, X., Wang, J., Tang, X.-R., Wu, D.-H., Du, S.-S., et al. (2019). Combination of TMB and CNA stratifies prognostic and predictive responses to immunotherapy across metastatic cancer. Clin. Cancer Res. 25 (24), 7413–7423. doi:10.1158/1078-0432.CCR-19-0558
Liu, M., Li, J., Huang, Z., and Li, Y. (2020). Gastric cancer risk-scoring system based on analysis of a competing endogenous RNA network. Transl. Cancer Res. 9 (6), 3889–3902. doi:10.21037/tcr-19-2977
Luo, L., Li, L., Liu, L., Feng, Z., Zeng, Q., Shu, X., et al. (2022). A necroptosis-related lncRNA-based signature to predict prognosis and probe molecular characteristics of stomach adenocarcinoma. Front. Genet. 13, 833928. doi:10.3389/fgene.2022.833928
Mayakonda, A., Lin, D.-C., Assenov, Y., Plass, C., and Koeffler, H. P. (2018). Maftools: efficient and comprehensive analysis of somatic variants in cancer. Genome Res. 28 (11), 1747–1756. doi:10.1101/gr.239244.118
Milanovic, M., Fan, D. N. Y., Belenki, D., Däbritz, J. H. M., Zhao, Z., Yu, Y., et al. (2018). Senescence-associated reprogramming promotes cancer stemness. Nature 553 (7686), 96–100. doi:10.1038/nature25167
Nouri, Y., Weinkove, R., and Perret, R. (2021). T-cell intrinsic toll-like receptor signaling: implications for cancer immunotherapy and CAR T-cells. J. Immunother. Cancer 9 (11), e003065. doi:10.1136/jitc-2021-003065
Özeş, A. R., Miller, D. F., Özeş, O. N., Fang, F., Liu, Y., Matei, D., et al. (2016). NF-κB-HOTAIR axis links DNA damage response, chemoresistance and cellular senescence in ovarian cancer. Oncogene 35 (41), 5350–5361. doi:10.1038/onc.2016.75
Pan, Y., Yu, Y., Wang, X., and Zhang, T. (2020). Tumor-associated macrophages in tumor immunity. Front. Immunol. 11, 583084. doi:10.3389/fimmu.2020.583084
Picard, E., Verschoor, C. P., Ma, G. W., and Pawelec, G. (2020). Relationships between immune landscapes, genetic subtypes and responses to immunotherapy in colorectal cancer. Front. Immunol. 11, 369. doi:10.3389/fimmu.2020.00369
Qing, X., Xu, W., Liu, S., Chen, Z., Ye, C., and Zhang, Y. (2022). Molecular characteristics, clinical significance, and cancer immune interactions of angiogenesis-associated genes in gastric cancer. Front. Immunol. 13, 843077. doi:10.3389/fimmu.2022.843077
Reimann, M., Lee, S., Loddenkemper, C., Dörr, J. R., Tabor, V., Aichele, P., et al. (2010). Tumor stroma-derived TGF-beta limits myc-driven lymphomagenesis via Suv39h1-dependent senescence. Cancer Cell 17 (3), 262–272. doi:10.1016/j.ccr.2009.12.043
Ringnér, M. (2008). What is principal component analysis? Nat. Biotechnol. 26 (3), 303–304. doi:10.1038/nbt0308-303
Ritchie, M. E., Phipson, B., Wu, D., Hu, Y., Law, C. W., Shi, W., et al. (2015). Limma powers differential expression analyses for RNA-sequencing and microarray studies. Nucleic Acids Res. 43 (7), e47. doi:10.1093/nar/gkv007
Roth, A., Boulay, K., Groß, M., Polycarpou-Schwarz, M., Mallette, F. A., Regnier, M., et al. (2018). Targeting LINC00673 expression triggers cellular senescence in lung cancer. RNA Biol. 15 (12), 1499–1511. doi:10.1080/15476286.2018.1553481
Shi, L., Zhao, Y., Fei, C., Guo, J., Jia, Y., Wu, D., et al. (2019). Cellular senescence induced by S100A9 in mesenchymal stromal cells through NLRP3 inflammasome activation. Aging 11 (21), 9626–9642. doi:10.18632/aging.102409
Smyth, E. C., Nilsson, M., Grabsch, H. I., van Grieken, N. C., and Lordick, F. (2020). Gastric cancer. Lancet (London, Engl. 396 (10251), 635–648. doi:10.1016/S0140-6736(20)31288-5
Subramanian, A., Tamayo, P., Mootha, V. K., Mukherjee, S., Ebert, B. L., Gillette, M. A., et al. (2005). Gene set enrichment analysis: a knowledge-based approach for interpreting genome-wide expression profiles. Proc. Natl. Acad. Sci. U. S. A. 102 (43), 15545–15550. doi:10.1073/pnas.0506580102
Sung, H., Ferlay, J., Siegel, R. L., Laversanne, M., Soerjomataram, I., Jemal, A., et al. (2021). Global cancer statistics 2020: GLOBOCAN estimates of incidence and mortality worldwide for 36 cancers in 185 countries. Ca. Cancer J. Clin. 71 (3), 209–249. doi:10.3322/caac.21660
Tu, J., Zhao, Z., Xu, M., Chen, M., Weng, Q., and Ji, J. (2019). LINC00460 promotes hepatocellular carcinoma development through sponging miR-485-5p to up-regulate PAK1. Biomed. Pharmacother. 118, 109213. doi:10.1016/j.biopha.2019.109213
Vicente, R., Mausset-Bonnefont, A.-L., Jorgensen, C., Louis-Plence, P., and Brondello, J.-M. (2016). Cellular senescence impact on immune cell fate and function. Aging Cell 15 (3), 400–406. doi:10.1111/acel.12455
Wang, Y., Zhang, X., Dai, X., and He, D. (2021). Applying immune-related lncRNA pairs to construct a prognostic signature and predict the immune landscape of stomach adenocarcinoma. Expert Rev. Anticancer Ther. 21 (10), 1161–1170. doi:10.1080/14737140.2021.1962297
Wang, W., Pei, Q., Wang, L., Mu, T., and Feng, H. (2022). Construction of a prognostic signature of 10 autophagy-related lncRNAs in gastric cancer. Int. J. Gen. Med. 15, 3699–3710. doi:10.2147/IJGM.S348943
Xu, D., Wang, Y., Liu, X., Zhou, K., Wu, J., Chen, J., et al. (2021). Development and clinical validation of a novel 9-gene prognostic model based on multi-omics in pancreatic adenocarcinoma. Pharmacol. Res. 164, 105370. doi:10.1016/j.phrs.2020.105370
Yamamoto, K., Venida, A., Yano, J., Biancur, D. E., Kakiuchi, M., Gupta, S., et al. (2020). Autophagy promotes immune evasion of pancreatic cancer by degrading MHC-I. Nature 581 (7806), 100–105. doi:10.1038/s41586-020-2229-5
Yang, J., Lian, Y., Yang, R., Lian, Y., Wu, J., Liu, J., et al. (2020). Upregulation of lncRNA LINC00460 facilitates GC progression through epigenetically silencing CCNG2 by EZH2/LSD1 and indicates poor outcomes. Mol. Ther. Nucleic Acids 19, 1164–1175. doi:10.1016/j.omtn.2019.12.041
Yang, G., Li, Z., Dong, L., and Zhou, F. (2021). lncRNA ADAMTS9-AS1 promotes bladder cancer cell invasion, migration, and inhibits apoptosis and autophagy through PI3K/AKT/mTOR signaling pathway. Int. J. Biochem. Cell Biol. 140, 106069. doi:10.1016/j.biocel.2021.106069
Yarchoan, M., Hopkins, A., and Jaffee, E. M. (2017). Tumor mutational burden and response rate to PD-1 inhibition. N. Engl. J. Med. 377 (25), 2500–2501. doi:10.1056/NEJMc1713444
Yoshimura, A., Ito, M., Chikuma, S., Akanuma, T., and Nakatsukasa, H. (2018). Negative regulation of cytokine signaling in immunity. Cold Spring Harb. Perspect. Biol. 10 (7), a028571. doi:10.1101/cshperspect.a028571
Yuan, L., Xu, Z. Y., Ruan, S. M., Mo, S., Qin, J. J., and Cheng, X. D. (2020). Long non-coding RNAs towards precision medicine in gastric cancer: early diagnosis, treatment, and drug resistance. Mol. Cancer 19 (1), 96. doi:10.1186/s12943-020-01219-0
Yuan, M., Wang, Y., Sun, Q., Liu, S., Xian, S., Dai, F., et al. (2021). Identification of a nine immune-related lncRNA signature as a novel diagnostic biomarker for hepatocellular carcinoma. Biomed. Res. Int. 2021, 9798231. doi:10.1155/2021/9798231
Zha, Z., Zhang, P., Li, D., Liu, G., and Lu, L. (2021). Identification and construction of a long noncoding RNA prognostic risk model for stomach adenocarcinoma patients. Dis. Markers 2021, 8895723. doi:10.1155/2021/8895723
Zhang, C., Zhang, Z., Zhang, G., Xue, L., Yang, H., Luo, Y., et al. (2020). A three-lncRNA signature of pretreatment biopsies predicts pathological response and outcome in esophageal squamous cell carcinoma with neoadjuvant chemoradiotherapy. Clin. Transl. Med. 10 (4), e156. doi:10.1002/ctm2.156
Zhang, S., Li, X., Tang, C., and Kuang, W. (2021). Inflammation-related long non-coding RNA signature predicts the prognosis of gastric carcinoma. Front. Genet. 12, 736766. doi:10.3389/fgene.2021.736766
Zhao, Q., Cao, L., Guan, L., Bie, L., Wang, S., Xie, B., et al. (2019). Immunotherapy for gastric cancer: dilemmas and prospect. Brief. Funct. Genomics 18 (2), 107–112. doi:10.1093/bfgp/ely019
Keywords: cellular senescence, lncRNAs, immune infiltration, tumor mutation burden, microsatellite instability, stomach adenocarcinoma
Citation: Zeng C, Liu Y, He R, Lu X, Dai Y, Qi G, Liu J, Deng J, Lu W, Jin J and Liu Q (2022) Identification and validation of a novel cellular senescence-related lncRNA prognostic signature for predicting immunotherapy response in stomach adenocarcinoma. Front. Genet. 13:935056. doi: 10.3389/fgene.2022.935056
Received: 30 May 2022; Accepted: 03 August 2022;
Published: 25 August 2022.
Edited by:
Yuan Li, Renmin Hospital of Wuhan University, ChinaReviewed by:
Wen Cai, Zhejiang University, ChinaBowen Zhang, University of Science and Technology of China, China
Liu Le Ping, Central South University, China
Gulnihal Ozcan, Koç University, Turkey
Amr Ahmed El-Arabey, Al-Azhar University, Egypt
Copyright © 2022 Zeng, Liu, He, Lu, Dai, Qi, Liu, Deng, Lu, Jin and Liu. This is an open-access article distributed under the terms of the Creative Commons Attribution License (CC BY). The use, distribution or reproduction in other forums is permitted, provided the original author(s) and the copyright owner(s) are credited and that the original publication in this journal is cited, in accordance with accepted academic practice. No use, distribution or reproduction is permitted which does not comply with these terms.
*Correspondence: Jianhua Jin, amlhbmh1YWppbjg4QHNpbmEuY29t; Qian Liu, bHFpYW45NTI4QDE2My5jb20=
†ORCID: Qian Liu, orcid.org/0000-0002-1574-6150
‡These authors have contributed equally to this work