- 1Department of Oncology, The First Affiliated Hospital of Anhui Medical University, Hefei, Anhui, China
- 2Department of Integrated Traditional Chinese and Western Medicine, Anhui Medical University, Hefei, Anhui, China
Aim: Existing targeted therapies for hepatocellular carcinoma (HCC) are resistant and have limitations. It is crucial to find new HCC-related target genes.
Methods: RNA-sequencing data of HCC were gathered from The Cancer Genome Atlas and Gene Expression Omnibus datasets. Initially, differentially expressed genes between normal and tumor tissues were identified from four Gene Expression Omnibus datasets, GSE36376, GSE102079, GSE54236, and GSE45267. GO terms and KEGG pathway enrichment analyses were performed to explore the potential biological functions of differentially expressed genes. A PPI network was constructed by using the STRING database, and up-regulated and down-regulated hub genes were defined through 12 topological approaches. Subsequently, the correlation bounded by up-regulated genes and down-regulated genes in the diagnosis, prognosis, and clinicopathological features of HCC was analyzed. Beyond a shadow of doubt, the key oncogene PBK and tumor suppressor gene F9 were screened out, and the specific mechanism was investigated through GSEA enrichment analysis and immune correlation analysis. The role of PBK in HCC was further verified by western blot, CCK8, transwell, and tube formation experiments.
Results: CDCA5, CDC20, PBK, PRC1, TOP2A, and NCAPG are good indicators of HCC diagnosis and prognosis. The low expressions of F9, AFM, and C8B indicate malignant progression and poor prognosis of HCC. PBK was found to be closely related to VEGF, VEGFR, and PDGFR pathways. Experiments showed that PBK promotes HCC cell proliferation, migration, invasion, and tube formation in HUVEC cells. F9 was negatively correlated with the degree of immune infiltration, and low expression of F9 suggested a poor response to immunotherapy.
Conclusion: The role of HCC-related oncogenes and tumor-suppressor genes in diagnosis and prognosis was identified. In addition, we have found that PBK may promote tumor proliferation through angiogenesis and F9 may be a predictor of tumor immunotherapy response.
Introduction
Hepatocellular carcinoma (HCC) attracted widespread attention due to its high incidence rate and hovering mortality rate (Siegel et al., 2022). According to the global cancer statistics in 2020, the mortality of HCC ranks third, up to 8.3% (Sung et al., 2021). Although the first-line therapy of liver cancer continues to provide breakthroughs, its long-term survival is still unsatisfactory. Gene and molecular targeted therapy of HCC is the focus of current research. Advances in molecular targeted therapies grant us to further make explorations of precise molecular mechanisms of carcinogenesis and facilitate us to identify potential diagnostic and prognostic biomarkers for HCC (Llovet et al., 2018), which requires us to further reinforce the identification and screening of oncogenes and tumor-suppressor genes.
Oncogenes and tumor-suppressor genes act against each other, preserve balance, and accurately regulate the growth, proliferation, and apoptosis of normal cells. When mutations or changes in the expression of oncogenes or oncogenes thus disrupt this balance, cancers can be caused (Baeissa et al., 2016).
Currently, public data and bioinformatic analysis methods have provided us with invaluable resources to find HCC-related oncogenes and tumor-suppressor genes. Some studies searched cancer-related target genes through public databases, whether prognostic oncogene identification (Gao et al., 2021; Yan et al., 2021; Shen et al., 2022a; Gao et al., 2022), single-gene research studies (Ding et al., 2022; Yang et al., 2022), or immune-related oncogenes (Chen et al., 2020; Shen et al., 2022b; Long et al., 2022), all of which provided a strong basis for targeted therapy and precise treatment of liver cancer. However, many studies only consider the differential expression of oncogenes in tumors, ignoring the important role and potential association of tumor-suppressor genes. In addition, with continuous refreshing of the sequencing results and the gradual improvement of technology, the joint analysis of the combined multinomial databases makes the target gene prediction more accurate and reliable. Continuous exploration and updating of the prediction of HCC target genes is warranted.
In the present study, we identified DEGs based on four datasets from GEO: GSE36376, GSE102079, GSE54236, and GSE45267. Gene Ontology (GO) and Kyoto Encyclopedia of Genes and Genomes (KEGG) pathway enrichment analyses were performed subsequently. Afterward, we used the STRING database to construct a protein–protein interaction (PPI) network and identified six up-regulated and six down-regulated hub genes by using Cytoscape software; the correlation between these hub genes and clinical indexes such as clinical-stage, histological grade, as well as clinical status was investigated. Then, we built a prognostic model and screened prognostic genes by analyzing the overall survival (OS), disease-free survival (DSS), and progress-free interval (PFI) indicators. Convincingly, we identified six oncogenes and three tumor-suppressor genes as major prognostic biomarkers. Meanwhile, the mechanisms of key genes PBK and F9 were also focused on and explored, and it was determined that PBK may promote the proliferation of HCC through angiogenesis. F9 was associated with immunotherapy for HCC, and a low expression of F9 represents lower reactivity to immune checkpoint inhibitors.
Materials and methods
Cell culture
MHCC97H cells were purchased from the Chinese Academy of Sciences (Shanghai, China). The HUVECs were from Bioogenetech (Shanghai, China). These cells were placed in an incubator at 37°C and 5% carbon dioxide.
Small-interference RNA transfection
Small-interfering RNA targeting PBK was constructed from the RiboBio Co., Ltd. (Guangzhou, China). The cells were spread onto six-well plates and grown to 60%. Transfection was performed using Lipofectamine™ 2000 (Invitrogen, United States) according to the instructions. The siRNA target sequence is described in Supplementary Table S1.
Cell viability analysis
Cells were seeded onto 96-well plates (3 × 10³ cells/well). The cell proliferation rate was determined by CCK8 solution (BestBio, Shanghai, China), and the absorbance was measured at 450 nm.
Transwell assay
The MHCC97H cells were re-suspended in a medium with 5% FBS and placed in the upper chambers. The bottom chamber was filled with a medium with 20% FBS. After 24 h, the migrating cells were fixed with formaldehyde, stained with crystal violet, and counted. The invasion assay was performed in the same way, and the bottom of the chamber was covered with 1:6 dilution of Matrigel (Corning, United States).
Tube formation assay
Medium supernatants from the control group and PBK knockdown group of MHCC97H cells were collected. The tube formation assay was performed according to the given method (Chen et al., 2021). The number of branches was analyzed using WimTube (https://www.wimasis.com).
Western blot
A western blot analysis was performed (Zhu et al., 2020). Antibodies were all purchased from Proteintech (Wuhan, China).
Data acquisition and processing
The NCBI GEO database (http://www.ncbi.nlm.nih.gov/geo) is an open-access platform for data. RNA-sequencing datasets containing HCC tissue samples and normal tissue samples were obtained from the GEO database, including GSE36376, GSE102079, GSE54236, and GSE45267, and were downloaded for further analysis. DEG mRNA expressions were detected in 371 HCC tissues and 50 normal liver tissues from The Cancer Genome Atlas (TCGA) database.
Identification of differentially expressed genes
The limma package of R software was used to identify the DEGs in four datasets. Adj p value <..05 and | log2 fold change (FC) | ≥ 1 were set as the threshold values of DEG identification. Then, OmicStudio tools (https://www.omicstudio.cn/tool) were used to make Venn diagrams. Four dataset-intersection genes were extracted.
Enrichment analysis of differentially expressed genes
The clusterProfiler package (version 3.14.3) of R software was used for the enrichment analysis with the following ontology sources: GO biological processes (BPs), cellular components (CCs), molecular functions (MFs), and KEGG pathway. Using p < .05 and count ≥2 as cut-off values, we identified the DEG-enriched pathways.
Pathway activation level calculation
Pathway activation level (PAL) is a metric allowing the direct calculation of pathway activity levels using high-throughput gene expression data. A positive value for PAL indicates activation of the pathway, while a negative value indicates inhibition of the pathway. PAL values were obtained based on the OncoboxPD (https://open.oncobox.com) for analysis of KEGG enrichment pathways (Zolotovskaia et al., 2022).
Protein–protein interaction network and hub genes
PPI networks of up-regulated genes and down-regulated genes were generated using the STRING database. The hub gene was defined by 12 topological methods (MCC, DMNC, MNC, Degree, EPC, BottleNeck, EcCentricity, Closeness, Radiality, Betweeness, Stress, and Clustering) using Cytoscape software.
Clinicopathological features and prognosis analysis
RNA-seq and clinical data of 424 cases of liver cancer from the TCGA database (https://portal.gdc.cancer.gov/) were analyzed. We conducted the clinicopathological features and survival analysis, including the T stage, pathologic stage, histological grade, AFP, vascular invasion, tumor statues, prothrombin time (PT), race, OS, DSS, and PFI, with the Xiantao Academic (https://www.xiantao.love/) platform (survminer package of R software).
Gene correlation analysis
RNA-sequencing expression profiles and the corresponding clinical information for liver cancer were downloaded from the TCGA dataset. The multi-gene correlation pheatmap is displayed by using the R software package. p values less than .05 were considered statistically significant.
Correlation analysis of genes and pathways
RNA-sequencing expression profiles and the corresponding clinical information for liver cancer were downloaded from the TCGA dataset. R software GSVA package was used to analyze, choosing parameter as method = “ssgsea.” All the analytic methods and R packages were implemented by R version 4.0.3.
ICB response
The Tumor Immune Dysfunction and Exclusion (TIDE) algorithm was used to predict the response of individual samples or groups to immune checkpoint inhibitors based on expression profile data (Jiang et al., 2018). R (V4.0.3) software packages GGploT2 (v3.3.3) and GGPUBr (0.4.0) were used for mapping analysis.
Statistical analysis
The two-tailed independent-sample t-test or Wilcoxon rank sum test was used to compare the mean difference between the two groups. The association between genes and clinicopathological parameters was evaluated using the Pearson Chi-square test or Fisher exact test. Spearman correlation analysis was used in different expressions of genes and pathways. Kaplan–Meier survival analysis was made by using log-rank test. The major analysis was performed using Xiantao Academic (https://www.xiantao.love/) in this study. Differences were considered statistically significant at *p < .05, **p < .01, and ***p < .001.
Results
Identification of DEGs
To make a comparison between the difference in gene expression between the HCC group and the normal group, differential gene expression analysis within samples was executed. The present study involved four GEO datasets, GSE36376, GSE102079, GSE54236, and GSE45267. GSE36376 contained 240 HCC tumor tissue samples and 193 adjacent non-tumor tissues. GSE102079 contained 152 HCC tumor tissue samples, 91 adjacent non-tumor tissues, and 14 normal liver tissues. Furthermore, GSE54236 contained 81 HCC tumor tissue samples and 80 normal liver tissue samples. Furthermore, GSE45267 contained 48 HCC tumor tissues and 39 normal liver tissue samples. Thereby, we counted the differential genes and collected the data to prove that 271 genes were up-regulated and 196 genes were down-regulated in the GSE36376 database (Figure 1A). In the GSE102079 database, 248 genes were up-regulated and 417 genes were down-regulated (Figure 1B). In the GSE54236 (Figure 1C) and GSE45267 databases (Figure 1D), 237 and 393 genes were up-regulated and 386 and 624 genes were down-regulated, respectively. As presented in Figures 1E, F, we made an attempt to identify 104 DEGs, including 23 up-regulated genes and 81 down-regulated genes in the HCC tissue samples.
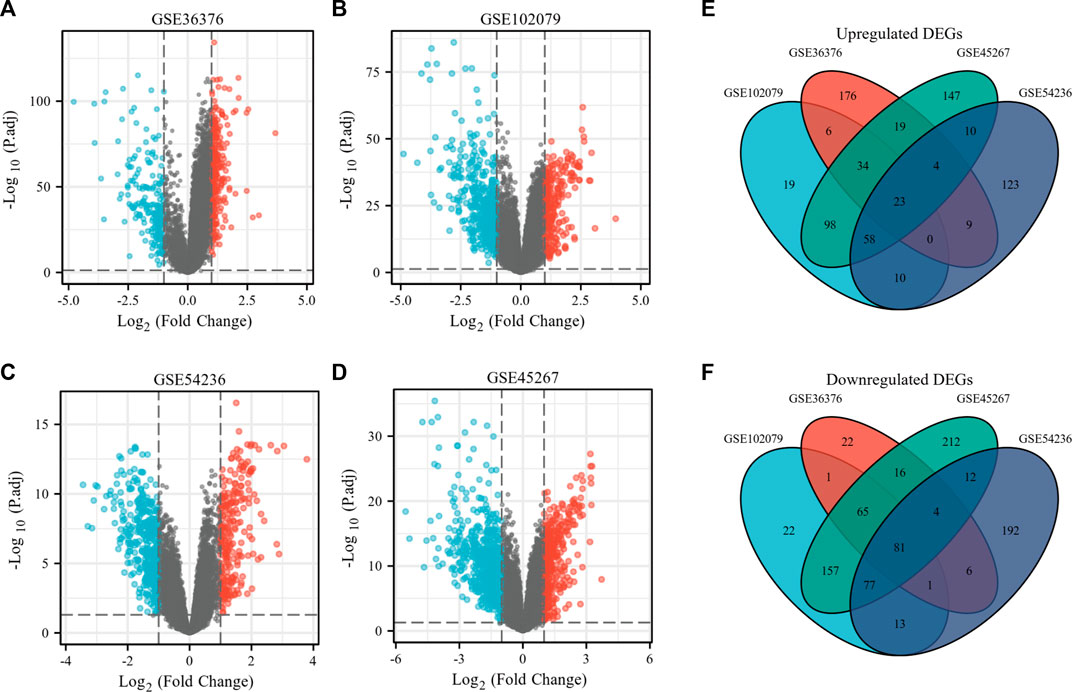
FIGURE 1. Identification of overlapping DEGs in HCC. (A–D) Volcano plots of gene expression profile data in GSE36376 (A), GSE102079 (B), GSE54236 (C), and GSE45267 (D), respectively. (E) Venn plots of up-regulated overlapping DEGs. (F) Venn plots of down-regulated overlapping DEGs.
GO and KEGG pathway enrichment analyses of DEGs
In order to further study the potential biological functions of the DEGs, GO terms and KEGG pathway enrichment analyses were settled. The enriched GO and enriched KEGG functions in the ClusterProfiler package were adapted to enrich DEGs from BP, CC, MF, and KEGG. According to the results, they revealed that the biological processes primarily associated with the DEGs were alpha-amino acid metabolic, organic acid catabolic, and carboxylic acid catabolic (Figure 2A). These DEGs have also been closely associated with the cellular components of collagen trimer, Golgi lumen, and plasma lipoprotein particle (Figure 2B). The top molecular functions involved include monooxygenase activity, oxidoreductase activity, and steroid hydroxylase activity (Figure 2C). At the same time, Chord diagrams were used to display the genes enriched in the top six processes of BPs, CCs, and MFs. PAL values were used to analyze the KEGG enrichment pathway; PAL values were also used to analyze the KEGG enrichment pathway. The KEGG pathway analysis proved the DEGs were significantly enriched in glutamate metabolism, complement and coagulation cascades, and retinol metabolism (Figure 2D).
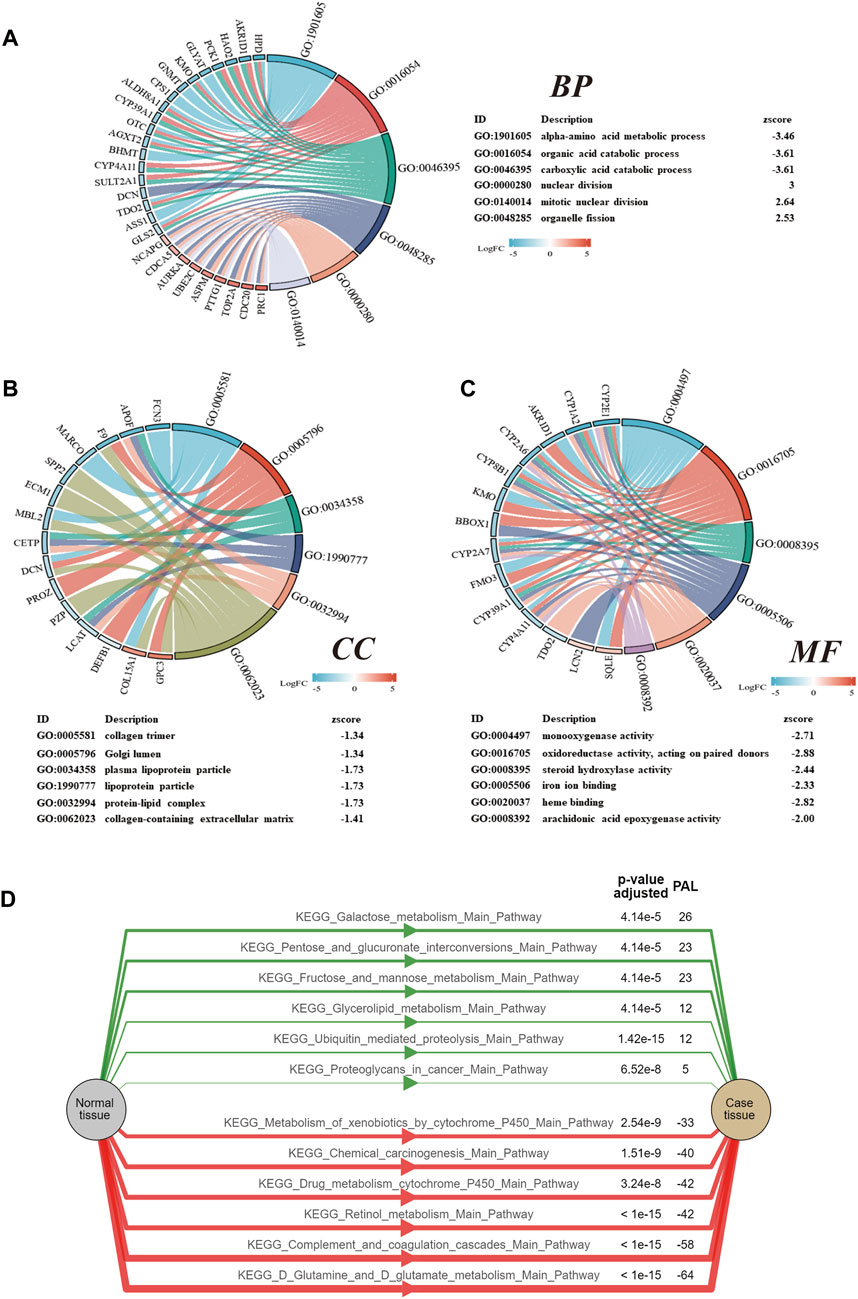
FIGURE 2. GO and KEGG analyses of the DEGs. (A) Chord diagrams of the biological process. (B) Chord diagrams of the cellular components. (C) Chord diagrams of the molecular function. (D) KEGG pathway analysis of the DEGs. A positive value for PAL indicates activation of the pathway, while a negative value indicates inhibition of the pathway.
The construction of the PPI network and the identification of hub genes
A PPI network of 23 up-regulated genes was constructed by adapting the STRING database. The PPI network consists of 15 nodes and 59 edges (Figure 3A), and an interaction score >0.7 was regarded as a high-confidence interaction relationship. Hub genes were measured using 12 topological methods of the CytoHubba plug-in in Cytoscape (Table 1). As presented in Figures 3B, C, there are six genes identified as up-regulated hub genes, namely, PBK, PRC1, CDCA5, CDC20, TOP2A, and NCAPG. Then, a PPI network of 81 down-regulated genes, containing a total of 54 nodes and 154 edges, was generated by applying the STRING databas(Figure 4A). The 12 topological methods were employed to screen hub genes (Table 2). Six genes with the highest frequencies were selected as down-regulated hub genes, namely, KLKB1, F9, ALDH8A1, C8B, AFM, and CYP2A6 (Figures 4B, C).
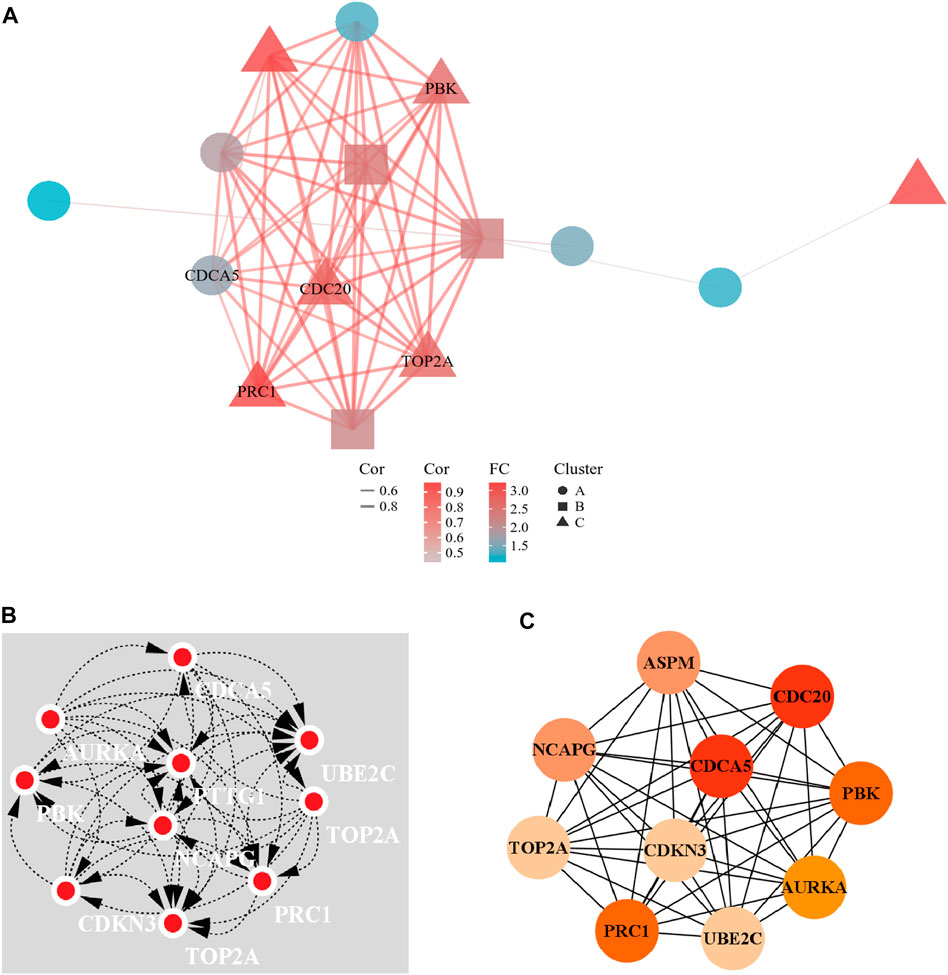
FIGURE 3. The PPI network of up-regulated DEGs and the interaction network of top 10 hub genes. (A) The PPI network of the 23 up-regulated DEGs. (B) Top 10 hub gene network constructed by clustering topological method. (C) Top 10 hub gene network constructed by EPC topological method.
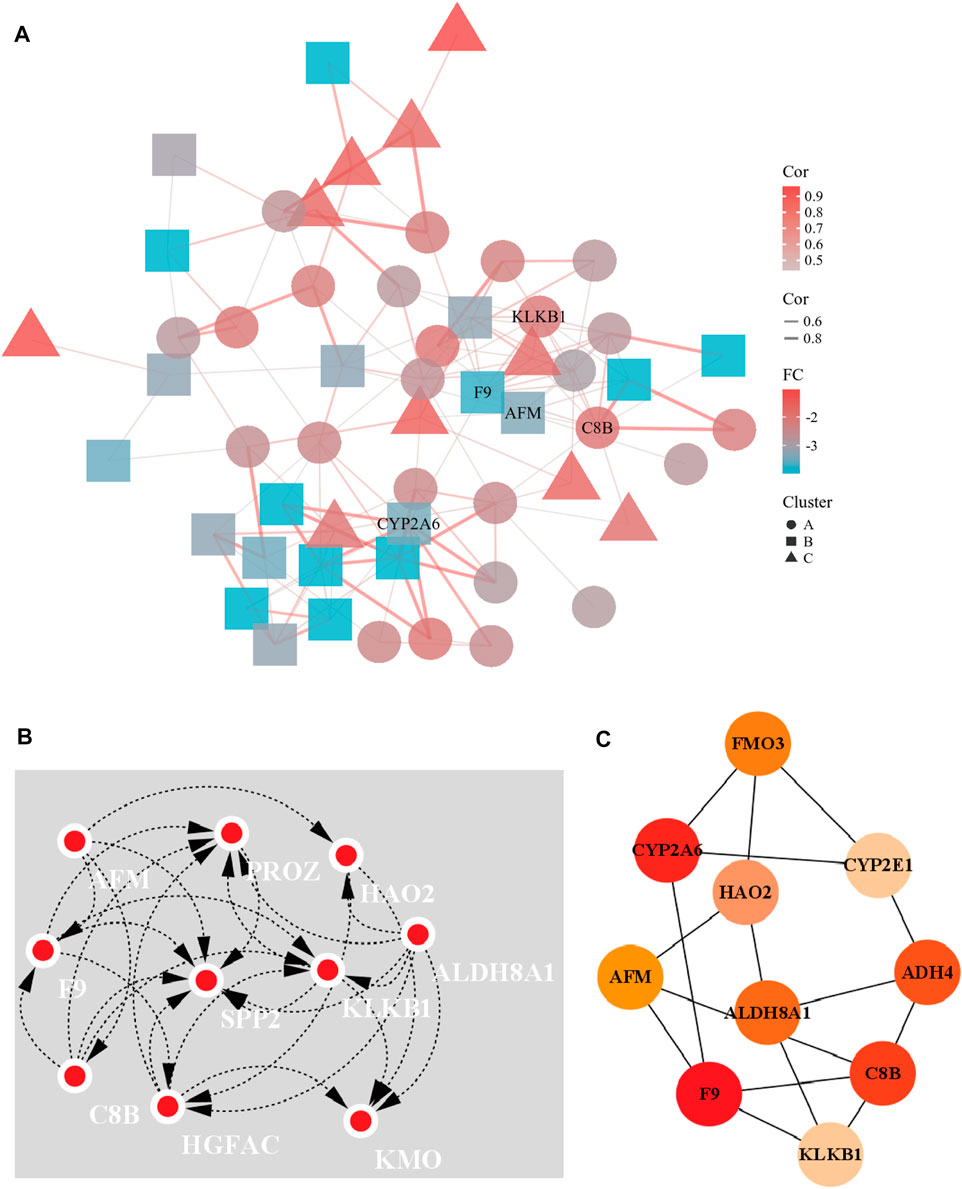
FIGURE 4. The PPI network of down-regulated DEGs and the interaction network of hub genes. (A) The PPI network of the 81 down-regulated DEGs. (B) Eccentricity topological method was used to identify down-regulated hub genes. (C) Top 10 hub gene network constructed by closeness topological method.
Correlation between up-regulated genes and clinicopathological features and prognostic analysis
The investigators evaluated the mRNA expression of six up-regulated genes in HCC tissue or normal liver tissue from all patient characteristics of TCGA (Figure 5A). We analyzed the correlation between up-regulated DEGs and the T stage (Figure 5B), pathologic stage (Figure 5C), histological grade (Figure 5D), AFP (Figure 5E), vascular invasion (Figure 5F), tumor status (Figure 5G), PT (Figure 5H), and race (Figure 5I). Six DEGs were highly expressed in HCC tissues and were significantly associated with the T stage, pathological stage, histological grade, AFP, tumor status, and PT. Except for those, the expressions of these genes were all above in Asians compared to Whites and were not statistically different in Blacks and African America. In addition, CDCA5 and CDC20 have a close relationship with the degree of vascular invasion. Hence, we further evaluated the specificity and sensitivity of the six genes in the diagnosis of their AUC values from high to low, namely: CDCA5 (AUC = 0.978), CDC20 (AUC = 0.957), NCAPG (AUC = 0.931), PRC1 (AUC = 0.903), TOP2A (AUC = 0.886), and PBK (AUC = 0.839), implying that they all had acceptable specificity and sensitivity as diagnostic markers for HCC (Figure 5J). Furthermore, we conducted a Kaplan–Meier survival analysis with the candidate genes, and OS, DSS, and PFI were selected as prognostic indicators. As a consequence of the analysis, PBK, PRC1, CDC5, CDC20, TOP2A, and NCAPG were significantly correlated with OS (Figures 6A–F), DSS (Supplementary Figures S1A–F), and PFI (Supplementary Figures S1G–L), indicating that they were good predictors of the prognosis of HCC. Therefore, we constructed a prognostic model based on these six genes using the prognostic information of 240 HCC patients from the International Cancer Genome Consortium (ICGC) database. The calculation of the regression coefficient is depicted in Figure 6G. LASSO Cox regression model showed that this prognostic model had the best predictive ability when containing four genes (Figure 6H). A heatmap of gene expressions and the risk-score scatter plot indicate that high-gene expression was a high-risk group, whose corresponding patients had shorter survival time and more dead patients in clinical statuses (Figure 6I). It is worth noting that the ROC curve and AUC values also reflected that the prognostic model has strong predictive power for 1-year survival (AUC = 0.79), 2-year survival (AUC = 0.732), and 3-year survival (AUC = 0.732), with the best-fitted prediction power for 1-year survival (Figure 6J).
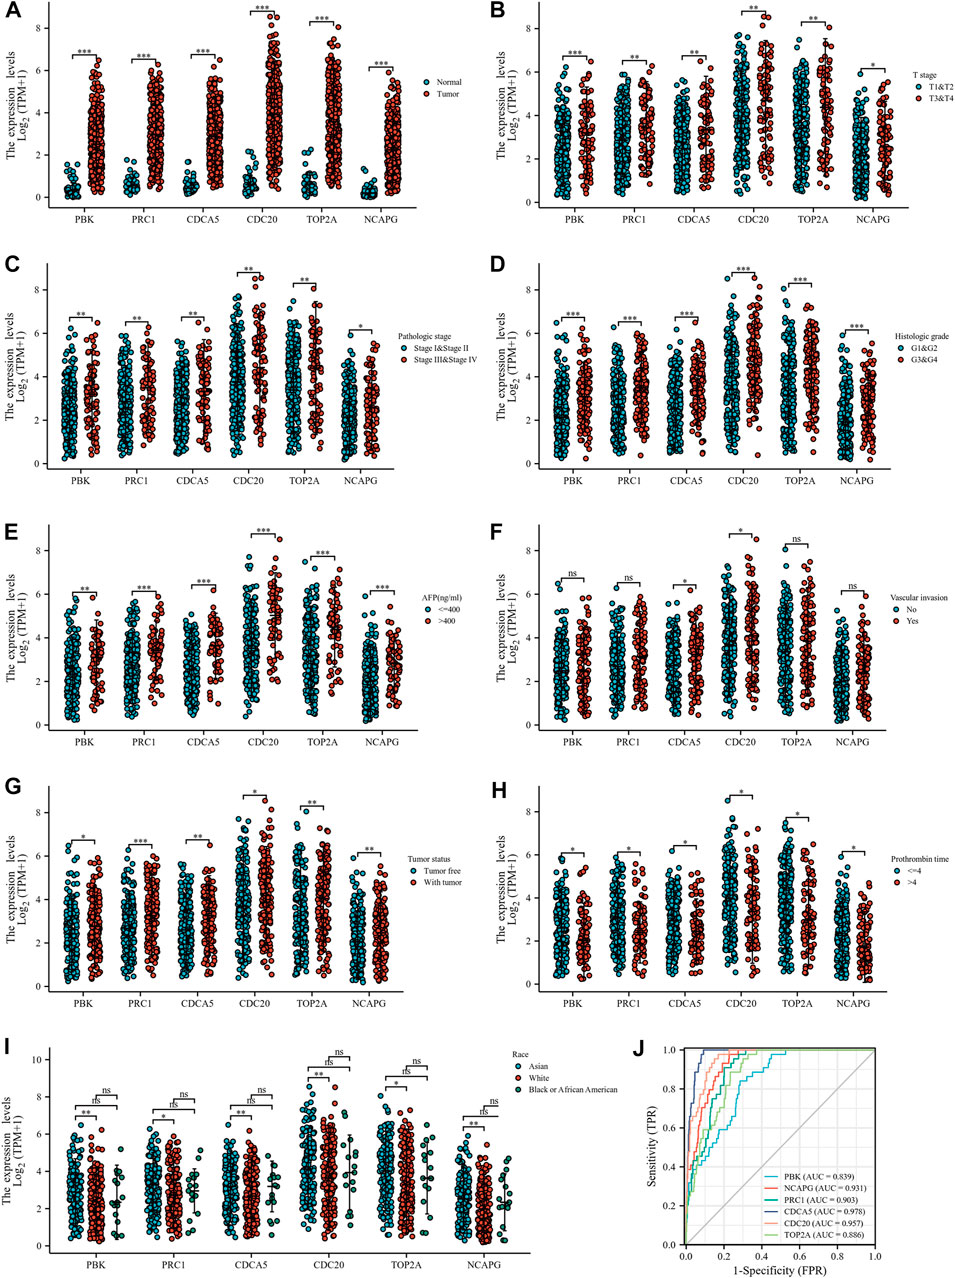
FIGURE 5. Correlation between up-regulated hub genes and clinicopathological features. (A) DEG expressions in HCC and normal tissues based on TCGA database. (B–I) Correlation between up-regulated DEGs and T stage (B), pathologic stage (C), histological grade (D), AFP (E), vascular invasion (F), tumor status (G), PT (H), and race (I). (J) ROC curve of up-regulated DEGs in the diagnosis of HCC.
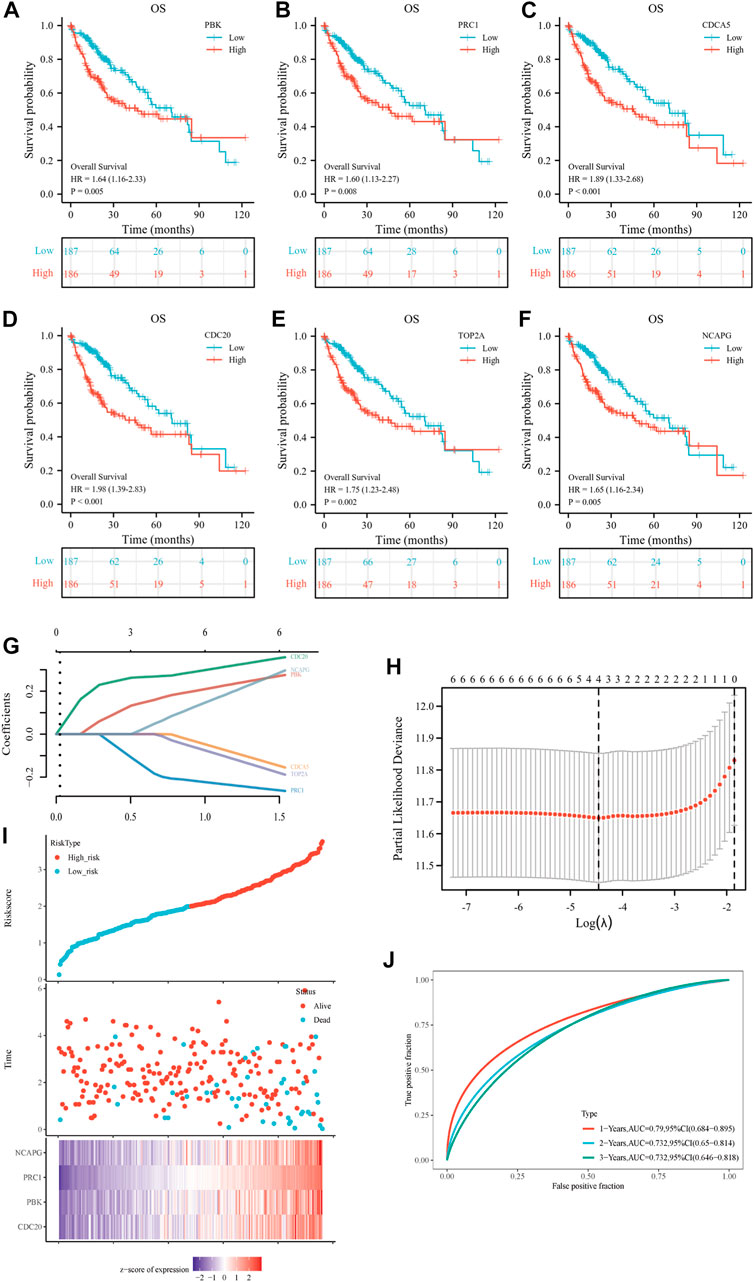
FIGURE 6. Prognostic gene signature of six up-regulated core genes in HCC patients. (A–F) Association between PBK (A), PRC1 (B), CDCA5 (C), CDC20 (D), TOP2A (E), and NCAPG (F) expression and overall survival (OS) were performed with the online Kaplan–Meier survival analysis (KMplot, http://kmplot.com/analysis/). (G) The calculation of the regression coefficient. (H) LASSO Cox regression model of the six hub genes. (I) The risk score, survival time, and survival status of the selected dataset. The top scatterplot represents the risk score from low to high. The scatter plot distribution represents the risk score of different samples corresponding to the survival time and survival status. The button heatmap is the gene expression from the signature. (J) The ROC curve and AUC of the model. The higher values of AUC correspond to higher predictive power.
The promoting effect of PBK in hepatocellular carcinoma may be related to angiogenesis
Based on the expression of the genes in HCC and the establishment of the prognosis model, we selected PBK for further study in HCC. As shown in Figure 7A, differential genes of PBK high/low-expression groups were extracted from TCGA database, and volcano maps were made according to the FC values. The top 20 up-regulated and down-regulated genes were screened to make a correlation heatmap (Figures 7B, C). Subsequently, the gene set enrichment analysis (GSEA) was used to explore the main enrichment pathways of PBK. We found that PBK was enriched in the “signaling of VEGF,” “PDGFRB,” “VEGFR pathway” and “VEGFR2-mediated cell proliferation” pathways in addition to a significant correlation with “cell cycle” (Figures 7D–F). Therefore, we hypothesized that PBK may be related to angiogenesis and promote tumor proliferation through VEGFR-mediated vascular formation. In order to further verify the role of PBK in HCC, we used small-interfering RNA to knock down PBK in MHCC97H cells (Figure 8A). CCK8 assay showed that knocked down PBK could significantly inhibit the proliferation of HCC cells (Figure 8B). Transwell assay further proved that the invasion and migration ability of HCC cells were inhibited to varying degrees after PBK silencing (Figure 8C). Then, we collected the cell culture medium for tube formation assay, the HUVEC tube formation was decreased by adding the prepared PBK-knockdown MHCC97H cell supernatants, and this led to much fewer total branching points as quantified by the WimTube (Figure 8D), suggesting that PBK may be involved in tumor vasculogenesis.
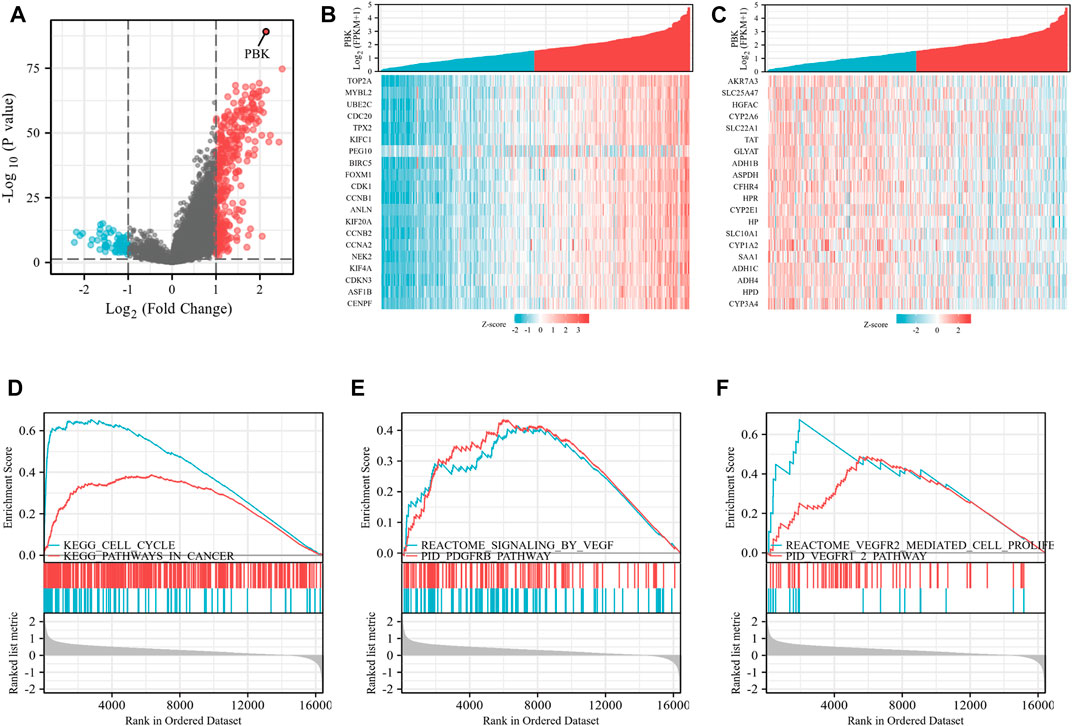
FIGURE 7. PBK-related differential gene and pathway enrichment. (A) Volcano maps were made according to the PBK-related differential genes. (B) Heatmap of the top 20 up-regulated genes. (C) The top 20 up-regulated genes were screened. (D–F) GSEA analysis based on the DEGs.
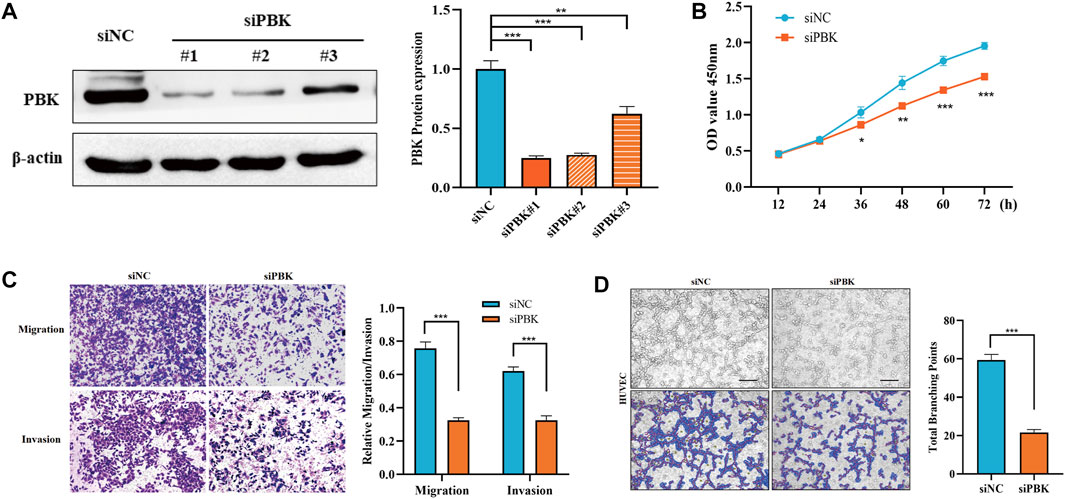
FIGURE 8. PBK promotes the malignant progression of HCC cells. (A) Western blot was used to detect the protein expression of PBK in the control and PBK knockdown groups. (B) CCK8 assay was used to detect the proliferation ability of HCC cells. (C) Transwell assay was used to detect the migration and invasion abilities of HCC cells. (D) Tube formation assay was performed in HUVEC cells.
Correlation between down-regulated genes, clinicopathological features, and prognostic analysis
At the same time, we detected the expression of six down-regulated hub genes in HCC and normal liver tissues by the TCGA database, the results suggested that KLKB1, F9, ALDH8A1, C8B, AFM, and CYP2A6 were all more highly expressed in normal liver tissues than in cancerous tissues (Figure 9A). To further confirm the conjecture, we managed to find the correlation between down-regulated DEGs and T stage (Figure 9B), pathologic stage (Figure 9C), histological grade (Figure 9D), AFP (Figure 9E), vascular invasion (Figure 9F), tumor status (Figure 9G), PT (Figure 9H), and race (Figure 9I). The results showed that the six genes were closely related to histological grade. F9, ALDH8A1, AFM, and CYP2A6 were statistically significant with T stage and pathologic stage. KLKB1, F9, ALDH8A1, C8B, and CYP2A6 were significantly correlated with AFP. All genes were negatively associated with vascular invasion, except KLKB1. F9 and AFM were closely related to tumor status, and KLKB1 and F9 were associated with PT. Furthermore, KLKB1, ALDH8A1, and CYP2A6 were differentially expressed between Asians and Whites, and there was no racial variance in the expression of other genes. ROC curves were constructed and AUC values from high to low were: ALDH8A1 (AUC = 0.926), F9 (AUC = 0.882), AFM (AUC = 0.864), C8B (AUC = 0.861), KLKB1 (AUC = 0.853), and CYP2A6 (AUC = 0.782); AUC values larger than 0.7 were reckoned to have high diagnostic sensitivity and specificity, and all genes met the aforementioned requirements (Figure 9J). Moreover, we then performed a Kaplan–Meier survival analysis (Figures 10A–F). F9, C8B, and AFM were found to be correlated with prognostic indicators OS, DSS (Supplementary Figures S2A–C), and PFI (Supplementary Figures S2D–F), while KLKB1, ALDH8A1, and CYP2A6 were not statistically significant (Supplementary Figures S2G–L).
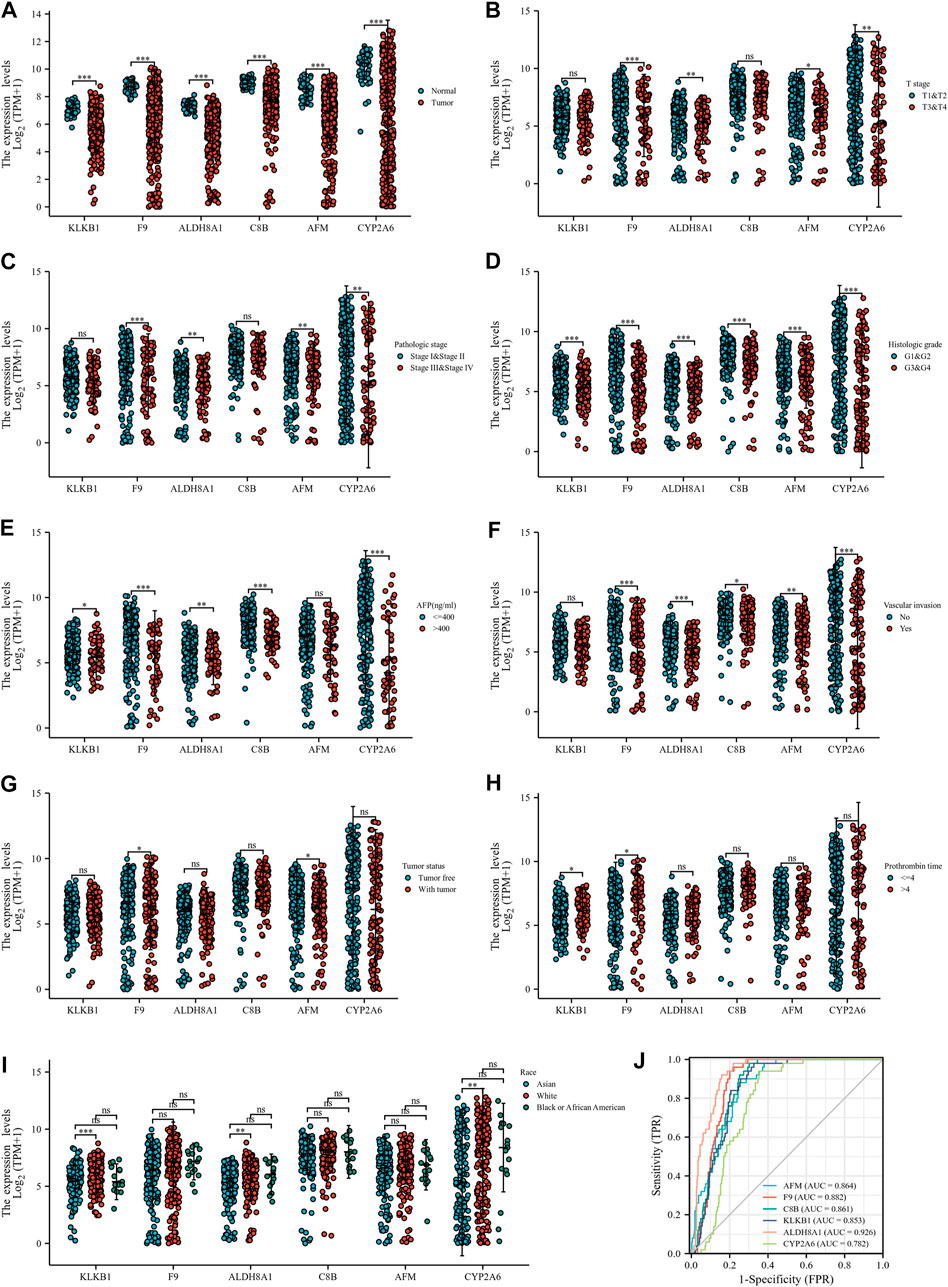
FIGURE 9. Correlation between down-regulated hub genes and clinicopathological features. (A) Down-regulated hub DEG expressions in HCC and normal tissues based on TCGA database. (B–I) Correlation between down-regulated hub genes and T stage (B), pathologic stage (C), histological grade (D), AFP (E), vascular invasion (F), tumor status (G), PT (H), and race (I). (J) ROC curve of down-regulated DEGs in the diagnosis of HCC.
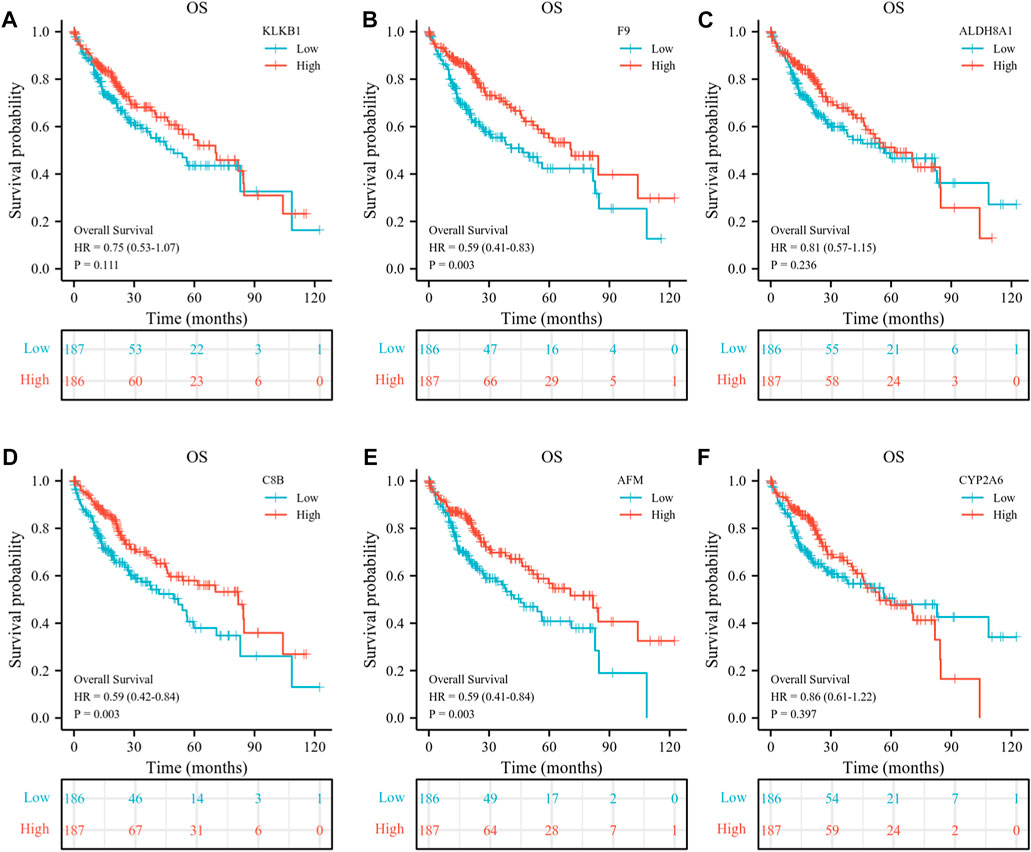
FIGURE 10. Prognostic analysis of six down-regulated hub genes. (A–F) Association between KLKB1 (A), F9 (B), ALDH8A1 (C), C8B (D), AFM (E), and CYP2A6 (F) expressions and overall survival (OS) were performed with the Kaplan–Meier survival analysis.
The relationship between immune cell infiltration and F9 expression
Scores of immune cell infiltration in HCC patients were investigated from the TCGA database. The expression of F9 was negatively correlated with the infiltration level of CD4+ T cells (cor = −0.30, p = 2.60e-09), neutrophils (cor = −0.26, p = 5.98e-07), B cells (cor = −0.23, p = 4.99e-06), dendritic cells (cor = −0.23, p = 5.95e-06), macrophages (cor = −0.21, p = 5.58e-05), and CD8+ T cells (cor = −0.11, p = 3.1e-02) in HCC tissues (Figure 11A). Furthermore, the TIDE scores were higher in the F9-low-expression group contrasted with the F9-high-expression group, indicating that the F9-low-expression group had a worse response to immune checkpoint blocking therapy (ICB) (Figure 11B). Further study studies displayed that immune checkpoint-related genes PD-1, CTLA4, and LAG3 were lower in the F9-high-expression group (Figure 11C), and were negatively correlated with F9 in HCC by correlation analysis (Figure 11D).
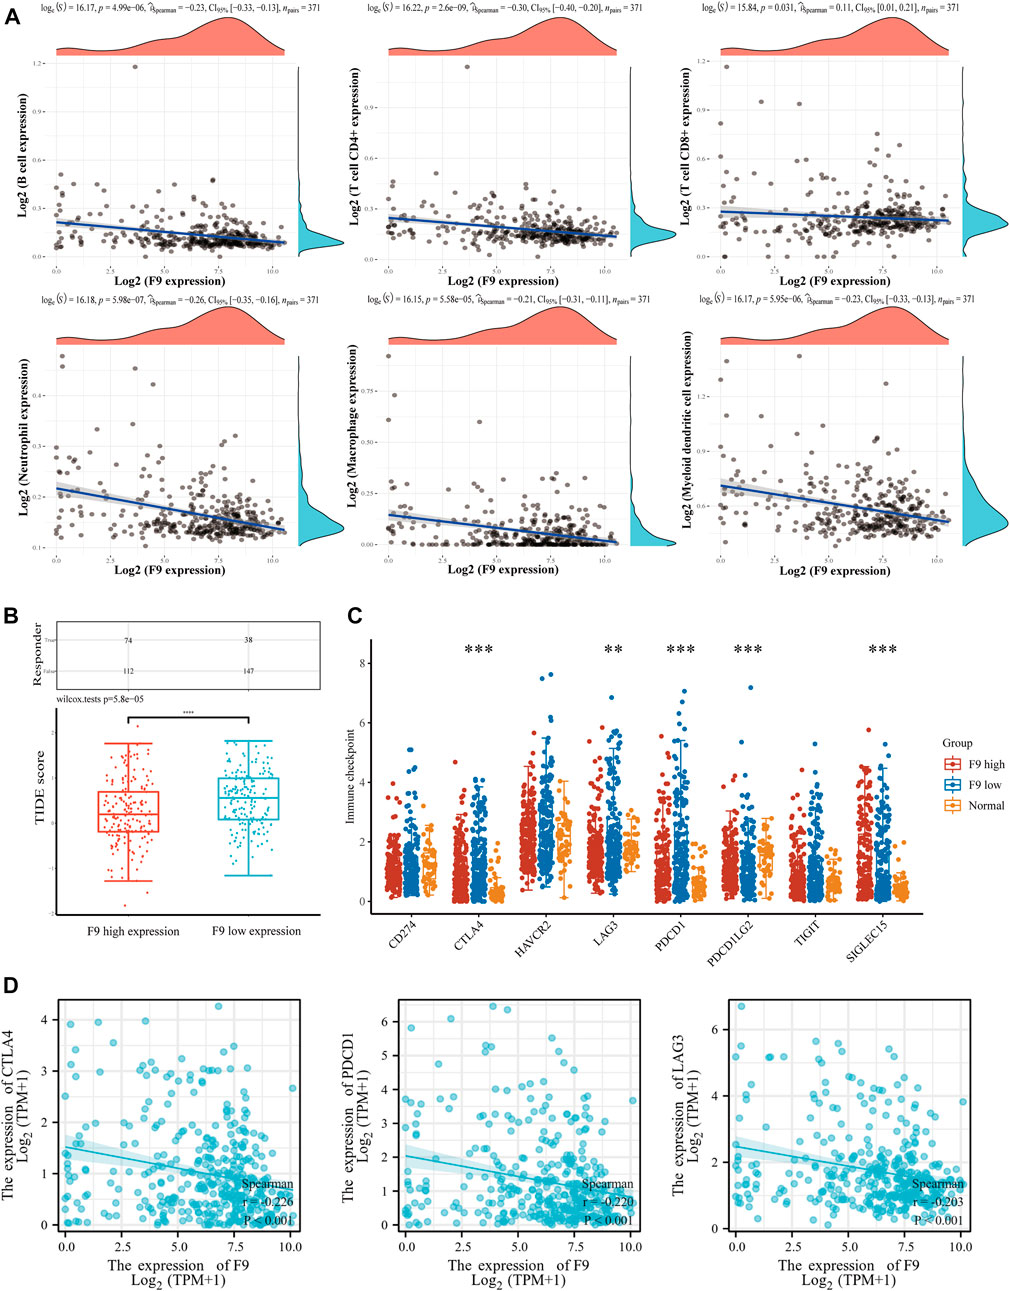
FIGURE 11. The correlation analysis between F9 and immune cell infiltration in HCC. (A) The correlation between F9 and immunocyte infiltration. (B) The distribution of immune response scores in F9-high and F9-low groups in the prediction results. The F9-low group was significantly higher than the F9-high-expression group. (C) The expression distribution of immune checkpoints gene in F9-high and F9-low tissues. (D) The correlation between CTLA4, PD1, LAG3 and F9 in HCC.
Discussion
HCC is one of the most malignant tumors. In recent years, the treatment of unresectable HCC mainly focuses on molecular targeted therapy (Huang et al., 2020; Zhao et al., 2020), such as lenvatinib and sorafenib, however, targeted drug resistance still exists (Jin et al., 2021). There is an urgent need to find new targets for the diagnosis and treatment of liver cancer in the direction of a breakthrough in the current treatment limitations. Some previous studies used TCGA and GEO databases to screen oncogenes and identify prognostic or immune-related genes (Chen et al., 2020; Gao et al., 2021; Yan et al., 2021; Shen et al., 2022a; Shen et al., 2022b; Ding et al., 2022; Gao et al., 2022; Long et al., 2022; Yang et al., 2022). However, in this study, four GSE datasets, GSE36376, GSE102079, GSE54236, and GSE45267, were summarized for analysis, hoping to find the mechanism of cancer-promoting and tumor-suppressor factors in liver cancer from the perspective of improving the accuracy of the research results. Here, we summarize the differences between this project and previous research studies (Supplementary Table S2).
The study yielded 23 up-regulated DEGs and 81 down-regulated DEGs. Subsequently, we defined six up-regulated hub genes PBK, PRC1, CDC20, CDCA5, TOP2A, and NCAPG and six down-regulated hub genes KLKB1, F9, AFM, C8B, ALDH8A1, and CYP2A6 as the main subjects through 12 topological approaches. According to the study, the six up-regulated hub genes were significantly correlated with T stage, pathologic stage, histological grade, AFP, tumor status, and PT. CDCA5 and CDC20 were also associated with the degree of vascular invasion. The prognostic model based on these six genes showed results that the pivotal genes were closely associated with the survival time of hepatocellular carcinoma, especially for a short-term survival time, where the AUC value of the prognostic model was 0.79, showing a strong predictive power. In the ROC curve, the AUC values were all greater than 0.7, indicating that these six genes are good diagnostic and prognostic factors and are related to the malignant progression of HCC. Principally, CDCA5 (AUC = 0.978) and CDC20 (AUC = 0.957) showed excellent diagnostic specificity and sensitivity and could be considered key oncogenic genes in liver cancer.
Cell division cycle 20 homologous (CDC20), an E3 ring finger ubiquitin ligase, is one of the most significant factors controlling the spindle assembly checkpoint (SAC) (Hwang et al., 1998). CDC20 overexpression stops mitosis and prevents apoptosis in DNA-damaged cells (Connors et al., 2014). Moreover, studies have made clear that CDC20 is highly expressed in HCC and regulates the proliferation of P53-mutated HCC cells through the Bcl-2/Bax pathway (Zhao et al., 2021). Shi et al. (2021) have found that CDC20 stabilizes HIF-1A protein under normoxic conditions in liver cancer tissues, and depletion of CDC20 leads to tumor growth retardation and inactivation of the HIF-1A signaling pathway. These studies indicate that CDC20 is a key role in the link of the malignant progression of liver cancer, which is consistent with our previous prediction.
Cell division cycle associated 5 (CDCA5) is a core regulator of DNA repair and chromosome separation, and plays a carcinogenic role in gastric cancer (Zhang et al., 2018), esophageal squamous cell carcinoma (Xu et al., 2019), and prostate cancer (Luo et al., 2021). Tian et al. (2018) found that the incidence of microvascular infiltration in patients with CDCA5 overexpression (45.90%) was higher than that in patients with low CDCA5 expression (21.92%) in liver cancer. Both in vivo and in vitro experiments suggested that CDCA5 inhibition led to a reduced cell-proliferation rate, advocating that CDCA5 is involved in the malignant progression of HCC.
PDZ-binding kinase (PBK) is a serine/threonine kinase belonging to the mitogen-activated protein kinase (MAPK) kinase (MAPKK) family (Sun et al., 2016). Previous studies have shown that PBK is highly trans-activated in various cancers including ovarian cancer (Ma et al., 2022), lymphoma (Wang et al., 2022), kidney cancer (Sun et al., 2022), and colon cancer (Koshino et al., 2022), which is a promising molecular target for cancer-targeted therapy. It is worth mentioning that Yang et al. (2019) found that PBK was overexpressed in HCC and was associated with poor prognosis. PBK up-regulated uPAR expression by enhancing the binding of ETV4 to the uPAR promoter, thereby promoting the invasion and migration of HCC cells. Cao et al. (2021) further explored the role of PBK in oxaliplatin resistance of HCC cells, and indicated that PBK was further increased in oxaliplatin-resistant HCC cells. Silencing of PBK promoted the sensitivity of drug-resistant HCC cells to oxaliplatin, whereas an overexpression of PBK inhibited OXA-induced apoptosis. However, due to the lack of relevant studies, the role of PBK in liver cancer cannot be fully summarized, and its specific mechanism remains unclear. Through GSEA analysis, we found that PBK may be related to tumor angiogenesis, especially the VEGFR pathway and PDGFR pathway, which rank high among the enrichment pathways of PBK-related genes. We verified the effect of PBK expression in hepatocellular carcinoma on the proliferation and migration of HCC cells. In addition, we used a tube formation assay to further verify whether PBK may promote microtubule formation compared with the control cells. In view of the significant contribution of tumor vasculogenesis in the proliferation of malignant tumors, further exploration of the role of PBK in promoting tumor angiogenesis and clarifying its mechanism will provide help for the discovery of therapeutic targets for HCC.
Based on this consequence, down-regulated hub genes were further studied as tumor-suppressor genes. Three genes, F9, C8B, and AFM, were found to be associated with OS, DSS, and PFI. In the correlation analysis with clinicopathological features, F9 was significantly correlated with T stage, TNM stage, histological grade, vascular invasion, tumor status, AFP, and PT. Furthermore, F9 has the paramount sensitivity (AUC = 0.882) among the aforementioned three indicators for HCC, suggesting that F9 is a critical indicator in the diagnosis and prognosis of HCC.
F9 has been widely studied as a hemophilia defect factor (Lu et al., 2019; Shapiro et al., 2021). Recent research has suggested that F9 may play a role in CD4+ T cell induction (Cooper et al., 2009) and predict CDK4/6 inhibitor response in breast cancer (Carpintero-Fernández et al., 2022). However, the role of F9 in the immunotherapy of HCC has not been reported. Our study found that F9 was negatively correlated with the degree of immune infiltration of CD4+ T cells, neutrophils, B cells, dendritic cells, macrophages, and CD8+ T cells. The expressions of immune checkpoint-related genes PD1, LAG3, and CTLA4 were higher in the group with low F9 expression. Recent studies have revealed two different mechanisms of tumor immune evasion, including tumor-infiltrating cytotoxic T lymphocyte (CTL) dysfunction and rejection of CTL by immunosuppressive factors. Therefore, the TIDE score can integrate these two mechanisms of tumor immune escape better than widely used biomarkers (tumor mutation load, PD-L1 levels, and interferon γ) for evaluating the efficacy of immune checkpoint suppressive therapies. In addition, a higher TIDE prediction score in the low F9 expression group was associated not only with poorer immune checkpoint inhibition treatment but also with poorer survival in patients treated with anti-PD1 and anti-CTLA4, implying that F9 may be used as an indicator of immune therapy efficacy for HCC. Considering the significance of F9 in the diagnosis and prognosis of HCC, it is relevant and necessary to expand the clinical sample to explore the role of F9 in response to immunotherapy.
Data availability statement
The original contributions presented in the study are included in the article/Supplementary Material; further inquiries can be directed to the corresponding author.
Author contributions
YZ and GS conceived, designed, and wrote the manuscript; YW and MH participated in the in vitro experiments; YZ and XL analyzed the data; YZ and YW revised the manuscript; and all authors read and approved the final manuscript.
Funding
This work was supported by the National Nature and Science Foundation of China (No. 82072751).
Conflict of interest
The authors declare that the research was conducted in the absence of any commercial or financial relationships that could be construed as a potential conflict of interest.
Publisher’s note
All claims expressed in this article are solely those of the authors and do not necessarily represent those of their affiliated organizations, or those of the publisher, the editors, and the reviewers. Any product that may be evaluated in this article, or claim that may be made by its manufacturer, is not guaranteed or endorsed by the publisher.
Supplementary material
The Supplementary Material for this article can be found online at: https://www.frontiersin.org/articles/10.3389/fgene.2022.934883/full#supplementary-material
SUPPLEMENTARY FIGURE S1 | (A–F) Association between PBK (A), PRC1 (B), CDCA5 (C), CDC20 (D), TOP2A (E), and NCAPG (F) expression and disease specific survival (DSS) were performed with the online Kaplan–Meier survival analysis. (G–L) Association between PBK (G), PRC1 (H), CDCA5 (I), CDC20 (J), TOP2A (K), and NCAPG (L) expressions and progress-free interval (PFI) were performed with the online Kaplan–Meier survival analysis.
SUPPLEMENTARY FIGURE S2 | (A–C) Association between F9 (A), C8B (B), and AFM (C) expressions and DSS was performed. (D–F) The correlations between CDC20 (D), TOP2A (E), NCAPG (F), and PFI. (G–L) Correlation between KLKB1, ALDH8A1, and CYP2A6 and prognostic indicators DSS (G–I) and PFI (J–L).
References
Baeissa, H. M., Benstead-Hume, G., Richardson, C. J., and Pearl, F. M. (2016). Mutational patterns in oncogenes and tumour suppressors. Biochem. Soc. Trans. 44 (3), 925–931. doi:10.1042/BST20160001
Cao, H., Yang, M., Yang, Y., Fang, J., and Cui, Y. (2021). PBK/TOPK promotes chemoresistance to oxaliplatin in hepatocellular carcinoma cells by regulating PTEN. Acta Biochim. Biophys. Sin. 53 (5), 584–592. doi:10.1093/abbs/gmab028
Carpintero-Fernández, P., Borghesan, M., Eleftheriadou, O., Pan-Castillo, B., Fafian-Labora, J. A., Mitchell, T. P., et al. (2022). Genome wide CRISPR/Cas9 screen identifies the coagulation factor IX (F9) as a regulator of senescence. Cell Death Dis. 13 (2), 163. doi:10.1038/s41419-022-04569-3
Chen, W., Ou, M., Tang, D., Dai, Y., and Du, W. (2020). Identification and validation of immune-related gene prognostic signature for hepatocellular carcinoma. J. Immunol. Res. 2020, 5494858. doi:10.1155/2020/5494858
Chen, X., Miao, M., Zhou, M., Chen, J., Li, D., Zhang, L., et al. (2021). Poly-L-arginine promotes asthma angiogenesis through induction of FGFBP1 in airway epithelial cells via activation of the mTORC1-STAT3 pathway. Cell Death Dis. 12 (8), 761. doi:10.1038/s41419-021-04055-2
Connors, B., Rochelle, L., Roberts, A., and Howard, G. (2014). A synthetic interaction between CDC20 and RAD4 in Saccharomyces cerevisiae upon UV irradiation. Mol. Biol. Int. 2014, 519290. doi:10.1155/2014/519290
Cooper, M., Nayak, S., Hoffman, B. E., Terhorst, C., Cao, O., and Herzog, R. W. (2009). Improved induction of immune tolerance to factor IX by hepatic AAV-8 gene transfer. Hum. Gene Ther. 20 (7), 767–776. doi:10.1089/hum.2008.161
Ding, Q., Li, H., Xu, Z., Hu, K., and Ye, Q. (2022). Identification of CFHR4 associated with poor prognosis of hepatocellular carcinoma. Front. Oncol. 12, 812663. doi:10.3389/fonc.2022.812663
Gao, Q., Fan, L., Chen, Y., and Cai, J. (2022). Identification of the hub and prognostic genes in liver hepatocellular carcinoma via bioinformatics analysis. Front. Mol. Biosci. 9, 1000847. doi:10.3389/fmolb.2022.1000847
Gao, S., Gang, J., Yu, M., Xin, G., and Tan, H. (2021). Computational analysis for identification of early diagnostic biomarkers and prognostic biomarkers of liver cancer based on GEO and TCGA databases and studies on pathways and biological functions affecting the survival time of liver cancer. BMC Cancer 21 (1), 791. doi:10.1186/s12885-021-08520-1
Huang, A., Yang, X. R., Chung, W. Y., Dennison, A. R., and Zhou, J. (2020). Targeted therapy for hepatocellular carcinoma. Signal Transduct. Target. Ther. 5 (1), 146. doi:10.1038/s41392-020-00264-x
Hwang, L. H., Lau, L. F., Smith, D. L., Mistrot, C. A., Hardwick, K. G., Hwang, E. S., et al. (1998). Budding yeast Cdc20: A target of the spindle checkpoint. Science 279 (5353), 1041–1044. doi:10.1126/science.279.5353.1041
Jiang, P., Gu, S., Pan, D., Fu, J., Sahu, A., Hu, X., et al. (2018). Signatures of T cell dysfunction and exclusion predict cancer immunotherapy response. Nat. Med. 24 (10), 1550–1558. doi:10.1038/s41591-018-0136-1
Jin, H., Shi, Y., Lv, Y., Yuan, S., Ramirez, C. F. A., Lieftink, C., et al. (2021). EGFR activation limits the response of liver cancer to lenvatinib. Nature 595 (7869), 730–734. doi:10.1038/s41586-021-03741-7
Koshino, A., Nagano, A., Ota, A., Hyodo, T., Ueki, A., Komura, M., et al. (2022). PBK enhances cellular proliferation with histone H3 phosphorylation and suppresses migration and invasion with CDH1 stabilization in colorectal cancer. Front. Pharmacol. 12, 772926. doi:10.3389/fphar.2021.772926
Llovet, J. M., Montal, R., Sia, D., and Finn, R. S. (2018). Molecular therapies and precision medicine for hepatocellular carcinoma. Nat. Rev. Clin. Oncol. 15 (10), 599–616. doi:10.1038/s41571-018-0073-4
Long, M., Zhou, Z., Wei, X., Lin, Q., Qiu, M., Zhou, Y., et al. (2022). A novel risk score based on immune-related genes for hepatocellular carcinoma as a reliable prognostic biomarker and correlated with immune infiltration. Front. Immunol. 13, 1023349. doi:10.3389/fimmu.2022.1023349
Lu, Y., Wu, X., Dai, J., Ding, Q., Wu, W., and Wang, X. (2019). The characteristics and spectrum of F9 mutations in Chinese sporadic haemophilia B pedigrees. Haemophilia 25 (2), 316–323. doi:10.1111/hae.13681
Luo, Z., Wang, J., Zhu, Y., Sun, X., He, C., Cai, M., et al. (2021). SPOP promotes CDCA5 degradation to regulate prostate cancer progression via the AKT pathway. Neoplasia 23 (10), 1037–1047. doi:10.1016/j.neo.2021.08.002
Ma, H., Qi, G., Han, F., Peng, J., Yuan, C., and Kong, B. (2022). PBK drives PARP inhibitor resistance through the TRIM37/NFκB axis in ovarian cancer. Exp. Mol. Med. 54 (7), 999–1010. doi:10.1038/s12276-022-00809-w
Shapiro, A. D., Ragni, M. V., Borhany, M., Abajas, Y. L., Tarantino, M. D., Holstein, K., et al. (2021). Natural history study of factor IX deficiency with focus on treatment and complications (B-Natural). Haemophilia. 27 (1), 49–59. doi:10.1111/hae.14139
Shen, B., Zhang, G., Liu, Y., Wang, J., and Jiang, J. (2022). Identification and analysis of immune-related gene signature in hepatocellular carcinoma. Genes (Basel) 13 (10), 1834. doi:10.3390/genes13101834
Shen, Q., He, Y., Qian, J., and Wang, X. (2022). Identifying tumor immunity-associated molecular features in liver hepatocellular carcinoma by multi-omics analysis. Front. Mol. Biosci. 9, 960457. doi:10.3389/fmolb.2022.960457
Shi, M., Dai, W. Q., Jia, R. R., Zhang, Q. H., Wei, J., Wang, Y. G., et al. (2021). APCCDC20-mediated degradation of PHD3 stabilizes HIF-1a and promotes tumorigenesis in hepatocellular carcinoma. Cancer Lett. 496, 144–155. doi:10.1016/j.canlet.2020.10.011
Siegel, R. L., Miller, K. D., Fuchs, H. E., and Jemal, A. (2022). Cancer statistics, 2016. Ca. Cancer J. Clin. 72 (1), 7–30. doi:10.3322/caac.21332
Sun, G., Ye, N., Dai, D., Chen, Y., Li, C., and Sun, Y. (2016). The protective role of the TOPK/PBK pathway in myocardial ischemia/reperfusion and H₂O₂-Induced injury in H9C2 cardiomyocytes. Int. J. Mol. Sci. 17 (3), 267. doi:10.3390/ijms17030267
Sun, H., Zheng, J., Xiao, J., Yue, J., Shi, Z., Xuan, Z., et al. (2022). TOPK/PBK is phosphorylated by ERK2 at serine 32, promotes tumorigenesis and is involved in sorafenib resistance in RCC. Cell Death Dis. 13 (5), 450. doi:10.1038/s41419-022-04909-3
Sung, H., Ferlay, J., Siegel, R. L., Laversanne, M., Soerjomataram, I., Jemal, A., et al. (2021). Global cancer statistics 2020: GLOBOCAN estimates of incidence and mortality worldwide for 36 cancers in 185 countries. Ca. Cancer J. Clin. 71 (3), 209–249. doi:10.3322/caac.21660
Tian, Y., Wu, J., Chagas, C., Du, Y., Lyu, H., He, Y., et al. (2018). CDCA5 overexpression is an Indicator of poor prognosis in patients with hepatocellular carcinoma (HCC). BMC Cancer 18 (1), 1187. doi:10.1186/s12885-018-5072-4
Wang, K., Wei, J., Ma, J., Jia, Q., Liu, Y., Chai, J., et al. (2022). Phosphorylation of PBK/TOPK Tyr74 by JAK2 promotes Burkitt lymphoma tumor growth. Cancer Lett. 544, 215812. doi:10.1016/j.canlet.2022.215812
Xu, J., Zhu, C., Yu, Y., Wu, W., Cao, J., Li, Z., et al. (2019). Systematic cancer-testis gene expression analysis identified CDCA5 as a potential therapeutic target in esophageal squamous cell carcinoma. EBioMedicine 46, 54–65. doi:10.1016/j.ebiom.2019.07.030
Yan, Z., He, M., He, L., Wei, L., and Zhang, Y. (2021). Identification and validation of a novel six-gene expression signature for predicting hepatocellular carcinoma prognosis. Front. Immunol. 12, 723271. doi:10.3389/fimmu.2021.723271
Yang, P., Liu, H., Li, Y., Gao, Q., Chen, X., Chang, J., et al. (2022). Overexpression of TCERG1 as a prognostic marker in hepatocellular carcinoma: A TCGA data-based analysis. Front. Genet. 13, 959832. doi:10.3389/fgene.2022.959832
Yang, Q. X., Zhong, S., He, L., Jia, X. J., Tang, H., Cheng, S. T., et al. (2019). PBK overexpression promotes metastasis of hepatocellular carcinoma via activating ETV4-uPAR signaling pathway. Cancer Lett. 452, 90–102. doi:10.1016/j.canlet.2019.03.028
Zhang, Z., Shen, M., and Zhou, G. (2018). Upregulation of CDCA5 promotes gastric cancer malignant progression via influencing cyclin E1. Biochem. Biophys. Res. Commun. 496 (2), 482–489. doi:10.1016/j.bbrc.2018.01.046
Zhao, S., Zhang, Y., Lu, X., Ding, H., Han, B., Song, X., et al. (2021). CDC20 regulates the cell proliferation and radiosensitivity of P53 mutant HCC cells through the Bcl-2/Bax pathway. Int. J. Biol. Sci. 17 (13), 3608–3621. doi:10.7150/ijbs.64003
Zhao, Y., Zhang, Y. N., Wang, K. T., and Chen, L. (2020). Lenvatinib for hepatocellular carcinoma: From preclinical mechanisms to anti-cancer therapy. Biochim. Biophys. Acta. Rev. Cancer 1874 (1), 188391. doi:10.1016/j.bbcan.2020.188391
Zhu, Y., Cui, J., Liu, J., Hua, W., Wei, W., and Sun, G. (2020). Sp2 promotes invasion and metastasis of hepatocellular carcinoma by targeting TRIB3 protein. Cancer Med. 9 (10), 3592–3603. doi:10.1002/cam4.2977
Zolotovskaia, M. A., Tkachev, V. S., Guryanova, A. A., Simonov, A. M., Raevskiy, M. M., Efimov, V. V., et al. (2022). OncoboxPD: Human 51 672 molecular pathways database with tools for activity calculating and visualization. Comput. Struct. Biotechnol. J. 20, 2280–2291. doi:10.1016/j.csbj.2022.05.006
Keywords: hepatocellular carcinoma, prognosis, diagnosis, PBK, F9
Citation: Zhu Y, Wang Y, Hu M, Lu X and Sun G (2023) Identification of oncogenes and tumor-suppressor genes with hepatocellular carcinoma: A comprehensive analysis based on TCGA and GEO datasets. Front. Genet. 13:934883. doi: 10.3389/fgene.2022.934883
Received: 03 May 2022; Accepted: 05 December 2022;
Published: 04 January 2023.
Edited by:
Anton A. Buzdin, European Organisation for Research and Treatment of Cancer, BelgiumReviewed by:
Ruiqin Han, Chinese Academy of Medical Sciences, ChinaJiantao Mo, The First Affiliated Hospital of Xi’an Jiaotong University, China
Marianna Arsenovna Zolotovskaia, Moscow Institute of Physics and Technology, Russia
Copyright © 2023 Zhu, Wang, Hu, Lu and Sun. This is an open-access article distributed under the terms of the Creative Commons Attribution License (CC BY). The use, distribution or reproduction in other forums is permitted, provided the original author(s) and the copyright owner(s) are credited and that the original publication in this journal is cited, in accordance with accepted academic practice. No use, distribution or reproduction is permitted which does not comply with these terms.
*Correspondence: Guoping Sun, c3VuZ3BAYWhtdS5lZHUuY24=
†These authors have contributed equally to this work and share first authorship
 Yue Zhu
 Yanfei Wang1,2†
 Guoping Sun
