 Małgorzata Łysiak
 Jyotirmoy Das
 Annika Malmström
 Peter Söderkvist
94% of researchers rate our articles as excellent or good
Learn more about the work of our research integrity team to safeguard the quality of each article we publish.
Find out more
ORIGINAL RESEARCH article
Front. Genet. , 25 August 2022
Sec. Cancer Genetics and Oncogenomics
Volume 13 - 2022 | https://doi.org/10.3389/fgene.2022.934519
Patients with glioblastoma (GBM) have a poor outcome, but even among patients receiving the same therapies and with good prognostic factors, one can find those with exceptionally short and long survival. From the Nordic trial, which randomized GBM patients of 60 years or older between two radiotherapy arms (60 Gy or 34 Gy) or temozolomide (TMZ), we selected 59 with good prognostic factors. These selected GBM patients were equally distributed according to treatment and MGMT promoter methylation status but had long or short survival. Methylation profiling with the Illumina Infinium Methylation EPIC BeadChip arrays was performed and utilized for methylation-based CNS tumor classification, and pathway enrichment analysis of differentially methylated CpG sites (DMCs), as well as calculation of epigenetic age acceleration with three different algorithms, to compare the long and short survival groups. Samples identified by the classifier as non-GBM IDH wildtype were excluded. DMCs between long- and short-term survivors were found in patients with methylated MGMT promoter treated with TMZ (123,510), those with unmethylated MGMT treated with 60Gy radiotherapy (4,086), and with methylated MGMT promoter treated with 34Gy radiotherapy (39,649). Long-term survivors with methylated MGMT promoter treated with TMZ exhibited hypermethylation of the Wnt signaling and the platelet activation, signaling, and aggregation pathways. The joint analysis of radiotherapy arms revealed 319 DMCs between long- and short-term survivors with unmethylated MGMT and none for samples with methylated MGMT promoter. An analysis comparing epigenetic age acceleration between patients with long- and short-term survival across all treatment arms showed a decreased epigenetic age acceleration for the latter. We identified DMCs for both TMZ and RT-treated patients and epigenetic age acceleration as a potential prognostic marker, but further systematic analysis of larger patient cohorts is necessary for confirmation of their prognostic and/or predictive properties.
Glioblastoma (GBM) remains the most common and deadliest among gliomas. The peak incidence is in individuals above 65 years old, and only about 5.6% of patients reach five-year survival (Ostrom et al., 2018). Unfortunately, the treatment options are also limited, and so far, efforts have only provided modest survival benefits, leaving the median survival at 1.2 years (Molinaro et al., 2019; Weller et al., 2020). Standard therapy for GBM patients consists of gross total resection, if feasible, followed by concomitant radiotherapy (RT) and chemotherapy with the alkylating agent temozolomide (TMZ) and additional six cycles of TMZ (Weller et al., 2021). For fit patients, additional treatment with tumor-treating fields is an option, further prolonging survival for the selected group by nearly 5 months (Stupp et al., 2017). Choosing the best possible treatment is crucial, especially for elderly patients often burdened by comorbidities, where the combined treatment is not expected to be tolerated. The known positive prognostic factors include the extent of surgery, age, performance status, and sex of the patient (Weller et al., 2020). Thus far, the only predictive biomarker associated with response to TMZ treatment is the methylation status of the promoter of the O6-methylguanine-DNA-methyltransferase (MGMT) gene, and methylated MGMT (m-MGMT) is associated with better overall survival (OS) (Stupp et al., 2007; Malmstrom et al., 2012), although varying responses among patients are still observed.
Notably, the importance of epigenetic changes in gliomas has been emphasized by recent discoveries (Etcheverry et al., 2010; Capper et al., 2018; Chai et al., 2019; Wu et al., 2020). The current classification of brain tumors incorporates molecular biomarkers, namely., mutations of isocitrate dehydrogenase 1 or 2 (IDH1/2) and 1p/19q codeletion (Louis et al., 2016). Methylome profiling presents a promising alternative, with further refinement and subclassification (Capper et al., 2018). Another example is the glioma cytosine–phosphate–guanine (CpG) island methylator phenotype (G-CIMP), which entails genome-wide hypermethylation of the CpG islands. The G-CIMP profile is tightly associated with IDH1/2 mutations and better outcomes for patients with IDH-mutated gliomas (Noushmehr et al., 2010; Malta et al., 2018; Tesileanu et al., 2021). There are also other indications that methylome profiling could aid in selection of patients with better prognosis within the same diagnostic entity, for e.g., by using the methylation differences found in short- and long-term survivors (STS and LTS, respectively) with GBM (Shinawi et al., 2013; Ma et al., 2015; Klughammer et al., 2018). Moreover, changes in the methylation profiles between primary and recurrent GBM have been reported, with common occurrence of switches between methylation subclasses found at progression (Klughammer et al., 2018).
Age is one of the prognostic factors, and younger GBM patients are characterized by better outcomes (Ostrom et al., 2018; Weller et al., 2020). Aging is also reflected in the methylation state of the genome, the so-called epigenetic age (Lu et al., 2019). Methylation of specific CpG sites undergoes age-dependent changes, which can be quantified and expressed through the epigenetic age (Horvath, 2013). Acceleration of the epigenetic age, which is the difference between the epigenetic age and chronological age, has been reported in many diseases, such as Alzheimer’s (Levine et al., 2015) or Parkinson’s disease (Horvath and Ritz, 2015). It has also shown to be associated with cancer, mortality in cardiovascular diseases (Lin and Wagner, 2015; Perna et al., 2016), and patients outcome in gliomas (Liao et al., 2018; Zheng et al., 2020).
In the Nordic trial, patients of 60 years or older diagnosed with GBM were randomized between two different fractionation regimens of RT or TMZ treatment alone (Malmstrom et al., 2012). Constituting a unique cohort with the possibility to investigate the role of methylation profiles in relation to RT and TMZ separately, we decided to analyze the global methylation status of tumors from LTS and STS using Illumina EPIC bead arrays. The aim of this research was to identify potential methylation-based biomarkers or profiles related to treatment and outcome.
All patients included in this study were participants of the Nordic-randomized, phase 3 trial registered under number ISRCTN81470623 (Malmstrom et al., 2012), which compared three treatment modalities for newly diagnosed GBM patients with age 60 and above (TMZ vs. standard RT 60Gy vs. hypofractionated RT 34Gy). First, from the entire trial, we selected patients with available formalin-fixed paraffin-embedded (FFPE) tumor tissue. From each of the three treatment arms (TMZ, 34, and 60Gy), we chose patients with immunohistochemically confirmed IDH1 wildtype status and characterized the patients by two good prognostic factors: tumor resection and WHO performance status 0–1 (Malmstrom et al., 2012). Next, samples within each treatment arm were stratified based on their MGMT promoter methylation status (methylated MGMT promoter, m-MGMT; unmethylated MGMT promoter, u-MGMT) and ranked based on the survival. From each group, we selected five patients with the longest and five with the shortest survival, so that the treatment modality, MGMT status, and survival group were represented by an equal number of patients (Figure 1 and Table 1). The MGMT methylation status was analyzed with the MDxHealth method, Liège, Belgium, as mentioned in Malmstrom et al. (2012). Ethical approval for the Nordic trial and molecular analyses were previously obtained (99086, M11-06 T40-09, and 2011/32–32).
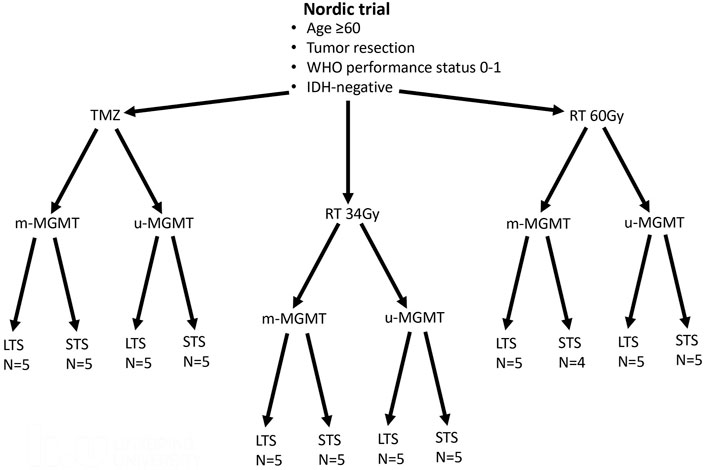
FIGURE 1. Patients from the Nordic trial included in the study. Patients with good prognostic factors were selected from each treatment arm (temozolomide -TMZ, radiotherapy 34Gy-RT 34Gy, and radiotherapy 60Gy- RT60Gy). Half of the tumors had methylated MGMT promoter (m-MGMT), and half had unmethylated MGMT promoter (u-MGMT). These patients were further divided into long-term survivors (LTS) and short-term survivors (STS). N, number of patients.
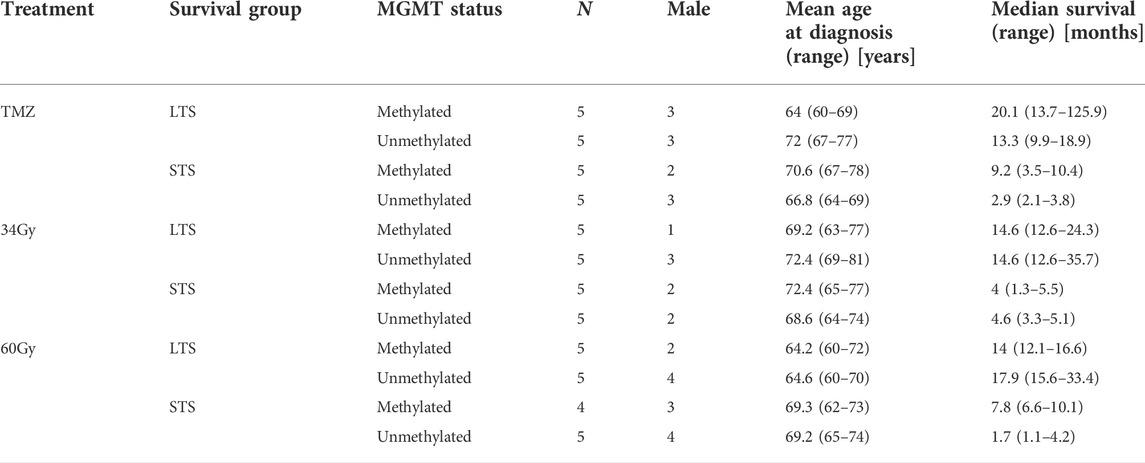
TABLE 1. Patient characteristics.
DNA was extracted from two tumor tissue sections of 10 µm each, using the Maxwell FFPE DNA Purification Kit (Promega) according to the manufacturer’s protocol but with a double amount of proteinase K (40 mg/ml). DNA quantity and quality were checked using the NanoDrop ND-1000 spectrophotometer (ThermoFisher) and Quantus Fluorometer (Promega), as well as with the Infinium FFPE QC Kit (Illumina). A total of 250–500 ng of DNA was subjected to bisulfite conversion using the EZ DNA methylation kit (Zymo Research), and genome-wide DNA methylation was assessed with the Infinium Methylation EPIC BeadChip Kit (Illumina) complemented by the Infinium HD FFPE DNA Restore Kit as per manufacturer’s protocol. The BeadChip arrays were scanned on the NextSeq 550 (Illumina), and DNA methylation data in the form of IDAT files (intensity data files that contain green and red signals from methylated and unmethylated CpG sites) were uploaded to the online classifier v11b4 (Capper et al., 2018), where MGMT methylation status was also assessed with the MGMT-STP27 algorithm (Bady et al., 2016).
The IDAT files from Illumina Human Methylation EPIC arrays were also analyzed using R (v4.0.3) (R Core Team, 2021) and Bioconductor packages (v3.14) (Gentleman et al., 2004), for example., the Chip Analysis Methylation Pipeline (ChAMP) analysis package (v2.19.3) (Tian et al., 2017). The files were pre-processed in ChAMP to filter out CpGs with detection p-value >0.01, as well as SNP CpGs, unbound and multi-hit CpGs, and all CpGs from sex chromosomes. After filtration, a quality check was performed, and the files were normalized with the beta-mixture quantile normalization (BMIQ) function. The β- and M-values of the samples were calculated against each CpG per sample. Batch effects were corrected with the runCombat function. The differential methylation analysis was calculated with the linear modeling (limFit) and eBayes algorithm, comparing two groups from the phenotypic dataset, and singular value decomposition (SVD) analysis was performed to check for confounders (e.g., age and sex) (Supplementary Data, Supplementary Figure S2). The differential methylation analysis was performed first for all samples that were classified as GBM IDH wildtype. Then, after removal of patients that died due to causes other than tumor, such as infection, the same analysis was conducted for three samples from each group, i.e., three with the longest survival in LTS and three with the shortest survival in STS. The latter analysis found differentially methylated CpGs (DMCs) in the comparison of LTS vs. STS within each treatment arm with methylated or unmethylated MGMT promoter; hence, further analysis was based on these. The DMCs were considered significant at the Bonferroni–Hochberg corrected p-value (p-valueBH) <0.05. The hierarchical cluster analysis was performed using the Euclidean distance within the ape package (v5.0) (Paradis and Schliep, 2019) in R.
We used AnnotationDbi package (v1.54.1) (Pagès et al., 2021) to annotate DMCs and in-house scripts to visualize their genomic distribution. The statistically significant DMCs (p-valueBH < 0.05) were used to create the volcano plot with the mean methylation difference (∆mmd) ≥|0.3|) using the EnhancedVolcano package (v1.10.0) (Blighe et al., 2021) in R. The cut-off score of ∆mmd was calculated using the β-value distribution of all samples with the mean ± 2SD (Supplementary Data, Supplementary Figure S3, and Supplementary Data, Supplementary Table S1). The R package ComplexHeatmap (v2.8.0) (Gu et al., 2016) was used to create the heatmap from individual β-values of DMCs (p-valueBH < 0.05; (∆mmd) ≥|0.3|).
To reduce the number of DMCs, we first filtered out DMCs based on the genomic location, leaving only those from the 5′-untranslated region (5′-UTR) and transcription start site (TSS) regions (TSS200 and TSS1500). Furthermore, we applied the ∆mmd cut-off score (as described previously). The DMCs were converted to their respective official gene symbols (hereafter called DMGs, differentially methylated genes), and the list (without/with ∆mmd values) was used for the pathway enrichment analysis. The Reactome database (v78) (Griss et al., 2020) was applied to perform the gene set enrichment analysis using the clusterProfiler package (v4.0.5) (Wu et al., 2021) in R (v4.1) with the default parameters setup (e.g., 1,000 permutations and p-valueBH < 0.05). The results were visualized using ggplot2 (v3.3.3) (Wickham, 2016) in-house script.
The epigenetic age was calculated for the same set of samples that were used in the differential methylation analysis (three samples from STS and LTS per group). We used methylation data obtained in this study and followed the methods published for three epigenetic clocks, namely, Horvath’s (Horvath, 2013), Hannum’s (Hannum et al., 2013), and PhenoAge (Levine et al., 2018). The epigenetic age acceleration was calculated as the difference between the epigenetic age and chronological age, given in years. Mean chronological and epigenetic ages were compared with two-tailed Student’s t-test, and a p-value <0.05 was considered significant. Calculations were performed with IBM SPSS (v.26).
Histological review in the primary analysis of the trial material classified 58 out of 59 samples included in this study as GBM grade 4, and one sample was classified as astrocytoma grade 3, but all samples were IDH1 mutation-negative. Methylation data for all samples passed the quality control and were uploaded to the brain tumor classifier (https://www.molecularneuropathology.org/mnp) (Capper et al., 2018). Methylation-based classification placed most of the samples in the GBM IDH wildtype class, including the mentioned astrocytoma. One sample was classified as anaplastic pilocytic astrocytoma, and confirmative sequencing of IDH1 and IDH2 displayed the absence of mutation in accordance with the immunohistochemistry result. In three cases, samples were classified as “control tissue” probably due to low tumor cell content and were excluded. The analysis of methylation subclasses revealed that 21 samples belonged to only one subclass, with 2 being midline GBM. The remaining (n = 34) GBM IDH wildtype samples had two or three subclasses assigned to them. The MGMT methylation analysis results were concordant between the MDxHealth method and MGMT-STP27 for all but one sample, even for the samples that were classified as control tissue.
We decided to only include samples, where progressive disease and/or death caused by the tumor had been reported because, especially in the STS groups, the true relationship between the tumor’s methylation profile and survival could be compromised. After removing cases where death was caused by co-morbidity or complications (e.g., infection and pulmonary embolism), we decided to include only three samples with extreme survival times from each treatment arm and MGMT group, as survival times, especially in the RT arms, which had relatively small spread. The survival differences between LTS and STS as Kaplan–Meier curves are shown in the Supplementary Data, Supplementary Figure S1.
We compared LTS and STS samples in the separated treatment arms (TMZ, 34Gy, 60Gy, and combined RT), and within each treatment, we compared m-MGMT and u-MGMT samples separately and in combination. DMCs between LTS and STS were identified in the TMZ arm, m-MGMT; 34Gy, m-MGMT; 60Gy, u-MGMT, and in the combined RT arm, u-MGMT. The highest number of DMCs were found in the TMZ group (Supplementary Data, Supplementary Table S1). The cofactor analysis showed that the differential methylation analysis was not influenced by the included confounders (age, sex, and death by the tumor/progressive disease) (Supplementary Data, Supplementary Figure S2). Upon the structural annotation of DMCs, we found that they were similarly distributed throughout the genome (Figure 2), with the majority of DMCs found in the gene bodies and intergenic regions. Approximately 10% of DMCs were found in the TSS1500 and up to 8% in the 5′UTR, with both regions being of regulatory importance for gene expression due to the location of gene promoters. We reduced the number of DMCs for further analysis by filtering them out based on the genomic location (TSS1500, TSS200, and 5′-UTR) and ∆mmd cut-off values. Inspection of density plots created from filtered data revealed that the majority of DMCs were hypermethylated in LTS in the TMZ and 34Gy, m-MGMT groups and hypomethylated in LTS in the 60Gy, u-MGMT group. All DMCs were hypomethylated in the comparison of LTS vs. STS in the combined RT group with u-MGMT (Supplementary Data, Supplementary Figure S3). Next, we performed hierarchical cluster analysis on filtered DMCs (Figure 3). We observed that in the TMZ, m-MGMT group, data formed four clusters of DMCs between LTS and STS. We also found that for the joint RT group with u-MGMT, clusters separated LTS and STS but not the radiation doses (34 and 60Gy), emphasizing the importance of the treatment modality itself.

FIGURE 2. Pie charts representing the structural genomic distribution of DMCs discovered in samples with long (n = 3) and short (n = 3) survival within the different treatment arms and with specified MGMT promoter methylation status. TSS200, 200 bases upstream transcription start site; TSS1500, 1,500 bases upstream transcription start site; UTR, untranslated region; IGR, intergenic region; 60Gy34Gy, combined RT.
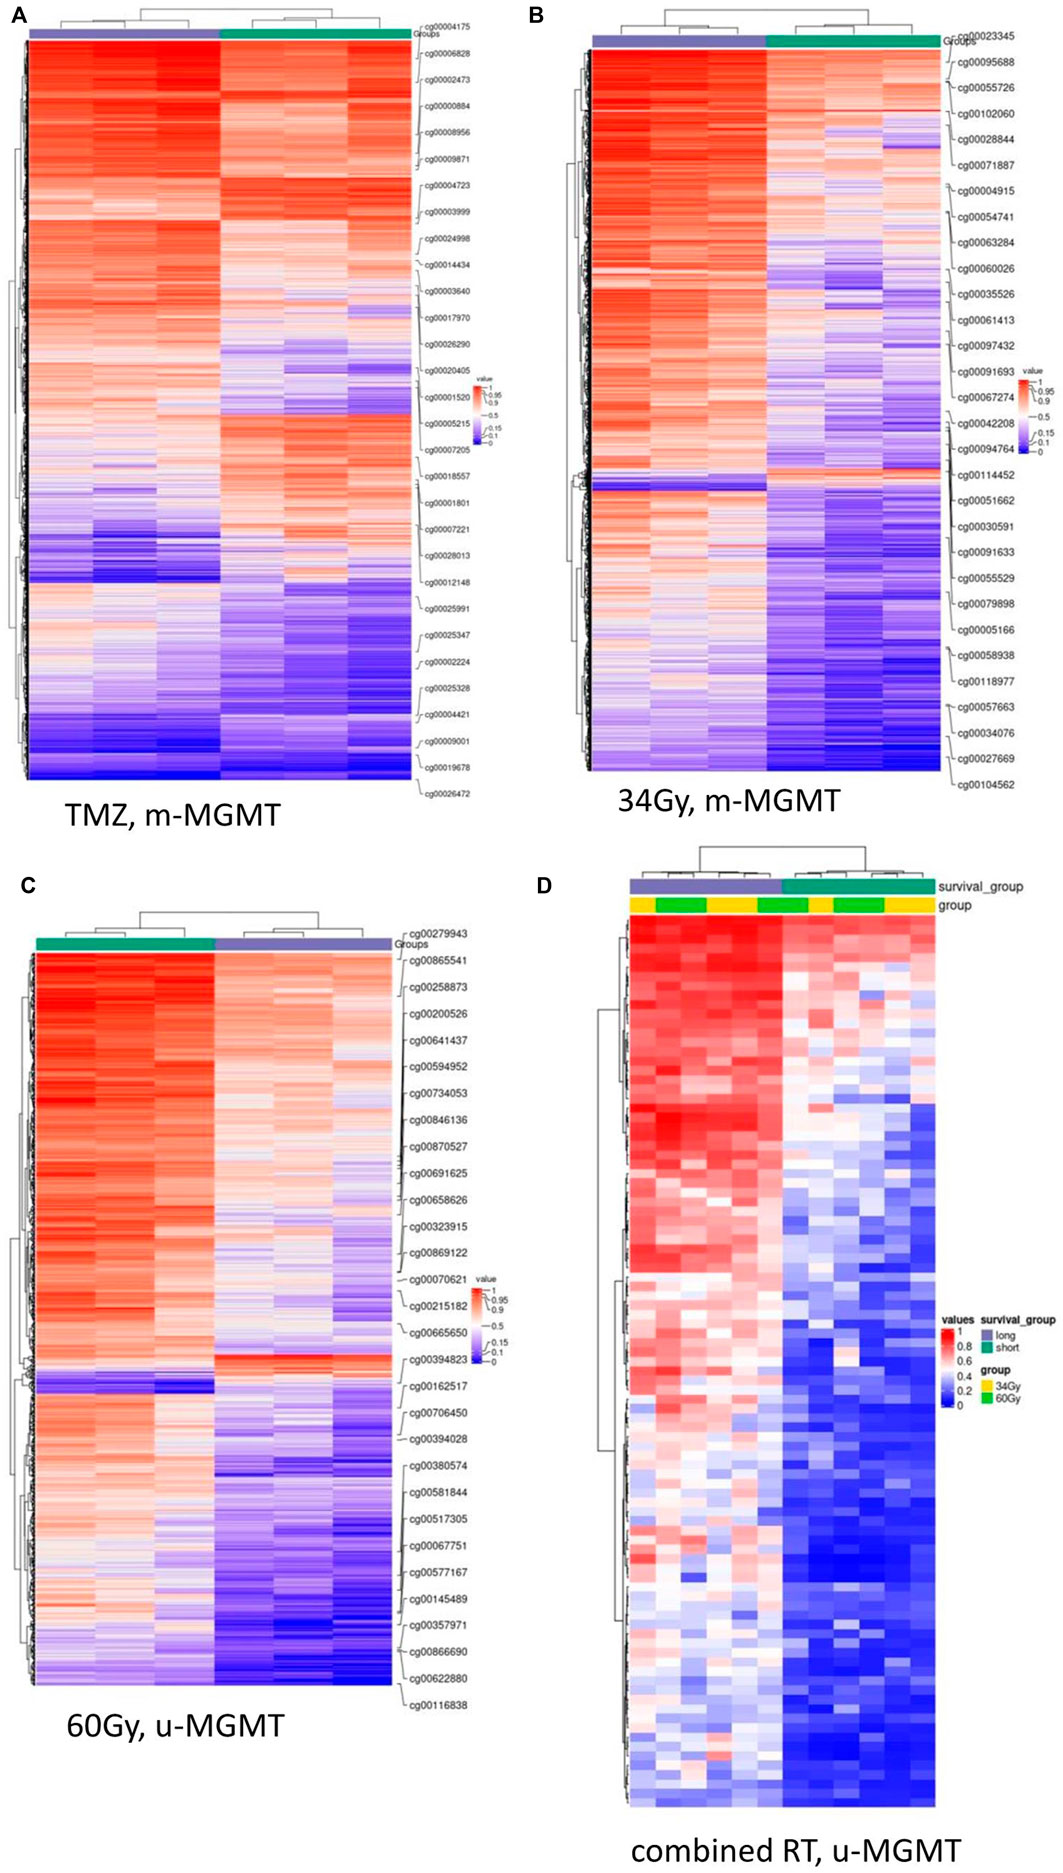
FIGURE 3. (Continued).
Next, we used the Reactome database to investigate pathway enrichment among the filtered DMGs, which were obtained from the annotated DMCs. There were four pathways enriched in the hypermethylated DMGs among LTS from the TMZ, m-MGMT group, namely, metabolism; platelet activation, signaling, and aggregation; signaling by WNT; and signal transduction. In the same group analysis (LTS from the TMZ, m-MGMT), we found 37 pathways enriched in the hypomethylated DMGs, for example., the immune system and Rho signaling pathways (Supplementary Data, Supplementary Table S2). In the hypermethylated DMGs in LTS in the treatment of 34Gy with m-MGMT, we found two enriched pathways (immune system and class B/2 secretin family receptors) (Supplementary Data, Supplementary Table S2). We did not find any enriched pathways for the remaining groups. Due to stringent filters applied initially to DMCs and a low number of detected enriched pathways, we decided to include DMCs removed by the ∆mmd cut-off values and repeat the analysis. Consequently, the number of enriched pathways increased, both for the TMZ, m-MGMT and 34Gy, m-MGMT groups (Figure 4), but no pathways were enriched in the 60Gy and combined RT groups. We compared the lists of enriched pathways and found seven that were common for the TMZ and 34Gy (m-MGMT) arms, with three of them involved in G-protein coupled receptor (GPCR) signaling (Figure 4).
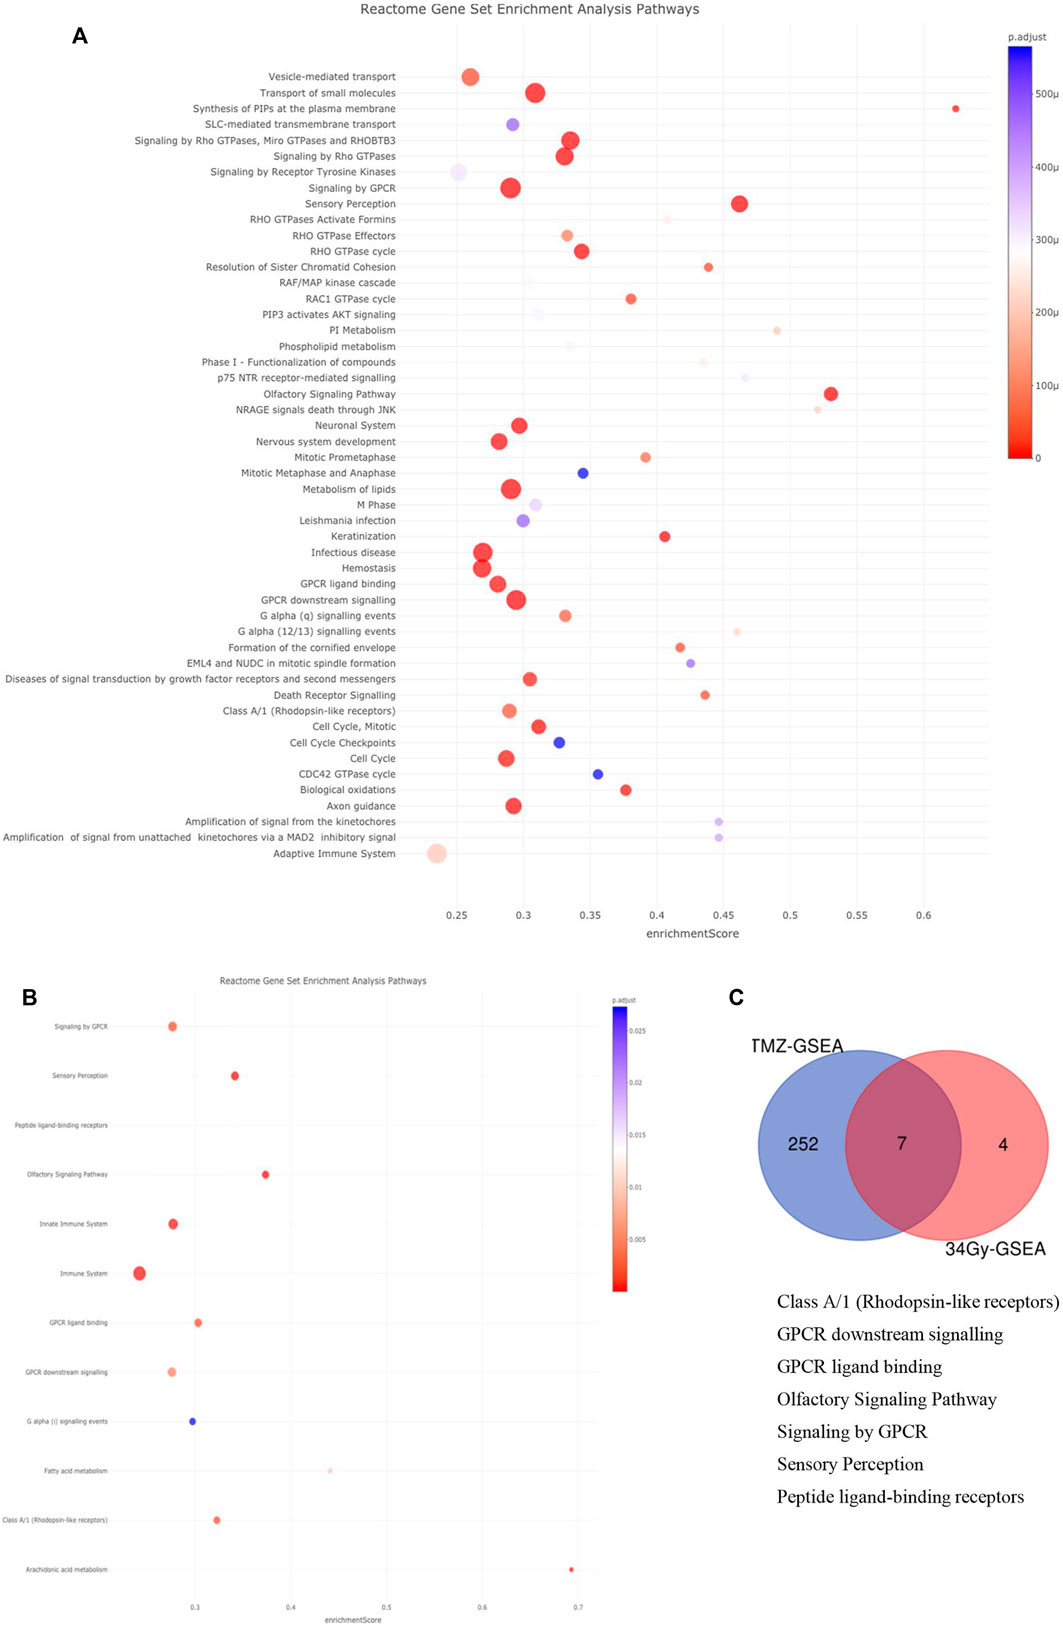
FIGURE 4. (Continued).
One of the hypermethylated pathways found to be enriched in LTS from the TMZ group with m-MGMT was WNT signaling. We wanted to check whether there was a correlation between methylation of DMGs from the enrichment core and the expression of these, but gene expression data were not available for our samples. Instead, we used 51 primary, IDH wildtype GBM samples with RNA-seq and 450k methylation array data from TCGA, accessed via the SMART App website (Li et al., 2019). First, we identified which of the DMCs from the enrichment core were also covered by the 450k beadchip arrays, since our results were based on the newer design, the 850k methylation array. The overlapping DMCs were found for nine genes, which were then analyzed with the Spearman correlation coefficient to find if the promoter methylation status of the genes correlated with the corresponding mRNA expression, at a significance level p < 0.05. A negative correlation was found only for the WNT2 gene (R = -0.37, p = 0.0067).
The cofactor analysis showed that chronological age did not affect DMCs (Supplementary Data, Supplementary Figure S2); however, molecular alterations in cancer cells may affect the epigenetic age. This prompted us to analyze the epigenetic age of the groups consisting of three tumor samples, which involved three different epigenetic clocks, Horvath’s (Horvath, 2013), Hannum’s (Hannum et al., 2013), and PhenoAge (Levine et al., 2018). The calculated epigenetic age was compared to the chronological age of the patient to establish epigenetic age acceleration. We found significant differences between mean epigenetic age acceleration calculated with Horvath’s (STS vs. LTS; 23.6 vs. 39.2 years, p = 0.043) and PhenoAge (STS vs. LTS; -18 vs. 0.2 years, p = 0.028) epigenetic clocks of STS and LTS in the analysis that combined samples from all treatment arms and with both methylated and unmethylated MGMT promoter (Figure 5). As the number of samples analyzed was small, i.e., only 18 in all, to further statistically improve our finding of the prognostic value of epigenetic age acceleration for the Horvath’s clock in an analysis regarding LTS and STS for patients with the same characteristics as used in this study, it would be necessary to include at least 32 samples per group to maintain a power of 80% with alpha equal to 0.05. However, it is important to keep in mind that samples used here were selected based on their significant survival difference, and these power calculations do not include the midpoint survival. To analyze whether our findings were treatment- or MGMT promoter methylation status-specific, we also compared the epigenetic age and epigenetic age acceleration between STS and LTS in the groups defined by these factors. According to Horvath’s algorithm, all samples had a higher epigenetic than chronological age (Supplementary Data, Supplementary Table S3), but there was no significant difference between the epigenetic age in LTS and STS, when separated into different treatment arms with different MGMT promoter methylation statuses. There were also no differences in the age acceleration (Supplementary Data, Supplementary Table S3). In the results from Hannum’s and PhenoAge epigenetic clocks, both epigenetic age acceleration and deceleration (epigenetic age < chronological age) were observed, with STS groups usually characterized by lower mean epigenetic age (Supplementary Data, Supplementary Table S3). Significant differences were discovered only in the 34Gy, u-MGMT group (Hannum’s and PhenoAge) and in the combined RT, u-MGMT group (Hannum’s). In these cases, STS showed epigenetic age deceleration and lower mean epigenetic ages than LTS.
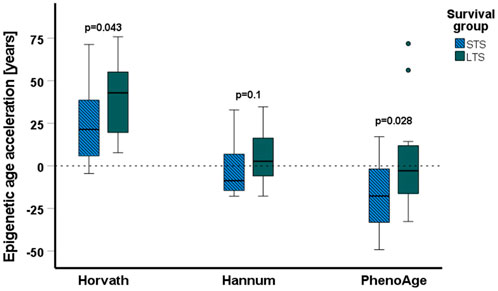
FIGURE 5. Results of the epigenetic age acceleration analyses. The epigenetic age acceleration (difference between the epigenetic age and the chronological age) is shown in years on the y-axis, horizontal lines represent the median values, boxplots represent the first and third quartiles, errors are represented by the T-bars, and the dots represent outliers. Epigenetic age acceleration is significantly lower for short-term survivors (STS) (N = 18) than long-term survivors (LTS) (N = 18) when calculated with Horvath’s and PhenoAge algorithms. All data above the dashed line represent an acceleration of epigenetic age, and data below the dotted line represent a deceleration of epigenetic age.
In recent years an increase in the use of methylome profiling has been observed. The widely known brain tumor classifier proposed by Capper et al. (2018) allows for a more precise classification of brain malignancies. Undoubtedly, methylation of the MGMT promoter remains the most important biomarker for GBM, which predicts the effect of TMZ treatment (Stupp et al., 2007; Malmstrom et al., 2012; Weller et al., 2020). However, we lack validated predictive biomarkers for patients with u-MGMT tumors or for those treated with RT. Here, we employed the Capper classifier (Capper et al., 2018) and differential methylation to identify biomarkers predisposing to good treatment response or indicating resistance to therapy.
Inter- and intratumor heterogeneity of GBM plays an important role in treatment resistance and relapse of the disease. A previous study on spatially separated biopsies showed that methylation heterogeneity is common in GBM, though it seems to affect only the subclassification, whilst all samples remain classified as GBM IDH wildtype and MGMT methylation status also remains stable (Wenger et al., 2019). This is in line with our results from the methylation-based classification, which showed that in 34 samples more than one subclass was identified. Interestingly, it has recently been reported that treatments such as chemo- or radiotherapy, and even hypoxia, as sources of stress for cancer cells, may induce methylation changes that likely contribute to the heterogeneity among tumor cells (Johnson et al., 2021) and possibly patients’ outcome.
In LTS treated with TMZ and with m-MGMT, our analysis revealed that the WNT signaling pathway was hypermethylated, implicating silencing of WNT signaling and indicating the importance of a maintained WNT pathway activity in STS. This aligns with the previously presented results by Shinawi et al. (2013), in which hypermethylation of the promoter of the DKK2 gene, an antagonist of the WNT pathway, was found in STS. In TCGA data, we found a negative correlation between methylation of the sites corresponding to hypermethylated CpGs in our samples and the expression of the WNT2 gene. In mice, WNT2 drives the proliferation of progenitor cells and development of the midbrain, possibly having similar effects in humans (Sousa et al., 2010). Wnt signaling is crucial during embryonal development and is commonly altered in cancers (Zhan et al., 2017). In GBM, activation of the WNT pathway is necessary for the maintenance of glioblastoma cancer stem cells, which greatly contribute to treatment resistance (Lee et al., 2016). Importantly, methylation may be the main regulatory mechanism of the WNT pathway in GBM, as mutations are rare (Lee et al., 2016). GBM is also proposed to originate from the subventricular zone (SVZ), an area supporting neural progenitor cells (Lee et al., 2018), and tumor proximity to the SVZ has been linked to STS (Adeberg et al., 2014). Methylation of gene promoters in newly diagnosed GBM and their impact on gene expression, and survival of patients treated with concomitant radiochemotherapy, was also previously reported by Etcheverry et al. (2010). They found six CpG sites, for which methylation was associated with decreased survival, and two of the CpG sites were localized in the SOX10 gene promoter. We did not find SOX10 among DMGs in any of the treatment arms, but active WNT signaling acts inhibitory on SOX10 expression (Uka et al., 2020). To further emphasize this signaling pathway, a study by Wu et al. (2020) showed that SOX10 acts as a master regulator of the receptor tyrosine kinase I (RTK1) subtype of GBM, which often harbors platelet-derived growth factor receptor alpha amplification (Wu et al., 2020).
Another interesting finding, also in LTS with m-MGMT promoter treated with TMZ is hypermethylation of the platelet activation, signaling, and aggregation pathway. Up to 30% of GBM patients experience venous thromboembolism, making it one of the most common and serious complications, which may influence survival (Yust-Katz et al., 2015; Heenkenda et al., 2019). Hypermethylation of the platelet activation pathway may therefore have a protective function.
Among the hypomethylated enriched pathways, we found some that were labeled as neuronal system, neurotransmitter receptors, transmission across chemical synapses, and potassium channels, all of which have been shown to partake in GBM development and progression (Venkataramani et al., 2019; Venkatesh et al., 2019). In our study, however, these pathways are associated with LTS treated with TMZ and with m-MGMT. It should be noted that in most of the published studies mentioned here, STS is referred to patients with a survival of <1 year and LTS to those with a survival of >3 years. In our study of elderly patients with GBM, median survival was 12 months, and the survival range was 4.5–126 months for the most favorable group, those treated with TMZ and m-MGMT.
TMZ is the most commonly used drug in GBM treatment due to its good blood–brain barrier penetration and generally mild toxicity (Stupp et al., 2005), and MGMT promoter methylation status is predictive for the treatment response to TMZ (Malmstrom et al., 2012). However, not all GBMs are tested for MGMT (Malmstrom et al., 2020). Chai et al. (2019) investigated the potential benefits of TMZ in patients with u-MGMT and showed that by using a methylation signature of 31 genes, it is possible to select patients with u-MGMT to obtain a survival similar to that of patients with m-MGMT. Unfortunately, we did not find any DMCs separating LTS and STS in the TMZ arm with u-MGMT.
In LTS from the 34Gy treatment arm with m-MGMT promoter, the enriched pathway in the hypermethylated DMGs is the pathway of the secretin family receptors, a subgroup of G-protein coupled receptors (GPCRs). Pathways involving GPCR are enriched in the TMZ and 34Gy arms when filtering conditions are less stringent. GPCR is the largest family of membrane proteins involved in cell metabolism, migration, neurotransmission, immune response, and cell differentiation (Byrne et al., 2021). Hypermethylation of these pathways may lead to downregulation of gene expression and decreased activity, potentially having a protective effect on the patients. In fact, GPCRs are explored in various studies as treatment targets for glioblastoma (Byrne et al., 2021), but in our limited study, we did not find any DMCs in the combined RT group to indicate the importance of methylation of GPCR for RT outcome.
The magnitude and direction of epigenetic age changes were dependent on the applied algorithm, but overall, we observed a trend toward lower epigenetic age in STS in comparison to LTS in all algorithms. We found that STS had a significantly lower acceleration of epigenetic age than LTS in the combination groups from all treatment arms and when calculated with Horvath’s and PhenoAge algorithms. Only Hannum’s clock failed to show a significant difference. The discrepancies between the results are likely caused by the innate differences between the algorithms. Horvath’s clock pioneered the field and can be universally used for different tissues (Horvath, 2013), Hannum’s clock is primarily designed for the assessment of epigenetic age from blood, and the PhenoAge model was built on phenotypic age, including many morbidity- and mortality-related factors. Hannum’s method and PhenoAge both showed deceleration of epigenetic age instead of acceleration, which is possibly dictated by the tissues and factors used for model development. However, the results from Horvath’s clock are in line with previous studies performed on gliomas, indicating acceleration of epigenetic age in tumor tissue (Liao et al., 2018; Zheng et al., 2020). The surprising effect of epigenetic age deceleration or lower age in STS could be the result of the involvement of stem-like cells in GBM development and progression, since stem cells are characterized by lower epigenetic age (Horvath, 2013). Although we did not find consistent and significant differences in the epigenetic age of LTS and STS in most of the analyzed treatment groups, this was probably caused by the low number of samples. Overall, we observed a general distortion in the epigenetic age in comparison to the chronological age, which could be further explored as a prognostic factor. A very recent study, which included four datasets, one of them being the Nordic trial analyzed with the Illumina 450k array, showed a 70% overlap between CpGs used for methylation-based classification and sites linked to epigenetic age acceleration (Bady et al., 2022). The RTKII subclass exhibited the highest epigenetic age acceleration in comparison to the RTKI and MES tumors. Due to the limited number of samples included here, we were not able to conduct the same comparison with our 850k-generated data. At the same time, the mentioned study reported no differences in the results related to younger and older patients, indicating a lack of relevance of chronological age in relation to the epigenetic age of the GBM tissue (Bady et al., 2022).
The value of methylome profiling for brain tumors has been largely shown through the methylation-based CNS classifier (Capper et al., 2018). Although our analyses are limited due to the number of samples, they highlight methylation differences, also related to treatment modality, that exist between LTS and STS with GBM, which might be clinically relevant. Also, epigenetic age assessment may potentially be a valuable tool to select patients with good prognosis. However, systematic analysis of larger cohorts of patients with LTS and STS is necessary and warranted for validation of our findings.
The datasets generated for this study can be found in the Gene Expression Omnibus database (GEO) (http://www.ncbi.nlm.nih.gov/geo/) under the accession number GSE207426.
The studies involving human participants were reviewed and approved by the Regional Ethics Committee in Linköping. The patients/participants provided their written informed consent to participate in this study.
AM, PS, and MŁ designed the study. MŁ performed the methylation experiments. JD performed the bioinformatic analysis. MŁ and JD prepared the figures. MŁ, AM, PS, and JD analyzed the data. MŁ wrote the draft of the manuscript, and all authors reviewed and edited the final manuscript.
This research was supported by the Swedish Cancer Foundation, Lions Research Fund, FORSS and LiU Cancer.
The authors would like to thank patients and research colleagues that participated in the Nordic trial (Malmstrom et al., 2012). The authors would also like to acknowledge Clinical Genomics Linköping, Science for Life Laboratory, Sweden, for providing assistance with the analysis. This study appeared previously online as a part of the thesis (Lysiak, 2022).
The authors declare that the research was conducted in the absence of any commercial or financial relationships that could be construed as a potential conflict of interest.
All claims expressed in this article are solely those of the authors and do not necessarily represent those of their affiliated organizations, or those of the publisher, the editors, and the reviewers. Any product that may be evaluated in this article, or claim that may be made by its manufacturer, is not guaranteed or endorsed by the publisher.
The Supplementary Material for this article can be found online at: https://www.frontiersin.org/articles/10.3389/fgene.2022.934519/full#supplementary-material
Adeberg, S., Bostel, T., Konig, L., Welzel, T., Debus, J., and Combs, S. E. (2014). A comparison of long-term survivors and short-term survivors with glioblastoma, subventricular zone involvement: a predictive factor for survival? Radiat. Oncol. 9, 95. doi:10.1186/1748-717X-9-95
Bady, P., Marosi, C., Weller, M., Gronberg, B. H., Schultz, H., Taphoorn, M. J. B., et al. (2022). DNA methylation-based age acceleration observed in IDH wild-type glioblastoma is associated with better outcome-including in elderly patients. Acta Neuropathol. Commun. 10 (1), 39. doi:10.1186/s40478-022-01344-5
Bady, P., Delorenzi, M., and Hegi, M. E. (2016). Sensitivity analysis of the MGMT-STP27 model and impact of genetic and epigenetic context to predict the MGMT methylation status in gliomas and other tumors. J. Mol. Diagn. 18 (3), 350–361. doi:10.1016/j.jmoldx.2015.11.009
Blighe, K., Rana, S., and Lewis, M. (2021). EnhancedVolcano: publication-ready volcano plots with enhanced colouring and labeling. R package version 1.12.0.
Byrne, K. F., Pal, A., Curtin, J. F., Stephens, J. C., and Kinsella, G. K. (2021). G-protein-coupled receptors as therapeutic targets for glioblastoma. Drug Discov. Today 26, 2858–2870. doi:10.1016/j.drudis.2021.07.008
Capper, D., Jones, D. T. W., Sill, M., Hovestadt, V., Schrimpf, D., Sturm, D., et al. (2018). DNA methylation-based classification of central nervous system tumours. Nature 555 (7697), 469–474. doi:10.1038/nature26000
Chai, R. C., Chang, Y. Z., Wang, Q. W., Zhang, K. N., Li, J. J., Huang, H., et al. (2019). A novel DNA methylation-based signature can predict the responses of MGMT promoter unmethylated glioblastomas to temozolomide. Front. Genet. 10, 910. doi:10.3389/fgene.2019.00910
Etcheverry, A., Aubry, M., de Tayrac, M., Vauleon, E., Boniface, R., Guenot, F., et al. (2010). DNA methylation in glioblastoma: impact on gene expression and clinical outcome. BMC Genomics 11, 701. doi:10.1186/1471-2164-11-701
Gentleman, R. C., Carey, V. J., Bates, D. M., Bolstad, B., Dettling, M., Dudoit, S., et al. (2004). Bioconductor: open software development for computational biology and bioinformatics. Genome Biol. 5 (10), R80. doi:10.1186/gb-2004-5-10-r80
Griss, J., Viteri, G., Sidiropoulos, K., Nguyen, V., Fabregat, A., and Hermjakob, H. (2020). ReactomeGSA - efficient multi-omics comparative pathway analysis. Mol. Cell. Proteomics 19 (12), 2115–2124. doi:10.1074/mcp.TIR120.002155
Gu, Z., Eils, R., and Schlesner, M. (2016). Complex heatmaps reveal patterns and correlations in multidimensional genomic data. Bioinformatics 32 (18), 2847–2849. doi:10.1093/bioinformatics/btw313
Hannum, G., Guinney, J., Zhao, L., Zhang, L., Hughes, G., Sadda, S., et al. (2013). Genome-wide methylation profiles reveal quantitative views of human aging rates. Mol. Cell 49 (2), 359–367. doi:10.1016/j.molcel.2012.10.016
Heenkenda, M. K., Malmstrom, A., Lysiak, M., Mudaisi, M., Bratthall, C., Milos, P., et al. (2019). Assessment of genetic and non-genetic risk factors for venous thromboembolism in glioblastoma - the predictive significance of B blood group. Thromb. Res. 183, 136–142. doi:10.1016/j.thromres.2019.10.009
Horvath, S., and Ritz, B. R. (2015). Increased epigenetic age and granulocyte counts in the blood of Parkinson's disease patients. Aging (Albany NY) 7 (12), 1130–1142. doi:10.18632/aging.100859
Horvath, S. (2013). DNA methylation age of human tissues and cell types. Genome Biol. 14 (10), R115. doi:10.1186/gb-2013-14-10-r115
Johnson, K. C., Anderson, K. J., Courtois, E. T., Gujar, A. D., Barthel, F. P., Varn, F. S., et al. (2021). Single-cell multimodal glioma analyses identify epigenetic regulators of cellular plasticity and environmental stress response. Nat. Genet. 53 (10), 1456–1468. doi:10.1038/s41588-021-00926-8
Klughammer, J., Kiesel, B., Roetzer, T., Fortelny, N., Nemc, A., Nenning, K. H., et al. (2018). The DNA methylation landscape of glioblastoma disease progression shows extensive heterogeneity in time and space. Nat. Med. 24 (10), 1611–1624. doi:10.1038/s41591-018-0156-x
Lee, J. H., Lee, J. E., Kahng, J. Y., Kim, S. H., Park, J. S., Yoon, S. J., et al. (2018). Human glioblastoma arises from subventricular zone cells with low-level driver mutations. Nature 560 (7717), 243–247. doi:10.1038/s41586-018-0389-3
Lee, Y., Lee, J. K., Ahn, S. H., Lee, J., and Nam, D. H. (2016). WNT signaling in glioblastoma and therapeutic opportunities. Lab. Invest. 96 (2), 137–150. doi:10.1038/labinvest.2015.140
Levine, M. E., Lu, A. T., Bennett, D. A., and Horvath, S. (2015). Epigenetic age of the pre-frontal cortex is associated with neuritic plaques, amyloid load, and Alzheimer's disease related cognitive functioning. Aging (Albany NY) 7 (12), 1198–1211. doi:10.18632/aging.100864
Levine, M. E., Lu, A. T., Quach, A., Chen, B. H., Assimes, T. L., Bandinelli, S., et al. (2018). An epigenetic biomarker of aging for lifespan and healthspan. Aging (Albany NY) 10 (4), 573–591. doi:10.18632/aging.101414
Li, Y., Ge, D., and Lu, C. (2019). The SMART App: an interactive web application for comprehensive DNA methylation analysis and visualization. Epigenetics Chromatin 12 (1), 71. doi:10.1186/s13072-019-0316-3
Liao, P., Ostrom, Q. T., Stetson, L., and Barnholtz-Sloan, J. S. (2018). Models of epigenetic age capture patterns of DNA methylation in glioma associated with molecular subtype, survival, and recurrence. Neuro. Oncol. 20 (7), 942–953. doi:10.1093/neuonc/noy003
Lin, Q., and Wagner, W. (2015). Epigenetic aging signatures are coherently modified in cancer. PLoS Genet. 11 (6), e1005334. doi:10.1371/journal.pgen.1005334
Louis, D. N., Perry, A., Reifenberger, G., von Deimling, A., Figarella-Branger, D., Cavenee, W. K., et al. (2016). The 2016 world health organization classification of tumors of the central nervous system: a summary. Acta Neuropathol. 131 (6), 803–820. doi:10.1007/s00401-016-1545-1
Lu, A. T., Quach, A., Wilson, J. G., Reiner, A. P., Aviv, A., Raj, K., et al. (2019). DNA methylation GrimAge strongly predicts lifespan and healthspan. Aging (Albany NY) 11 (2), 303–327. doi:10.18632/aging.101684
Lysiak, M. (2022). Biomarkers in brain tumors with focus on glioblastoma. PhD dissertation. Linköping University Electronic Press.
Ma, J., Hou, X., Li, M., Ren, H., Fang, S., Wang, X., et al. (2015). Genome-wide methylation profiling reveals new biomarkers for prognosis prediction of glioblastoma. J. Cancer Res. Ther. 11 (2), C212–C215. doi:10.4103/0973-1482.168188
Malmstrom, A., Gronberg, B. H., Marosi, C., Stupp, R., Frappaz, D., Schultz, H., et al. (2012). Temozolomide versus standard 6-week radiotherapy versus hypofractionated radiotherapy in patients older than 60 years with glioblastoma: the nordic randomised, phase 3 trial. Lancet. Oncol. 13 (9), 916–926. doi:10.1016/S1470-2045(12)70265-6
Malmstrom, A., Lysiak, M., Kristensen, B. W., Hovey, E., Henriksson, R., and Soderkvist, P. (2020). Do we really know who has an MGMT methylated glioma? Results of an international survey regarding use of MGMT analyses for glioma. Neurooncol. Pract. 7 (1), 68–76. doi:10.1093/nop/npz039
Malta, T. M., de Souza, C. F., Sabedot, T. S., Silva, T. C., Mosella, M. S., Kalkanis, S. N., et al. (2018). Glioma CpG island methylator phenotype (G-CIMP): biological and clinical implications. Neuro. Oncol. 20 (5), 608–620. doi:10.1093/neuonc/nox183
Molinaro, A. M., Taylor, J. W., Wiencke, J. K., and Wrensch, M. R. (2019). Genetic and molecular epidemiology of adult diffuse glioma. Nat. Rev. Neurol. 15, 405–417. doi:10.1038/s41582-019-0220-2
Noushmehr, H., Weisenberger, D. J., Diefes, K., Phillips, H. S., Pujara, K., Berman, B. P., et al. (2010). Identification of a CpG island methylator phenotype that defines a distinct subgroup of glioma. Cancer Cell 17 (5), 510–522. doi:10.1016/j.ccr.2010.03.017
Ostrom, Q. T., Gittleman, H., Truitt, G., Boscia, A., Kruchko, C., and Barnholtz-Sloan, J. S. (2018). CBTRUS statistical report: primary brain and other central nervous system tumors diagnosed in the United States in 2011-2015. Neuro. Oncol. 20 (4), iv1–iv86. doi:10.1093/neuonc/noy131
Pagès, H., Carlson, M., Falcon, S., and Li, N. (2021). AnnotationDbi: Manipulation of SQLite-based annotations in bioconductor. R package version 1.56.1.
Paradis, E., and Schliep, K. (2019). ape 5.0: an environment for modern phylogenetics and evolutionary analyses in R. Bioinformatics 35 (3), 526–528. doi:10.1093/bioinformatics/bty633
Perna, L., Zhang, Y., Mons, U., Holleczek, B., Saum, K. U., and Brenner, H. (2016). Epigenetic age acceleration predicts cancer, cardiovascular, and all-cause mortality in a German case cohort. Clin. Epigenetics 8, 64. doi:10.1186/s13148-016-0228-z
R Core Team (2021). A language and environment for statistical computing. Vienna, Austria: R Foundation for Statistical Computing.
Shinawi, T., Hill, V. K., Krex, D., Schackert, G., Gentle, D., Morris, M. R., et al. (2013). DNA methylation profiles of long- and short-term glioblastoma survivors. Epigenetics 8 (2), 149–156. doi:10.4161/epi.23398
Sousa, K. M., Villaescusa, J. C., Cajanek, L., Ondr, J. K., Castelo-Branco, G., Hofstra, W., et al. (2010). Wnt2 regulates progenitor proliferation in the developing ventral midbrain. J. Biol. Chem. 285 (10), 7246–7253. doi:10.1074/jbc.M109.079822
Stupp, R., Hegi, M. E., Gilbert, M. R., and Chakravarti, A. (2007). Chemoradiotherapy in malignant glioma: standard of care and future directions. J. Clin. Oncol. 25 (26), 4127–4136. doi:10.1200/JCO.2007.11.8554
Stupp, R., Mason, W. P., van den Bent, M. J., Weller, M., Fisher, B., Taphoorn, M. J., et al. (2005). Radiotherapy plus concomitant and adjuvant temozolomide for glioblastoma. N. Engl. J. Med. 352 (10), 987–996. doi:10.1056/NEJMoa043330
Stupp, R., Taillibert, S., Kanner, A., Read, W., Steinberg, D., Lhermitte, B., et al. (2017). Effect of tumor-treating fields plus maintenance temozolomide vs maintenance temozolomide alone on survival in patients with glioblastoma: a randomized clinical trial. JAMA 318 (23), 2306–2316. doi:10.1001/jama.2017.18718
Tesileanu, C. M. S., van den Bent, M. J., Sanson, M., Wick, W., Brandes, A. A., Clement, P. M., et al. (2021). Prognostic significance of genome-wide DNA methylation profiles within the randomized, phase 3, EORTC CATNON trial on non-1p/19q deleted anaplastic glioma. Neuro. Oncol. 23 (9), 1547–1559. doi:10.1093/neuonc/noab088
Tian, Y., Morris, T. J., Webster, A. P., Yang, Z., Beck, S., Feber, A., et al. (2017). ChAMP: updated methylation analysis pipeline for Illumina BeadChips. Bioinformatics 33 (24), 3982–3984. doi:10.1093/bioinformatics/btx513
Uka, R., Britschgi, C., Krattli, A., Matter, C., Mihic, D., Okoniewski, M. J., et al. (2020). Temporal activation of WNT/β-catenin signaling is sufficient to inhibit SOX10 expression and block melanoma growth. Oncogene 39 (20), 4132–4154. doi:10.1038/s41388-020-1267-7
Venkataramani, V., Tanev, D. I., Strahle, C., Studier-Fischer, A., Fankhauser, L., Kessler, T., et al. (2019). Glutamatergic synaptic input to glioma cells drives brain tumour progression. Nature 573 (7775), 532–538. doi:10.1038/s41586-019-1564-x
Venkatesh, H. S., Morishita, W., Geraghty, A. C., Silverbush, D., Gillespie, S. M., Arzt, M., et al. (2019). Electrical and synaptic integration of glioma into neural circuits. Nature 573 (7775), 539–545. doi:10.1038/s41586-019-1563-y
Weller, M., van den Bent, M., Preusser, M., Le Rhun, E., Tonn, J. C., Minniti, G., et al. (2020). EANO guidelines on the diagnosis and treatment of diffuse gliomas of adulthood. Nat. Rev. Clin. Oncol. 18, 170–186. doi:10.1038/s41571-020-00447-z
Weller, M., van den Bent, M., Preusser, M., Le Rhun, E., Tonn, J. C., Minniti, G., et al. (2021). EANO guidelines on the diagnosis and treatment of diffuse gliomas of adulthood. Nat. Rev. Clin. Oncol. 18 (3), 170–186. doi:10.1038/s41571-020-00447-z
Wenger, A., Ferreyra Vega, S., Kling, T., Bontell, T. O., Jakola, A. S., and Caren, H. (2019). Intratumor DNA methylation heterogeneity in glioblastoma: implications for DNA methylation-based classification. Neuro. Oncol. 21 (5), 616–627. doi:10.1093/neuonc/noz011
Wickham, H. (2016). ggplot2: elegant graphics for data analysis. New York: Springer-Verlag. ISBN 978-3-319-24277-4.
Wu, T., Hu, E., Xu, S., Chen, M., Guo, P., Dai, Z., et al. (2021). clusterProfiler 4.0: a universal enrichment tool for interpreting omics data. Innov. (N Y). 2 (3), 100141. doi:10.1016/j.xinn.2021.100141
Wu, Y., Fletcher, M., Gu, Z., Wang, Q., Costa, B., Bertoni, A., et al. (2020). Glioblastoma epigenome profiling identifies SOX10 as a master regulator of molecular tumour subtype. Nat. Commun. 11 (1), 6434. doi:10.1038/s41467-020-20225-w
Yust-Katz, S., Mandel, J. J., Wu, J., Yuan, Y., Webre, C., Pawar, T. A., et al. (2015). Venous thromboembolism (VTE) and glioblastoma. J. Neurooncol. 124 (1), 87–94. doi:10.1007/s11060-015-1805-2
Zhan, T., Rindtorff, N., and Boutros, M. (2017). Wnt signaling in cancer. Oncogene 36 (11), 1461–1473. doi:10.1038/onc.2016.304
Keywords: glioblastoma, methylation, long-term survival, short-term survival, temozolomide, radiotherapy, epigenetic age
Citation: Łysiak M, Das J, Malmström A and Söderkvist P (2022) Methylation associated with long- or short-term survival in glioblastoma patients from the Nordic phase 3 trial. Front. Genet. 13:934519. doi: 10.3389/fgene.2022.934519
Received: 02 May 2022; Accepted: 18 July 2022;
Published: 25 August 2022.
Edited by:
Pawel Buczkowicz, PhenoTips, CanadaReviewed by:
Travis Steele Johnson, Indiana University Bloomington, United StatesCopyright © 2022 Łysiak, Das, Malmström and Söderkvist. This is an open-access article distributed under the terms of the Creative Commons Attribution License (CC BY). The use, distribution or reproduction in other forums is permitted, provided the original author(s) and the copyright owner(s) are credited and that the original publication in this journal is cited, in accordance with accepted academic practice. No use, distribution or reproduction is permitted which does not comply with these terms.
*Correspondence: Małgorzata Łysiak, bWFsZ29yemF0YS5seXNpYWtAbGl1LnNl; Peter Söderkvist, cGV0ZXIuc29kZXJrdmlzdEBsaXUuc2U=
†These authors share last authorship
Disclaimer: All claims expressed in this article are solely those of the authors and do not necessarily represent those of their affiliated organizations, or those of the publisher, the editors and the reviewers. Any product that may be evaluated in this article or claim that may be made by its manufacturer is not guaranteed or endorsed by the publisher.
Research integrity at Frontiers
Learn more about the work of our research integrity team to safeguard the quality of each article we publish.