 Sangjun Lee
 Han-Kwang Yang4
 Sue K. Park
94% of researchers rate our articles as excellent or good
Learn more about the work of our research integrity team to safeguard the quality of each article we publish.
Find out more
SYSTEMATIC REVIEW article
Front. Genet., 16 August 2022
Sec. Pharmacogenetics and Pharmacogenomics
Volume 13 - 2022 | https://doi.org/10.3389/fgene.2022.928783
This article is part of the Research TopicMolecular Targets for Anti-Cancer Drug Discovery and DevelopmentView all 5 articles
Objective: Despite being a powerful tool to identify novel variants, genome-wide association studies (GWAS) are not sufficient to explain the biological function of variants. In this study, we aimed to elucidate at the gene level the biological mechanisms involved in gastric cancer (GC) development and to identify candidate drug target genes.
Materials and methods: We conducted a systematic review for GWAS on GC following the PRISMA guidelines. Single nucleotide polymorphism (SNP)-level meta-analysis and gene-based analysis (GBA) were performed to identify SNPs and genes significantly associated with GC. Expression quantitative trait loci (eQTL), disease network, pathway enrichment, gene ontology, gene-drug, and chemical interaction analyses were conducted to elucidate the function of the genes identified by GBA.
Results: A review of GWAS on GC identified 226 SNPs located in 91 genes. In the comprehensive GBA, 44 genes associated with GC were identified, among which 12 genes (THBS3, GBAP1, KRTCAP2, TRIM46, HCN3, MUC1, DAP3, EFNA1, MTX1, PRKAA1, PSCA, and ABO) were eQTL. Using disease network and pathway analyses, we identified that PRKAA, THBS3, and EFNA1 were significantly associated with the PI3K-Alt-mTOR-signaling pathway, which is involved in various oncogenic processes, and that MUC1 acts as a regulator in both the PI3K-Alt-mTOR and P53 signaling pathways. Furthermore, RPKAA1 had the highest number of interactions with drugs and chemicals.
Conclusion: Our study suggests that PRKAA1, a gene in the PI3K-Alt-mTOR-signaling pathway, could be a potential target gene for drug development associated with GC in the future.
Systematic Review Registration: website, identifier registration number.
Gastric cancer (GC) was the cancer with the fifth-highest worldwide incidence in 2020, with 1,089,103 new cases (Sung et al., 2021). The incidence of GC is highly variable depending on the region and culture, with the highest incidence rates in Eastern Asia, Europe, and South America (Sung et al., 2021). In Eastern Asia, the average incidence of GC is 32.5 per 100,000 among males and 13.2 among females. On the contrary, in North America, the overall incidence among males and females is 5.4 and 3.1 per 100,000, respectively. The lowest incidence is in regions of Middle Africa, where only 4.6 per 100,000 males and 3.8 per 100,000 females are diagnosed annually. (Sung et al., 2021).
The sequencing and bioinformatic advances in the past decade have permitted genome-wide association studies (GWAS) to become an innovative tool for identifying new single nucleotide polymorphisms (SNPs) or genes for cancer susceptibility (Wang et al., 2005). GWAS explore the associations between a large number of SNPs and traits such as major diseases, thereby investigating the entire genome with an unbiased approach (Manolio, 2010). Previous GWAS and meta-analyses have identified several genetic variants that are associated with GC susceptibility (Mocellin et al., 2015; Jin et al., 2020; Yan et al., 2020). However, no systematic reviews have evaluated the genetic factors associated with GC using gene-based meta-analyses or gene-network analyses.
Despite GWAS being powerful tools for the identification of novel variants associated with a certain trait, they may not capture the entire signal due to a lack of power, and their results may be biased due to population stratification or locus heterogeneity (Luo et al., 2010). In addition, as the identified variants may be non-pathogenic variants in linkage disequilibrium (LD) with the actual causal variants, follow-up studies are necessary to confirm the functional effects of the identified signal (Stadler et al., 2010).
Gene-based analysis (GBA) has recently been suggested as an approach to overcome the limitations of GWAS. GBA can detect regions that display allelic heterogeneity and identify modest genetic effects by improving statistical power by combining single variants obtained from individual GWAS (Liu et al., 2010; Huang et al., 2011). Another approach to overcome the limitations of GWAS is expression quantitative trait loci (eQTL) analysis. This method permits the functional interpretation of GWAS markers by linking them to changes in gene expression (Nica and Dermitzakis, 2013). Furthermore, pathway and Gene Ontology (GO) enrichment analyses of the identified variants can inform about the biological function of the identified variants at the gene level (Gene Ontology Consortium, 2015; Slenter et al., 2018). Finally, as genes associated with a specific disease can be pleiotropic, meaning that they can be associated with other diseases or phenotypes (Solovieff et al., 2013). Disease interaction analysis has also been conducted to identify shared pathological pathways (Piñero et al., 2020). Using a combination of these approaches, studying genetic variants and their functions in disease can ultimately be used to identify novel drug targets or biomarkers (Wheeler et al., 2013).
The purpose of this study was to identify potential genes for drug development associated with GC based on a comprehensive understanding of the biological mechanisms of GC-associated genes by systematically reviewing published GWAS for GC and performing gene-level functional analyses, including drug/chemical interactions, through GBA.
Our study conducted a systematic review according to the Preferred Reporting Items for Systematic Reviews and Meta-Analysis (PRISMA) guidelines (Supplementary Table S1). (Page et al., 2021) The inclusion criteria based on the Population, Intervention, Comparison, Outcome, Study design (PICOS) model were as follows (Richardson et al., 1995): 1) Population: Human patients with gastric cancer; 2) Intervention (Exposure): Genetic variants (SNPs); 3) Comparison: Control group with unaffected risk alleles; 4) Outcome: Genotyping profiles of patients with gastric cancer; 5) Study design: case-control, GWAS. We excluded all studies that were not published in English and did not perform the GWAS analysis. In addition, studies in which the GWAS analysis was repeated with the same population were also excluded. An overall identification of eligible studies on the literature search was presented in the PRISMA2020 flow diagram (Supplementary Figure S1) (Haddaway et al., 2022).
To retrieve potentially eligible studies from PubMed and Embase, combinations of search queries were used (Supplementary Table S2). A PubMed search was conducted using “RISmed” R package, whereas Embase search was conducted in online search (https://www.embase.com/search/quick, assessed on 20 March 2021) (Kovalchik, 2014). In addition, a detailed search of several publicly available GWAS databases (registers) was conducted: the Human Genome Epidemiology (HuGE) Navigator (https://phgkb.cdc.gov/PHGKB/hNHome.action), the Genome-Wide Repository of Associations between SNPs and Phenotypes (GRASP) (https://grasp.nhlbi.nih.gov/Search.aspx), the National Human Genome Research Institute (NHGRI GWAS Catalog) (https://www.ebi.ac.uk/gwas/), and the GWAS Central (https://www.gwascentral.org/). All GWAS databases (registers) were assessed on 20 March 2021. We only included articles for which the full text was published on or before 31 December 2020. The identification of all studies was performed by two independent researchers. The two independent researchers independently extracted data on the first author’s name, publication year, study design, location of the study, ethnicity of the participants, number of cases/controls, SNPs investigated, chromosome, candidate genes, genotyping platform used, cancer type/location, measure of association with corresponding to 95% confidence interval (CI), and p-value obtained from the combined sample sets.
Non-Randomised Studies of Interventions (ROBINS-I) tool was used to assess the risk of bias (RoB) in non-randomized studies (Sterne et al., 2016). The instrument was developed to assess the internal validity of non-randomized trials by assessing the RoB within the seven domains: 1) Confounding bias, 2) Bias in the selection of study participants, 3) Bias in classification of intervention, 4) Bias due deviation from intended intervention, 5) Bias due to missing data, 6) Bias in measurement of outcome, and 7) Bias in the selection of reported results. The domain conclusion classified the overall body of evidence into “low”, “moderate”, “serious”, and “critical” categories. The results were also visualized by “robvis” Shiny (McGuinness and Higgins, 2021).
When the opinions of the two independent researchers differed, the four co-authors who are gastrointestinal surgery clinicians were consulted to resolve the dispute. We followed the principles proposed by the Human Genome Epidemiology Network (HuGeNet) for a systematic review of molecular association studies (Little et al., 2006).
A meta-analysis was performed to synthesize a total of 522 SNPs associated with GC that were included in 12 eligible studies as follows (Gurevitch et al., 2018):
1) The original values of the fixed-effect model were obtained when the reported SNPs in the individual study were validated several times.
2) The values of the fixed-effect model were estimated when external replication was possible because each SNP was reported only once in each different study.
3) The original odds ratios (ORs) (95% CI) or P-values for the single SNPs reported in the eligible studies were also obtained even though those of SNPs were excluded from the gene-based analysis.
4) When the same SNPs were reported from GC and its sub-types, the ORs (95% CI) or P-values reported for GC were used.
5) When the OR (95% CI) or P-value for the same SNP was estimated from multiple subtypes, the one with a lower P-value was used for the meta-analysis.
6) The OR (95% CI) and P-value were calculated based on the random-effect model. However, the values of the random-effect model could not be estimated when the OR was reported only once or when only the OR p-value was presented for each SNP.
ORs were calculated for each study and polymorphism assuming an additive genetic model. Heterogeneity in the meta-analysis was evaluated using I2 statistics (Higgins and Thompson, 2002). All statistical analyses were performed using the R software (version 4.1.0).
Gene-level association tests in the random-effects model were performed after weighting by minor-allele frequencies (MAFs) (Morgenthaler and Thilly, 2007). We combined information across several variants in a target region and then performed a burden test based on a single/meta-analysis for each SNP with LD structure based on the 1,000 Genome reference panel (Phase 3, East Asian). The burden test results were converted to gene-level estimates of effect sizes (betas) and their standard errors (Svishcheva et al., 2015). When multiple SNPs were in high LD (R2 > 0.9) in the same gene region, a burden test was performed with SNPs remaining after LD clumping. A Bonferroni correction for multiple testing was applied to account for the total number of genes tested (approximately 20,000 genes). Significant gene-level associations in the burden test were those with a p-value < 2.5 × 10⁻⁶ after correcting for multiple testing.
Overlapping eQTL analysis was performed to identify SNPs affecting a regulatory element controlling gene expression (Nica and Dermitzakis, 2013). The eQTL were identified based on the eQTLGen consortium, which is a large-scale multi-study effort to identify the downstream effects of trait-related variants via their effects on gene expression in whole blood (Võsa et al., 2018). eQTL analysis was also conducted based on the Genotype-Tissue Expression (GTEx) project, which aims to study tissue-specific gene expression and regulation (Carithers and Moore, 2015). We used individual-level data in stomach tissue from GTEx (v8) to construct the co-expression matrix and further validate the gene sets reported by eQTLGen.
We performed eQTL analysis based on SNP statistics (p-value) from the meta-analysis and burden test using Functional Mapping and Annotation of Genome-Wide Association Studies (FUMA) online software (https://fuma.ctglab.nl/) (Watanabe et al., 2017). Significant eQTL with a False Discovery Rate (FDR) ≤ 0.05 were selected for further analysis. Gene annotation was performed based on the Genome Reference Consortium Human Genome Build 37 or hg19 reference assembly.
The disease network analysis was used to identify candidate genes for GC from a burden test using DisGeNET (Piñero et al., 2020). DisGeNET is a discovery platform that contains one of the largest publicly available collections of genes and variants associated with humans. An FDR-corrected p-value of <0.05 was used to identify significant disease networks.
To identify pathways associated with GC, we used statistical results from the WikiPathway Human Collection (http://wikipathways.org) (Slenter et al., 2018) and the Network Data Exchange (NDEx) (https://www.ndexbio.org/) (Pratt et al., 2015). The WikiPathway is a collaborative open database that includes knowledge of curated biological pathways. In addition, the NDEx database provides access to not only pathways but also diverse types of network models, offering digital object identifier (DOI) minting for citation. Pathways with an FDR <0.05, including at least one altered gene, were considered significant.
We performed GO analysis to annotate genes to known functional information sources (Gene Ontology Consortium, 2015), including biological process (BP), cellular component (CC), and molecular function (MF) using the “clusterProfilter” R package (Yu et al., 2012). We submitted genes significantly estimated from the burden test and were considered significant for GO results with an FDR <0.05.
We studied gene-drug interactions using the DrugBank database (https://go.drugbank.com/) and the DGIdb database (http://www.dgidb.org/) (Wishart et al., 2018; Freshour et al., 2021). DrugBank is a drug-centric online database that provides detailed information about over 500,000 drugs and their target genes. DGIdb comprises drug-gene interaction information of more than 40,000 genes and 10,000 drugs from 15 different resources and allows filtering at different levels. Only gene-drug interactions in which the drug was found in two or more references or databases were selected.
The Comparative Toxicogenomics Database (CTD) (http://ctdbase.org/) was employed to construct a gene-chemical interaction network (Davis et al., 2021). The CTD includes toxicological information for over 16,000 chemicals and 50,000 genes. Only gene-chemical interactions with two or more references were selected.
The Search Tool for the Retrieval of Interacting Genes (STRING; http://string.embl.de/) is a biological database designed to construct a PPI network by analyzing the functional interactions between proteins (Szklarczyk et al., 2021). Using STRING, PPIs were constructed with a confidence score ≥0.99 (Asadzadeh-Aghdaee et al., 2016). Subsequently, the PPI network was visualized using the Cytoscape software (version 3.8.2) (Shannon et al., 2003) via Rcy3 (Gustavsen et al., 2019).
We identified 3,251 and 90 eligible studies through PubMed and Embase, respectively (Supplementary Figure S1). In addition, 906, 123, 46, and 14 eligible studies were also identified through the HUGE Navigator, GRASP, GWAS Catalog, and GWAS Central, respectively (Supplementary Figure S1). Subsequently, 230 duplicated studies and two studies that were written in other languages were removed. After title and abstract screening, 348 full text articles were assessed for further eligibility. A total of 333 studies were excluded for not conducting GWAS, and three full text articles were excluded for repeating the analyses in the same population. The remaining 12 GWAS for GC, including duplicated 522 SNPs, were included in the meta-analysis (Supplementary Figures S1, S2) (Sakamoto et al., 2008; Abnet et al., 2010; Shi et al., 2011; Jin et al., 2012; Tanikawa et al., 2012; Helgason et al., 2015; Hu et al., 2016; Wang et al., 2017; Tanikawa et al., 2018; Park et al., 2019; Du et al., 2020; Rashkin et al., 2020). Among the selected studies, ten were conducted in Asia (China, Japan, Korea, and Singapore), and two were performed in Europe and North America. The studies were published between 2008 and 2020. The present study was approved by the respective institutional ethics review committee, and informed consent was obtained from all participants.
Of the total of 12 studies, ten of which focused on Asians (Korea, China, Japan, Singapore) (Sakamoto et al., 2008; Abnet et al., 2010; Shi et al., 2011; Jin et al., 2012; Tanikawa et al., 2012; Hu et al., 2016; Wang et al., 2017; Tanikawa et al., 2018; Park et al., 2019; Du et al., 2020), one in Europe (Helgason et al., 2015), and the other in the United States/United Kingdom (Rashkin et al., 2020). 12 studies in all were adjusted for age and sex or additional covariates such as principal components. Three studies presented the results of the diffuse and intestinal subtypes (Sakamoto et al., 2008; Tanikawa et al., 2012; Tanikawa et al., 2018), while five studies revealed the results of cardia or non-cardia subtypes (Abnet et al., 2010; Shi et al., 2011; Jin et al., 2012; Hu et al., 2016; Wang et al., 2017). Furthermore, two studies presented findings associated with adenocarcinoma (Abnet et al., 2010; Helgason et al., 2015). Other studies without subtype analysis have reported GC results.
The assessment of RoB for observational studies was shown in Supplementary Table S3 and Supplementary Figure S3. Based on the ROBINS-I tool, 4 studies were identified as “low risk”, 6 studies were assessed as “moderate risk” studies, while 2 studies were considered as “Serious risk”. The p-value of each SNP reported prior to data synthesis in one of the two severe risk studies was not genome-wide significant (5 × 10⁻⁸) (Sakamoto et al., 2008), and some of the SNP annotations and effect sizes were not presented in another study (Jin et al., 2012). It is believed that there may be limitations because this GWAS study is in its early days. GWAS generally adjusts for age and sex, but if there is heterogeneity in the population, the principal component is additionally adjusted (McCaw et al., 2022). However, in our eligible studies, validation analysis was also performed with the same ethnicity, so there seems to be little bias due to the confounder. According to our assessment of the certainty of the evidence, the body of evidence supporting an association between SNPs and elevated risk of GC had “moderate degree of evidence”.
A total of 552 SNPs were identified from the eligible studies based on literature search (Supplementary Table S4). 522 SNPs were located in upstream (n = 5), downstream (n = 9), intronic (n = 207), exonic (n = 28), noncoding RNA (ncRNA) intronic (n = 10), ncRNA exonic (n = 8), 5′-UTR (n = 15), 3′-UTR (n = 38), and intergenic (n = 202) regions (Figure 1; Supplementary Table S4). Some of the SNPs were associated specifically with histological subtypes (intestinal; n = 12, diffuse; n = 24), site (cardia; n = 36, non-cardia; n = 98), onset age (early; n = 6, late; n = 6), and pathological subtype (adenocarcinoma; n = 17) (Figure 1; Supplementary Table S4). Out of 522 SNPs, 296 SNPs were reported in the multiple studies or overlapped results from subtypes were excluded (Supplementary Table S5). Therefore, a total of 226 SNPs remained in the meta-analysis based on both the fixed- and random-effect models (Supplementary Table S6). In many cases, 25%–49%, 50%–74%, and over 75% of I2 suggest low, intermediate, and high heterogeneity, respectively (Higgins et al., 2003). Among 226 SNPs, 41 SNPs had no heterogeneity. On the other hand, 24, 71, and 53 SNPs had low, intermediate, and high heterogeneity, respectively. The heterogeneity of 37 SNPs was not evaluated due to without validation (Supplementary Table S6).
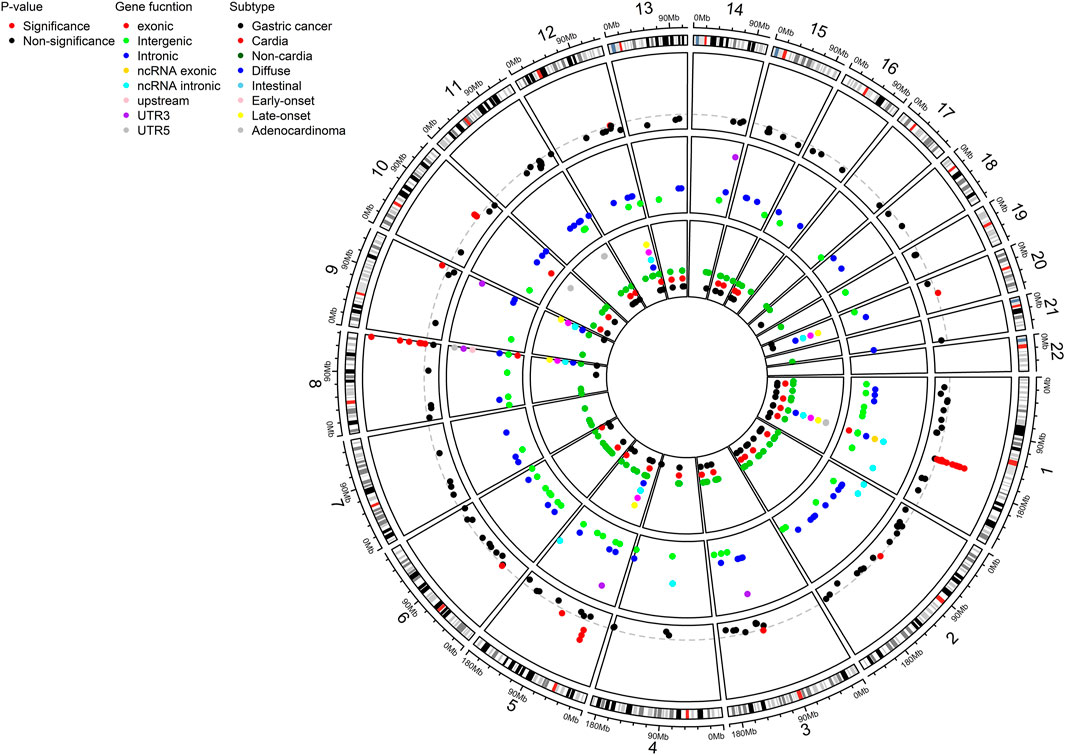
FIGURE 1. Circos plot showing a total of 226 distinct SNPs for gastric cancer susceptibility as a result of systematic review and meta-analysis. SNPs were shown by P-value (significant threshold: 5 × 10⁻⁸), genetic function, and subtypes. SNP, single nucleotide polymorphism; UTR, untranslated region.
Since a gene’s effect size is estimated based on the effect size of several SNPs located in the gene, 59 SNPs located in the intergenic position were excluded from the remaining 226 SNPs to perform the gene-based analysis. Therefore, 167 SNPs located in 91 genes were retained as candidates for gene-based analysis (Supplementary Figure S2). Among the 91 genes, 44 genes were included in the burden test after excluding genes that were specifically associated with a subgroup of GC or in a non-Asian population, genes whose effect size was estimated from a single distinct SNP, and genes not identified as entrez id (Supplementary Figure S2). Of the 44 genes, effect sizes for six genes and 38 genes were estimated by the burden test and the meta-analysis, respectively (Table 1). After correcting for multiple testing, 25 genes had significant gene-level associations with GC (p-value < 2.5 × 10⁻⁶).
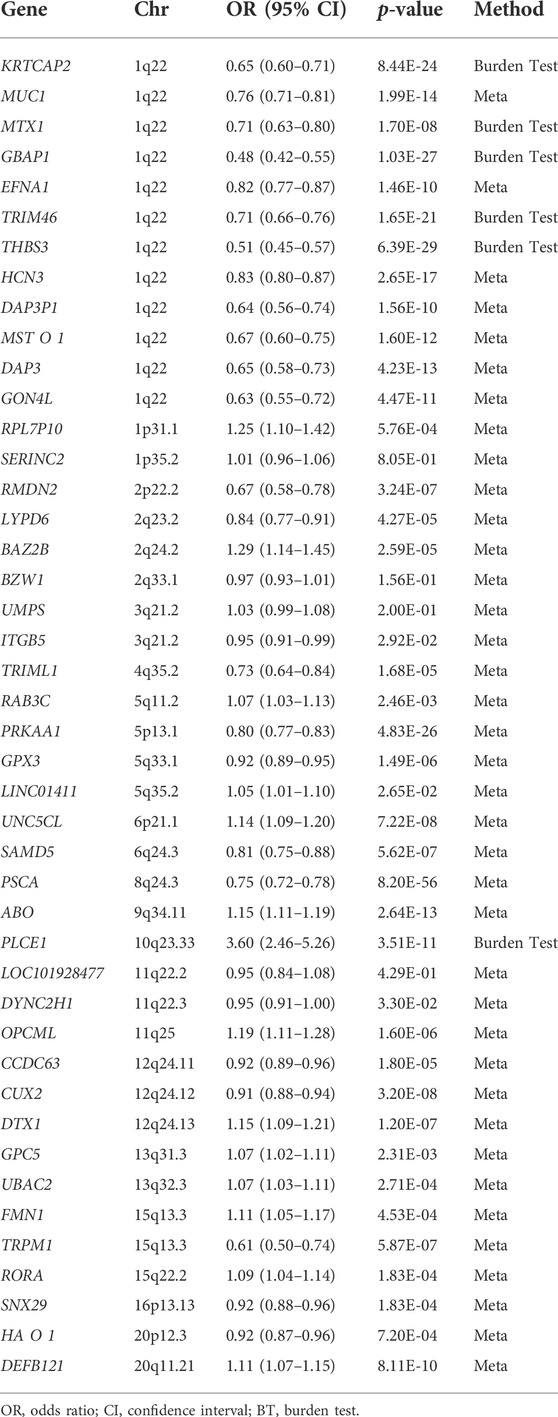
TABLE 1. The results of gene-based analysis for gastric cancer.
eQTL analysis was performed based on 226 SNPs with statistics (p-value) after the meta-analysis. The eQTL analysis results were represented in SNP-gene pairs since the SNPs have a role in gene expression regulation. Furthermore, since one SNP can affect the expression level of multiple genes, the results of eQTL analysis were calculated in pairs.
Forty-seven SNPs out of the 226 SNPs in the meta-analysis were identified to regulate the expression of 12 genes (THBS3, GBAP1, KRTCAP2, TRIM46, HCN3, MUC1, DAP3, EFNA1, MTX1, PRKAA1, PSCA, and ABO) out of the 25 genes significantly estimated from the burden tests, resulting in a total of 175 SNP-gene pairs (Supplementary Table S7). In PRKAA1, PSCA, and ABO, the SNPs located in the corresponding gene regulated the expression of their respective (Supplementary Figure S4). Three pairs (three SNPs-one gene) for PRKAA1, 26 pairs (26 SNPs-one gene) for PSCA, and one pair (one SNP-one gene) for ABO were estimated (Supplementary Figure S4). However, the expression level of nine genes (THBS3, GBAP1, KRTCAP2, TRIM46, HCN3, MUC1, DAP3, EFNA1, and MTX1) on chromosome 1 were regulated by 17 SNPs located nearby (Supplementary Figure S4; Supplementary Table S7). Among the 17 SNPs, 13 (rs1057941, rs12752585, rs2049805, rs28445596, rs2974929, rs2990220, rs4276914, rs4971059, rs4971085, rs4971088, rs4971100, rs4971101, and rs7556304) regulated the expression of 9 genes, yielding a total of 117 pairs. Three SNPs (rs2066981, rs3814316, and rs4971093) regulated the expression of eight genes, not including EFNA1, yielding 24 pairs. Finally, rs4971066 regulated the expression level of only four genes (GBAP1, THBS3, MTX1, and MUC1), establishing four pairs. In total, eQTL analysis yielded 175 SNP-gene pairs between 47 SNPs and 12 genes.
Cis-eQTL identification based on the eQTLGen database yielded a total of 120 significant (FDR ≤0.05) pairs between 21 SNPs and 11 genes (THBS3, GBAP1, KRTCAP2, TRIM46, HCN3, MUC1, DAP3, EFNA1, MTX1, PRKAA1, and ABO). In contrast, no trans-eQTL were found. eQTL refers to genetic variants involved in regulating gene expression (Võsa et al., 2021). eQTL is divided into cis-eQTL and trans-eQTL. SNPs regulating gene expression located near a gene (<1 megabase; Mb) with local effects are called cis-QTL, whereas SNPs located distally (>5 Mb) or on a different chromosome of a gene with remote effects are called trans-eQTLs (Westra and Franke, 2014). Because cis-eQTLs generally have large effect sizes (Huang da et al., 2009), even moderate sample size enables the detection of cis-eQTLs of thousands of genes (Westra et al., 2013). In addition, cis-eQTLs have a direct effect on gene expression due to their proximity to the transcription start site (TSS) (Stranger et al., 2012). On the other hand, since the effect size of trans-eQTLs is generally small, a larger sample size is required (Grundberg et al., 2012). Moreover, it is hard to identify validated reports to estimate the effect size for tans-eQTLs due to estimation difficulty (Westra et al., 2013). Nevertheless, since a trans-eQTL can affect multiple genes with small effect size and can have a wide range of effects in biological networks, it can be highly associated with a cross-phenotype (Brynedal et al., 2014; Westra and Franke, 2014).
Based on the GTEx-stomach database, 55 pairs between 42 SNPs and three genes (THBS3, GBAP1, and PSCA) were significant (FDR ≤0.05) (Supplementary Table S7). The results for THBS3 and GBAP1 were validated on both the eQTLGen and GTEx-stomach databases.
Of the 12 eQTL genes, 10 were associated with a total of 28 diseases according to the disease network analysis (Figure 2; Supplementary Figure S5). Among these diseases, 11 were associated with GC (Helicobacter pylori infections, infection caused by Helicobacter pylori, atrophic gastritis, duodenal ulcer, preneoplastic conditions, intestinal metaplasia, precancerous lesions, hereditary diffuse gastric cancer, malignant neoplasm of gastrointestinal tract, gastric adenocarcinoma, and precancerous conditions). In addition, three biomarkers of chronic kidney disease were identified (blood urea nitrogen, glomerular filtration rate, and uric acid). Five diseases associated with uric acid or inflammation (Gaucher disease, tarsal-carpal coalition syndrome, tuberous sclerosis, psoriatic arthritis, and inflammation) and two viral diseases were selected (Rubella and Epstein-Barr virus infection), and hemoglobin and hematocrit were also found in the disease network. Additionally, five other diseases associated with eQTL genes were identified (Supplementary Figure S5).
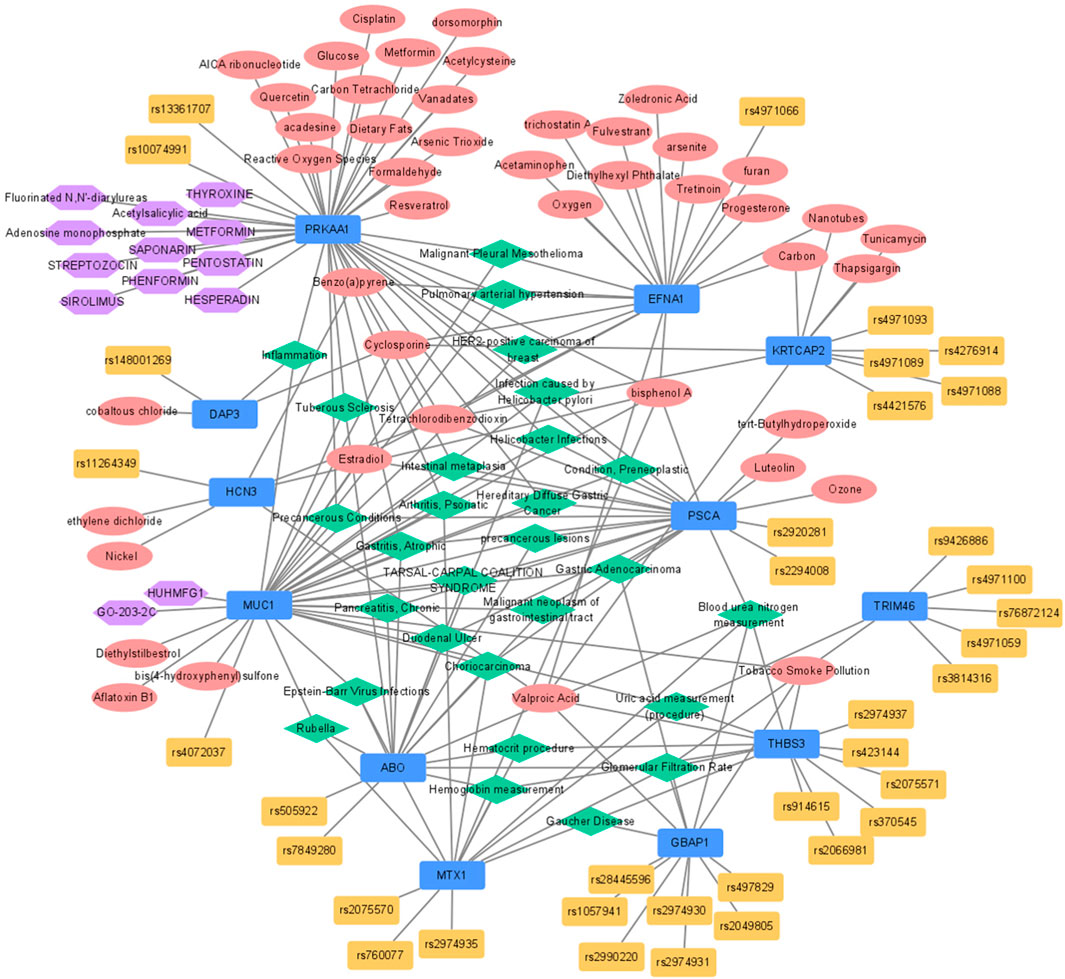
FIGURE 2. Functional network analysis for expression-regulated genes from eQTL identified by GBA. Blue, red, yellow, green, and purple nodes stood for genes, chemicals, SNPs included in GBA, disease-networks, and drugs, respectively. eQTL, expression quantitative trait loci; GBA, gene-based analysis; SNP, single nucleotide polymorphism.
A total of 18 pathways were significantly associated with 12 eQTL genes in Wikipathways (Figure 2; Supplementary Figure S5). Among these pathways, the PI3K-Alt-mTOR-signaling pathway containing three eQTL genes (THBS3, EFNA1, and PRKAA1) was the most significant (FDR = 5.99 × 10⁻⁴). PRKAA1 was associated with 13 pathways and was the gene that showed the strongest association among the 12 eQTL genes (FDR <0.05). According to the NDEx database, MUC1 was identified as a regulator of the PI3K-Alt-mTOR and p53 signaling pathways. Moreover, RAS drives the PI3K-Alt-mTOR-signaling pathway via PRKAA1, the adenosine monophosphate-activated kinase (AMPK) via the ERK pathway, and TP53 also interacts with RPKAA1 (AMPK). In addition, PPI network analysis showed that MUC1 interacted with EGFR (HER2-receptor), CTNNB1 (β-catenin), Src, and ICAM-1 (intracellular adhesion molecule)-1.
GO annotation analysis revealed the genetic signal was enriched in 9 MF and 24 BP terms (Supplementary Figure S5). The most significant MF and BP terms were glycoprotein-fucosylgalactoside alpha-N-acetylgalactosaminyl-transferase activity and positive regulation of peptidyl-lysine acetylation, respectively. In addition, glycosylation and AMPK-associated functions or processes were identified. Of the 12 eQTL genes, MUC1 and PRKAA1 were the ones that were most annotated to the enriched GO terms.
Gene-drug interactions were identified only for MUC1 and PRKAA1. PRKAA1 interacts with phenformin, metformin, hesperadin, sirolimus, streptozocin, thyroxine, pentostatin, saponarin, fluorinated N,N′-diarylureas, acetylsalicylic acid, and adenosine monophosphate. MUC1 interacted with Huhmfg1 and GO-203-2C (Figure 2).
Based on the CTD database, 66 gene-chemical interactions with 44 chemicals and ten genes were identified (Figure 2; Supplementary Figure S6). Of the ten genes, PRKAA1 and EFNA1 interacted with the largest number of chemicals (17). Oestradiol was six times reported to decrease the expression of EFNA1. AICA ribonucleotide and metformin were five times reported to increase the phosphorylation of PRKAA1. Furthermore, the expression of MUC1 was reported to be increased by the action of aflatoxin B1, oxygen, and valproic acid a total of four times.
In this review, we described the most reported genetic loci that are associated with the increased risk of GC from the available GWAS and conducted meta-analyses and GBA of the genetic variants with available genotypes. Comprehensive meta-analysis and GBA of genetic variants identified 25 significant genes for GC susceptibility. Among the 25 genes, 12 genes (THBS3, GBAP1, KRTCAP2, TRIM46, HCN3, MUC1, DAP3, EFNA1, MTX1, PRKAA1, PSCA, and ABO) were significant at the gene expression level according to eQTL analysis. To understand the function of these 12 genes, disease network analysis, biological pathway and GO enrichment analysis, and gene-drug and chemical interaction analyses were conducted.
PSCA encodes a glycosylphosphatidylinositol-anchored cell membrane glycoprotein. In addition to being highly expressed in the prostate, it is also expressed in the bladder, placenta, colon, kidney, and stomach. PSCA is the genetic locus most significantly associated with the risk of H. pylori-induced GC in the Japanese population, which is the case with regard to the European population as well (Rizzato et al., 2013). Moreover, in H. pylori-infected gastric mucosal tissue, PSCA expression was found to be remarkably suppressed compared to that in normal, non- H. pylori infected gastric mucosal tissue (Toyoshima et al., 2018). This can lead to a reduced risk of GC or an increased risk of duodenal ulcers (Tanikawa et al., 2012).
PRKAA1 belongs to the serine/threonine-protein kinase family. It is the catalytic subunit of AMPK, a cellular energy sensor conserved in all eukaryotic cells (Krishan et al., 2014). PRKAA1 is mainly involved in the PI3K-Alt-mTOR-signaling pathway via AMPK. The PI3K-Alt-mTOR-signaling pathway is a transduction hub linked to various biological pathways and mechanisms associated with carcinogenesis (Figure 3). AMPK negatively modulates mTOR, which plays an important role in regulating cellular energy homeostasis by regulating cellular processes such as protein synthesis and autophagy. mTOR signalling positively regulates cell proliferation and tumorigenesis in various cancers and is often aberrantly activated in cancer. In addition, the PI3K-Alt-mTOR-signaling pathway can influence glycosylation through nuclear factor kappa B (NF-κB), a protein complex that functions as a signal-induced transcription factor regulating proliferation and apoptosis (Magaway et al., 2019; Cho et al., 2021).
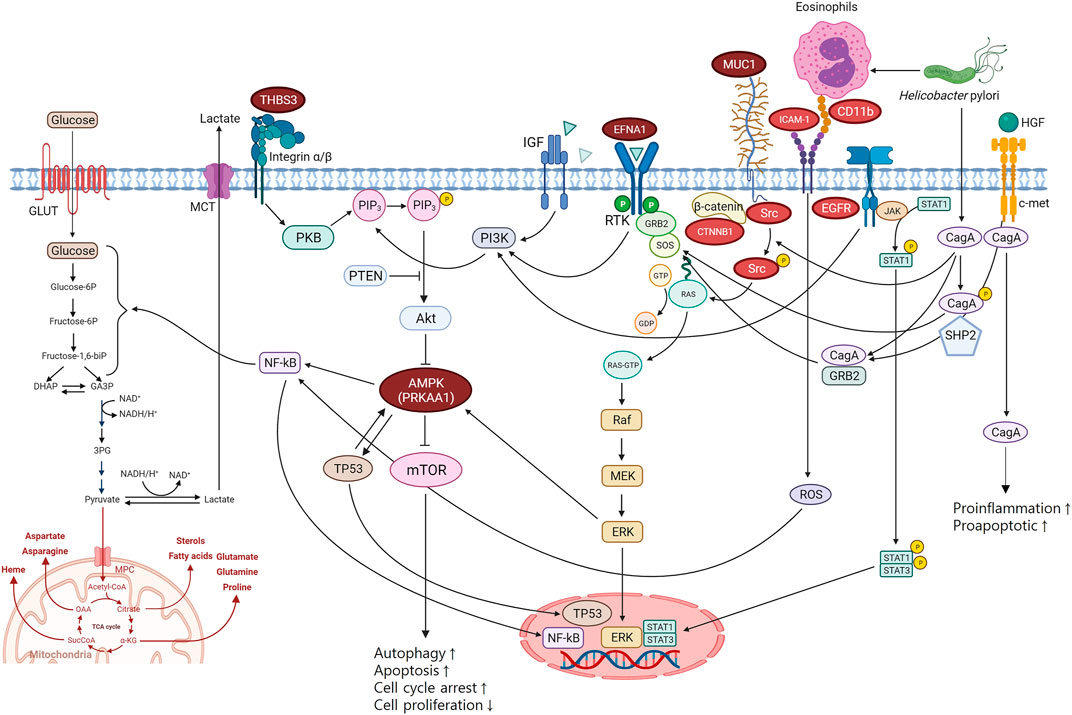
FIGURE 3. Biological pathways of gastric cancer mechanisms. THBS3, EFNA1, and PRKAA1 are involved in PI3K-Alt-mTOR-signaling pathway which is the key pathway associated with gastric cancer. MUC1 interacted with ICAM-1, CD11b, EGFR, Src, and CTNNB1 in PPI network is a regulator of the PI3K-Alt-mTOR-signaling pathway. PPI, protein-protein interaction.
The role of PRKAA1 was also confirmed by the GO annotation analysis results (Supplementary Figure S5). PRKKA1 was shown to be associated with affecting the molecular function of AMPK and involved in biological pathways, including glycolysis, PI3K-Akt-mTOR signaling, autophagy, cell cycle, and cell differentiation (Supplementary Figure S5). This confirms that PRKAA1 directly affects the molecular function of AMPK and has a role in its related pathways (Figure 3). In addition, PRKAA1 is also associated with the glucosylceramide process and mitochondrial regulation in biological processes. MUC1, a mucin linked to AMPK’s pathway, seems to be more involved in biological processes through the regulation of protein acetylation, cell adhesion by integrin, and glycosylation (Figure 3; Supplementary Figure S5).
Regarding gene-chemical interactions, 5-aminoimidazole-4-carboxamide (AICA) ribonucleotide is one of the most reported chemicals to phosphorylate PRKAA1 (Supplementary Figure S6) and is widely used as a pharmacological modulator of AMPK activity (Višnjić et al., 2021). In a previous experimental study, AICA ribonucleotide was also shown to induce apoptosis alone in GC cells with the aim of developing a chemotherapy sensitizer for GC (Wu et al., 2016).
Metformin,both as a chemical and drug, had the highest association with PRKAA1 (Figure 2; Supplementary Figure S5), and gene-chemical interaction results revealed that metformin phosphorylates PRKAA1. Metformin is one of the most widely used anti-hyperglycemic drugs for the management of type 2 diabetes. Experimental studies strongly suggest that metformin also possesses anticancer activity mediated through the modulation of several cellular signaling pathways, including AMPK activation and other mechanisms. In addition, metformin use has been associated with a reduced GC risk, where an increasing metformin dose was correlated with a lower GC risk (Kim et al., 2014; Cheung et al., 2019). Regarding gene-drug interactions, phenformin scored four, coming after metformin, which scored five (the score reflects the number of reports in previous studies). It has been reported that both phenformin and metformin can inhibit cell growth through inhibition of cell proliferation, promotion of apoptosis, and cell cycle disturbances (Wang et al., 2018).
EFNA1 is a growth factor that induces cell proliferation, differentiation, and survival by binding to receptor tyrosine kinase (RTK) in the cell membrane to generate Ras-GTP, which activates the mitogen-activated protein kinase (MAPK) pathway in the cytoplasm (Haglund et al., 2007). When extracellular signal-regulated kinase (ERK), an important factor in the MAPK pathway, is activated, the transcription of several genes is activated, thereby resulting in cell growth. RAS mutations lead to sustained activation of the ERK pathway, which leads to cancer development (Mitra et al., 1993; Seger and Krebs, 1995). In addition, ERK is linked to the PI3K-Alt-mTOR-signaling pathway by activating AMPK (Figure 3).
Thrombospondin 3 (THBS3) is an extracellular glycoprotein that mediates cell-to-matrix and cell-to-cell interactions (Mosher and Adams, 2012). THBS3 activates the PI3K-Alt-mTOR-signaling pathway via protein kinase B (PKB).
MUC1 is a single-pass type I transmembrane protein with a heavily glycosylated extracellular domain (Hattrup and Gendler, 2008; Nath and Mukherjee, 2014). MUC1 has been reported to act as an anti-inflammatory molecule in gastric mucosal cells. The anti-inflammatory properties of MUC1 have also been observed in gastric mucosal cell responses to H. pylori infection (Guang et al., 2010). In addition, MUC1 inhibits cell proliferation and regulates the PI3K-Alt-mTOR-signaling pathway through a β-catenin-dependent mechanism (Lillehoj et al., 2007).
H. pylori induces ICAM-1 and CD11b (integrin) expression, causing degranulation and eosinophil cationic protein (ECP) release (Chmiela et al., 2018). Activation of ICAM-1 by CD11b results in the release of reactive oxidative species, which stimulate NK-κB. In addition, an interaction between the H. pylori virulence factor CagA and the receptor c-Met has been found (Eom et al., 2016). CagA stimulates the MAPK/ERK pathway and PI3K-Alt-mTOR-signaling pathway by activating RAS by binding to the c-Met receptor (Churin et al., 2003; Suzuki et al., 2009). Moreover, binding between c-Met and hepatocyte growth factor (HUFF) also stimulates the MAPK/ERK, PI3K-Alt-mTOR-signaling, and JAK/STAT pathways (Jang et al., 2020). These mechanisms converge in inducing cell proliferation, pro-inflammatory response, and cell motility, which are involved in tumor development and progression (Figure 3) (Churin et al., 2003; Suzuki et al., 2009; Bradley et al., 2017).
Our study has some limitations. First, given that only the results of GWAS that have been published were selected, we cannot avoid the possibility of publication bias. In general, GWAS with significant associations are more likely to be published than studies with null associations (Stadler et al., 2010). Second, the SNPs generally reported in GWAS are the lead SNPs with the most significant p-value based on Bonferroni multiple tests after LD clumping. However, since lead SNPs are not always causal SNPs, fine-mapping analysis is necessary to investigate the region around the lead SNP to find the presence of other potential causal SNPs (Farh et al., 2015). The GWAS included in our study did not perform such follow-up analyses. Third, the heterogeneity between each GWAS, in terms of population origin, phenotype definition, genotyping platform, and software used can lead to biased results. Since the original data used in the individual GWAS were not available, taking into account sources of variability in the analysis was difficult. Furthermore, the results of GWAS for GC in Caucasians were not included in the GBA due to an insufficient number of SNPs or genes. In the future, the genetic burden of GC in Caucasians and the differences among ethnicities need to be further explored. Lastly, although the meta-analysis results based on the fixed- and random-effect models presented similar estimates for most SNPs, some of the SNPs that were reported only twice in previous studies yielded different estimates. Similarly, SNPs with different estimates between fixed- and random-effect model had high heterogeneity. Given that the random-effect model is more evenly weighted compared to the fixed-effect model (Hedges and Vevea, 1998), it is possible that the estimates of less-reported SNPs are more unstable. In addition, the p-value threshold of GWAS is generally 5 × 10⁻⁸ in discovery and less than 0.05 in validation (Risch and Merikangas, 1996; Oetting et al., 2017). Even if the SNPs were validated multiple times in a single study, the heterogeneity can be highly evaluated because the threshold of p-value in validation analysis is high. Thus, some SNPs still require a larger number of external validations to estimate the stable effect size of SNPs associated with GC.
Despite these limitations, our study had several strengths. First, we used a comprehensive and systematic approach to identify all possible GWAS in the literature. Second, the statistical power of our analysis was increased due to the large number of SNPs comprised in the meta-analysis. Moreover, compared to SNP-based GWAS, GBA is more robust in terms of statistical significance. By combining the SNPs of individual GWAS into a gene-based score without increasing the sample size or collecting new data, the statistical power is increased, resulting in a less stringent significance threshold (Liu et al., 2010). Therefore, our study highlights the possibilities that meta-analysis and GBA offer by reusing published summary statistics. Furthermore, functional annotation using disease network, biological pathway, GO, gene-drug, and chemical interaction analyses permitted a further understanding of the mechanisms of GC development.
Based on the comprehensive investigation and multifaceted functional analysis of the reported GC-associated genetic variants, we conclude that PRKAA1 is a key gene for GC development. Based on our results, PRKAA1, which is involved in the PI3K-Alt-mTOR-signaling pathway, could be a target gene for drug development associated with GC in the future.
The original contributions presented in the study are included in the article/Supplementary Material, further inquiries can be directed to the corresponding author.
SL and SP conceived and designed the study. SL performed the statistical analyses and wrote the manuscript. SL, H-KY, H-JL, DP, S-HK, and SP revised the manuscript. SP supervised the study. All authors reviewed the final version of the manuscript and approved the final submission.
This work was supported by the National Research Foundation of Korea (NRF) grant funded by the Korean government (MSIP) (No. NRF-2016R1A2B4014552) and the Korean Foundation for Cancer Research (No. CB-2013-01).
The authors declare that the research was conducted in the absence of any commercial or financial relationships that could be construed as a potential conflict of interest.
All claims expressed in this article are solely those of the authors and do not necessarily represent those of their affiliated organizations, or those of the publisher, the editors and the reviewers. Any product that may be evaluated in this article, or claim that may be made by its manufacturer, is not guaranteed or endorsed by the publisher.
The Supplementary Material for this article can be found online at: https://www.frontiersin.org/articles/10.3389/fgene.2022.928783/full#supplementary-material
Abnet, C. C., Freedman, N. D., Hu, N., Wang, Z., Yu, K., Shu, X. O., et al. (2010). A shared susceptibility locus in PLCE1 at 10q23 for gastric adenocarcinoma and esophageal squamous cell carcinoma. Nat. Genet. 42 (9), 764–767. doi:10.1038/ng.649
Asadzadeh-Aghdaee, H., Shahrokh, S., Norouzinia, M., Hosseini, M., Keramatinia, A., Jamalan, M., et al. (2016). Introduction of inflammatory bowel disease biomarkers panel using protein-protein interaction (PPI) network analysis. Gastroenterol. Hepatol. Bed Bench 9 (1), S8–s13.
Bradley, C. A., Salto-Tellez, M., Laurent-Puig, P., Bardelli, A., Rolfo, C., Tabernero, J., et al. (2017). Targeting c-MET in gastrointestinal tumours: rationale, opportunities and challenges. Nat. Rev. Clin. Oncol. 14 (9), 562–576. doi:10.1038/nrclinonc.2017.40
Brynedal, B., Raj, T., Stranger, B. E., Bjornson, R., Neale, B. M., Voight, B. F., et al. (2014). Cross-phenotype meta-analysis reveals large-scale trans-eQTLs mediating patterns of transcriptional co-regulation. arXiv preprint arXiv:1402.1728. doi:10.48550/arXiv.1402.1728
Carithers, L. J., and Moore, H. M. (2015). The genotype-tissue expression (GTEx) project. New Rochelle, NY 10801 USA: Mary Ann Liebert, Inc. 140 Huguenot Street, 3rd Floor.
Cheung, K. S., Chan, E. W., Wong, A. Y. S., Chen, L., Seto, W. K., Wong, I. C. K., et al. (2019). Metformin use and gastric cancer risk in diabetic patients after Helicobacter pylori eradication. J. Natl. Cancer Inst. 111 (5), 484–489. doi:10.1093/jnci/djy144
Chmiela, M., Walczak, N., and Rudnicka, K. (2018). Helicobacter pylori outer membrane vesicles involvement in the infection development and Helicobacter pylori-related diseases. J. Biomed. Sci. 25 (1), 78. doi:10.1186/s12929-018-0480-y
Cho, K., Lee, H. G., Piao, J. Y., Kim, S. J., Na, H. K., and Surh, Y. J. (2021). Protective effects of silibinin on Helicobacter pylori-induced gastritis: NF-κB and STAT3 as potential targets. J. Cancer Prev. 26 (2), 118–127. doi:10.15430/jcp.2021.26.2.118
Churin, Y., Al-Ghoul, L., Kepp, O., Meyer, T. F., Birchmeier, W., and Naumann, M. (2003). Helicobacter pylori CagA protein targets the c-Met receptor and enhances the motogenic response. J. Cell Biol. 161 (2), 249–255. doi:10.1083/jcb.200208039
Davis, A. P., Grondin, C. J., Johnson, R. J., Sciaky, D., Wiegers, J., Wiegers, T. C., et al. (2021). Comparative Toxicogenomics database (CTD): Update 2021. Nucleic Acids Res. 49 (D1), D1138–d1143. doi:10.1093/nar/gkaa891
Du, M., Zheng, R., Ma, G., Chu, H., Lu, J., Li, S., et al. (2020). Remote modulation of lncRNA GCLET by risk variant at 16p13 underlying genetic susceptibility to gastric cancer. Sci. Adv. 6 (21), eaay5525. doi:10.1126/sciadv.aay5525
Eom, S. Y., Hong, S. M., Yim, D. H., Kwon, H. J., Kim, D. H., Yun, H. Y., et al. (2016). Additive interactions between PRKAA1 polymorphisms and Helicobacter pylori CagA infection associated with gastric cancer risk in Koreans. Cancer Med. 5 (11), 3236–3335. doi:10.1002/cam4.926
Farh, K. K.-H., Marson, A., Zhu, J., Kleinewietfeld, M., Housley, W. J., Beik, S., et al. (2015). Genetic and epigenetic fine mapping of causal autoimmune disease variants. Nature 518 (7539), 337–343. doi:10.1038/nature13835
Freshour, S. L., Kiwala, S., Cotto, K. C., Coffman, A. C., McMichael, J. F., Song, J. J., et al. (2021). Integration of the drug-gene interaction database (DGIdb 4.0) with open crowdsource efforts. Nucleic Acids Res. 49 (D1), D1144–d1151. doi:10.1093/nar/gkaa1084
Gene Ontology Consortium (2015). Gene ontology consortium: going forward. Nucleic Acids Res. 43 (D1), D1049–D1056. doi:10.1093/nar/gku1179
Grundberg, E., Small, K. S., Hedman Å, K., Nica, A. C., Buil, A., Keildson, S., et al. (2012). Mapping cis- and trans-regulatory effects across multiple tissues in twins. Nat. Genet. 44 (10), 1084–1089. doi:10.1038/ng.2394
Guang, W., Ding, H., Czinn, S. J., Kim, K. C., Blanchard, T. G., and Lillehoj, E. P. (2010). Muc1 cell surface mucin attenuates epithelial inflammation in response to a common mucosal pathogen. J. Biol. Chem. 285 (27), 20547–20557. doi:10.1074/jbc.M110.121319
Gurevitch, J., Koricheva, J., Nakagawa, S., and Stewart, G. (2018). Meta-analysis and the science of research synthesis. Nature 555 (7695), 175–182. doi:10.1038/nature25753
Gustavsen, J. A., Pai, S., Isserlin, R., Demchak, B., and Pico, A. R. (2019). RCy3: Network biology using Cytoscape from within R. F1000Res. 8, 1774. doi:10.12688/f1000research.20887.3
Haddaway, N. R., Page, M. J., Pritchard, C. C., and McGuinness, L. A. (2022). PRISMA2020: an R package and Shiny app for producing PRISMA 2020 compliant flow diagrams, with interactivity for optimised digital transparency and Open Synthesis. Campbell Syst. Rev. 18 (2), e1230. doi:10.1002/cl2.1230
Haglund, K., Rusten, T. E., and Stenmark, H. (2007). Aberrant receptor signaling and trafficking as mechanisms in oncogenesis. Crit. Rev. Oncog. 13 (1), 39–74. doi:10.1615/critrevoncog.v13.i1.20
Hattrup, C. L., and Gendler, S. J. (2008). Structure and function of the cell surface (tethered) mucins. Annu. Rev. Physiol. 70, 431–457. doi:10.1146/annurev.physiol.70.113006.100659
Hedges, L. V., and Vevea, J. L. (1998). Fixed-and random-effects models in meta-analysis. Psychol. methods 3 (4), 486–504. doi:10.1037/1082-989x.3.4.486
Helgason, H., Rafnar, T., Olafsdottir, H. S., Jonasson, J. G., Sigurdsson, A., Stacey, S. N., et al. (2015). Loss-of-function variants in ATM confer risk of gastric cancer. Nat. Genet. 47 (8), 906–910. doi:10.1038/ng.3342
Higgins, J. P., and Thompson, S. G. (2002). Quantifying heterogeneity in a meta analysis. Stat. Med. 21 (11), 1539–1558. doi:10.1002/sim.1186
Higgins, J. P., Thompson, S. G., Deeks, J. J., and Altman, D. G. (2003). Measuring inconsistency in meta-analyses. BMJ 327 (7414), 557–560. doi:10.1136/bmj.327.7414.557
Hu, N., Wang, Z., Song, X., Wei, L., Kim, B. S., Freedman, N. D., et al. (2016). Genome-wide association study of gastric adenocarcinoma in Asia: a comparison of associations between cardia and non-cardia tumours. Gut 65 (10), 1611–1618. doi:10.1136/gutjnl-2015-309340
Huang da, W., Sherman, B. T., and Lempicki, R. A. (2009). Systematic and integrative analysis of large gene lists using DAVID bioinformatics resources. Nat. Protoc. 4 (1), 44–57. doi:10.1038/nprot.2008.211
Huang, H., Chanda, P., Alonso, A., Bader, J. S., and Arking, D. E. (2011). Gene-based tests of association. PLoS Genet. 7 (7), e1002177. doi:10.1371/journal.pgen.1002177
Jang, J., Ma, S. H., Ko, K. P., Choi, B. Y., Yoo, K. Y., and Park, S. K. (2020). Hepatocyte growth factor in blood and gastric cancer risk: A nested case-control study. Cancer Epidemiol. Biomarkers Prev. 29 (2), 470–476. doi:10.1158/1055-9965.Epi-19-0436
Jin, G., Ma, H., Wu, C., Dai, J., Zhang, R., Shi, Y., et al. (2012). Genetic variants at 6p21.1 and 7p15.3 are associated with risk of multiple cancers in Han Chinese. Am. J. Hum. Genet. 91 (5), 928–934. doi:10.1016/j.ajhg.2012.09.009
Jin, G., Lv, J., Yang, M., Wang, M., Zhu, M., Wang, T., et al. (2020). Genetic risk, incident gastric cancer, and healthy lifestyle: a meta-analysis of genome-wide association studies and prospective cohort study. Lancet. Oncol. 21 (10), 1378–1386. doi:10.1016/S1470-2045(20)30460-5
Kim, Y. I., Kim, S. Y., Cho, S. J., Park, J. H., Choi, I. J., Lee, Y. J., et al. (2014). Long-term metformin use reduces gastric cancer risk in type 2 diabetics without insulin treatment: a nationwide cohort study. Aliment. Pharmacol. Ther. 39 (8), 854–863. doi:10.1111/apt.12660
Kovalchik, S. (2014). Download content from NCBI databases. R package version 4.1.0. 2021. Available at: https://cran.r/project.org/package=RISmed (Accessed March 20, 2021).
Krishan, S., Richardson, D. R., and Sahni, S. (2014). Gene of the month. AMP kinase (PRKAA1). J. Clin. Pathol. 67 (9), 758–763. doi:10.1136/jclinpath-2014-202422
Lillehoj, E. P., Lu, W., Kiser, T., Goldblum, S. E., and Kim, K. C. (2007). MUC1 inhibits cell proliferation by a beta-catenin-dependent mechanism. Biochim. Biophys. Acta 1773 (7), 1028–1038. doi:10.1016/j.bbamcr.2007.04.009
Little, J., Higgins, J., Bray, M., Ioannidis, J., Khoury, M., Manolio, T., et al. (2006). The HuGENet™ HuGE review handbook, version 1.0. Ottawa, Ontario, Canada: HuGENet Canada Coordinating Centre.
Liu, J. Z., Mcrae, A. F., Nyholt, D. R., Medland, S. E., Wray, N. R., Brown, K. M., et al. (2010). A versatile gene-based test for genome-wide association studies. Am. J. Hum. Genet. 87 (1), 139–145. doi:10.1016/j.ajhg.2010.06.009
Luo, L., Peng, G., Zhu, Y., Dong, H., Amos, C. I., and Xiong, M. (2010). Genome-wide gene and pathway analysis. Eur. J. Hum. Genet. 18 (9), 1045–1053. doi:10.1038/ejhg.2010.62
Magaway, C., Kim, E., and Jacinto, E. (2019). Targeting mTOR and metabolism in cancer: lessons and innovations. Cells 8 (12), E1584. doi:10.3390/cells8121584
Manolio, T. A. (2010). Genomewide association studies and assessment of the risk of disease. N. Engl. J. Med. 363 (2), 166–176. doi:10.1056/NEJMra0905980
McCaw, Z. R., Colthurst, T., Yun, T., Furlotte, N. A., Carroll, A., Alipanahi, B., et al. (2022). DeepNull models non-linear covariate effects to improve phenotypic prediction and association power. Nat. Commun. 13 (1), 241. doi:10.1038/s41467-021-27930-0
McGuinness, L. A., and Higgins, J. P. T. (2021). Risk-of-bias VISualization (robvis): An R package and Shiny web app for visualizing risk-of-bias assessments. Res. Synth. Methods 12 (1), 55–61. doi:10.1002/jrsm.1411
Mitra, G., Weber, M., and Stacey, D. (1993). Multiple pathways for activation of MAP kinases. Cell. Mol. Biol. Res. 39 (5), 517–523.
Mocellin, S., Verdi, D., Pooley, K. A., and Nitti, D. (2015). Genetic variation and gastric cancer risk: a field synopsis and meta-analysis. Gut 64 (8), 1209–1219. doi:10.1136/gutjnl-2015-309168
Morgenthaler, S., and Thilly, W. G. (2007). A strategy to discover genes that carry multi-allelic or mono-allelic risk for common diseases: a cohort allelic sums test (CAST). Mutat. Res. 615 (1-2), 28–56. doi:10.1016/j.mrfmmm.2006.09.003
Mosher, D. F., and Adams, J. C. (2012). Adhesion-modulating/matricellular ECM protein families: a structural, functional and evolutionary appraisal. Matrix Biol. 31 (3), 155–161. doi:10.1016/j.matbio.2012.01.003
Nath, S., and Mukherjee, P. (2014). MUC1: a multifaceted oncoprotein with a key role in cancer progression. Trends Mol. Med. 20 (6), 332–342. doi:10.1016/j.molmed.2014.02.007
Nica, A. C., and Dermitzakis, E. T. (2013). Expression quantitative trait loci: present and future. Philos. Trans. R. Soc. Lond. B Biol. Sci. 368 (1620), 20120362. doi:10.1098/rstb.2012.0362
Oetting, W. S., Jacobson, P. A., and Israni, A. K. (2017). Validation is critical for genome‐wide association study‐based associations. American Journal of Transplantation 17 (2), 318–319. doi:10.1111/ajt.14051
Page, M. J., McKenzie, J. E., Bossuyt, P. M., Boutron, I., Hoffmann, T. C., Mulrow, C. D., et al. (2021). The PRISMA 2020 statement: an updated guideline for reporting systematic reviews. BMJ 372, n71. doi:10.1136/bmj.n71
Park, B., Yang, S., Lee, J., Woo, H. D., Choi, I. J., Kim, Y. W., et al. (2019). Genome-wide association of genetic variation in the PSCA gene with gastric cancer susceptibility in a Korean population. Cancer Res. Treat. 51 (2), 748–757. doi:10.4143/crt.2018.162
Piñero, J., Ramírez-Anguita, J. M., Saüch-Pitarch, J., Ronzano, F., Centeno, E., Sanz, F., et al. (2020). The DisGeNET knowledge platform for disease genomics: 2019 update. Nucleic Acids Res. 48 (D1), D845–D855. doi:10.1093/nar/gkz1021
Pratt, D., Chen, J., Welker, D., Rivas, R., Pillich, R., Rynkov, V., et al. (2015). NDEx, the network data Exchange. Cell Syst. 1 (4), 302–305. doi:10.1016/j.cels.2015.10.001
Rashkin, S. R., Graff, R. E., Kachuri, L., Thai, K. K., Alexeeff, S. E., Blatchins, M. A., et al. (2020). Pan-cancer study detects genetic risk variants and shared genetic basis in two large cohorts. Nat. Commun. 11 (1), 4423. doi:10.1038/s41467-020-18246-6
Richardson, W. S., Wilson, M. C., Nishikawa, J., and Hayward, R. S. (1995). The well-built clinical question: a key to evidence-based decisions. ACP J. Club 123 (3), A12–A13.
Risch, N., and Merikangas, K. (1996). The future of genetic studies of complex human diseases. Science 273 (5281), 1516–1517. doi:10.1126/science.273.5281.1516
Rizzato, C., Kato, I., Plummer, M., Muñoz, N., and Canzian, F. (2013). Genetic variation in PSCA and risk of gastric advanced preneoplastic lesions and cancer in relation to Helicobacter pylori infection. PLoS One 8 (9), e73100. doi:10.1371/journal.pone.0073100
Sakamoto, H., Yoshimura, K., Saeki, N., Katai, H., Shimoda, T., Matsuno, Y., et al. (2008). Genetic variation in PSCA is associated with susceptibility to diffuse-type gastric cancer. Nat. Genet. 40 (6), 730–740. doi:10.1038/ng.152
Seger, R., and Krebs, E. G. (1995). The MAPK signaling cascade. FASEB J. 9 (9), 726–735. doi:10.1096/fasebj.9.9.7601337
Shannon, P., Markiel, A., Ozier, O., Baliga, N. S., Wang, J. T., Ramage, D., et al. (2003). Cytoscape: a software environment for integrated models of biomolecular interaction networks. Genome Res. 13 (11), 2498–2504. doi:10.1101/gr.1239303
Shi, Y., Hu, Z., Wu, C., Dai, J., Li, H., Dong, J., et al. (2011). A genome-wide association study identifies new susceptibility loci for non-cardia gastric cancer at 3q13.31 and 5p13.1. Nat. Genet. 43 (12), 1215–1218. doi:10.1038/ng.978
Slenter, D. N., Kutmon, M., Hanspers, K., Riutta, A., Windsor, J., Nunes, N., et al. (2018). WikiPathways: a multifaceted pathway database bridging metabolomics to other omics research. Nucleic Acids Res. 46 (D1), D661–d667. doi:10.1093/nar/gkx1064
Solovieff, N., Cotsapas, C., Lee, P. H., Purcell, S. M., and Smoller, J. W. (2013). Pleiotropy in complex traits: challenges and strategies. Nat. Rev. Genet. 14 (7), 483–495. doi:10.1038/nrg3461
Stadler, Z. K., Thom, P., Robson, M. E., Weitzel, J. N., Kauff, N. D., Hurley, K. E., et al. (2010). Genome-wide association studies of cancer. J. Clin. Oncol. 28 (27), 4255–4267. doi:10.1200/JCO.2009.25.7816
Sterne, J. A., Hernán, M. A., Reeves, B. C., Savović, J., Berkman, N. D., Viswanathan, M., et al. (2016). ROBINS-I: a tool for assessing risk of bias in non-randomised studies of interventions. BMJ 355, i4919. doi:10.1136/bmj.i4919
Stranger, B. E., Montgomery, S. B., Dimas, A. S., Parts, L., Stegle, O., Ingle, C. E., et al. (2012). Patterns of cis regulatory variation in diverse human populations. PLoS Genet. 8 (4), e1002639. doi:10.1371/journal.pgen.1002639
Sung, H., Ferlay, J., Siegel, R. L., Laversanne, M., Soerjomataram, I., Jemal, A., et al. (2021). Global cancer statistics 2020: GLOBOCAN estimates of incidence and mortality worldwide for 36 cancers in 185 countries. CA Cancer J. Clin. 71 (3), 209–249. doi:10.3322/caac.21660
Suzuki, M., Mimuro, H., Kiga, K., Fukumatsu, M., Ishijima, N., Morikawa, H., et al. (2009). Helicobacter pylori CagA phosphorylation-independent function in epithelial proliferation and inflammation. Cell Host Microbe 5 (1), 23–34. doi:10.1016/j.chom.2008.11.010
Svishcheva, G. R., Belonogova, N. M., and Axenovich, T. I. (2015). Region-based association test for familial data under functional linear models. PloS one 10 (6), e0128999. doi:10.1371/journal.pone.0128999
Szklarczyk, D., Gable, A. L., Nastou, K. C., Lyon, D., Kirsch, R., Pyysalo, S., et al. (2021). The STRING database in 2021: customizable protein-protein networks, and functional characterization of user-uploaded gene/measurement sets. Nucleic Acids Res. 49 (D1), D605–d612. doi:10.1093/nar/gkaa1074
Tanikawa, C., Urabe, Y., Matsuo, K., Kubo, M., Takahashi, A., Ito, H., et al. (2012). A genome-wide association study identifies two susceptibility loci for duodenal ulcer in the Japanese population. Nat. Genet. 44 (4), 430–434. doi:10.1038/ng.1109
Tanikawa, C., Kamatani, Y., Toyoshima, O., Sakamoto, H., Ito, H., Takahashi, A., et al. (2018). Genome-wide association study identifies gastric cancer susceptibility loci at 12q24.11-12 and 20q11.21. Cancer Sci. 109 (12), 4015–4024. doi:10.1111/cas.13815
Toyoshima, O., Tanikawa, C., Yamamoto, R., Watanabe, H., Yamashita, H., Sakitani, K., et al. (2018). Decrease in PSCA expression caused by Helicobacter pylori infection may promote progression to severe gastritis. Oncotarget 9 (3), 3936–3945. doi:10.18632/oncotarget.23278
Višnjić, D., Lalić, H., Dembitz, V., Tomić, B., and Smoljo, T. (2021). AICAr, a widely used AMPK activator with important AMPK-independent effects: a systematic review. Cells 10 (5), 1095. doi:10.3390/cells10051095
Võsa, U., Claringbould, A., Westra, H.-J., Bonder, M. J., Deelen, P., Zeng, B., et al. (2018). Unraveling the polygenic architecture of complex traits using blood eQTL metaanalysis. BioRxiv, 447367. doi:10.1101/447367
Võsa, U., Claringbould, A., Westra, H. J., Bonder, M. J., Deelen, P., Zeng, B., et al. (2021). Large-scale cis- and trans-eQTL analyses identify thousands of genetic loci and polygenic scores that regulate blood gene expression. Nat. Genet. 53 (9), 1300–1310. doi:10.1038/s41588-021-00913-z
Wang, W. Y., Barratt, B. J., Clayton, D. G., and Todd, J. A. (2005). Genome-wide association studies: theoretical and practical concerns. Nat. Rev. Genet. 6 (2), 109–118. doi:10.1038/nrg1522
Wang, Z., Dai, J., Hu, N., Miao, X., Abnet, C. C., Yang, M., et al. (2017). Identification of new susceptibility loci for gastric non-cardia adenocarcinoma: pooled results from two Chinese genome-wide association studies. Gut 66 (4), 581–587. doi:10.1136/gutjnl-2015-310612
Wang, Y., Meng, Y., Zhang, S., Wu, H., Yang, D., Nie, C., et al. (2018). Phenformin and metformin inhibit growth and migration of LN229 glioma cells in vitro and in vivo. Onco. Targets. Ther. 11, 6039–6048. doi:10.2147/ott.S168981
Watanabe, K., Taskesen, E., Van Bochoven, A., and Posthuma, D. (2017). Functional mapping and annotation of genetic associations with FUMA. Nat. Commun. 8 (1), 1826–1911. doi:10.1038/s41467-017-01261-5
Westra, H. J., and Franke, L. (2014). From genome to function by studying eQTLs. Biochim. Biophys. Acta 1842 (10), 1896–1902. doi:10.1016/j.bbadis.2014.04.024
Westra, H. J., Peters, M. J., Esko, T., Yaghootkar, H., Schurmann, C., Kettunen, J., et al. (2013). Systematic identification of trans eQTLs as putative drivers of known disease associations. Nat. Genet. 45 (10), 1238–1243. doi:10.1038/ng.2756
Wheeler, H. E., Maitland, M. L., Dolan, M. E., Cox, N. J., and Ratain, M. J. (2013). Cancer pharmacogenomics: strategies and challenges. Nat. Rev. Genet. 14 (1), 23–34. doi:10.1038/nrg3352
Wishart, D. S., Feunang, Y. D., Guo, A. C., Lo, E. J., Marcu, A., Grant, J. R., et al. (2018). DrugBank 5.0: a major update to the DrugBank database for 2018. Nucleic Acids Res. 46 (D1), D1074–d1082. doi:10.1093/nar/gkx1037
Wu, Y., Qi, Y., Liu, H., Wang, X., Zhu, H., and Wang, Z. (2016). AMPK activator AICAR promotes 5-FU-induced apoptosis in gastric cancer cells. Mol. Cell. Biochem. 411 (1-2), 299–305. doi:10.1007/s11010-015-2592-y
Yan, C., Zhu, M., Ding, Y., Yang, M., Wang, M., Li, G., et al. (2020). Meta-analysis of genome-wide association studies and functional assays decipher susceptibility genes for gastric cancer in Chinese populations. Gut 69 (4), 641–651. doi:10.1136/gutjnl-2019-318760
Keywords: stomach neoplasms, gastric cancer, genome-wide association study, gene-based analysis, functional annotations
Citation: Lee S, Yang H-K, Lee H-J, Park DJ, Kong S-H and Park SK (2022) Systematic review of gastric cancer-associated genetic variants, gene-based meta-analysis, and gene-level functional analysis to identify candidate genes for drug development. Front. Genet. 13:928783. doi: 10.3389/fgene.2022.928783
Received: 26 April 2022; Accepted: 25 July 2022;
Published: 16 August 2022.
Edited by:
Monde Ntwasa, University of South Africa, South AfricaCopyright © 2022 Lee, Yang, Lee, Park, Kong and Park. This is an open-access article distributed under the terms of the Creative Commons Attribution License (CC BY). The use, distribution or reproduction in other forums is permitted, provided the original author(s) and the copyright owner(s) are credited and that the original publication in this journal is cited, in accordance with accepted academic practice. No use, distribution or reproduction is permitted which does not comply with these terms.
*Correspondence: Sue K. Park, c3VlcGFya0BzbnUuYWMua3I=
Disclaimer: All claims expressed in this article are solely those of the authors and do not necessarily represent those of their affiliated organizations, or those of the publisher, the editors and the reviewers. Any product that may be evaluated in this article or claim that may be made by its manufacturer is not guaranteed or endorsed by the publisher.
Research integrity at Frontiers
Learn more about the work of our research integrity team to safeguard the quality of each article we publish.