 Yong-Jian Guan
 Chang-Qing Yu
 Li-Ping Li
 Zhu-Hong You
 Zhong-Hao Ren
 Jie Pan
 Yue-Chao Li
94% of researchers rate our articles as excellent or good
Learn more about the work of our research integrity team to safeguard the quality of each article we publish.
Find out more
ORIGINAL RESEARCH article
Front. Genet., 15 July 2022
Sec. Computational Genomics
Volume 13 - 2022 | https://doi.org/10.3389/fgene.2022.919264
This article is part of the Research TopicEnhanced Biological Mechanism Study, Drug Discovery and Individualized Medicine with Single-Cell Multiomics Data and Integrative AnalysisView all 10 articles
As a novel target in pharmacy, microRNA (miRNA) can regulate gene expression under specific disease conditions to produce specific proteins. To date, many researchers leveraged miRNA to reveal drug efficacy and pathogenesis at the molecular level. As we all know that conventional wet experiments suffer from many problems, including time-consuming, labor-intensity, and high cost. Thus, there is an urgent need to develop a novel computational model to facilitate the identification of miRNA–drug interactions (MDIs). In this work, we propose a novel bipartite network embedding-based method called BNEMDI to predict MDIs. First, the Bipartite Network Embedding (BiNE) algorithm is employed to learn the topological features from the network. Then, the inherent attributes of drugs and miRNAs are expressed as attribute features by MACCS fingerprints and k-mers. Finally, we feed these features into deep neural network (DNN) for training the prediction model. To validate the prediction ability of the BNEMDI model, we apply it to five different benchmark datasets under five-fold cross-validation, and the proposed model obtained excellent AUC values of 0.9568, 0.9420, 0.8489, 0.8774, and 0.9005 in ncDR, RNAInter, SM2miR1, SM2miR2, and SM2miR MDI datasets, respectively. To further verify the prediction performance of the BNEMDI model, we compare it with some existing powerful methods. We also compare the BiNE algorithm with several different network embedding methods. Furthermore, we carry out a case study on a common drug named 5-fluorouracil. Among the top 50 miRNAs predicted by the proposed model, there were 38 verified by the experimental literature. The comprehensive experiment results demonstrated that our method is effective and robust for predicting MDIs. In the future work, we hope that the BNEMDI model can be a reliable supplement method for the development of pharmacology and miRNA therapeutics.
As many previous studies have shown, RNA plays a vital role in encoding, decoding, regulation, and expression of genes (Fu, 2014). Global transcriptional analyses of the human genome proved that the quantity of non-coding RNAs (ncRNA) is much larger than protein in human cells and ncRNA is involved in the regulation of stem cell pluripotency and cell division (Cawley et al., 2004; Iyer et al., 2015). In the human genome project, the newly discovered RNA genes are far more abundant than protein genes (Bentwich et al., 2005). RNA can be divided into two classes based on the length of the RNA chain, mainly including long RNA of more than 200 nucleotides and small RNA of fewer than 200 nucleotides. MicroRNAs (miRNAs) are a kind of short endogenous non-coding RNAs with 20–25 nucleotides, which may modulate the expression of genes in post-transcription (Ambros, 2001; Bartel, 2004). MiRNAs will incompletely bind to the target genes for inhibiting the transcripts, which may truncate mRNAs but does not affect the stability of mRNAs (Jiang et al., 2009).
Despite great advances in miRNA therapeutics and the theoretical knowledge between miRNAs and diseases, most of the drug targets are proteins. In human cells, less than 15% of disease-related proteins are targets of drugs (Dixon and Stockwell, 2009). This means that drug targets, which are designed through proteins, can only act on a small proportion of the human genome. In brief, most proteins are not “druggable.” As a result, ncRNAs are increasingly considered by researchers as a potential drug target. Among them, miRNA is considered a valuable drug target because it can play a key role in gene regulation when the disease occurs. Increasing number of experiments prove that there is a strong relationship between the abnormal regulation of miRNA and human diseases. For example, the expression level of miR-205 and miR-393 are potential biomarkers of mucinous colorectal cancer and colon cancers, which will be increased when cancer occurs (Eyking et al., 2016). Bommer et al. (2007) discovered that the expression level of miR-34 will be lessened in non-small cell lung cancers (Bommer et al., 2007). If miRNA can be used as drug targets, it will be conducive to the development of drug discovery and drug repositioning (Zhang et al., 2021b).
Therefore, many recent studies focus on the miRNA-based approach as a therapeutic, one of which is targeting over-expressed miRNAs (Ishida and Selaru, 2013; Bayraktar et al., 2018; Zhang et al., 2021). Kota et al. (2009) reported that miR-26a transported by adeno-associated virus (AAV) inhibits the spread of cancer cells and activates the apoptosis of cancer cells. In the previous study, Esquela-Kerscher et al. suggested that the active expression of let-7 could suppress the proliferation of tumor cells in the mice model (Fu et al., 2021). Matboli et al. (2017) demonstrated that caffeic can effectively attenuate diabetic kidney disease in rats by downregulating the expression level of miR-133b, miR-342, and miR30a (Matboli et al., 2017).
However, detecting MDI based on the experiment is a labor-intensive and time-consuming process. In silico, some of the prediction methods have been proposed to infer the potential interaction between miRNAs and drugs. For example, Huang et al. proposed a computational method named GCMDR, which is based on a graph convolution neural network and explores the link between miRNA and drug resistance (Ya et al., 2020). In detail, they constructed a bipartite graph integrating the fingerprint of drug compounds and miRNA functional similarity. Moreover, they learned from the idea of auto-encoder, in which they built a graph convolution-based encoder to generate the embeddings of nods and a decoder to complete the prediction task. Lv et al. (2015)constructed two homogeneous networks of miRNAs and small molecular drugs. Multiple similarity measurements (i.e., side effect, functional consistency, indication phenotype, and chemical structure) are fused to represent the node feature of miRNAs and drugs, and they implemented the improved random walk restart algorithm on the heterogeneous network, which is fused by two homogeneous networks. Thus, this method can infer the potential MDI without having to resort to the information of known MDI. But there are too many parameters required to adjust in this method. Recently, Deepthi and Jereesh, (2021) developed an ensemble approach of the convolutional neural network based on deep architecture-based classification for identifying the association between miRNAs and drugs. They treated the similarities of miRNAs and drug compounds as the biological features and reduced the dimensions of features by the PCA algorithm. Then, they constructed a convolutional deep neural network for the purpose of feature extraction. Finally, they employed SVM to predict the potential MDIs. Anyway, the aforementioned methods rely heavily on side information calculated by functional similarities such as gene functional similarity and disease phenotype similarity. Abuse of functional similarity carries the risk of label leakage. However, due to the incomplete database, a lot of side information about miRNA and drugs is missing. In most cases, researchers only have the sequence profile and phenotypic profile of biological molecules and chemical compound. Therefore, we think that an MDI prediction method based on the sequence profile rather than functional similarity should be designed.
The information on how miRNAs affect drug effects in the literature can also provide rich information (Fleuren and Alkema, 2015). Hence, Xie et al. (2017) proposed a novel text mining approach named EmDL to infer the MDIs by extracting the explicit information in the literature. They began by splitting substantial articles, which were collected from PubMed and MEDLINE, into individual sentences. For each miRNA–drug pair, the word distance between miRNA and drug appearing in the sentence was calculated to extract the representation features. Last, they leveraged the principal component analysis (PCA) algorithm to reduce the dimension of representation features and was carried out using the support vector machine (SVM) to predict whether the miRNA–drug pair was interactive (Deepthi and Jereesh, 2021). Moreover, Guo et al. (2020) creatively introduced natural language processing (NLP) to the field of biological information. For the purpose of mining the information from the chemical structure of biological entities, they regarded the miRNA sequences and drug SMILES sequences as sentences and implemented the word2vec algorithm for them. However, implementation of NLP methods required a large corpus, and the performance of text mining-based methods will be affected by different corpora and different semantic statements.
In this work, we propose a novel computational method, named BNEMDI, which predicts miRNA–drug interactions using drug substructure fingerprint, miRNA sequence, and MDIs bipartite graph. We have collected known MDI from three databases (e.g., ncDR, RNAInter, and SM2miR) and split them into five datasets. In datasets, the MDI pairs were treated as positive samples, and the same number of unconfirmed miRNA–drug pairs was selected randomly as negative samples. The known MDIs in datasets were constructed as the bipartite graph, and the miRNAs and drug compounds are regarded as the nodes of the graph. The graph embedding methods are pervasive to reveal the complex traits of each entity (Li et al., 2021; Yue and He, 2021). Thus, a graph embedding technique called BiNE was implemented on the bipartite graph for learning the topological features of nodes (Gao et al., 2018), and BNEMDI considers not only the topological information of MDI but also the inherent attribute information of the biological entities. Specifically, the attribute features of drug compounds are denoted by MACCS substructure fingerprints, and the attribute features of miRNAs are calculated by k-mers (Kurtz et al., 2008; Cereto-Massagué et al., 2015). Finally, we constructed a neural network model based on DNN to fuse two kinds of features mentioned earlier and infer the potential miRNA–drug interaction pairs. The flowchart of BNEMDI is shown in Figure 1.
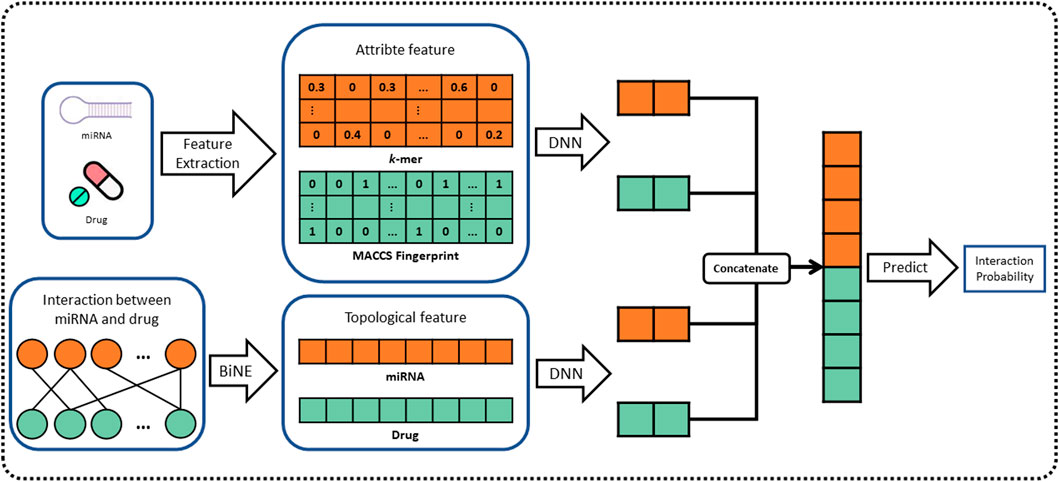
FIGURE 1. Flowchart of the BNEMDI model for predicting potential MDIs.
There are several databases about MDIs, for example, the RNA interaction dataset (RNAInter) (Kang et al., 2021), the database for non-coding RNAs involved in drug resistance (ncDR) (Dai et al., 2017), and the database of validated small molecules’ effects on miRNA expression (SM2miR) (Liu X. et al., 2013).
We downloaded a total of 8,053 different experimentally verified miRNA–drug interactions from the three databases mentioned earlier. One thing is to note that the SM2miR database was created on 10 June 2012 and upgraded twice on 28 August 2013 and 27 April 2015. Thus, the SM2miR database was divided into three sub-datasets, according to three versions, named SM2miR1, SM2miR2, and SM2miR3 for convenience, respectively. Therefore, we obtained a total of five datasets and pre-processed them, such as de-redundancy and de-duplication. The details of the three databases are shown in Table 1. We only collected the miRNA–drug interaction pairs of Homo sapiens in three databases. The miRNA sequences and drug SMILES are collected from miRBase (Kozomara et al., 2019) and PubChem (Kim et al., 2021a). The drug SMILES is a specification that explicitly describes the molecular structure in ASCII strings (Weininger and sciences, 1988). The drug SMILES are transformed into MACCS fingerprints by the RDKit library.

TABLE 1. Statistics of miRNAs, drugs, and miRNA–drug interactions in five datasets.
For obtaining genomic information on miRNA, the sequence of miRNA is represented by k-mer (Liu B. et al., 2013). k-mer is a feature representation method, which is widely used in the field of bioinformatics. Yousef et al. (2017) used k-mer to construct simple sequence-based features to describe miRNAs for miRNA categorization (Yousef et al., 2017; Erten-Ela et al., 2018). In addition, Yi et al. (2020) also used k-mer to represent molecules such as lncRNA, miRNA, and protein in the molecule association network (Yi et al., 2020; Pan et al., 2022). k-mer is a substring of biological sequence with a length of k. For the miRNA sequences, we define the 3-mer of miRNA as the subsequence, such as “AGG” and “AAA.” Then we sequentially extract three nucleotides from the first nucleotides, using the form of a sliding window (step length is one). Since miRNA consists of four types of bases, there are 64
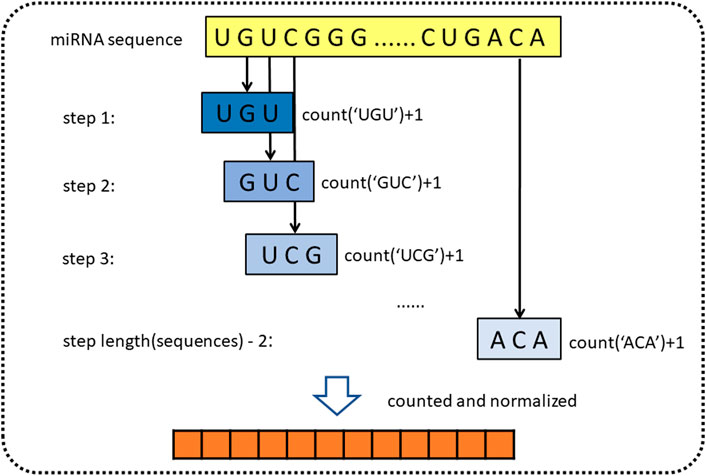
FIGURE 2. Diagram of k-mer for extracting attribute sequences from miRNA sequences.
In the past research, numerous kinds of descriptors have been established to portray the chemical structure of pharmaceutical compounds such as geometrical, topological constitutional, and quantum chemical properties (Cao et al., 2012). The substructure keys-based fingerprint is customarily adopted as the descriptor to represent the chemical structure. Substructure fingerprints encode molecular structure to a bit-string with a fixed length, according to the substructure of the drug instead of using 3D structural information. Plenty of previous research works have demonstrated that substructure fingerprint is effective and feasible to represent drugs. Specifically, we incorporated a dictionary that includes a list of substructure features represented as SMART strings. SMART is a system to identify substructures by the expanding rule of SMILES. After the first step of composing the dictionary, we compare each item of the dictionary to the given molecular substructures, if the SMART pattern is included in the given molecular substructure, the corresponding bit of fingerprint is set to one, and zero otherwise. An example of the substructure fingerprint determined by the given molecular substructure is displayed in Figure 3. Herein, we used MACCS fingerprint to compose the dictionary, which contained 166 types of general molecular substructures and covered most of the interesting chemical structures of drugs. Finally, we represented Boolean vectors of molecular drug for the length of 166.
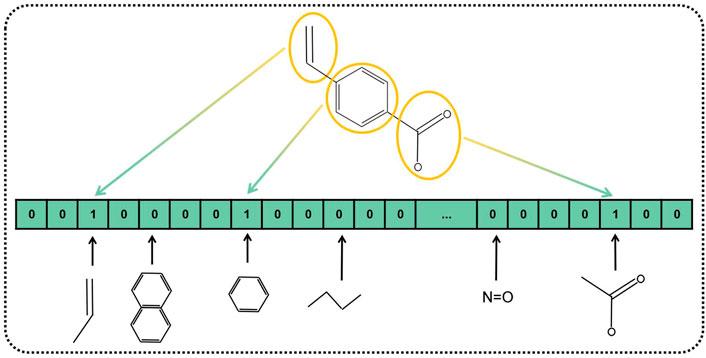
FIGURE 3. Diagram of MACCS fingerprint-represented drug substructures.
In this study, the graph representation learning method may encode each node by topological information and embed nodes in a low-dimension space. It is different from previous studies, in which it can extract underlying information from the network.
The challenge of MDI prediction may be formulated as a link prediction problem with a heterogeneous graph. The MDIs network is employed to construct a heterogeneous graph
To model the explicit relations, we calculated the local proximity between two different vertices in the bipartite network, which is based on local proximity in LINE (Tang et al., 2015). We define the joint probability between two connected nodes as:
where
Drawing on the principle of word2vec, BiNE estimates the local proximity between two nodes by inner product (Church, 2017), and the sigmoid function is used to map the interaction value to the probability space. The joint probability of two different types of nodes in embedding space is defined as follows:
where
To get the knowledge of observed edges and learn the embedding vectors, we need to minimize the difference between empirical distribution and the reconstructed distribution. KL-divergence is used to measure the difference between the previously two joint probabilities mentioned. The first part of the joint optimizing framework can be defined as:
Studies of recommendation systems demonstrated that implicit relations are also helpful to discover potential information in the heterogeneous graph as explicit relations (Jiang et al., 2016; Yu et al., 2018). This means that nodes of the same type are not connected in the bipartite network, but still contain a wealth of information, that is, crucial to model the implicit relationship between the nodes of the same type. BiNE constructs two homogeneous networks in accordance with the interaction profile between two types of nodes and performs the random walk on two homogeneous networks to encode the high-order proximity of the origin network.
To reveal the 2nd proximity of the heterogeneous graph, BiNE utilizes co-HITS (Deng et al., 2009) to generate two weighted homogeneous networks (drug–drug network and miRNA–miRNA network). In accordance with co-HITS, the correlation coefficient between two nodes can be defined as:
where
Truncated random walks are employed on two homogeneous networks previously generated to obtain the corpus of node sequences. Therefore, the biased and self-adaptive random walk generator, which may maintain the vertex distribution, is introduced to produce the corpus of node sequences with true validity and effectiveness. Its core design can be described as “richer get richer.” Specifically, the greater centrality of a node, the more likely that node will be the starting point for the random walk to begin. The centrality of nodes in the homogeneous network is measured by HITS (Kleinberg, 1999). Compared with other random walk-based measures, a probability is specified to stop the random walk in each step. Therefore, the node sequence generated by our method does not have a fixed length because the variable-length sequences are more simulated to natural language.
The skip-gram model is carried out to process the samples of two corpora obtained from truncated random walk. If two nodes frequently appear in the same context of a node sequence, the skip-gram model will assign them similar embedding vectors.
In order to learn the implicit relations, two objection functions are defined to maintain the high-order proximity by maximizing the conditional probability. The symbols of
Then, the corpus of the miRNA homogeneous network
Similar to the LINE (Tang et al., 2015), the conditional probability
where
Finally, the three components of the objective function are combined into the joint optimization framework for learning the low-dimension embedding vectors of the bipartite network. The overall jointly optimizing function is defined as follows:
where
To improve computational efficiency, a negative sampling method is adopted to approach the complicated denominator of the sigmoid function. In particular, nodes are divided into different buckets by locality-sensitive hashing (LSH) (Wang et al., 2013) and randomly selected as the negative samples. Finally, the joint framework is optimized by the stochastic gradient ascent (SGA) algorithm. The first part of the optimizing framework
where
where
In this section, we will introduce how to predict whether the miRNA–drug pairs have underlying interaction. After feature extraction, the attribute and topological features of miRNAs and drugs were concatenated and fed into the DNN model for fusing as unified dimension representation vectors. Finally, a dense layer with 256 neurons is used to complete the classification task. Specifically, suppose that the nodes miRNA and nodes drug are
where
As MDI prediction is a binary classification problem for each pair of miRNA and drugs, we used some evaluation criteria to measure the performance of the proposed model, including accuracy (Acc.), sensitivity (Sen), specificity (Spec.), also precision (Prec.), and Matthews correlation coefficient (MCC). They are defined as:
Here, TP and TN are signs of the number of correct positive samples and correct negative samples predicted by the model, respectively. Correspondingly, FP and FN are signs of the number of false positive samples and false negative samples predicted by the model, respectively (Pan et al., 2020). Following previous studies, the receiver-operating characteristic (ROC) and precision-recall (PR) are implemented to visually display the result of the experiment, and the area under ROC (AUC) and PR (AUPR) are used to assess the comprehensive performance of the proposed model.
To systematically evaluate the performance of the BNEMDI model, our proposed model is implemented to predict potential MDI pairs on five different datasets, and five-fold cross-validations are implemented for obtaining a more accurate assessment. In detail, the dataset will be divided into five parts, each part will serve as the testing set in turn, and the rest as training sets. Afterward, Table 2 lists various evaluation values to illustrate the prediction performance of BNEMDI. As can be seen in Table 2, we get the result of the experiment with the accuracy of 88.75% (ncDR), 87.23% (RNAInter), 77.24% (SM2miR1), 79.92% (SM2miR2), and 81.86% (SM2miR3). The standard deviations of accuracy are 0.1, 0.34, 0.39, 0.21, and 0.65%, respectively. To directly illustrate the prediction performance of BNEMDI on each dataset, Figure 4 presents the ROC and PR curves of the result of five-fold cross-validations on five datasets. The proposed model BNEMDI achieves average AUCs of 0.9568 (ncDR), 0.9420 (RNAInter), 0.8489 (SM2miR1), 0.8774 (SM2miR2), and 0.9005 (SM2miR3). The standard deviations of five-fold cross-validations are 0.001, 0.0016, 0.0021, 0.0023, and 0.0026, respectively. It is apparent from these criteria values that our proposed model BNEMDI is stable and effective.
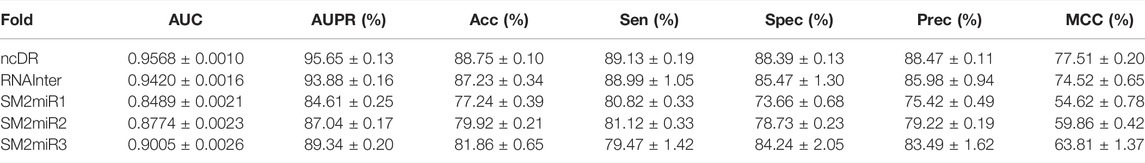
TABLE 2. Performance of the proposed method on five datasets.
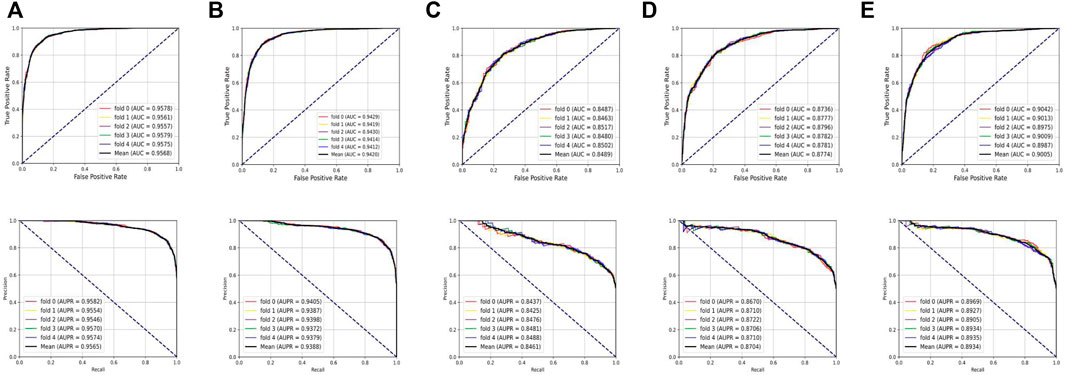
FIGURE 4. Prediction performance of BNEMDI based on ROC and PR curves. (A) Five-fold cross-validation ROC and PR curves on the ncDR dataset. (B) Five-fold cross-validation ROC and PR curves on the RNAInter dataset. (C) Five-fold cross-validation ROC and PR curves on the SM2miR1 dataset. (D) Five-fold cross-validation ROC and PR curves on the SM2miR2 dataset. (E) Five-fold cross-validation ROC and PR curves on the SM2miR3 dataset.
Previously, some studies have conducted MDI prediction experiments on the ncDR dataset (Huang et al., 2018; Huang et al., 2020). Herein, we compared our proposed model with these models and some classical methods like collaborative filtering (CF) and matrix factorization (MF) (Boutsidis and Gallopoulos, 2008; Su and Khoshgoftaar, 2009). The evaluation criteria are AUC and the results are shown in Table 3. In GCMDR and HMDPI, the attribute features of miRNAs and drugs were constructed using miRNA expression profile, drug substructure fingerprints, gene ontology, and disease ontology. Huang et al. constructed the GCMDR model by combining graph convolution and auto-encoder to learn deep features. In the GCMDR model, the dimensional latent factor, units in hidden layer, maximum Chebyshev polynomial degree, and training epochs are set to 25, 100, 3, and 200, respectively. In EPLMI, they implemented a two-way diffusion method on the weighted network to generate resource vectors which can be defined as:
where
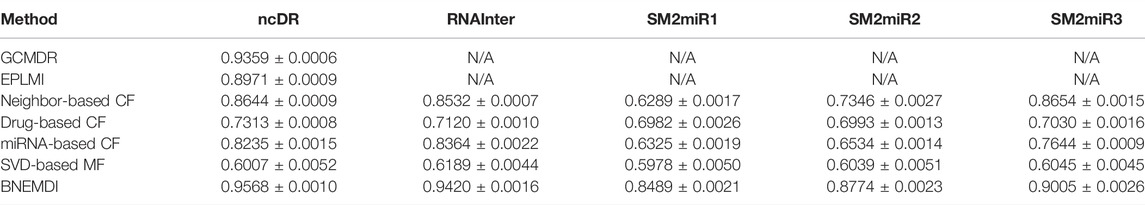
TABLE 3. Comparison of the prediction performance based on the ncDR dataset (N/A means not available).
In the methods based on CF, the self-similarities of miRNA and drug are calculated by the Pearson correlation coefficient (PCC), which is defined as:
where
where
Correspondingly, the predicted score matrix of miRNA-based CF can be defined as:
Neighbor-based CF takes into account both drug-based CF and miRNA-based CF and is defined as:
Several studies on drug target interaction prediction or drug repositioning have used similarity-related information to construct the prediction models. Although they gain optimistic results on datasets, it seems difficult for the model to work in real-world scenarios. However, the similarity itself is related to interactions of biological entities, and the abuse of similarity will potentially lead to label leakage. The prediction ability of label leaking models is easily overestimated when it implements on a known dataset. In this experiment, after dividing the dataset into training sets and test sets, only the training set was extracted topological features and used to construct the prediction model for avoiding label leakage. For instance, there are 4,457 MDI pairs in the ncDR dataset, of which only 3,565 MDI pairs will be extracted as features and used to construct the prediction model. But there are no such issues in the attribute features.
To better construct representation vectors, we considered attribute features and topological features of nodes in the miRNA–drug bipartite network. In this section, we are going to discuss the impact of different features on the performance of BNEMDI. We consider three kinds of features: attribute feature, topological feature, and the combination of them to separately construct the representation vectors and the corresponding prediction model. The accuracy is used as the standard to compare the influence of various features on the model.
Figure 5 shows the prediction performance of models based on different features. In general, the topological features are more effective than the attribute features. Therefore, we concluded that the topological features make a great contribution to the proposed model. Although attribute features do not perform as well as the topological feature, the production of attribute features only requires sequence information like SMILES and miRNA sequences. Thus, the attribute features are suitable as the representation vectors for the new samples.
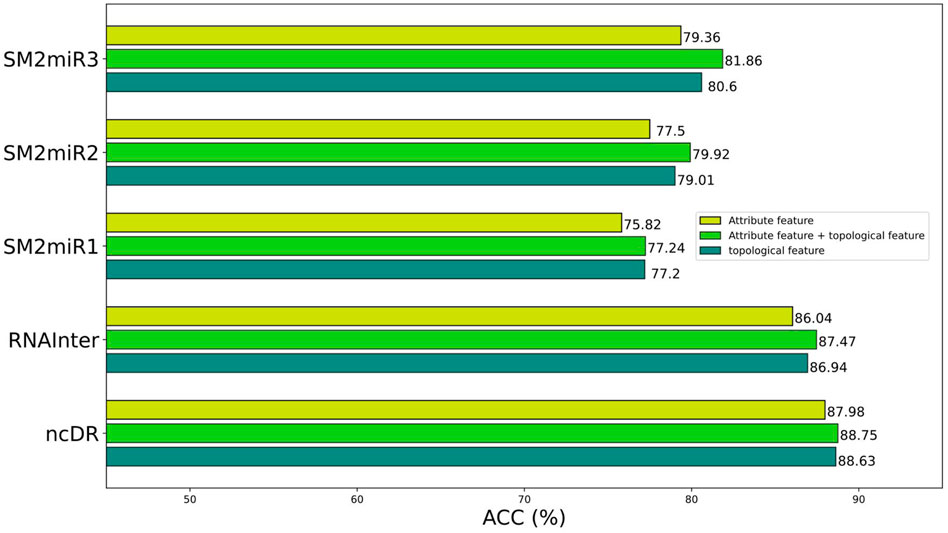
FIGURE 5. Prediction performance of different features on different datasets.
The attribute features are constructed by the sequence profile information of nodes in the relationship network and contain chemical structure information of the miRNAs and drugs. The topological features consider high-order implicit transition relationships and explicit relations, which provide distinct similarity information of homologous nodes. This makes it easier for miRNA and drug relationship pairs with similar structures to known MDI to be considered interacting, and vice versa. In principle, the combination of topological features and attribute features will make the effect more pronounced.
The topological feature extracted by BiNE is important for building the BNEMDI model. To highlight the advantages of BiNE, we compare BiNE to three state-of-the-art graph representation methods and discuss their performance in different dimensions. In a similar way to BiNE, several state-of-the-art network embedding methods (i.e., DeepWalk (Perozzi et al., 2014), LINE (Tang et al., 2015), and node2vec (Grover and Leskovec, 2016)) are used to learn the embedding vectors of each node and compare to BiNE. DeepWalk carries out the random walk on the graph to generate node sequences, and the node sequences are regarded as sentences to learn embedding vectors by word2vec (Church, 2017). LINE combines the first-order and second-order proximities and optimizes them using the asynchronous stochastic gradient algorithm (ASGD) (Recht et al., 2011). Node2vec is an extension of DeepWalk. It introduces depth-first search (DFS) and breadth-first search (DFS) to the process of the random walk. BFS may explore the structural properties of the graph, and DFS may reflect the homogeneity between similar nodes. Based on the experiment, the best result may be obtained when hyper-parameters
Here, we analyze the performance of models in different dimensions of the node embedding vector. We have carried on the experiment to each embedding method separately in five different dimensions, 32, 64, 128, 256, and 512. We also employed these embedding approaches to learn the topological features from the bipartite network and combine the attribute features of drug compounds and miRNAs to construct this prediction model. Figure 6 shows the results of each model that was applied to the ncDR dataset. The y axis of Figure 6 depicts the AUC and AUPR of each prediction model, and the x-axis depicts five kinds of node-embedding dimensions. According to Figure 6, we can draw a conclusion that the model with the BiNE embedding method gets the best result among these methods. The main reason for the outstanding performance of BiNE is that it considers unique information of drug and miRNA nodes while processing the relations in the miRNA–drug bipartite network. BiNE calculates the second-order proximity of nodes in the miRNA–drug bipartite network to learn the implicit relation between drugs and miRNAs, which can get more efficient similarity compared with the similarities based on domain knowledge (Yue and He, 2021).
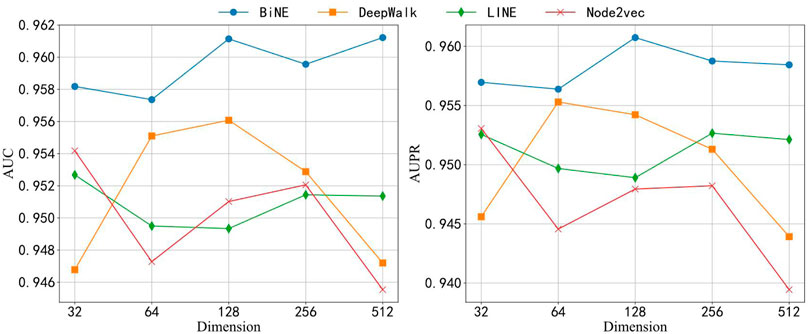
FIGURE 6. AUC and AUPR of four network embedding methods in different dimensions.
When the dimension of embedding vectors is 64, the BiNE model achieves the lowest AUC and PR values of 0.957 and 0.956, respectively. To avoid overfitting, the dimension of embedding vectors generated by the BiNE model was set to 64 in the subsequent experiments.
We further evaluate the impact of the classifier on the overall model by comparing it with several popular machine learning classifiers, including random forest (RF), naive Bayes (NB), logistics regress (LR), and SVM classifiers (Gui et al., 2015). The features extracted by the same method of the proposed model were used as the input of the aforementioned classifiers for five-fold cross-validations on the ncDR dataset.
Table 4 exhibits the average performance of the five-fold cross-validations of each classifier on the ncDR dataset. As shown in Table 4, NB, SVM, LR, and RF obtained an average accuracy of 86.49, 86.84, 87.56, and 88.38%, respectively. The BNEMDI achieved the highest accuracy of 88.75%. We gained an average AUC score of 0.9167, 0.9416, 0.9473, 0.9505, and 0.9573, and an average PR score of 94.27, 90.16, 94.40, 92.93, and 95.65% for NB, LR, RF, and BNEMDI. For a more intuitive comparison, Figure 7 depicts the corresponding ROC and PR curves. The proposed model leads in most evaluation metrics with the highest AUC of 0.9573 and the highest AURR of 0.9565 and has a relatively low standard deviation. Synthetically, BNEMDI not only has an excellent performance in various evaluation criteria but also is more stable than other classifiers.
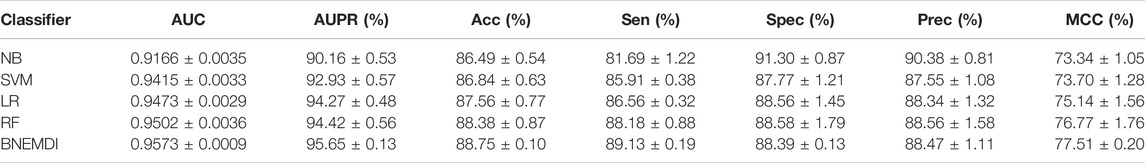
TABLE 4. Average performance of the different classifiers on ncDR datasets.
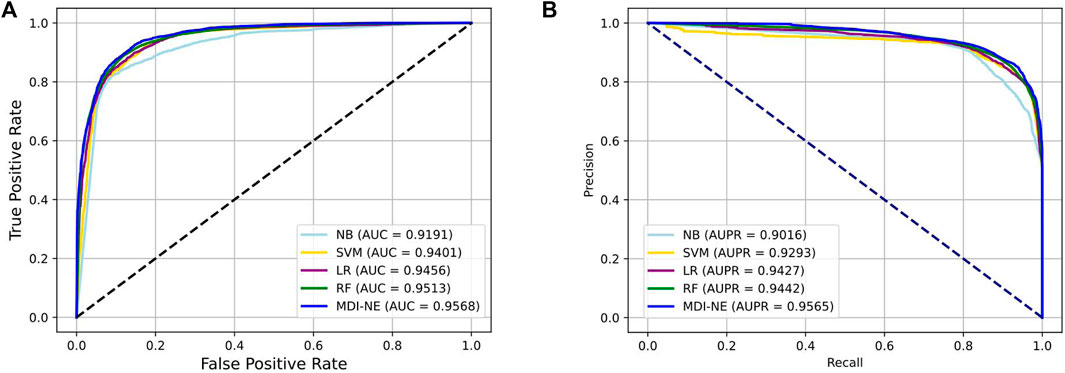
FIGURE 7. Comparison of BNEMDI with different classifiers under five-fold cross-validation. (A) ROC curve on the ncDR MDI dataset. (B) PR curve on the ncDR MDI dataset.
In this subsection, we carried out a case study on the RNAInter dataset. All of the known MDIs were used to construct representation vectors to predict all candidate miRNA–drug pairs in the dataset. Then, we ranked these candidate miRNA–drug pairs according to the predicted scores in the descending order. The top 30 predicted relationships are shown in Table 5. Among the top 10, 20, and 30 predicted relationships, 7, 12, and 18 relationships are verified by the previous literature in PubMed, respectively.
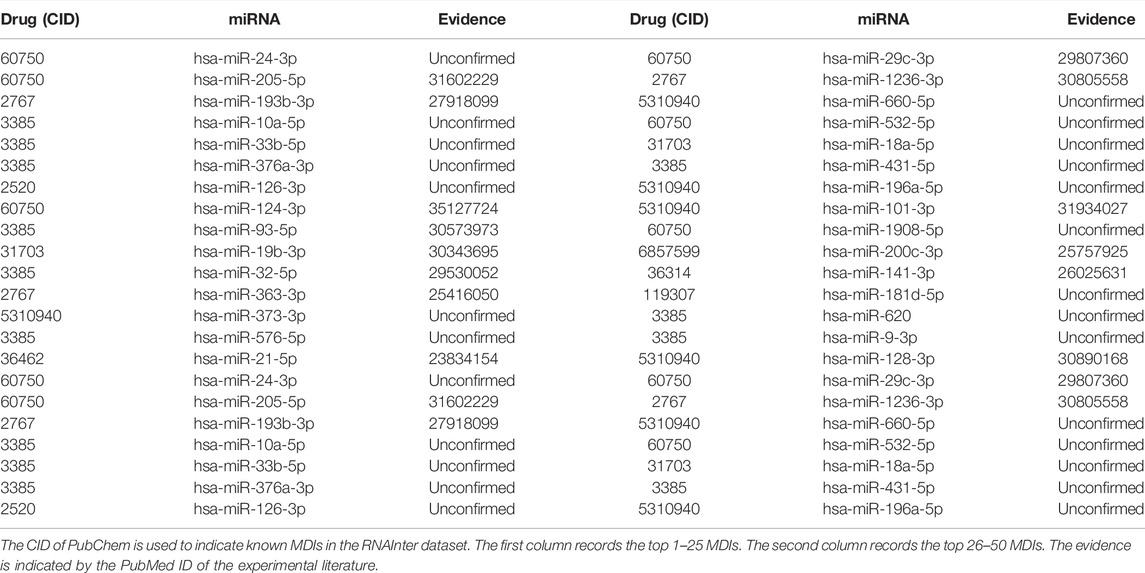
TABLE 5. Top 30 potential MDIs predicted by BNEMDI.
Furthermore, to demonstrate the prediction ability for new drugs, we selected 5-fluorouracil (5-FU, CID:3385) as the investigated drug of the case study, which is a chemotherapy drug widely used in digestive system cancer and breast cancer (Wigmore et al., 2010). The MDIs related to 5-FU were removed from the dataset and the rest of MDIs were used to train the prediction model. Then we implemented the BNEMDI model to identify potential miRNAs that may interact with 5-FU. The top 50 predicted miRNAs are shown in Table 6. Among the top 10, 20, and 50 predicted miRNAs, there were 9, 17, and 37 miRNAs, which confirmed that they may interact with 5-FU by the previous literature.
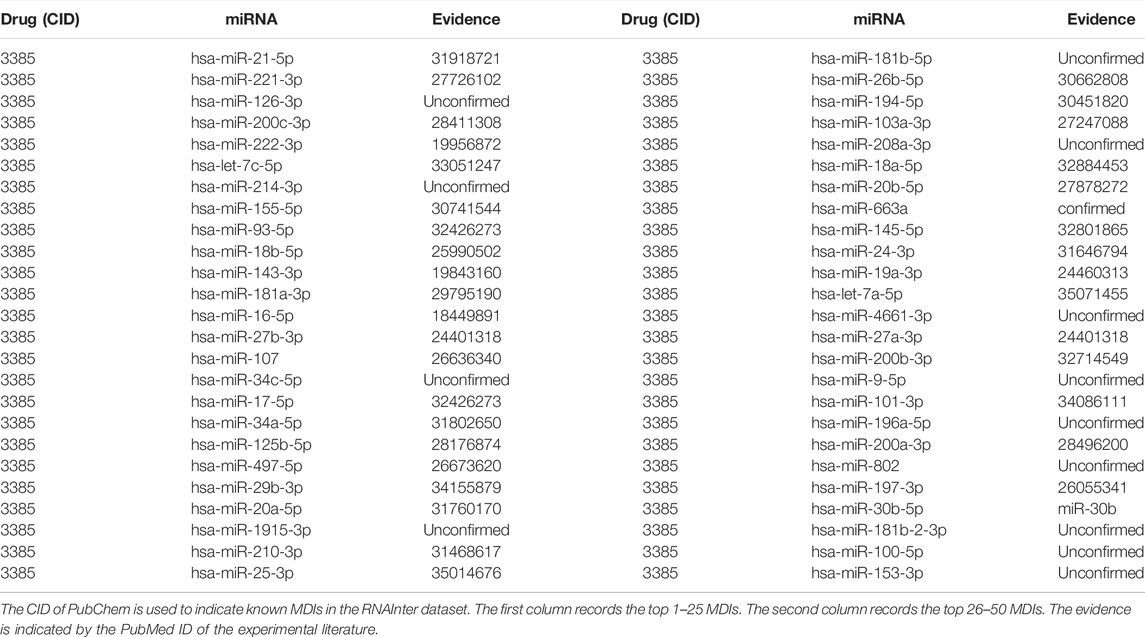
TABLE 6. Top 50 associated miRNA of drug 5-FU predicted by BNEMDI.
For instance, Valeri et al. discovered that miRNA-21-5p, which ranks first in the top 50 predicted miRNAs can downregulate the expression level of human DNA MutS homolog 2 leading to 5-FU resistance in colon cancer patients (Liang et al., 2020). Moreover, the study proposed by Zhao et al. (2016) confirmed the overexpression of hsa-miR-221-3p will reduce the sensitivity of 5-FU and proved it can be a potential drug target for pancreatic cancer (Zhao et al., 2016). Moreover, through functional analysis, Jilek et al. (2020) demonstrated that has-let-7c-5p can elevate the exposure of 5-FU. They suggested that has-let-7c-5p and 5-FU can attenuate thymidylate synthase, which indicates that 5-FU can cooperate with has-let-7c-5p against hepatocellular carcinoma (Jilek et al., 2020). As stated before, this case study shows that BNEMDI can effectively find out the miRNAs interacting with given drugs.
MDI prediction plays an important role in new drug target research. In this article, we proposed a novel computational model to predict unknown MDIs, namely, BNEMDI. We adopted a bipartite network embedding method BiNE to extract the topological feature from the MDI network. The chemical structure of drugs and the base sequence information of miRNAs are represented as the attribute feature by MACCS fingerprints and k-mer. When performed on five datasets (ncDR, RNAInter, SM2miR1, SM2miR2, and SM2miR3), BNEMDI gained average AUC values of 88.75, 87.23, 77.24, 79.92, and 81.86% under five-fold cross-validation, respectively. In addition, we experimented with other popular network embedding methods in different dimensions. Moreover, the case study on a common drug for cancer and all of the candidate miRNA–drug pairs demonstrated that the proposed model could be an effective tool for predicting MDI in real scenarios. The comprehensive results indicated that BNEMDI is a reliable and stable MDI predictor, economizing time and labor for drug target studies. Even so, the BNEMDI model possesses drawbacks. For new drugs and miRNAs, they are independent nodes in the bipartite network. The network embedding methods cannot learn any information from these independent nodes. Only attribute features can represent these nodes, and then the new interaction network can be updated according to the wet experimental results. In the future, we expect to seek more efficient network embedding methods and feature descriptors for mining the relationship between drugs and miRNAs.
Publicly available datasets were analyzed in this study. These data can be found at: http://www.jianglab.cn/ncDR/index.jsp (ncDR) http://www.jianglab.cn/SM2miR/ (SM2miR) http://www.rnainter.org/ (RNAInter).
Conceptualization, methodology, and software: Y-JG; validation and formal analysis: L-PL; investigation: Y-CL; resources: Z-HR; data curation and visualization: JP; writing—original draft preparation: JP; writing—review and editing: C-QY; supervision: Y-JG; project administration: Y-CL; funding acquisition: Z-HY All authors have read and agreed to the published version of the manuscript.
This work was supported by the Science and Technology Innovation 2030-New Generation Artificial Intelligence Major Project (No.2018AAA0100103) and in part by the NSFC Program, under Grant Nos. 61873212, 62072378, and 62002297.
The authors declare that the research was conducted in the absence of any commercial or financial relationships that could be construed as a potential conflict of interest.
All claims expressed in this article are solely those of the authors and do not necessarily represent those of their affiliated organizations, or those of the publisher, the editors, and the reviewers. Any product that may be evaluated in this article, or claim that may be made by its manufacturer, is not guaranteed or endorsed by the publisher.
The authors thank the reviewers for their valuable suggestions.
Bayraktar, R., Van Roosbroeck, K., and Reviews, M. (2018). miR-155 in Cancer Drug Resistance and as Target for miRNA-Based Therapeutics. Cancer Metastasis Rev. 37, 33–44. doi:10.1007/s10555-017-9724-7
Bentwich, I., Avniel, A., Karov, Y., Aharonov, R., Gilad, S., Barad, O., et al. (2005). Identification of Hundreds of Conserved and Nonconserved Human microRNAs. Nat. Genet. 37, 766–770. doi:10.1038/ng1590
Bommer, G. T., Gerin, I., Feng, Y., Kaczorowski, A. J., Kuick, R., Love, R. E., et al. (2007). p53-mediated Activation of miRNA34 Candidate Tumor-Suppressor Genes. Curr. Biol. 17, 1298–1307. doi:10.1016/j.cub.2007.06.068
Boutsidis, C., and Gallopoulos, E. (2008). SVD Based Initialization: A Head Start for Nonnegative Matrix Factorization. Pattern Recognit. 41, 1350–1362. doi:10.1016/j.patcog.2007.09.010
Cai, H., Zheng, V. W., Chang, K. C.-C., and Engineering, D. (2018). A Comprehensive Survey of Graph Embedding: Problems, Techniques, and Applications. IEEE Trans. Knowl. Data Eng. 30, 1616–1637. doi:10.1109/tkde.2018.2807452
Cao, D.-S., Liu, S., Xu, Q.-S., Lu, H.-M., Huang, J.-H., Hu, Q.-N., et al. (2012). Large-scale Prediction of Drug-Target Interactions Using Protein Sequences and Drug Topological Structures. Anal. Chim. Acta 752, 1–10. doi:10.1016/j.aca.2012.09.021
Cawley, S., Bekiranov, S., Ng, H. H., Kapranov, P., Sekinger, E. A., Kampa, D., et al. (2004). Unbiased Mapping of Transcription Factor Binding Sites along Human Chromosomes 21 and 22 Points to Widespread Regulation of Noncoding RNAs. Cell. 116, 499–509. doi:10.1016/s0092-8674(04)00127-8
Cereto-Massagué, A., Ojeda, M. J., Valls, C., Mulero, M., Garcia-Vallvé, S., and Pujadas, G. (2015). Molecular Fingerprint Similarity Search in Virtual Screening. Methods 71, 58–63. doi:10.1016/j.ymeth.2014.08.005
Dai, E., Yang, F., Wang, J., Song, Q., Weiwei, A., Lihong, W., et al. (2017). ncDR: a Comprehensive Resource of Non-coding RNAs Involved in Drug Resistance. 33, 4010–4011. doi:10.1093/bioinformatics/btx523
Deepthi, K., and Jereesh, A. S. (2021). An Ensemble Approach Based on Multi-Source Information to Predict Drug-MiRNA Associations via Convolutional Neural Networks. IEEE Access 9, 38331–38341. doi:10.1109/access.2021.3063885
Deng, H., Lyu, M. R., and King, I. (2009). “A Generalized Co-hits Algorithm and its Application to Bipartite Graphs,” in Proceedings of the 15th ACM SIGKDD international conference on Knowledge discovery and data mining, 239–248.
Dixon, S. J., and Stockwell, B. R. (2009). Identifying Druggable Disease-Modifying Gene Products. Curr. Opin. Chem. Biol. 13, 549–555. doi:10.1016/j.cbpa.2009.08.003
Erten-Ela, S., Kiristi, M., Varlec, A., Bozduman, F., Remskar, M., Oksuz, L., et al. (2018). Platinum-free Counter Electrodes of Plasma-Modified Hybrid Nanomaterials for Dye-Sensitised Solar Cells. Int. J. Sustain. Energy 37, 640–653. doi:10.1080/14786451.2017.1333995
Eyking, A., Reis, H., Frank, M., Gerken, G., Schmid, K. W., and Cario, E. (2016). MiR-205 and MiR-373 Are Associated with Aggressive Human Mucinous Colorectal Cancer. PLoS ONE 11, e0156871. doi:10.1371/journal.pone.0156871
Fleuren, W. W. M., and Alkema, W. (2015). Application of Text Mining in the Biomedical Domain. Methods 74, 97–106. doi:10.1016/j.ymeth.2015.01.015
Fu, X.-D. (2014). Non-coding RNA: a New Frontier in Regulatory Biology. Non-coding RNA a new Front. Regul. Biol. 1, 190–204. doi:10.1093/nsr/nwu008
Fu, Z., Wang, L., Li, S., Chen, F., Au-Yeung, K. K.-W., and Shi, C. J. F. I. P. (2021). MicroRNA as an Important Target for Anticancer Drug Development. Front. Pharmacol. 12, 2212. doi:10.3389/fphar.2021.736323
Gao, M., Chen, L., He, X., and Zhou, A. (2018). “Bine: Bipartite Network Embedding,” in The 41st international ACM SIGIR conference on research & development in information retrieval, 715–724.
Grover, A., and Leskovec, J. J. A. (2016). node2vec: Scalable Feature Learning for Networks. KDD 2016, 855–864. doi:10.1145/2939672.2939754
Gui, J., Liu, T., Tao, D., Sun, Z., and Tan, T. (2015). Representative Vector Machines: a Unified Framework for Classical Classifiers. IEEE Trans. Cybern. 46, 1877–1888. doi:10.1109/TCYB.2015.2457234
Guo, Z.-H., You, Z.-H., Li, L.-P., Chen, Z.-H., Yi, H.-C., and Wang, Y.-B. (2020). “Inferring Drug-miRNA Associations by Integrating Drug SMILES and MiRNA Sequence Information,” in International Conference on Intelligent Computing. Springer, 279–289. doi:10.1007/978-3-030-60802-6_25
Huang, Y.-A., Chan, K. C. C., and You, Z.-H. (2018). Constructing Prediction Models from Expression Profiles for Large Scale lncRNA-miRNA Interaction Profiling. 34, 812–819.doi:10.1093/bioinformatics/btx672
Huang, Y. A., Hu, P., Chan, K. C. C., and You, Z. H. (2020). Graph Convolution for Predicting Associations between miRNA and Drug Resistance. Bioinformatics 36, 851–858. doi:10.1093/bioinformatics/btz621
Ishida, M., and Selaru, F. M. (2013). miRNA-based Therapeutic Strategies. Curr. Pathobiol. Rep. 1, 63–70. doi:10.1007/s40139-012-0004-5
Iyer, M. K., Niknafs, Y. S., Malik, R., Singhal, U., Sahu, A., Hosono, Y., et al. (2015). The Landscape of Long Noncoding RNAs in the Human Transcriptome. Nat. Genet. 47, 199–208. doi:10.1038/ng.3192
Jiang, M., Cui, P., Yuan, N. J., Xie, X., and Yang, S. (2016). “Little Is Much: Bridging Cross-Platform Behaviors through Overlapped Crowds,” in Thirtieth AAAI Conference on Artificial Intelligence.
Jiang, Q., Wang, Y., Hao, Y., Juan, L., Teng, M., Zhang, X., et al. (2009). miR2Disease: a Manually Curated Database for microRNA Deregulation in Human Disease. Nucleic Acids Res. 37, D98–D104. doi:10.1093/nar/gkn714
Jilek, J. L., Tu, M.-J., Zhang, C., Yu, A.-M., and Disposition, (2020). Pharmacokinetic and Pharmacodynamic Factors Contribute to Synergism between Let-7c-5p and 5-fluorouracil in Inhibiting Hepatocellular Carcinoma Cell Viability. Drug Metab. Dispos. 48, 1257–1263. doi:10.1124/dmd.120.000207
Kang, J., Tang, Q., He, J., Li, L., Yang, N., Yu, S., et al. (2021). RNAInter v4.0: RNA Interactome Repository with Redefined Confidence Scoring System and Improved Accessibility. Nucleic Acids Res. 50 (D1), D326–D332. doi:10.1093/nar/gkab997
Kim, S., Chen, J., Cheng, T., Gindulyte, A., He, J., He, S., et al. (2021a). PubChem in 2021: New Data Content and Improved Web Interfaces. Nucleic Acids Res. 49, D1388–D1395. doi:10.1093/nar/gkaa971
Kleinberg, J. M. (1999). Authoritative Sources in a Hyperlinked Environment. J. ACM 46 (5), 604–632.
Kota, J., Chivukula, R. R., O'donnell, K. A., Wentzel, E. A., Montgomery, C. L., Hwang, H.-W., et al. (2009). Therapeutic microRNA Delivery Suppresses Tumorigenesis in a Murine Liver Cancer Model. Cell. 137, 1005–1017. doi:10.1016/j.cell.2009.04.021
Kozomara, A., Birgaoanu, M., and Griffiths-Jones, S. (2019). miRBase: from microRNA Sequences to Function. 47, D155–D162. doi:10.1093/nar/gky1141
Kurtz, S., Narechania, A., Stein, J. C., and Ware, D. (2008). A New Method to Compute K-Mer Frequencies and its Application to Annotate Large Repetitive Plant Genomes. BMC Genomics 9, 517–518. doi:10.1186/1471-2164-9-517
Li, M. M., Huang, K., and Zitnik, M. (2021). Representation Learning for Networks in Biology and Medicine: Advancements, Challenges, and Opportunities.
Liu, B., Shi, Y., Yuan, J., Hu, X., Zhang, H., Li, N., et al. (2013). Estimation of Genomic Characteristics by Analyzing K-Mer Frequency in De Novo Genome Projects.
Liang, G., Zhu, Y., Ali, D. J., Tian, T., Xu, H., Si, K., et al. (2020). Engineered Exosomes for Targeted Co-delivery of miR-21 Inhibitor and Chemotherapeutics to Reverse Drug Resistance in Colon Cancer. J. Nanobiotechnology 18, 10–15. doi:10.1186/s12951-019-0563-2
Liu, X., Wang, S., Meng, F., Zhang, Y., Wang, J., Dai, E., et al. (2013). SM2miR: a Database of the Experimentally Validated Small Molecules' Effects on microRNA Expression. Bioinformatics 29, 409–411. doi:10.1093/bioinformatics/bts698
Lv, Y., Wang, S., Meng, F., Yang, L., Wang, Z., Wang, J., et al. (2015). Identifying Novel Associations between Small Molecules and miRNAs Based on Integrated Molecular Networks. Bioinformatics 31, 3638–3644. doi:10.1093/bioinformatics/btv417
Matboli, M., Eissa, S., Ibrahim, D., Hegazy, M. G. A., Imam, S. S., and Habib, E. K. (2017). Caffeic Acid Attenuates Diabetic Kidney Disease via Modulation of Autophagy in a High-Fat Diet/Streptozotocin- Induced Diabetic Rat. Sci. Rep. 7, 2263–2312. doi:10.1038/s41598-017-02320-z
Pan, J., You, Z.-H., Li, L.-P., Huang, W.-Z., Guo, J.-X., Yu, C.-Q., et al. (2022). DWPPI: A Deep Learning Approach for Predicting Protein–Protein Interactions in Plants Based on Multi-Source Information with a Large-Scale Biological Network. Front. Bioeng. Biotechnol. 10. doi:10.3389/fbioe.2022.807522
Pan, J., You, Z.-H., Yu, C.-Q., Li, L.-P., and Zhan, X.-K. (2020). “Predicting Protein-Protein Interactions from Protein Sequence Information Using Dual-Tree Complex Wavelet Transform,” in International Conference on Intelligent Computing. Springer, 132–142. doi:10.1007/978-3-030-60802-6_13
Perozzi, B., Al-Rfou, R., and Skiena, S. (2014). “Deepwalk: Online Learning of Social Representations,” in Proceedings of the 20th ACM SIGKDD international conference on Knowledge discovery and data mining, 701–710.
Recht, B., Re, C., Wright, S., and Niu, F. (2011). Hogwild!: A Lock-free Approach to Parallelizing Stochastic Gradient Descent Adv. Neural. Inf. Process Syst. 24.
Su, X., and Khoshgoftaar, T. M. (20092009). A Survey of Collaborative Filtering Techniques. Adv. Artif. Intell. 2009, 1–19. doi:10.1155/2009/421425
Tang, J., Qu, M., Wang, M., Zhang, M., Yan, J., and Mei, Q. (2015). “Line: Large-Scale Information Network Embedding,” in Proceedings of the 24th international conference on world wide web, 1067–1077.
Wang, H., Cao, J., Shu, L., and Rafiei, D. (2013). “Locality Sensitive Hashing Revisited: Filling the Gap between Theory and Algorithm Analysis,” in Proceedings of the 22nd ACM international conference on Information & Knowledge Management, 1969–1978.
Weininger, D., and Sciences, C. (1988). SMILES, a Chemical Language and Information System. 1. Introduction to Methodology and Encoding Rules. J. Chem. Inf. Model. 28, 31–36. doi:10.1021/ci00057a005
Wigmore, P. M., Mustafa, S., El-Beltagy, M., Lyons, L., Umka, J., and Bennett, G. (2010). “Effects of 5-FU,” in Chemo Fog (Springer), 157–164. doi:10.1007/978-1-4419-6306-2_20
Xie, W. B., Yan, H., and Zhao, X. M. (2017). EmDL: Extracting miRNA-Drug Interactions from Literature. IEEE/ACM Trans. Comput. Biol. Bioinform 16, 1722–1728. doi:10.1109/TCBB.2017.2723394
Ya, H., P, H., Kcc, C., and You, Z-H. (2020). Graph Convolution for Predicting Associations between miRNA and Drug Resistance. Bioinformatics 36, 851–858. doi:10.1093/bioinformatics/btz621
Yi, H.-C., You, Z.-H., Guo, Z.-H., Huang, D.-S., and Chan, C. C. (2020). Learning Representation of Molecules in Association Network for Predicting Intermolecular Associations. IEEE/ACM Trans. Comput. Biol. Bioinforma. 18 (6), 2546–2554. doi:10.1109/tcbb.2020.2973091
Yousef, M., Khalifa, W., Acar, İ. E., and Allmer, J. (2017). MicroRNA Categorization Using Sequence Motifs and K-Mers. BMC Bioinforma. 18, 170–179. doi:10.1186/s12859-017-1584-1
Yu, L., Zhang, C., Pei, S., Sun, G., and Zhang, X. (2018). “Walkranker: A Unified Pairwise Ranking Model with Multiple Relations for Item Recommendation,” in Proceedings of the AAAI Conference on Artificial Intelligence.
Yue, Y., and He, S. J. B. B. (2021). DTI-HeNE: a Novel Method for Drug-Target Interaction Prediction Based on Heterogeneous Network Embedding. 22, 1–20.doi:10.1186/s12859-021-04327-w
Zhang, S., Cheng, Z., Wang, Y., and Han, T. (2021b). The Risks of miRNA Therapeutics: In a Drug Target Perspective. Drug Des. Dev. Ther. 15, 721–733. doi:10.2147/dddt.s288859
Zhang, S., Cheng, Z., Wang, Y., and Han, T. (2021). The Risks of miRNA Therapeutics: In a Drug Target Perspective. Drug Des. Devel Ther. Vol. 15, 721–733. doi:10.2147/dddt.s288859
Keywords: miRNA–drug interaction, BiNE, k-mer, MACCS fingerprint, deep neural network
Citation: Guan Y-J, Yu C-Q, Li L-P, You Z-H, Ren Z-H, Pan J and Li Y-C (2022) BNEMDI: A Novel MicroRNA–Drug Interaction Prediction Model Based on Multi-Source Information With a Large-Scale Biological Network. Front. Genet. 13:919264. doi: 10.3389/fgene.2022.919264
Received: 13 April 2022; Accepted: 30 May 2022;
Published: 15 July 2022.
Edited by:
Jia Meng, Xi’an Jiaotong-Liverpool University, ChinaReviewed by:
Stephen S.-T. Yau, Tsinghua University, ChinaCopyright © 2022 Guan, Yu, Li, You, Ren, Pan and Li. This is an open-access article distributed under the terms of the Creative Commons Attribution License (CC BY). The use, distribution or reproduction in other forums is permitted, provided the original author(s) and the copyright owner(s) are credited and that the original publication in this journal is cited, in accordance with accepted academic practice. No use, distribution or reproduction is permitted which does not comply with these terms.
*Correspondence: Li-Ping Li, Y3MyYmlvaW5mb3JtYXRpY3NAZ21haWwuY29t; Chang-Qing Yu, eGF5Y3FAMTYzLmNvbQ==
Disclaimer: All claims expressed in this article are solely those of the authors and do not necessarily represent those of their affiliated organizations, or those of the publisher, the editors and the reviewers. Any product that may be evaluated in this article or claim that may be made by its manufacturer is not guaranteed or endorsed by the publisher.
Research integrity at Frontiers
Learn more about the work of our research integrity team to safeguard the quality of each article we publish.