- College of Bioinformatics Science and Technology, Harbin Medical University, Harbin, China
Stomach, liver, and colon cancers are the most common digestive system cancers leading to mortality. Cancer leader genes were identified in the current study as the genes that contribute to tumor initiation and could shed light on the molecular mechanisms in tumorigenesis. An integrated procedure was proposed to identify cancer leader genes based on subcellular location information and cancer-related characteristics considering the effects of nodes on their neighbors in human protein–protein interaction networks. A total of 69, 43, and 64 leader genes were identified for stomach, liver, and colon cancers, respectively. Furthermore, literature reviews and experimental data including protein expression levels and independent datasets from other databases all verified their association with corresponding cancer types. These final leader genes were expected to be used as diagnostic biomarkers and targets for new treatment strategies. The procedure for identifying cancer leader genes could be expanded to open up a window into the mechanisms, early diagnosis, and treatment of other cancer types.
Introduction
Digestive system cancers represent an important cause of mortality worldwide. Of these cancer types, colon, liver, and stomach cancers are among the top five common leading causes of cancer deaths in the world according to the International Agency for Research on Cancer (https://www.iarc.who.int/wp-content/uploads/2020/12/pr292_E.pdf).
To better understand the molecular mechanisms of cancers and develop the paradigm and biomarkers of targeted anticancer therapies, it is critical to accurately identify important genes that contribute to cancer initiation and development (Tamborero et al., 2018; Colaprico et al., 2020). Several computational methods have been developed for finding these kinds of genes. Some of these methods rely on mutations in genomic data or expression data of cancer cell lines. For example, Bailey et al. (2018) performed a pan-cancer and pan software analysis on point mutations and small indels in cancer genomic datasets, identifying 299 cancer driver genes. Ding et al. (2021) gave a computational investigation on expression data of cancer cell lines and discovered a new set of potential biomarkers of different cancers. Other methods identify genes on the basis of their proximity to cancer genes from various evidence, such as biomolecular networks. Liu et al. (2022) employed a model-free computational method to not only identify the critical transition states of ten cancers but also provide new biomarkers from a network perspective. Nie et al. (2020) constructed a protein–protein interaction (PPI) network for differentially expressed genes (DEGs) between stomach cancer and normal tissues and identified ten hub genes highly related to stomach cancer. Furthermore, the Cox regression model showed high expression of five genes that were significantly associated with late-stage stomach cancer. Hu et al. (2020) discovered three most significant genes involved in liver cancer progression by examining signaling pathway networks. In a study by Zhao et al. (2019), a PPI network was constructed for DEGs of colon cancer patients, and the hub genes were identified as potential key genes. Based on related research studies on PPI networks and graph theory, it was assumed that a set of genes could affect the entire network by affecting the expression of their neighbor genes through interactions (Wuchty, 2014). Of these genes, those that were directly involved in the occurrence of cancer were defined as cancer leader genes in this article.
The subcellular location of gene products is fundamental for understanding their functions in biological processes (Su et al., 2020). Li et al. (2017) reported that dysregulation of USP9X, an integral component of centrosome and a requisite for centrosome biogenesis, contributed to centrosome amplification, chromosome instability, and breast cancer. TMEM106B is a transmembrane protein located on cellular lysosomes. Kundu et al. (2018) demonstrated that TMEM106B-induced lysosomes released active lysosomal cathepsins necessary for cancer cell invasion and metastasis. Thus, in this article, on the basis of the disease network obtained from PPI data, subcellular location-specific networks were constructed with the subcellular location information. Based on the definition of a leader gene set, a graph theory-based algorithm was proposed and used to recognize the candidate leader genes in each network. Then, cancer-related characteristics, including hallmarks, gene functions, and classification performance, were considered to identify cancer leader genes. The results of the disease network and the subcellular location-specific ones were compared. The union of the leader genes from all networks was the final result of this article. This integrated procedure was conducted on three digestive system cancers, namely, stomach cancer, liver cancer, and colon cancer, to identify their leader genes.
Materials and methods
The procedure of our article is shown in Figure 1, and the details are described in the following sections
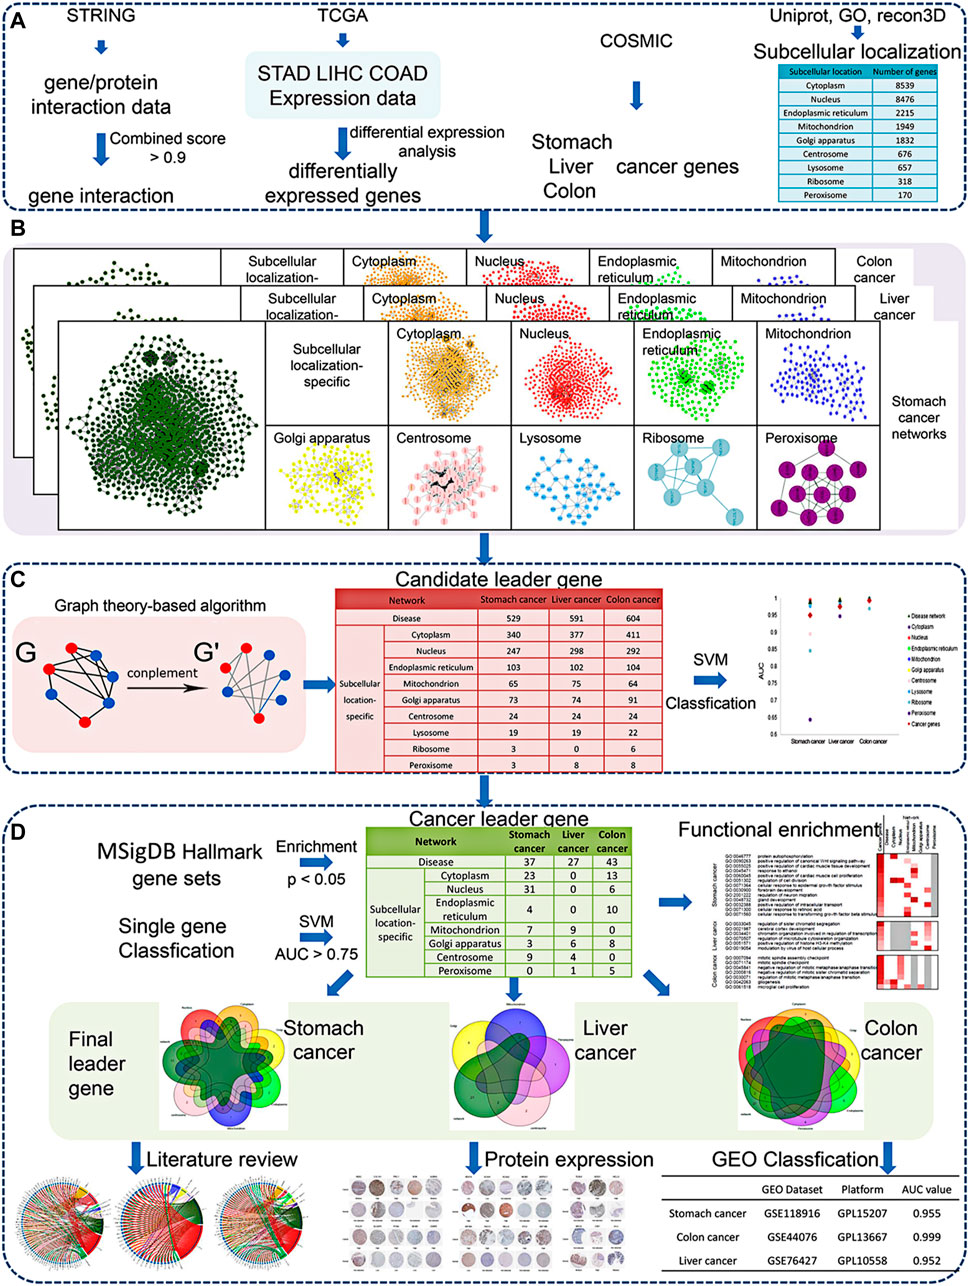
FIGURE 1. Workflow of our methodology. (A) Data sources. (B) Disease network construction. (C) Candidate leader gene recognition. (D) Leader gene identification and validation.
Data
In this study, publicly available expression data for stomach adenocarcinoma (STAD), liver hepatocellular carcinoma (LIHC), and colon adenocarcinoma (COAD) cohorts were obtained from The Cancer Genome Atlas (TCGA, https://portal.gdc.cancer.gov/) for analysis. The stomach cancer cohort contained 407 samples (375 cancer and 32 normal samples), liver cancer contained 424 samples (371 cancer and 53 normal samples), and colon cancer contained 521 samples (478 cancer and 43 normal samples). Differential expression analysis was performed using the DESeq2 R package (adjusted p-value <0.05 and |log2FC| > 1). Also, 5797, 5240, and 6645 DEGs were obtained for stomach, liver, and colon cancers, respectively.
PPI data were retrieved from the STRING database (https://string-db.org/) (Szklarczyk et al., 2019). A total of 392,028 interactions between 9,588 gene products with a combined score >0.9 were obtained. In the following sections, they were treated as gene interactions.
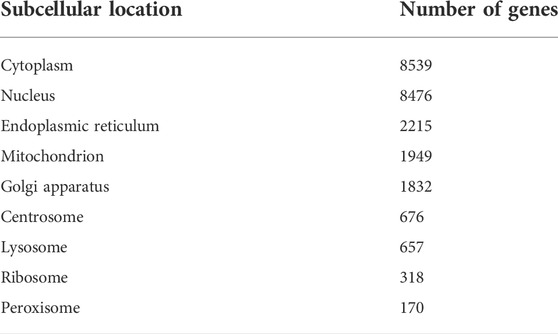
Gene subcellular location information was obtained from UniProt, Gene Ontology (GO, http://geneontology.org/) (Gene Ontology, 2021), and Recon3D (http://vmh.life) (Table 1) (Brunk et al., 2018). Genes located in nine main subcellular locations were used in this study.
Cancer genes were downloaded from the Cancer Gene Census (http://cancer.sanger.ac.uk/census) (Kundu et al., 2018). For stomach, liver, and colon cancers, 24, 13, and 15 genes were retrieved, respectively.
Disease and subcellular location-specific network construction
By using the gene interactions as edges and DEGs and cancer genes as nodes, a disease network for stomach cancer, liver cancer, and colon cancer was constructed. Considering gene subcellular location information, nine subcellular location-specific networks for each of these three cancer types were filtered out from the disease network by extracting interactions between genes of specific subcellular locations, respectively.
Candidate leader gene recognition
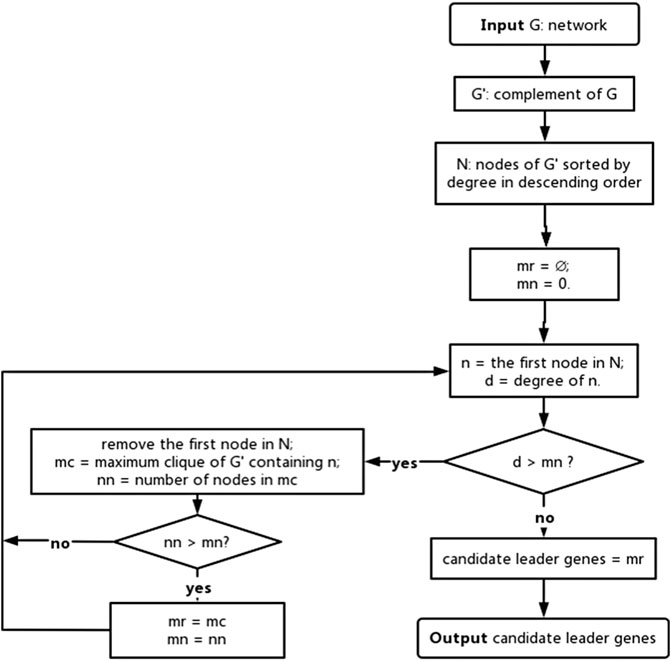
Cancer leader genes affect the entire network by influencing their neighbors in the network. The maximum independent dominant set in the graph theory has similar properties as leader genes in networks. Therefore, based on two theorems in the graph theory, the maximal independent set of a graph must be its minimal dominating set that affects the entire network, and the largest clique of a graph must be the largest independent set of its complement, which is a graph that has the same points as an original graph, and these points are connected by edges if and only if they are not connected by edges in the original graph. A graph theory-based algorithm was proposed to recognize genes that affect all nodes in the networks (Figure 2), which were referred to as candidate leader genes.
Leader gene identification and validation
Leader genes were identified from candidate genes based on cancer-related characteristics. On the one hand, cancer-related genes were supposed to affect primarily a handful of essential cellular functions, termed cancer hallmarks (Hanahan and Weinberg, 2000). Therefore, enrichment analysis was conducted on each candidate leader gene set recognized from the networks. Enrichment categories were cancer hallmarks (50 hallmark gene sets from the Molecular Signatures Database (MSigDB)) (Liberzon et al., 2015) and biological processes enriched by cancer genes. Gene functional annotation was carried out with the clusterProfiler R package.
On the other hand, cancer leader genes contributing to tumor initiation should be able to classify samples of cancer/normal status. Here, a support vector machine (SVM) classifier was built to distinguish between cancer and normal samples using the expression of leader genes for cancer/normal samples from TCGA data as features. A leave-one-out cross-validation (LOOCV) was used to evaluate the overall performance of the classifier. Then, a receiver operating characteristic (ROC) curve was plotted, and the value of the area under the curve (AUC) was calculated to evaluate the classification performance.
Final leader genes were identified as those enriched in cancer hallmarks and cancer-related functions (BH-adjusted p < 0.05) and had good classification performance (AUC >0.75). Final leader genes were evaluated using the literature review, which was searched in the PubMed database (https://pubmed.ncbi.nlm.nih.gov/). To demonstrate the clinical significance of final leader genes, expression differences for gene products and classification performance of final leader genes for other datasets were analyzed. Expression levels for proteins encoded by final leader genes were obtained from the Human Protein Atlas (HPA, https://www.proteinatlas.org/) database (Wang et al., 2020a), which is an online server containing the human transcriptomic and proteomic data in cells, tissues, and organs from human normal or pathological tissues via immunohistochemistry (IHC) (Uhlen et al., 2017). The pathology section of HPA shows the protein levels of cancer patients. Expression levels for proteins encoded by final leader genes in normal and cancer tissues could be obtained in HPA by using gene names as the search terms. The expressional levels of the gene products were denoted as high, medium, low, or not detected as the combination of staining intensity and fractions of stained cells based on immunohistochemical data. Expression values of final leader genes were also used to classify samples from three independent datasets from the Gene Expression Omnibus (GEO, https://www.ncbi.nlm.nih.gov/geo/) database (Barrett et al., 2013).
Results
Subcellular location-specific networks
Disease networks and subcellular location-specific networks for stomach, liver, and colon cancers were constructed by combining protein interaction data, DEGs, cancer genes, and gene subcellular location information (Table 2). The degree distribution for each of these networks approximated a power-law distribution (Figure 3), demonstrating the biological significance of these networks.
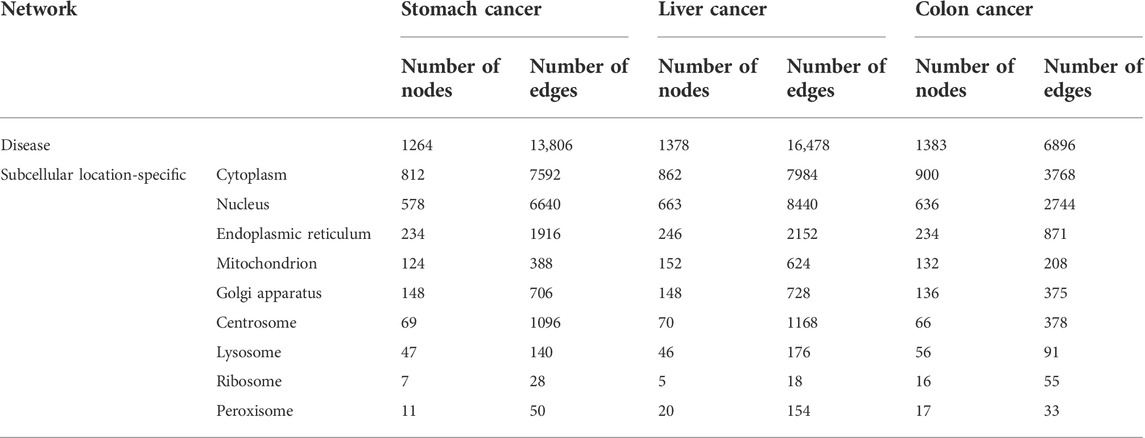
TABLE 2. Scale of disease and subcellular location-specific networks for stomach, liver, and colon cancers.
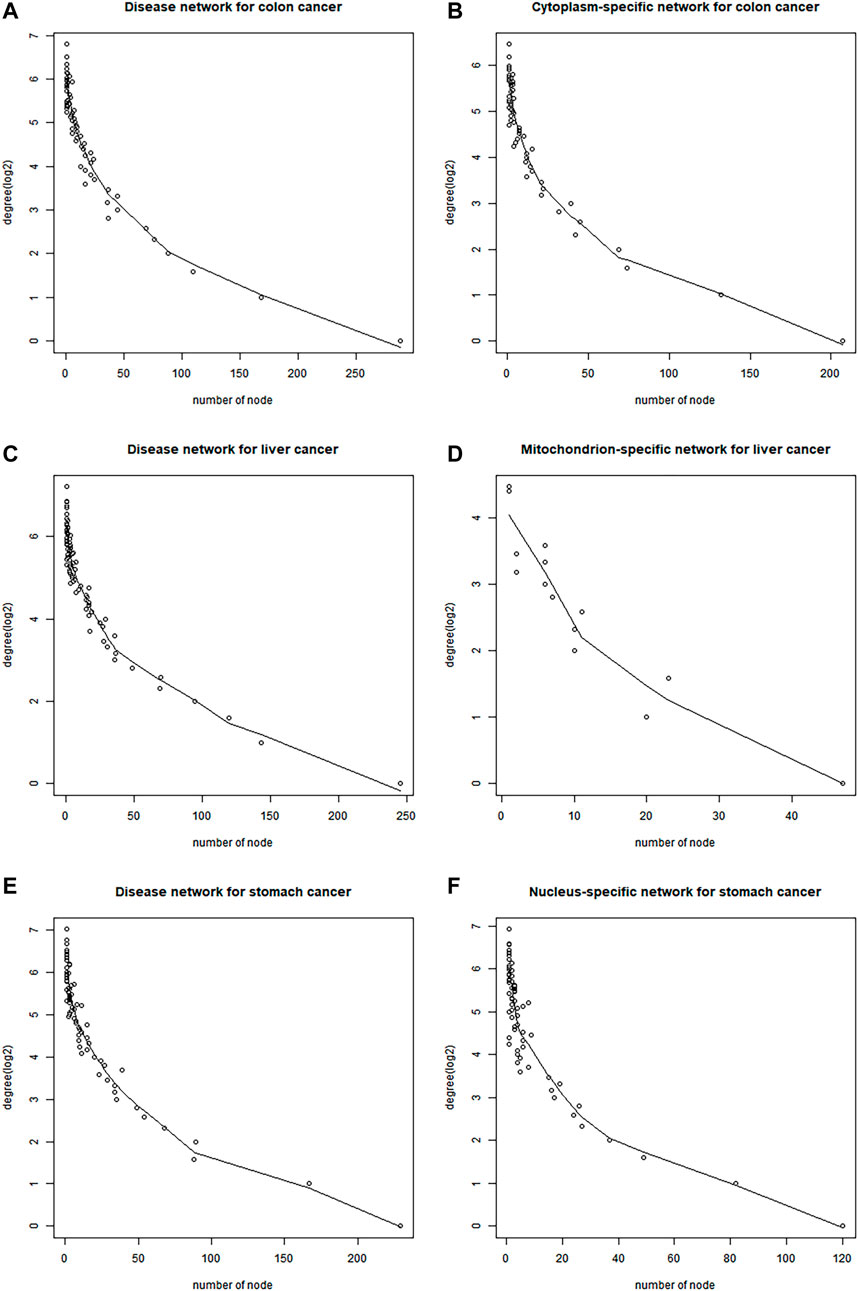
FIGURE 3. Degree distribution for part of disease networks and subcellular location-specific networks for stomach, liver, and colon cancers. (A) Disease network for colon cancer. (B) Cytoplasm-specific network for colon cancer. (C) Disease network for liver cancer. (D) Mitochondrion-specific network for liver cancer. (E) Disease network for stomach cancer. (F) Nucleus-specific network for stomach cancer.
Candidate leader genes from networks
The candidate leader genes of stomach, liver, and colon cancers were recognized as maximum independent dominant sets from the disease networks and subcellular location-specific networks (Table 3).
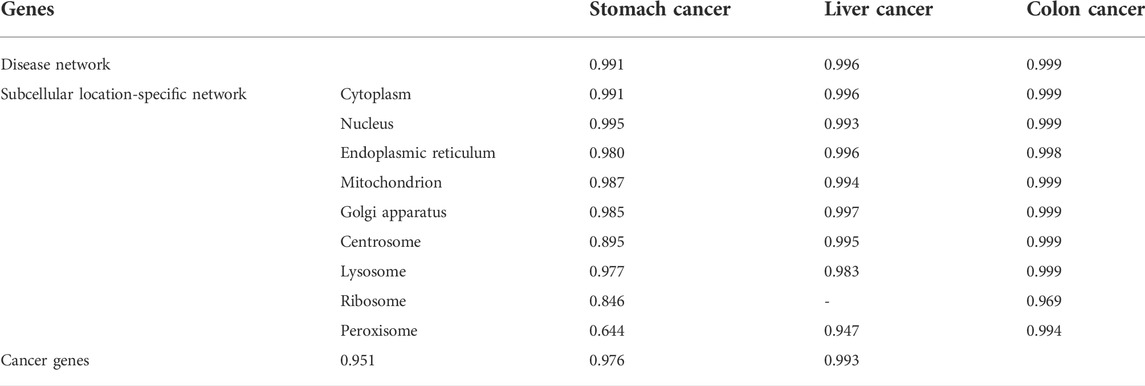
Expression values of candidate leader genes from each network were used as features for SVM classifiers to distinguish between cancer and normal samples. Classification performance was compared with that of cancer genes (Table 4). Most candidate leader genes from disease networks or subcellular location-specific networks could classify samples better than cancer genes and had a larger size.
Cancer leader genes from disease networks and subcellular location-specific networks
To reduce the size of candidate leader genes, further classification and enrichment analysis were performed to screen cancer leader genes as candidate leader genes that had good classification performance (AUC >0.75 in the SVM classifier) and enriched in cancer hallmarks (Table 5). Candidate leader genes from some subcellular location-specific networks were not enriched in cancer hallmarks; thus, no leader genes were screened out for them.
Leader genes from different networks were used to classify samples, and the performance was compared. It was demonstrated that genes from disease networks could classify samples better with a larger size. Cancer genes could also classify samples with better performance and larger size. Thus, random genes with the same number as leader genes from subcellular location-specific networks were selected from disease network leader genes and cancer genes to classify samples. Their classification performance was compared (Figure 4). For liver cancer and colon cancer, the performance of leader genes from subcellular location-specific networks was significantly better than that of cancer genes in all cases and better than that of genes from disease networks in most cases. However, for stomach cancer, only leader genes from the endoplasmic reticulum and Golgi apparatus-specific networks performed better than cancer genes or genes from disease networks.
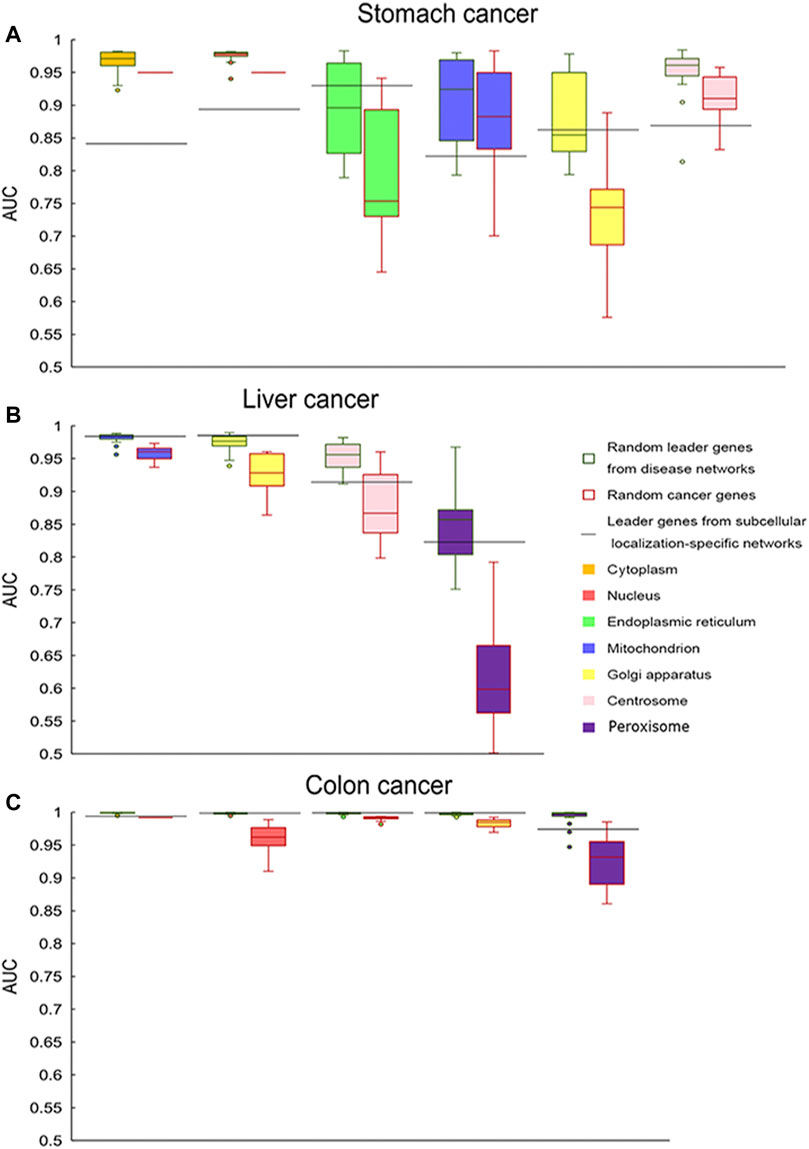
FIGURE 4. Classification comparison (AUC values) for three types of genes. Leader genes from subcellular location-specific networks are represented by horizontal lines, and random genes from disease networks and random cancer genes are represented by box plots. Different filled colors represent different subcellular locations. (A) Stomach cancer, (B) liver cancer, and (C) colon cancer.
Functions that were enriched by cancer genes were more related to their corresponding cancer types. Then, functional enrichment analysis was performed for leader genes from disease networks and subcellular location-specific networks (Figure 5). Compared with the leader genes obtained from disease networks, the genes obtained from subcellular location-specific networks were enriched in significantly more cancer-related functions. At the same time, compared with the leader genes obtained from subcellular location-specific networks, the genes obtained from disease networks were mostly enriched in ancestor functions. Therefore, it was speculated that the leader genes obtained from subcellular location-specific networks were more relevant to cancer-related functions.
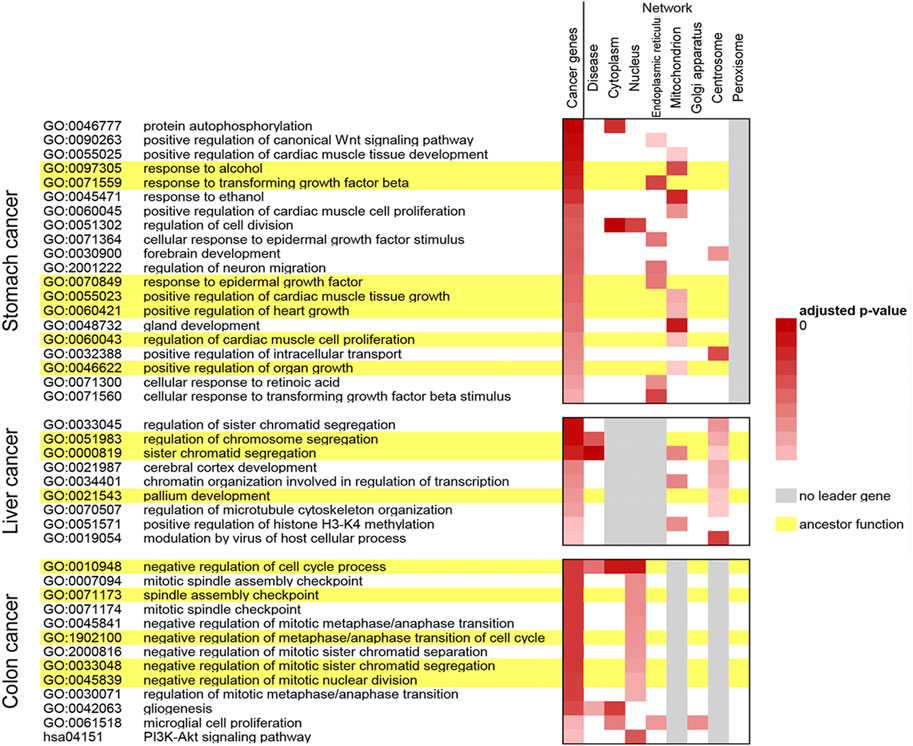
FIGURE 5. Functions enriched by cancer genes and leader genes from disease networks and from subcellular location-specific networks. Lines in yellow represent ancestor functions, and columns in gray represent networks with no final leader genes.
Furthermore, since each network has its own unique leader genes, the classification performance of unique leader genes from disease networks and from subcellular location-specific networks was compared for each cancer type. It was found that these unique genes either from disease networks or from subcellular location-specific networks had good classification performance (AUC >0.8 in the SVM classifier, Table 6).

TABLE 6. Classficiation performance of unique leader genes from disease networks and from subcellular location-specific networks.
Functions enriched by the unique leader genes from disease networks and subcellular location-specific networks were also compared. Some obvious differences have been found. For example, the cancer-related functions significantly enriched by unique leader genes from the disease network for stomach cancer, such as DNA metabolic process and DNA replication, were not significantly enriched by the results from subcellular location-specific networks. Meanwhile, functions enriched by unique leader genes from subcellular location-specific networks, including cell cycle process and organelle fission, were not enriched by those from the disease network.
Final cancer leader genes
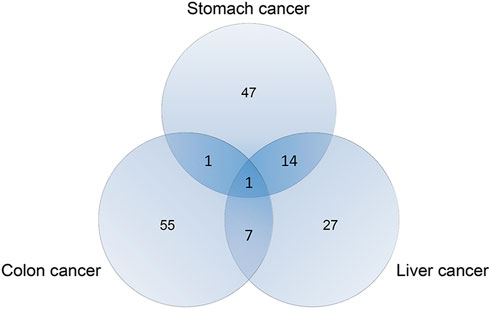
The aforementioned results verified that the leader genes of these networks complement each other. Thus, the final cancer leader genes were all genes identified from subcellular location-specific networks and from disease networks. A total of 69, 43, and 64 leader genes were identified for stomach, liver, and colon cancers, respectively (Figure 6, Supplementary Table S1).
To show the effectiveness of final leader genes, their performance in classifying cancer and control samples was evaluated, which was significantly better than that of cancer genes. This might be the result of the larger size of genes achieving better classification performance. Therefore, genes with the same number as cancer genes were randomly selected from the final leader genes, and their classification performance was also compared with cancer genes. Final leader genes and random genes had better performance, demonstrating the effectiveness of these final leader genes (Figure 7).
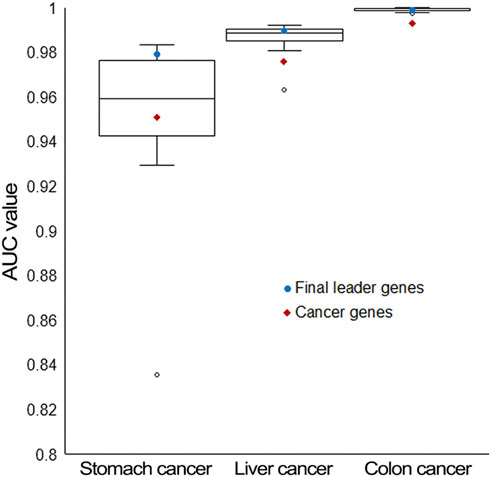
FIGURE 7. Classification performance comparison for three types of genes. Final leader genes are represented by blue dots, randomly selected final leader genes (the same number as cancer genes) are represented by box plots, and cancer genes are represented by red diamonds.
Validation of final leader genes was performed in three aspects, namely, literature review, expression difference for gene products, and classification performance for other datasets. First, a literature review was conducted for the final leader genes of three cancer types, respectively. Of these genes for each cancer type, 92.754% (54/69) were verified to be associated with stomach cancer, 95.349% (41/43) were associated with liver cancer, and 78.125% (50/64) were associated with colon cancer (Figure 8).
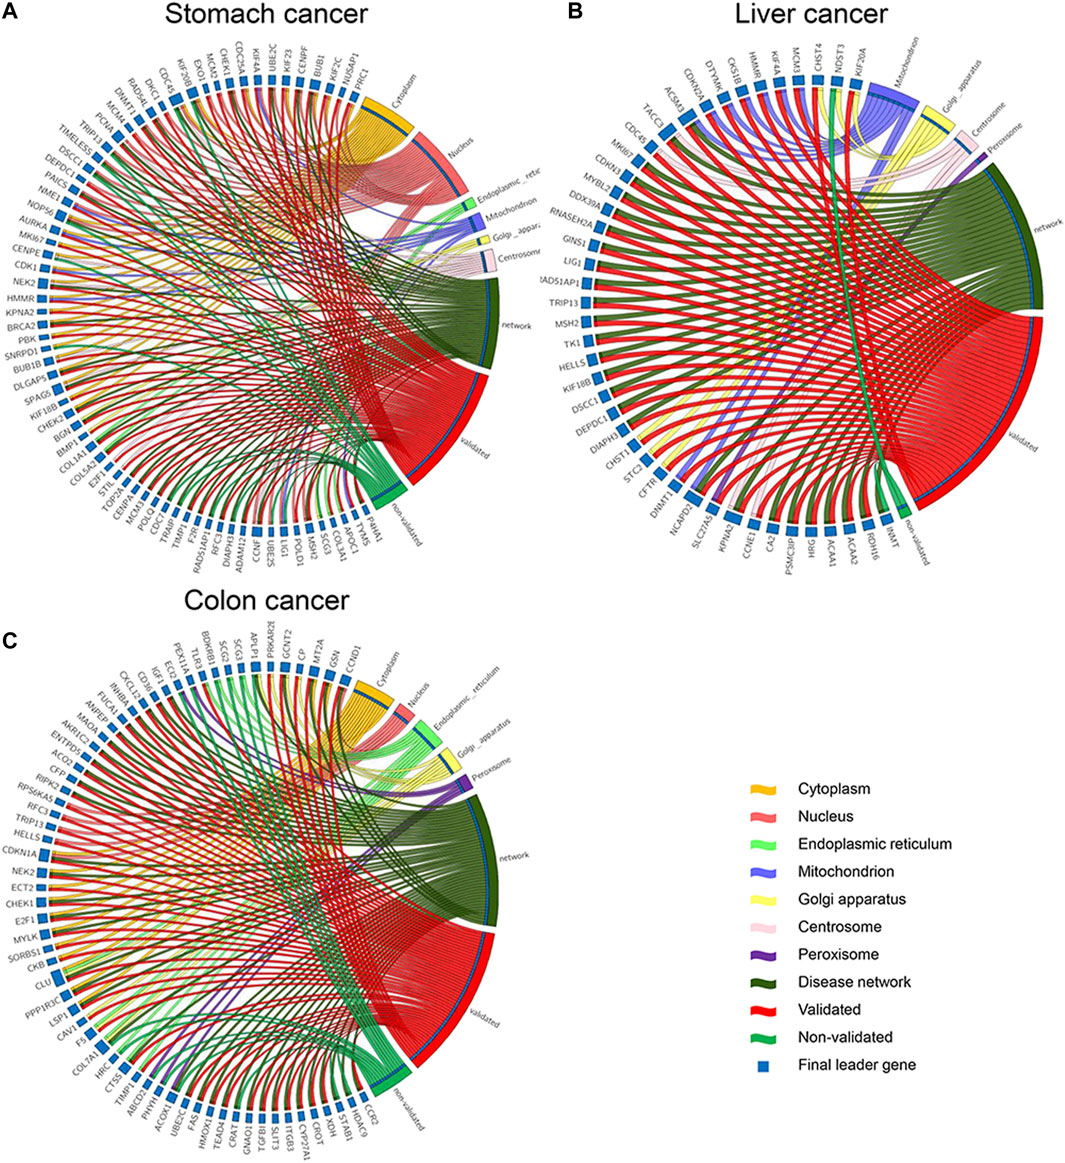
FIGURE 8. Literature review and subcellular location for final leader genes. Red represents validated and green represents for not validated genes. (A) Stomach cancer. (B) Liver cancer. (C) Colon cancer.
For all three cancer types, TRIP13 mainly located in the nucleus was identified as a common leader gene. Zhu et al. (2019) found that TRIP13 was the most prominent differentially expressed AAA ATPase gene and a promising candidate oncogene in liver cancer. In addition, the TRIP13 mRNA level was upregulated in peripheral blood in colon cancer tissues, thus making it a potential target for early-stage diagnosis (Soylemez et al., 2021). Nevertheless, no literature showed its association with stomach cancer, and further research is needed.
Twenty-two genes were identified as leader genes across two types of cancers, 16 (72.727%) of which were verified to be associated with corresponding cancers by the literature review. For example, MSH2 was a leader gene for both stomach and liver cancers. Germline MSH2 X314_splice variants contributed to carcinogenesis, prompting the consideration of other surgery and/or therapy methods for multiple stomach cancer patients (Wang et al., 2020b). Eso et al. (2016) demonstrated that inflammation-mediated dysregulation of MSH2 was a mechanism of genetic alterations during liver cancer development. RFC3 mutation and loss of RFC3 expression may contribute to the pathogenesis of stomach and colon cancers by deregulating DNA repair and replication (Kim et al., 2010), which was concordant with our result that RFC3 was identified as a leader gene for both stomach and colon cancers. Another gene HELLS was identified as a leader gene for liver and colon cancers. HELLS was reported to regulate chromatin remodeling and epigenetic silencing of multiple tumor suppressor genes in human liver cancer (Law et al., 2019). Alterations in HELLS recruitment and function could contribute to the somatic demethylation of SST1 repeat elements undergone before and/or during the pathogenesis of colon cancer (Samuelsson et al., 2017). Previous studies with recent genome-sequencing efforts have revealed there are a limited number of large-effect genes that participate in multiple cancer types (Rickel et al., 2017), which was consistent with our results. These common leader genes indicated that these three types of digestive system cancer might be associated with or have some common pathogenesis.
Other genes act as specific leader genes in one cancer type, and 82.171% of them were found related to a corresponding cancer type in the literature. Shimura et al. (2020) suggested that urinary levels of ADAM12 were a significantly independent diagnostic biomarker for stomach cancer, and a urinary biomarker panel containing ADAM12 significantly distinguished between cancer patients and normal samples. TACC3 promotes stemness and is a potential therapeutic target in hepatocellular carcinoma (Zhou et al., 2015). GNAO1 was found to be differentially expressed in colon cancer compared to normal samples and might be a potential colon cancer biomarker (Hauptman et al., 2019). These specific leader genes indicated that although these three types of digestive system cancer might be associated with or have some common pathogenesis, their pathogenic mechanisms still have many differences.
Some final leader genes were identified from multiple subcellular location-specific networks. One final leader gene for stomach cancer, CDC45, was identified from three subcellular location-specific networks and the disease network. Its main subcellular locations were the cytoplasm, nucleus, and centrosome. Two previous studies have found that CDC45 could promote some cancers by co-expressing with other genes (Hu et al., 2019; Lu et al., 2021). One final leader gene for colon cancer, CLU, was identified from the cytoplasm, endoplasmic reticulum, Golgi apparatus-specific networks, and the disease network. A previous study has found that the high mRNA expression level of CLU in colon cancer patients indicated a poor prognostic outcome (Artemaki et al., 2020).
Then, to demonstrate the clinical significance of final leader genes, we performed the analysis with experimental data from HPA and GEO. Alteration of protein expression levels for products of these final leader genes in cancer and normal condition was assessed. Expression levels for proteins encoded by final leader genes were obtained from the HPA database, in which 11, 5, and 9 final leader genes were not found for stomach, liver, and colon cancers, respectively. For other final leader genes, 39, 34, and 26 final leader genes for stomach, liver, and colon cancers, respectively, obtained from the HPA database showed the same up/downregulation direction as those from TCGA data (some significantly up/downregulated ones are shown in Figure 9), such as COL1A1, MCM3, and CAV1. Proteins encoded by HELLS were not expressed in normal tissues, whereas high expression levels were observed in both liver and colon cancer tissues. Protein expression levels of 13, 3, and 8 final leader genes for stomach, liver, and colon cancers, respectively, also changed between cancer and normal statuses, while they had an opposite regulation direction to TCGA.
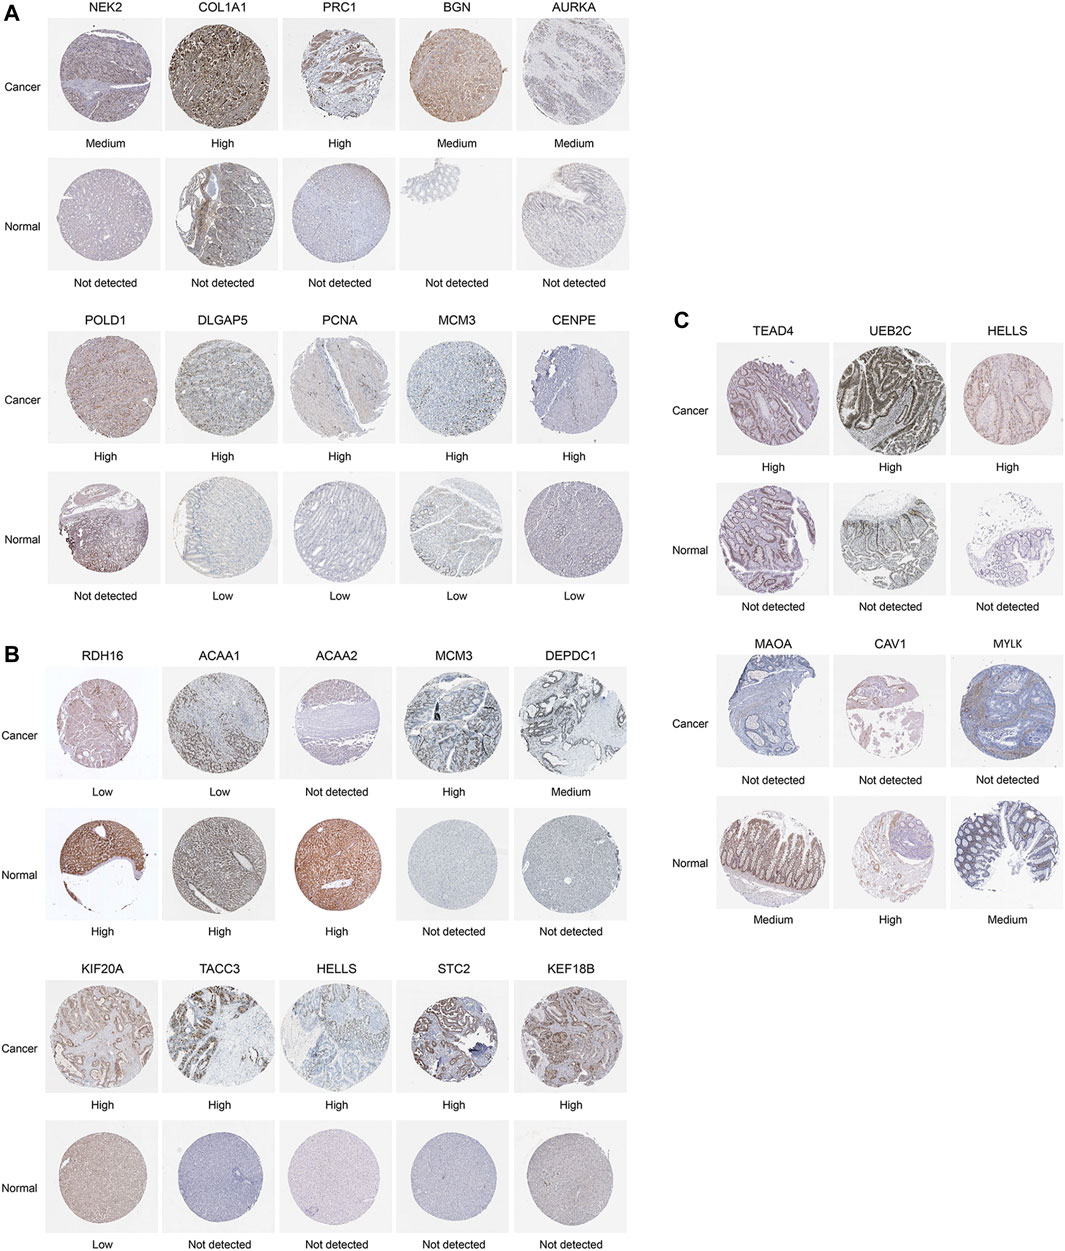
FIGURE 9. Images for part of final leader gene immunohistostaining between cancer tissues and normal tissues in the Human Protein Atlas database. (A) Stomach cancer. (B) Liver cancer. (C) Colon cancer. High, medium, low, or not detected represent the expressional levels of the gene products, whose difference meant expression difference for gene products.
Furthermore, expression values of final leader genes of three cancer types were used as features for SVM classifiers to classify samples from independent GEO datasets of different platforms for further validation. All final leader genes could distinguish between cancer and normal samples with high performance (AUC >0.95) (Table 7).
Validation of the aforementioned three aspects exhibited that part of final leader genes for stomach, liver, and colon cancers were related to corresponding cancer types. Since all of these genes could be used to classify different samples, genes without literature or altered regulation direction were also disease-related and could be used as diagnostic biomarkers. Further studies are still needed.
Moreover, the final leader genes identified by our integrated procedure were compared with the result genes of methods from Bailey et al. (2018), Ding et al. (2021), and Liu et al. (2022) according to the AUC values of SVM classifiers. The results of our genes and other methods all had good classification performance with no significant difference in terms of classification performance (Table 8). However, most genes of final leader genes could not be obtained by other methods, which were performed from different aspects, such as CDC45 and CLU. Therefore, the comparison with several latest methods demonstrated that the final leader genes identified by our integrated procedure would contribute to future digestive cancer research studies.

TABLE 8. Classification performance of the result genes used as features of SVM of the algorithm in this article and the latest existing algorithms.
Discussion
Colon, liver, and stomach cancers are among the top five most common causes of cancer death in the world. In this article, leader genes for these three digestive system cancer types were identified by our proposed procedure. First, disease and subcellular location-specific networks for these three cancer types were constructed, respectively. Candidate leader genes were recognized in these networks. Then, candidate leader genes enriched in cancer hallmarks and disease-related functions and able to distinguish between cancer and normal samples were identified as final leader genes.
In addition to classification performance for cancer and normal samples, the value of cancer genes manifests in predicting overall survival to reflect tumor progression at the molecular level, achieve individualized survival predictions, and guide clinical management. Thus, a univariate Cox regression analysis was performed to investigate the association between each final leader gene and the prognosis for patients with survival and clinical information in TCGA. About half (Hauptman et al., 2019) of stomach cancer final leader genes, most (65) of the liver cancer final leader genes, and only two colon cancer final leader genes were found to be significantly associated with survival (p < 0.05). The reason for some final leader genes identified in this article not being appropriate for prognosis prediction is probably that the networks were constructed using DEGs between cancer and normal samples rather than other prognosis-related genes. Taking prognosis into consideration and identifying prognosis-related genes will be a concern in our research in the future.
Unique genes from disease or subcellular location-specific networks have a good ability to distinguish between cancer and normal samples (AUC>0.8). However, these unique leader genes could not be obtained from other networks, which indicated that the leader genes obtained from different networks have a certain complementarity. These unique leader genes are involved in the occurrence of cancer and have their own unique role according to the networks they are located in. This could provide a certain reference for understanding the underlying mechanism of each subcellular region in cancer occurrence at the cellular level. The final leader genes obtained in this article are the union of the leader genes obtained from disease and subcellular location-specific networks. These genes could distinguish between cancer and normal samples with good performance (AUC>0.8). Furthermore, literature reviews, protein expression levels, and independent datasets all verified their association with corresponding cancer types. These final leader genes of digestive cancers are vital for understanding the molecular mechanisms responsible for the onset of these disorders. Identical genes may indicate the same pathogenesis.
A total of 69, 43, and 64 final leader genes for stomach, liver, and colon cancer, respectively, were identified in this article. Based on the Disease Ontology (https://disease-ontology.org/) database, six genes in the final leader genes of colon cancer were confirmed to be involved in the occurrence of colon cancer, such as CCND1, whose overexpression significantly increased the progression of cancer (Li et al., 2021), and CDKN1A, which is a tumor suppressor of colon cancer (Halaburková et al., 2017). Similarly, there are 8 genes in the final result of lung cancer that were confirmed to be involved in important processes in cancer. For example, DNMT1 interacted with NEAT1 to regulate cytotoxic T-cell infiltration in lung cancer via inhibition of the cGAS/STING pathway (Ma et al., 2020). Also, abnormal expression of CCNE1 is associated with cell cycle dysfunction (Zheng et al., 2019). Five genes in the final leader genes of stomach cancer play important roles in cancer. For instance, MKI67 is a potential indicator to predict the prognosis of patients with stomach cancer and identify high-risk cases (Guo et al., 2018), and TYMS may be potential biomarkers for prognosis and chemotherapy guidance for stomach cancer (Cao et al., 2017).
Although subcellular location information from databases was used to construct subcellular location-specific networks in this article, the subcellular location of genes/proteins might change or be influenced by many factors, affecting their functions and leading to diseases, including cancers. For example, colon cancer has been found related to many subcellular translocations of proteins (Hauptman et al., 2019). Therefore, early diagnosis of cancers can rely on not only the known subcellular location information of genes/proteins but also the change of subcellular locations between normal and cancer cells. Further research studies on subcellular location change will be essential to reveal other cancer leader genes.
Moreover, this is a study based on existing datasets using bioinformatics. A graph theory-based algorithm was used to recognize candidate leader genes in this study. In addition to the leader genes in this article, some genes might not only directly participate in cancer-related functions but only indirectly affect the expression of other cancer-related genes through the protein interaction network. Further extraction and study of these genes are also important for complementing the leader genes and understanding the underlying mechanisms of cancer in protein interaction networks. Our understanding of the roles these final leader genes play in the genesis of these cancer types is in its infancy. Some results require further experimental verification. We hope that there will be other databases and a large number of experiments to verify the feasibility of these final leader genes in the future and provide a reliable predictor and therapeutic target for digestive system cancer patients.
Conclusion
In summary, our study identified leader genes for three digestive system cancers, stomach, liver, and colon cancers, by application of a proposed graph theory-based algorithm to human PPI networks based on subcellular location information and further considering cancer-related characteristics. These final leader genes were believed to be an early signal in human carcinogenesis and to be potential cancer biomarkers. The integrated procedure proposed in this article for identifying cancer leader genes could be expanded to shed light on the mechanisms, early diagnosis, and treatment of other cancer types.
Data availability statement
The original contributions presented in the study are included in the article/Supplementary Material, and further inquiries can be directed to the corresponding author.
Author contributions
Conceptualization, WL and LC; data curation, HC, ZR, LG, HY, CL, MX, and ZZ; formal analysis, HC, ZR, and LG; funding acquisition, WL; investigation, HC; methodology, HC, WL and LC; project administration, WL and LC; supervision, WL and LC; validation, ZR, LG, HY, CL, MX, ZZ, JL, and YH; visualization, HC and WL; writing—original draft, HC and WL; writing—review and editing, LC.
Funding
This research was supported by the National Natural Science Foundation of China (grant numbers 61702141 and 81627901), the Natural Science Foundation of Heilongjiang Province (grant number LH 2021F043), the Heilongjiang Postdoctoral Funds for Scientific Research Initiation (grant number LBH-Q17132), and the Fundamental Research Funds for the Provincial Universities in Heilongjiang Province (grant number 2017-KYYWF-0303) (the Innovative Scientific Research Funding Project of Harbin Medical University (grant number 2017JCZX46).
Conflict of interest
The authors declare that the research was conducted in the absence of any commercial or financial relationships that could be construed as a potential conflict of interest.
Publisher’s note
All claims expressed in this article are solely those of the authors and do not necessarily represent those of their affiliated organizations, or those of the publisher, the editors, and the reviewers. Any product that may be evaluated in this article, or claim that may be made by its manufacturer, is not guaranteed or endorsed by the publisher.
Supplementary material
The Supplementary Material for this article can be found online at: https://www.frontiersin.org/articles/10.3389/fgene.2022.919210/full#supplementary-material
References
Artemaki, P. I., Sklirou, A. D., Kontos, C. K., Liosi, A. A., Gianniou, D. D., Papadopoulos, I. N., et al. (2020). High clusterin (CLU) mRNA expression levels in tumors of colorectal cancer patients predict a poor prognostic outcome. Clin. Biochem. 75, 62–69. doi:10.1016/j.clinbiochem.2019.10.008
Bailey, M. H., Tokheim, C., Porta-Pardo, E., Sengupta, S., Bertrand, D., Weerasinghe, A., et al. (2018). Comprehensive characterization of cancer driver genes and mutations. Cell. 173 (2), 1034–1035. e18. doi:10.1016/j.cell.2018.07.034
Barrett, T., Wilhite, S. E., Ledoux, P., Evangelista, C., Kim, I. F., Tomashevsky, M., et al. (2013). NCBI GEO: Archive for functional genomics data sets--update. Nucleic Acids Res. 41, D991–D995. doi:10.1093/nar/gks1193
Brunk, E., Sahoo, S., Zielinski, D. C., Altunkaya, A., Drager, A., Mih, N., et al. (2018). Recon3D enables a three-dimensional view of gene variation in human metabolism. Nat. Biotechnol. 36 (3), 272–281. doi:10.1038/nbt.4072
Cao, Y., Zhang, G., Wang, P., Zhou, J., Gan, W., Song, Y., et al. (2017). Clinical significance of UGT1A1 polymorphism and expression of ERCC1, BRCA1, TYMS, RRM1, TUBB3, STMN1 and TOP2A in gastric cancer. BMC Gastroenterol. 17 (1), 2. doi:10.1186/s12876-016-0561-x
Colaprico, A., Olsen, C., Bailey, M. H., Odom, G. J., Terkelsen, T., Silva, T. C., et al. (2020). Interpreting pathways to discover cancer driver genes with Moonlight. Nat. Commun. 11 (1), 69. doi:10.1038/s41467-019-13803-0
Ding, S., Li, H., Zhang, Y. H., Zhou, X., Feng, K., Li, Z., et al. (2021). Identification of pan-cancer biomarkers based on the gene expression profiles of cancer cell lines. Front. Cell. Dev. Biol. 9, 781285. doi:10.3389/fcell.2021.781285
Eso, Y., Takai, A., Matsumoto, T., Inuzuka, T., Horie, T., Ono, K., et al. (2016). MSH2 dysregulation is triggered by proinflammatory cytokine stimulation and is associated with liver cancer development. Cancer Res. 76 (15), 4383–4393. doi:10.1158/0008-5472.CAN-15-2926
Gene Ontology, C. (2021). The gene Ontology resource: Enriching a GOld mine. Nucleic Acids Res. 49 (D1), D325–D334. doi:10.1093/nar/gkaa1113
Guo, Y., Wang, M., Jia, X., Zhu, H., Zhi, Y., and Yuan, L. (2018). Wnt signaling pathway upregulates DNMT1 to trigger NHERF1 promoter hypermethylation in colon cancer. Oncol. Rep. 40 (2), 1165–1173. doi:10.3892/or.2018.6494
Halaburková, A., Jendželovský, R., Kovaľ, J., Herceg, Z., Fedoročko, P., and Ghantous, A. (2017). Histone deacetylase inhibitors potentiate photodynamic therapy in colon cancer cells marked by chromatin-mediated epigenetic regulation of CDKN1A. Clin. Epigenetics 9, 62. doi:10.1186/s13148-017-0359-x
Hanahan, D., and Weinberg, R. A. (2000). The hallmarks of cancer. Cell. 100 (1), 57–70. doi:10.1016/s0092-8674(00)81683-9
Hauptman, N., Jevsinek Skok, D., Spasovska, E., Bostjancic, E., and Glavac, D. (2019). Genes CEP55, FOXD3, FOXF2, GNAO1, GRIA4, and KCNA5 as potential diagnostic biomarkers in colorectal cancer. BMC Med. Genomics 12 (1), 54. doi:10.1186/s12920-019-0501-z
Hu, J. W., Ding, G. Y., Fu, P. Y., Tang, W. G., Sun, Q. M., Zhu, X. D., et al. (2020). Identification of FOS as a candidate risk gene for liver cancer by integrated bioinformatic analysis. Biomed. Res. Int. 2020, 6784138. doi:10.1155/2020/6784138
Hu, Y., Wang, L., Li, Z., Wan, Z., Shao, M., Wu, S., et al. (2019). Potential prognostic and diagnostic values of CDC6, CDC45, ORC6 and SNHG7 in colorectal cancer. Onco. Targets. Ther. 12, 11609–11621. doi:10.2147/OTT.S231941
Kim, Y. R., Song, S. Y., Kim, S. S., An, C. H., Lee, S. H., and Yoo, N. J. (2010). Mutational and expressional analysis of RFC3, a clamp loader in DNA replication, in gastric and colorectal cancers. Hum. Pathol. 41 (10), 1431–1437. doi:10.1016/j.humpath.2010.03.006
Kundu, S. T., Grzeskowiak, C. L., Fradette, J. J., Gibson, L. A., Rodriguez, L. B., Creighton, C. J., et al. (2018). TMEM106B drives lung cancer metastasis by inducing TFEB-dependent lysosome synthesis and secretion of cathepsins. Nat. Commun. 9 (1), 2731. doi:10.1038/s41467-018-05013-x
Law, C. T., Wei, L., Tsang, F. H., Chan, C. Y., Xu, I. M., Lai, R. K., et al. (2019). HELLS regulates chromatin remodeling and epigenetic silencing of multiple tumor suppressor genes in human hepatocellular carcinoma. Hepatology 69 (5), 2013–2030. doi:10.1002/hep.30414
Li, X., Song, N., Liu, L., Liu, X., Ding, X., Song, X., et al. (2017). USP9X regulates centrosome duplication and promotes breast carcinogenesis. Nat. Commun. 8, 14866. doi:10.1038/ncomms14866
Li, Z., Zhu, Z., Wang, Y., Wang, Y., Li, W., Wang, Z., et al. (2021). [Retracted] MicroRNA‑338‑3p suppresses tumor growth of esophageal squamous cell carcinoma in vitro and in vivo. Mol. Med. Rep. 24 (4), 810. doi:10.3892/mmr.2021.12450
Liberzon, A., Birger, C., Thorvaldsdottir, H., Ghandi, M., Mesirov, J. P., and Tamayo, P. (2015). The Molecular Signatures Database (MSigDB) hallmark gene set collection. Cell. Syst. 1 (6), 417–425. doi:10.1016/j.cels.2015.12.004
Liu, J., Ding, D., Zhong, J., and Liu, R. (2022). Identifying the critical states and dynamic network biomarkers of cancers based on network entropy. J. Transl. Med. 20 (1), 254. doi:10.1186/s12967-022-03445-0
Lu, H. P., Du, X. F., Li, J. D., Huang, S. N., He, R. Q., Wu, H. Y., et al. (2021). Expression of cell division cycle protein 45 in tissue microarrays and the CDC45 gene by bioinformatics analysis in human hepatocellular carcinoma and patient outcomes. Med. Sci. Monit. 27, e928800. doi:10.12659/MSM.928800
Ma, F., Lei, Y. Y., Ding, M. G., Luo, L. H., Xie, Y. C., and Liu, X. L. (2020). LncRNA NEAT1 interacted with DNMT1 to regulate malignant phenotype of cancer cell and cytotoxic T cell infiltration via epigenetic inhibition of p53, cGAS, and STING in lung cancer. Front. Genet. 11, 250. doi:10.3389/fgene.2020.00250
Nie, K., Shi, L., Wen, Y., Pan, J., Li, P., Zheng, Z., et al. (2020). Identification of hub genes correlated with the pathogenesis and prognosis of gastric cancer via bioinformatics methods. Minerva Med. 111 (3), 213–225. doi:10.23736/S0026-4806.19.06166-4
Rickel, K., Fang, F., and Tao, J. (2017). Molecular genetics of osteosarcoma. Bone 102, 69–79. doi:10.1016/j.bone.2016.10.017
Samuelsson, J. K., Dumbovic, G., Polo, C., Moreta, C., Alibes, A., Ruiz-Larroya, T., et al. (2017). Helicase lymphoid-specific enzyme contributes to the maintenance of methylation of SST1 pericentromeric repeats that are frequently demethylated in colon cancer and associate with genomic damage. Epigenomes 1 (1), 2. doi:10.3390/epigenomes1010002
Shimura, T., Dayde, D., Wang, H., Okuda, Y., Iwasaki, H., Ebi, M., et al. (2020). Novel urinary protein biomarker panel for early diagnosis of gastric cancer. Br. J. Cancer 123 (11), 1656–1664. doi:10.1038/s41416-020-01063-5
Soylemez, Z., Arikan, E. S., Solak, M., Arikan, Y., Tokyol, C., and Seker, H. (2021). Investigation of the expression levels of CPEB4, APC, TRIP13, EIF2S3, EIF4A1, IFNg, PIK3CA and CTNNB1 genes in different stage colorectal tumors. Turk. J. Med. Sci. 51 (2), 661–674. doi:10.3906/sag-2010-18
Su, R., He, L., Liu, T., Liu, X., and Wei, L. (2020). Protein subcellular localization based on deep image features and criterion learning strategy. Brief. Bioinform. 22, bbaa313. doi:10.1093/bib/bbaa313
Szklarczyk, D., Gable, A. L., Lyon, D., Junge, A., Wyder, S., Huerta-Cepas, J., et al. (2019). STRING v11: Protein-protein association networks with increased coverage, supporting functional discovery in genome-wide experimental datasets. Nucleic Acids Res. 47 (D1), D607–D13. doi:10.1093/nar/gky1131
Tamborero, D., Rubio-Perez, C., Deu-Pons, J., Schroeder, M. P., Vivancos, A., Rovira, A., et al. (2018). Cancer Genome Interpreter annotates the biological and clinical relevance of tumor alterations. Genome Med. 10 (1), 25. doi:10.1186/s13073-018-0531-8
Uhlen, M., Zhang, C., Lee, S., Sjostedt, E., Fagerberg, L., Bidkhori, G., et al. (2017). A pathology atlas of the human cancer transcriptome. Science 357 (6352), eaan2507. doi:10.1126/science.aan2507
Wang, A., Li, Z., Wang, M., Jia, S., Chen, J., Ji, K., et al. (2020). Molecular characteristics of synchronous multiple gastric cancer. Theranostics 10 (12), 5489–5500. doi:10.7150/thno.42814
Wang, X., Duanmu, J., Fu, X., Li, T., and Jiang, Q. (2020). Analyzing and validating the prognostic value and mechanism of colon cancer immune microenvironment. J. Transl. Med. 18 (1), 324. doi:10.1186/s12967-020-02491-w
Wuchty, S. (2014). Controllability in protein interaction networks. Proc. Natl. Acad. Sci. U. S. A. 111 (19), 7156–7160. doi:10.1073/pnas.1311231111
Zhao, B., Baloch, Z., Ma, Y., Wan, Z., Huo, Y., Li, F., et al. (2019). Identification of potential key genes and pathways in early-onset colorectal cancer through bioinformatics analysis. Cancer control. 26 (1), 1073274819831260. doi:10.1177/1073274819831260
Zheng, C., Li, X., Ren, Y., Yin, Z., and Zhou, B. (2019). Long noncoding RNA RAET1K enhances CCNE1 expression and cell cycle arrest of lung adenocarcinoma cell by sponging miRNA-135a-5p. Front. Genet. 10, 1348. doi:10.3389/fgene.2019.01348
Zhou, D. S., Wang, H. B., Zhou, Z. G., Zhang, Y. J., Zhong, Q., Xu, L., et al. (2015). TACC3 promotes stemness and is a potential therapeutic target in hepatocellular carcinoma. Oncotarget 6 (27), 24163–24177. doi:10.18632/oncotarget.4643
Keywords: cancer leader gene, digestive system cancer, protein–protein interaction network, subcellular location, cancer-related characteristics
Citation: Chen H, Rong Z, Ge L, Yu H, Li C, Xu M, Zhang Z, Lv J, He Y, Li W and Chen L (2022) Leader gene identification for digestive system cancers based on human subcellular location and cancer-related characteristics in protein–protein interaction networks. Front. Genet. 13:919210. doi: 10.3389/fgene.2022.919210
Received: 23 May 2022; Accepted: 29 August 2022;
Published: 26 September 2022.
Edited by:
Shihai Liu, The Affiliated Hospital of Qingdao University, ChinaReviewed by:
Apichat Suratanee, King Mongkut’s University of Technology North Bangkok, ThailandHailin Chen, East China Jiaotong University, China
Copyright © 2022 Chen, Rong, Ge, Yu, Li, Xu, Zhang, Lv, He, Li and Chen. This is an open-access article distributed under the terms of the Creative Commons Attribution License (CC BY). The use, distribution or reproduction in other forums is permitted, provided the original author(s) and the copyright owner(s) are credited and that the original publication in this journal is cited, in accordance with accepted academic practice. No use, distribution or reproduction is permitted which does not comply with these terms.
*Correspondence: Wan Li, bGl3YW5AaHJibXUuZWR1LmNu; Lina Chen, Y2hlbmxpbmFAZW1zLmhyYm11LmVkdS5jbg==
 Hongwei Chen
 Zherou Rong
 Junjie Lv
 Wan Li
 Lina Chen