 Liwen Wu
 Song Gao
 Shaowen Yao1,2
 Feng Wu
 Jie Li
 Yunqi Zhang
- 1Engineering Research Center of Cyberspace, Yunnan University, Kunming, China
- 2School of Software, Yunnan University, Kunming, China
- 3Yunnan Key Laboratory of Statistical Modeling and Data Analysis, School of Mathematics and Statistics, Yunnan University, Kunming, China
Identifying the subcellular localization of a given protein is an essential part of biological and medical research, since the protein must be localized in the correct organelle to ensure physiological function. Conventional biological experiments for protein subcellular localization have some limitations, such as high cost and low efficiency, thus massive computational methods are proposed to solve these problems. However, some of these methods need to be improved further for protein subcellular localization with class imbalance problem. We propose a new model, generating minority samples for protein subcellular localization (Gm-PLoc), to predict the subcellular localization of multi-label proteins. This model includes three steps: using the position specific scoring matrix to extract distinguishable features of proteins; synthesizing samples of the minority category to balance the distribution of categories based on the revised generative adversarial networks; training a classifier with the rebalanced dataset to predict the subcellular localization of multi-label proteins. One benchmark dataset is selected to evaluate the performance of the presented model, and the experimental results demonstrate that Gm-PLoc performs well for the multi-label protein subcellular localization.
1 Introduction
Proteins are the crucial material basis of life activities, which participate in various biological activites (Qu et al., 2019). Previous researches show that almost all life phenomena are closely related to the structure and function of proteins, and the correct subcellular localization of proteins can assist biologists in understanding proteins (Wei et al., 2018; Zhang et al., 2021). Simultaneously, the subcellular localization of proteins also plays an essential role in disease diagnosis, drug design, and other biological researches (Li et al., 2020; Wang et al., 2021). Biological experiments (Murphy et al., 2000) were widely used to annotate protein subcellular localizations in the early stage of research. However, the cost of such conventional experiments is expensive (Yu B. et al., 2017; Liu et al., 2021). Therefore, the machine learning methods are introduced to solve the problems mentioned above, and have good results in protein subcellular localization (Wan et al., 2017), genomic island detection (Dai et al., 2018; Kong et al., 2020; Onesime et al., 2021) and so on. The machine learning based protein subcellular localization methods aim to learn the mapping relationship between protein and subcellular localization, so as to accurately predict the subcellular location of a given protein. According to the different forms of protein data, these methods can be divided into two categories: the sequence-based and the image-based.
1) The core idea of the sequence-based methods is to extract the feature information of each protein and build the classifier. One protein sequence is generally composed of 20 amino acids, and it is particularly important to extract the feature information of protein sequences. Therefore, some correlation methods concerning feature extraction have been proposed. Nakashima et al. introduced the amino acid composition (AAC) to represent features of proteins (Nakashima and Nishikawa, 1994), and each protein was digitized into a 20-dimensional vector, where each value represents the percentage of amino acids. AAC can express the global feature of amino acids, but it ignores the sequence of amino acids and the interaction between residues. In order to solve this problem, Petrilli et al. proposed the dipeptide composition (Petrilli, 1993), which comprehensively considered the relationship between amino acids. However, the physicochemical characteristics of amino acids have been ignored in the above methods. Therefore, Chou et al. proposed the pseudo-amino acid composition (PseAAC) (Chou, 2001) included the physicochemical characteristics and the order information of amino acids, which has been applied in predicting various protein attributes, such as protein subchloroplast locations (Sun and Du, 2021), protein sub-Golgi locations (Zhao et al., 2019) and so on. With further research, researchers leveraged the position specific score matrix (PSSM) to extract the evolutionary information of proteins. PSSM is the most commonly used method for the single feature representation. For the purpose of obtaining more rich information about protein sequences, the above mentioned methods of single feature representation have been fused to get the integrated information of proteins (Zakeri et al., 2011; Li et al., 2019; Liu et al., 2019; Ding et al., 2020).
2) The image-based methods construct the classification model with biological images, and the biological images mentioned here include Immunofluorescence (IF) and Immunohistochemistry (IHC) (Hu et al., 2021). There are some non-informative regions in the biological images, such as stroma, debris and background, the channel separation of DNA and protein is usually used to remove thus redundant information (Xu et al., 2019). With the continuous deepening of relevant researches, the neural network is introduced to extract the feature information of biological images. Long et al. proposed a new image-based method ImPloc for protein subcellular localization in 2020, and ImPloc used the convolutional neural network and transfer learning to extract feature information (Long et al., 2019). In the same year, Su et al. extracted feature information of biological images through five widely used neural network models, and achieved good research results (Su et al., 2020).
No matter what the form of protein data is, the ultimate aim is to accurately predict the subcellular localization based on relevant protein data. Research shows that a protein is usually located in one or more subcellular localizations (Xu et al., 2013; Cheng et al., 2019; Zhang et al., 2021; Shen et al., 2020), thus, the subcellular localization of these proteins can be abstracted to a multi-label classification. There are some classification models have been introduced or proposed, such as support vector machine (SVM) (Xu et al., 2009; Zhao et al., 2019; Yang et al., 2020; Sun and Du, 2021), deep neural networks (Semwal and Varadwaj, 2020; Su et al., 2020; Wang et al., 2021) and so on. The above methods are dedicated to improving the prediction accuracy of the subcellular localization from the aspects of feature representation and model construction, but some of these models have some limitations when dealing with the class imbalance problem. Due to the characteristics of protein data and environmental influences, the distribution of proteins annotated with subcellular localization is generally imbalanced, which means the number of proteins belonging to one subcellular localization is far less than that of others. The class imbalance problem of protein data seriously affects the model performance, especially when proteins have multiple subcellular localizations, and the conventional methods based on oversampling are difficult to handle the multiclass imbalanced problems effectively, such as the synthetic minority oversampling technique (SMOTE) (Buda et al., 2018). These methods alleviate data imbalance by inserting new samples between minority classes based on the sample spacing, which will further aggravate the problems of sample stacking and poor diversity.
For the mentioned problems, we propose a new model called Gm-PLoc to predict the subcellular localization of multi-label proteins in this paper. Firstly, PSSM is used to extract the evolutionary features (Gong et al., 2021). Secondly, a new method called generative adversarial networks for synthesizing minority samples (SM-GAN) is put forward based on generative adversarial networks (GAN), and then the PSSM of each protein will be fed into SM-GAN for rebalancing the dataset. Finally, a classification model called multi-label deep factorization machine (ML-DeepFM) is proposed to predict the subcellular localization of proteins based on deep factorization machine (DeepFM). For evaluating the performance of Gm-PLoc, we perform 10 fold cross validation on the benchmark dataset, and experimental results show that Gm-PLoc can effectively predict the subcellular localization of multi-label proteins.
The following content is arranged as follows. In Section 2, the proposed model Gm-PLoc will be introduced in detail. Section 3 provides a detailed analysis of the experimental results of Gm-PLoc on a benchmark dataset. The last is a summary of this paper and prospects for our future work.
2 Materials and Methodology
2.1 Benchmark Dataset
In this work, a benchmark dataset of human proteins (Shen and Chou, 2009) is utilized to evaluate the Gm-PLoc, which is collected from the Swiss-Port database with strict screening. This dataset contains 3,106 distinct samples from 14 classes, and the similarity between protein samples is less than 25% in each class. In the dataset, 2,580 samples belong to one location, 480 samples belong to two locations, 43 samples belong to three locations, and remaining 3 samples belong to 4 locations. Meanwhile, there is a vast difference in the sample size of each location. More dataset details can be found at http://www.csbio.sjtu.edu.cn/bioinf/hum-multi-2/Data.htm.
2.2 Overview of Gm-PLoc
Gm-PLoc is proposed to predict the subcellular localization of multi-label proteins, which can handle the multiclass imbalanced problem. The construction of this model includes two processes: model training and model testing, as shown in Figure 1.
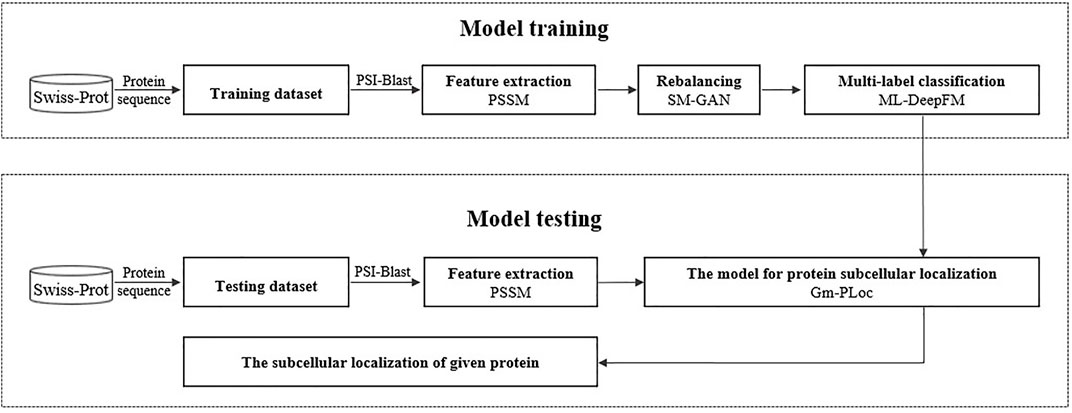
FIGURE 1. Predicting subcellular localization of a given protein by Gm-PLoc.
During the model training process, we use PSSM to extract features from protein sequences, then utilize a specially designed GAN called SM-GAN to synthesize pseudo samples for minority classes, and finally construct a multi-label classifier called ML-DeepFM with improved DeepFM for the protein subcellular localization. In the model testing, a given protein is fed into Gm-PLoc, and its relevant subcellular localizations will be output. In the next part, we will introduce the related knowledge for the procedure above in more detail.
2.2.1 Proteins Sample Formulation
In the process of biological evolution, the similarity between proteins will fade away, but they still have some common properties. The evolutionary information of a protein sequence has a close relationship with protein physiological functions, and the PSSM is designed to capture the evolutionary information from protein sequences (Gong et al., 2021). The PSSM can be obtained by using position specific iterative-basic local alignment search tool (PSI-BLAST) to search similar proteins of a query protein in a non-redundant database (Murphy et al., 2000), and the parameters of E-value and iterations are set as 0.001 and 3, respectively.
For a query protein
where
The PSSM matrix resulting from Eq. 1 is not uniform with different length of protein sequences, which leads to the fact that matrix cannot be fed to the general machine learning model in a proper form. For this problem, the matrix dimensions are fixed to
where
In Eq. 3,
2.2.2 Generative Adversarial Networks for Synthesizing Minority Samples (SM-GAN)
Most of the benchmark datasets utilized for training classifiers have the class imbalance problem in the protein subcellular localization, which seriously affects the performance of classifier. Different approaches are proposed and utilized to handle the class imbalance problem in previous researches (He and Garcia, 2009; Yin et al., 2020), among which oversampling methods are widely used, as they are more elastic and better in aiming at a specific problem. However, oversampling methods, such as SMOTE, are faced with the problems of sample stacking and poor diversity.
To solve these problems, we design a special GAN called SM-GAN to generate pseudo samples of minority classes, and the illustration of SM-GAN is shown in Figure 2. It includes two models: a generative model
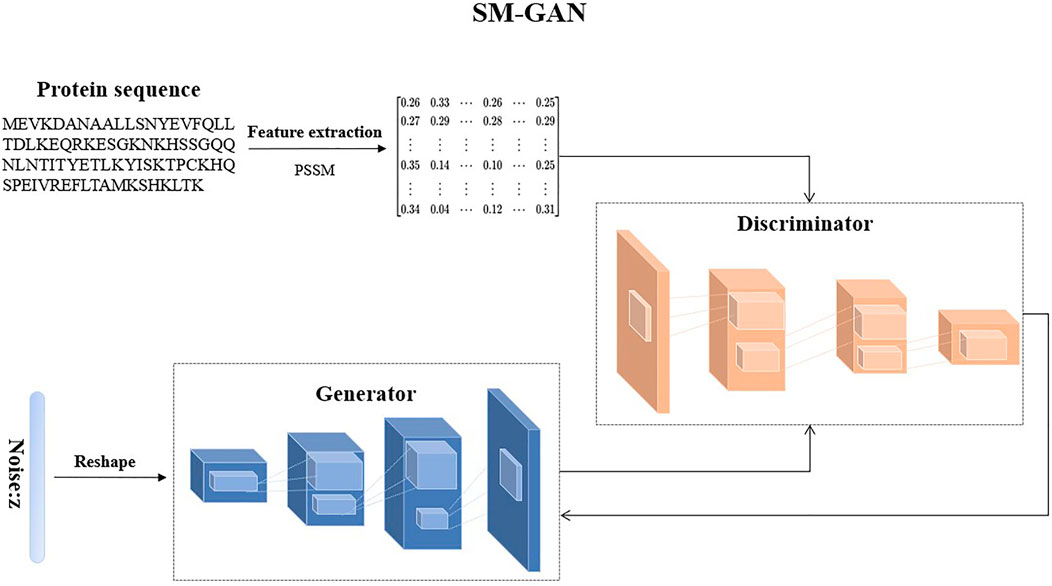
FIGURE 2. An illustration of SM-GAN.
The purpose of
In the process of generating new samples by SM-GAN, the generator
where
where
2.2.3 Multi-Label DeepFM (ML-DeepFM)
Multi-label classification is a common problem where a given sample has more than one label (Zhang and Zhou, 2014), which has attracted a lot of research attention. Many approaches are proposed for multi-label learning tasks, but the classification performance still needs to be improved. In this work, we design a multi-label classifier ML-DeepFM based on DeepFM (Guo et al., 2017) for the subcellular localization, and its structure is shown in Figure 3.
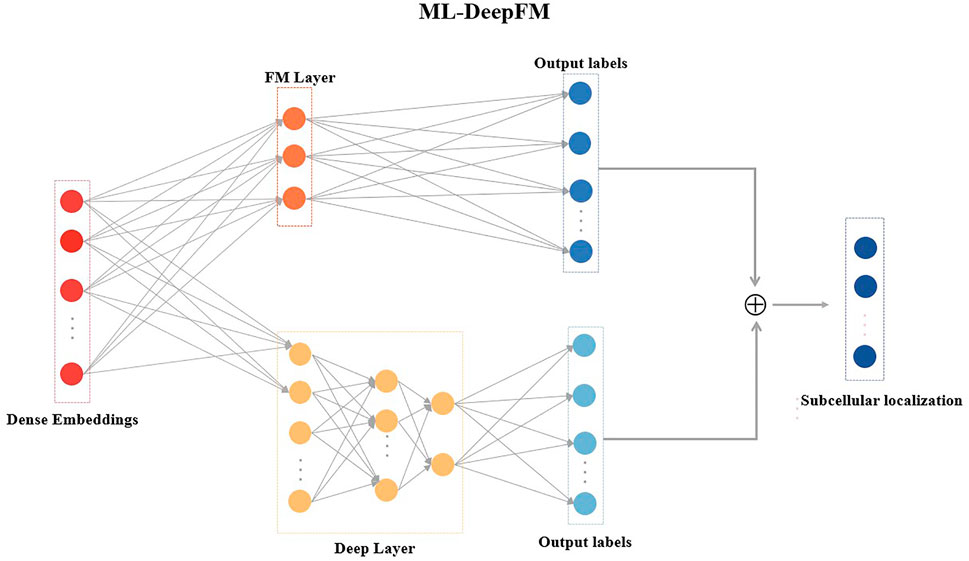
FIGURE 3. The model architecture of ML-DeepFM.
DeepFM has been extensively used in both the academic and industry because of its ability to learn low-order and high-order feature interactions. However, DeepFM cannot solve the problem of the multi-label classification for the protein subcellular localization. Therefore, ML-DeepFM is proposed, and its details will be described in this section.
ML-DeepFM includes two components: the FM component that models low-order feature interactions and the Deep component that extracts high-order feature interactions, as shown in Figure 3.
The FM component and Deep component must be trained in parallel, and then the predicted results of a given sample will be:
where
As shown in Eq. 6, for calculating the predicted label
1) FM component: FM component is a factorization machine proposed by Steffen Rendle (Rendle, 2010), and it can capture the information of feature interactions effectively. Assuming that sample
where
2) Deep component: Deep component is a deep neural network, which captures high-order feature interactions. For the sample
where
Note that the output layer of Deep component does not use any activation function, because ML-DeepFM is a multi-label classifier. Theoretically, we can get the predicted labels by combing Eqss 6, 7, 9, but it can be found that there are many unknown parameters in these formulas, such as
where
The loss function as shown in Eq. 10 has a problem that the learning rate of the FM component and the Deep component is very slow when using gradient descent for training the model. Log function is adopted to solve this problem inspired by cross entropy. In addition, it can be found that the value of
For a multi-label classifier, the number of labels for each sample is not fixed, we need a threshold value to determine the number of relevant tags to output. Assuming that the threshold value is denoted as
3 Results and Discussion
3.1 Experimental Setup
In this work, the proposed Gm-PLoc is implemented with TensorFlow under the Windows 10 operating system, and all the experiments are conducted on a computing server with an Intel(R) Core(TM) i7-10700K CPU and an Nvidia GeForce RTX 3080 Ti GPU.
Gm-PLoc is composed of SM-GAN and ML-DeepFM. In SM-GAN, the generator is consistent of one dense layer and three deconvolution layers, and the discriminator includes one dense layer and two convolution layers. In ML-DeepFM, FM component includes one FM layer and one dense layer, and Deep component includes five dense layers which have 256, 128, 64, 32 and 14 neurons, respectively. During training, the networks-based models are trained with Adam optimizer for 1,000 epochs, the batch size and learning rate are set to 512 and 0.0001, respectively. Note that the reason for using deep neural networks is to automatically extract the lower-order and high-order feature interactions, at the same time, we perform the following operations to alleviate the over fitting problem caused by using deep neural networks: expanding the dataset by SM-GAN, partitioning the dataset by the 10 cross validation, building shallow networks and reducing the number of neurons by the dropout technique.
3.2 Performance Measure
For evaluating the performance of the proposed model Gm-PLoc, 10 fold cross validation test is selected as the assessment method, which randomly divides the dataset into ten subsets, nine of them are used for training and the rest is retained as the test data, repeating the process ten times. In the meantime, hamming loss (Hl), one-error (Oe), coverage (Co), ranking loss (Rl), and average precision (Ap) are used to quantify the performance of the proposed model for multi-label protein subcellular localization. These five performance evaluation metrics are widely used in the literature on multi-label learning (Yu and Zhang, 2021; Zhang et al., 2021), which can be defined as follows:
1) Hl evaluates the fraction of labels misclassified in the wrong classes completely. There are two situations when the labels are misclassified: relevant labels are missed and irrelevant labels are predicted, and the mathematical expression is shown in Eq. 13.
2) Oe evaluates the fraction that the top-ranked label of samples is excluded from the relevant labels, which can be formulated as follows:
3) Co evaluates the average number of steps that must be moved when the ranked label list cover the relevant labels, and related mathematical definition will be:
4) Rl measures the times that the relevant labels are ranked higher than the relevant labels, which can be defined by Eq. 16.
5) Ap evaluates the average times that the relevant labels are ranked higher than each particular label of samples.
where
3.3 The Analysis of Imbalance Degree on the Dataset
There is a strong connection between the imbalance degree of the protein dataset and the performance of the classifier. The imbalance degree of the dataset is performed through numerical representation in Figure 4. The abscissa corresponds to the categories of subcellular localization, and the ordinate represents the proportion of each category. The bigger the value of sample proportion is, the more the number of samples in the relevant category is, or the other way around.
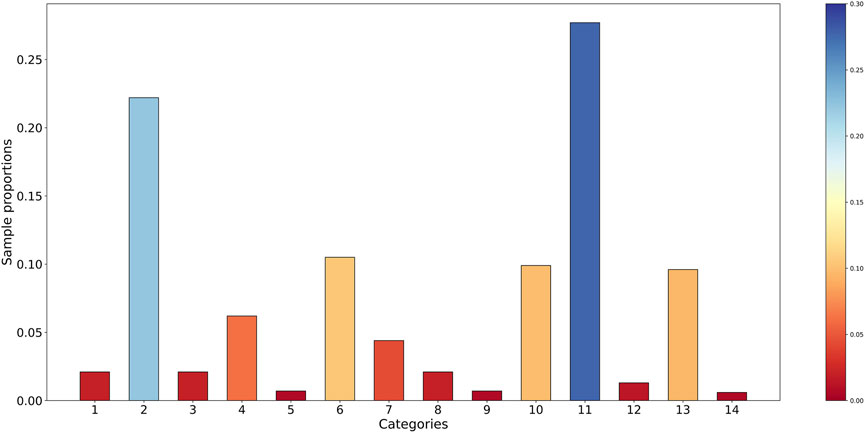
FIGURE 4. The sample proportion of the benchmark dataset.
As shown in Figure 4, the phenomenon of class imbalance exists in the benchmark dataset. The sample proportions of eight categories are all lower than 0.05, while two categories are higher than 0.20. It can be found that there is a large gap in the number of samples between different categories, and the data distribution among multiple categories has the imbalance problem. In combination with the imbalance ratio, this benchmark dataset is considered extremely imbalanced.
3.4 The Analysis of the Performance of SM-GAN and ML-DeepFM
To assess the performance of SM-GAN and ML-DeepFM proposed in this paper, we conduct six controlled experiments obtained by combining SM-GAN and ML-DeepFM in pairs. Note that here ML-DeepFM is divided into two sub-classifiers, ML-Deep and ML-FM, to explore the relationship between the Deep component, FM component and ML-Deep. Moreover, the results of each controlled experiment are fed back through five metrics.
From two dimensions of SM-GAN and ML-DeepFM, this paper analyzes the results of each controlled experiment, and the relevant results are shown in Figure 5 and Figure 6. Where Figure 5 includes six subgraphs. In Figure 5, the (b), (d) and (f) in the right column represent the results obtained after rebalancing by SM-GAN, we can see that the value of Co in the subgraph (b) is significantly smaller than that in the subgraph (a), and the above situation also exists in subgraph (e) and (f), which means SM-GAN can effectively promote the classifier to completely recognize the relevant labels of each sample. In addition, the rest metrics after rebalancing are better than other controlled experiments in varying degrees. The experimental results further prove the negative impact of data imbalance for the classifier, and also verify the effectiveness of SM-GAN.
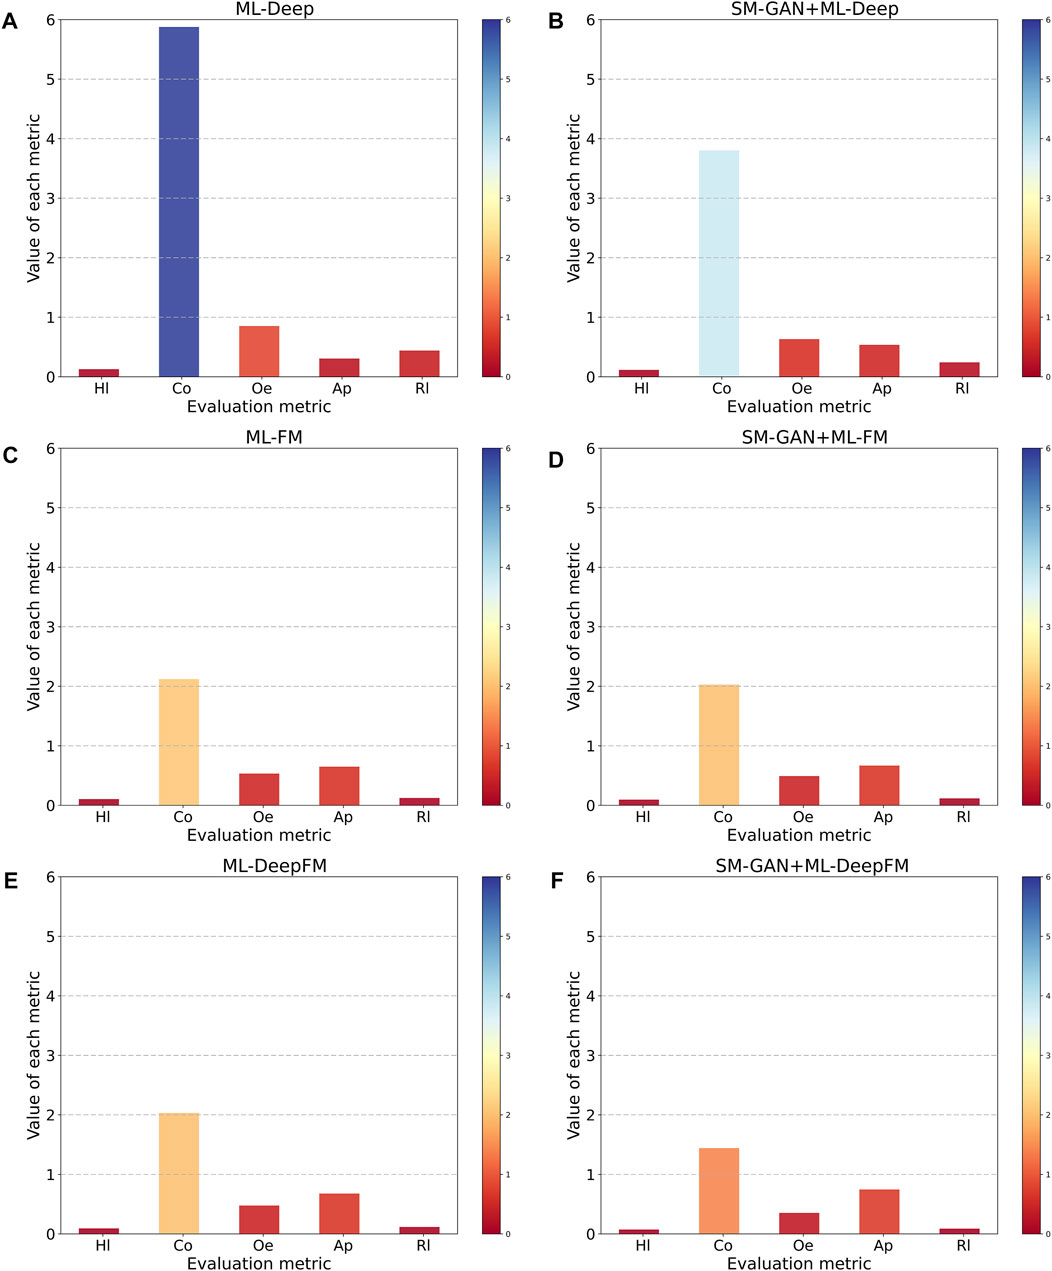
FIGURE 5. The relationship between SM-GAN with ML-DeepFM.
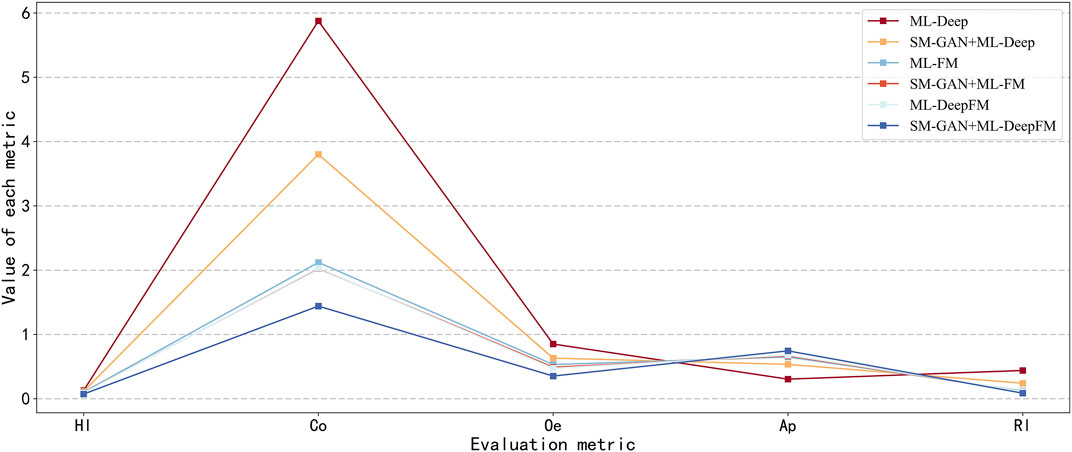
FIGURE 6. The experimental results come from the exhaustive combination of SM-GAN and ML-DeepFM.
To evaluate the performance of ML-DeepFM, and analyze the contribution of Deep component and FM component in ML-DeepFM, the experimental results of six controlled experiments are summarized in Figure 6. The ML-Deep gets the worst results as shown in the red line in that the values of Hl, Co, Oe and Rl are the largest and the value of Ap is the lowest. On the contrary, the results obtained by SM-GAN + ML-DeepFM are the best. In addition, we can see that the performance of classifiers based on ML-FM is better than those based on ML-Deep, and is close to that of ML-DeepFM, which means the FM component contributes more to ML-DeepFM and the information of low-order feature interactions between protein sequences is more useful for predicting subcellular localization.
3.5 Performance Comparisons Between Different Oversampling Methods
As an oversampling method for generating samples of the minority classes, SM-GAN can alleviate the class imbalance problem in protein subcellular localization. To assess the effectiveness, we compare SM-GAN against other popular methods that can alleviate class imbalance problem. Among these controlled methods, SMOTE (Buda et al., 2018) generates new samples of the minority class through linear interpolation, and Borderline-SMOTE (Han et al., 2005) is a variant of SMOTE, which only samples the boundary samples of the minority class. SVM-Balance (Farquad and Bose, 2012) uses SVM to solve the problem of data imbalance by reconstructing the training dataset. SMOTE, Borderline-SMOTE, and SVM-Balance are conventional methods for imbalanced learning. The remaining methods including SinGAN (Shaham et al., 2019) and DCGAN (Yu Y. et al., 2017) are both generative models based on GAN, which generate samples by learning the sample distribution of the minority class. The experimental results of the above mentioned methods can be found in Table 1.
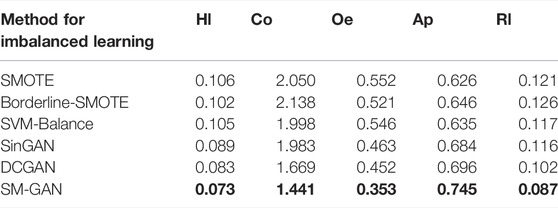
TABLE 1. Comparing SM-GAN with other oversampling methods.
As shown in Table 1, experimental results corresponding to the methods based on the generative model are much better than conventional methods, because these interpolation methods based on sample spacing will further enhance the stacking of samples, thereby making correct classification difficult. In addition, among the three imbalanced learning methods based on the generative model, the values of five evaluation metrics corresponding to SM-GAN are the best. To sum up, SM-GAN can effectively handle the extreme imbalance problem of multi-label samples, which performs better than compared methods.
3.6 Performance Comparison With Existing Prediction Models for Protein Subcellular Localization
To further verify the effectiveness of Gm-PLoc obtained by combining SM-GAN and ML-DeepFM, we compare the performance of Gm-PLoc with GO + AAC + PseAAC + IMMMLGP (He et al., 2012), GO + FunD + PSSM + OET-KNN (Shen and Chou, 2009) and PSSM + PseAAC + Multi-SVM (Shen et al., 2019) on the same benchmark dataset. For the sake of simplicity, “+” is used to connect the feature representation and classifier in the corresponding models. The experimental results of Gm-PLoc compared with the three methods are shown in Table 2.
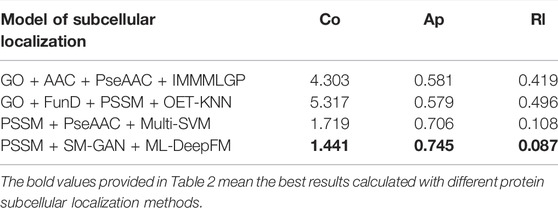
TABLE 2. Comparing Gm-PLoc with other model of protein subcellular localization.
From Table 2, we can see that the values of Co and Rl calculated by Gm-PLoc are 1.441 and 0.087, respectively, which are 0.278–2.862 and 0.021–0.409 lower than those of other models. In addition, the value of Ap is 0.745, which is 0.039–0.166 higher than the comparison models. And by comparing all metrics, it can be found that the Gm-PLoc has the best performance. The above results further elucidate that Gm-PLoc performs better than the comparison models.
Furthermore, we analyze the comparison models and find that most of these models improve the accuracy of subcellular localization by fusing features and improving algorithms. These models do not consider the problem of data imbalance, while Gm-PLoc pays attention to the feature information, classification model and imbalanced characteristic simultaneously. Overall, Gm-PLoc can predict subcellular localization effectively.
4 Conclusion
The class imbalance problem widely exists in the datasets annotated with the subcellular localization, which seriously affects the performance of classification models for multi-label proteins. In this paper, a new model named Gm-PLoc is proposed to solve the problem of the multi-label classification with imbalanced protein data. In this model, the evolution information of proteins is extracted by the PSSM, and then the proposed SM-GAN is used to rebalance the distribution of each class. Finally, ML-DeepFM based on DeepFM is trained with the rebalanced dataset to predict the subcellular localization of multi-label proteins. Many experiments are conducted to assess the performance of Gm-PLoc, and the experimental results illustrate that Gm-PLoc can alleviate the problem of protein data imbalance and predict the subcellular localization of multi-label proteins effectively. In the field of protein subcellular localization, there are two aspects may be improved further: the processing of protein data and the construction of multi-label classification. In further works, we will explore the more effective and cost efficient classification model for protein subcellular localization under the data imbalance and big categories.
Data Availability Statement
Publicly available datasets were analyzed in this study. This data can be found here: https://github.com/WULIWEN-007/GmPLoc-Frontiers.
Author Contributions
LW provided the idea of this work and designed this scheme; LW, SG, and JL carried out the proposed method; LW, FW, and YD conducted the contrast experiments; LW and YZ prepared and edited the manuscript; SY reviewed the manuscript and funded the research.
Funding
This research was funded by the National Natural Science Foundation of China (No. 61863036), the Yunnan University’s Research Innovation Fund for Graduate Students (No. 2020296), the China Postdoctoral Science Foundation (No. 2021M702778), and the Science Research Foundation Project of Yunnan Education Department (No. 2021Y025).
Conflict of Interest
The authors declare that the research was conducted in the absence of any commercial or financial relationships that could be construed as a potential conflict of interest.
Publisher’s Note
All claims expressed in this article are solely those of the authors and do not necessarily represent those of their affiliated organizations, or those of the publisher, the editors and the reviewers. Any product that may be evaluated in this article, or claim that may be made by its manufacturer, is not guaranteed or endorsed by the publisher.
Acknowledgments
The authors wish to thank the editor as well as the reviewers for their constructive comments, which were very useful for strengthening the presentation of this study.
References
Buda, M., Maki, A., and Mazurowski, M. A. (2018). A Systematic Study of the Class Imbalance Problem in Convolutional Neural Networks. Neural Netw. 106, 249–259. doi:10.1016/j.neunet.2018.07.011
Cheng, X., Lin, W.-Z., Xiao, X., and Chou, K.-C. (2019). pLoc_bal-mAnimal: Predict Subcellular Localization of Animal Proteins by Balancing Training Dataset and PseAAC. Bioinformatics 35 (3), 398–406. doi:10.1093/bioinformatics/bty628
Chou, K.-C. (2001). Prediction of Protein Cellular Attributes Using Pseudo-amino Acid Composition. Proteins 43 (3), 246–255. doi:10.1002/prot.1035
Chou, K.-C., and Shen, H.-B. (2008). ProtIdent: a Web Server for Identifying Proteases and Their Types by Fusing Functional Domain and Sequential Evolution Information. Biochem. Biophysical Res. Commun. 376 (2), 321–325. doi:10.1016/j.bbrc.2008.08.125
Dai, Q., Bao, C., Hai, Y., Ma, S., Zhou, T., Wang, C., et al. (2018). MTGIpick Allows Robust Identification of Genomic Islands from a Single Genome. Brief. Bioinform. 19 (3), bbw118–373. doi:10.1093/bib/bbw118
Ding, Y., Tang, J., and Guo, F. (2020). Human Protein Subcellular Localization Identification via Fuzzy Model on Kernelized Neighborhood Representation. Appl. Soft Comput. 96, 106596. doi:10.1016/j.asoc.2020.106596
Farquad, M. A. H., and Bose, I. (2012). Preprocessing Unbalanced Data Using Support Vector Machine. Decis. Support Syst. 53 (1), 226–233. doi:10.1016/j.dss.2012.01.016
Gong, Y., Dong, B., Zhang, Z., Zhai, Y., Gao, B., Zhang, T., et al. (2021). VTP-identifier: Vesicular Transport Proteins Identification Based on PSSM Profiles and XGBoost. Front. Genet. 12, 808856. doi:10.3389/fgene.2021.808856
Guo, H., Tang, R., Ye, Y., Li, Z., and He, X. (2017). DeepFM: A Factorization-Machine Based Neural Network for CTR predictionInternational Joint Conferences on Artificial Intelligence. Melbourne, VIC, Australia: Morgan Kaufmann, 1725–1731.
Haibo He, H., and Garcia, E. A. (2009). Learning from Imbalanced Data. IEEE Trans. Knowl. Data Eng. 21 (9), 1263–1284. doi:10.1109/TKDE.2008.239
Han, H., Wang, W.-Y., and Mao, B.-H. (2005). Borderline-SMOTE: A New Over-sampling Method in Imbalanced Data Sets Learning. Berlin, Heidelberg: Springer Berlin Heidelberg, 878–887. doi:10.1007/11538059_91
He, J., Gu, H., and Liu, W. (2012). Imbalanced Multi-Modal Multi-Label Learning for Subcellular Localization Prediction of Human Proteins with Both Single and Multiple Sites. PLoS One 7 (6), e37155. doi:10.1371/journal.pone.0037155
Hu, J. X., Yang, Y., Xu, Y. Y., and Shen, H. B. (2021). Incorporating Label Correlations into Deep Neural Networks to Classify Protein Subcellular Location Patterns in Immunohistochemistry Images. Proteins 90 (2), 493–503. doi:10.1002/prot.26244
Kong, R., Xu, X., Liu, X., He, P., Zhang, M. Q., and Dai, Q. (2020). 2SigFinder: the Combined Use of Small-Scale and Large-Scale Statistical Testing for Genomic Island Detection from a Single Genome. BMC Bioinforma. 21 (1), 159. doi:10.1186/s12859-020-3501-2
Li, B., Cai, L., Liao, B., Fu, X., Bing, P., and Yang, J. (2019). Prediction of Protein Subcellular Localization Based on Fusion of Multi-View Features. Molecules 24 (5), 919. doi:10.3390/molecules24050919
Li, G.-P., Du, P.-F., Shen, Z.-A., Liu, H.-Y., and Luo, T. (2020). DPPN-SVM: Computational Identification of Mis-Localized Proteins in Cancers by Integrating Differential Gene Expressions with Dynamic Protein-Protein Interaction Networks. Front. Genet. 11, 600454. doi:10.3389/fgene.2020.600454
Liu, G.-H., Zhang, B.-W., Qian, G., Wang, B., Mao, B., and Bichindaritz, I. (2020). Bioimage-based Prediction of Protein Subcellular Location in Human Tissue with Ensemble Features and Deep Networks. IEEE/ACM Trans. Comput. Biol. Bioinf. 17 (17), 1966–1980. doi:10.1109/TCBB.2019.2917429
Liu, H., Hu, B., Chen, L., and Lu, L. (2021). Identifying Protein Subcellular Location with Embedding Features Learned from Networks. Cp 18 (5), 646–660. doi:10.2174/1570164617999201124142950
Long, W., Yang, Y., and Shen, H.-B. (2019). ImPLoc: a Multi-Instance Deep Learning Model for the Prediction of Protein Subcellular Localization Based on Immunohistochemistry Images. Bioinformatics 36 (7), 2244–2250. doi:10.1093/bioinformatics/btz909
Mcguffin, L. J., Bryson, K., and Jones, D. T. (2000). The PSIPRED Protein Structure Prediction Server. Bioinformatics 16 (16), 404–405. doi:10.1093/bioinformatics/16.4.404
Murphy, R. F., Boland, M. V., and Velliste, M. (2000). Towards a Systematics for Protein Subcelluar Location: Quantitative Description of Protein Localization Patterns and Automated Analysis of Fluorescence Microscope Images. Proceedings. International Conference on Intelligent Systems for Molecular Biology. 1 July 1998. Pittsburgh, USA. ACM, 251–259.
Nakashima, H., and Nishikawa, K. (1994). Discrimination of Intracellular and Extracellular Proteins Using Amino Acid Composition and Residue-Pair Frequencies. J. Mol. Biol. 238 (1), 54–61. doi:10.1006/jmbi.1994.1267
Onesime, M., Yang, Z., and Dai, Q. (2021). Genomic Island Prediction via Chi-Square Test and Random Forest Algorithm. Comput. Math. Methods Med. 2021, 1–9. doi:10.1155/2021/9969751
Petrilli, P. (1993). Classification of Protein Sequences by Their Dipeptide Composition. Bioinformatics 9 (2), 205–209. doi:10.1093/bioinformatics/9.2.205
Qu, K., Wei, L., and Zou, Q. (2019). A Review of DNA-Binding Proteins Prediction Methods. Cbio 14 (3), 246–254. doi:10.2174/1574893614666181212102030
Rendle, S. (2010). Factorization Machines. IEEE International Conference on Data Mining. December 3 2022. Washington, USA. pp 995–1000.
Semwal, R., and Varadwaj, P. K. (2020). HumDLoc: Human Protein Subcellular Localization Prediction Using Deep Neural Network. Cg 21 (7), 546–557. doi:10.2174/1389202921999200528160534
Shaham, T. R., Dekel, T., and Michaeli, T. (2019). SinGAN: Learning a Generative Model from a Single Natural Image. IEEE/CVF International Conference on Computer Vision. Seoul, Korea, October 20–26, 2019, 4569–4579.doi:10.1109/ICCV43118.2019
Shen, H.-B., and Chou, K.-C. (2009). A Top-Down Approach to Enhance the Power of Predicting Human Protein Subcellular Localization: Hum-mPLoc 2.0. Anal. Biochem. 394 (2), 269–274. doi:10.1016/j.ab.2009.07.046
Shen, Y., Ding, Y., Tang, J., Zou, Q., and Guo, F. (2020). Critical Evaluation of Web-Based Prediction Tools for Human Protein Subcellular Localization. Brief. Bioinform. 21 (5), 1628–1640. doi:10.1093/bib/bbz106
Shen, Y., Tang, J., and Guo, F. (2019). Identification of Protein Subcellular Localization via Integrating Evolutionary and Physicochemical Information into Chou's General PseAAC. J. Theor. Biol. 462, 230–239. doi:10.1016/j.jtbi.2018.11.012
Su, R., He, L., Liu, T., Liu, X., and Wei, L. (2020). Protein Subcellular Localization Based on Deep Image Features and Criterion Learning Strategy. Brief. Bioinform. 22 (4), bbaa313. doi:10.1093/bib/bbaa313
Sun, J., and Du, P.-F. (2021). Predicting Protein Subchloroplast Locations: the 10th Anniversary. Front. Comput. Sci. 15, 152901. doi:10.1007/s11704-020-9507-0
Wan, S., Duan, Y., and Zou, Q. (2017). HPSLPred: An Ensemble Multi-Label Classifier for Human Protein Subcellular Location Prediction with Imbalanced Source. Proteomics 17 (17), 1700262. doi:10.1002/pmic.201700262
Wang, D., Zhang, Z., Jiang, Y., Mao, Z., Wang, D., Lin, H., et al. (2021). DM3Loc: Multi-Label mRNA Subcellular Localization Prediction and Analysis Based on Multi-Head Self-Attention Mechanism. Nucleic Acids Res. 49 (8), e46. doi:10.1093/nar/gkab016
Wei, L., Ding, Y., Su, R., Tang, J., and Zou, Q. (2018). Prediction of Human Protein Subcellular Localization Using Deep Learning. J. Parallel Distributed Comput. 117, 212–217. doi:10.1016/j.jpdc.2017.08.009
Xu, Q., Hu, D. H., Xue, H., Yu, W., and Yang, Q. (2009). Semi-supervised Protein Subcellular Localization. BMC Bioinforma. 10. doi:10.1186/1471-2105-10-S1-S47
Xu, Y.-Y., Shen, H.-B., and Murphy, R. F. (2019). Learning Complex Subcellular Distribution Patterns of Proteins via Analysis of Immunohistochemistry Images. Bioinformatics 36 (6), 1908–1914. doi:10.1093/bioinformatics/btz844
Xu, Y.-Y., Yang, F., Zhang, Y., and Shen, H.-B. (2013). An Image-Based Multi-Label Human Protein Subcellular Localization Predictor (iLocator) Reveals Protein Mislocalizations in Cancer Tissues. Bioinformatics 29 (16), 2032–2040. doi:10.1093/bioinformatics/btt320
Yang, X.-F., Zhou, Y.-K., Zhang, L., Gao, Y., and Du, P.-F. (2020). Predicting LncRNA Subcellular Localization Using Unbalanced Pseudo-k Nucleotide Compositions. Cbio 15 (6), 554–562. doi:10.2174/1574893614666190902151038
Yin, J., Gan, C., Zhao, K., Lin, X., Quan, Z., and Wang, Z.-J. (2020). A Novel Model for Imbalanced Data Classification. Aaai 34 (4), 6680–6687. doi:10.1609/aaai.v34i04.6145
Yu, B., Li, S., Chen, C., Xu, J., Qiu, W., Wu, X., et al. (2017a). Prediction Subcellular Localization of Gram-Negative Bacterial Proteins by Support Vector Machine Using Wavelet Denoising and Chou's Pseudo Amino Acid Composition. Chemom. Intelligent Laboratory Syst. 167, 102–112. doi:10.1016/j.chemolab.2017.05.009
Yu, Y., Gong, Z., Zhong, P., and Shan, J. (2017b). Unsupervised Representation Learning with Deep Convolutional Neural Network for Remote Sensing Images. International Conference on Image and Graphics. Haikou, China, , September 13–15, 2017. pp 97–108.doi:10.1007/978-3-319-71589-6_9
Yu, Z.-B., and Zhang, M.-L. (2021). Multi-Label Classification with Label-specific Feature Generation: A Wrapped Approach. IEEE Trans. Pattern Anal. Mach. Intell., 1. doi:10.1109/TPAMI.2021.3070215
Zakeri, P., Moshiri, B., and Sadeghi, M. (2011). Prediction of Protein Submitochondria Locations Based on Data Fusion of Various Features of Sequences. J. Theor. Biol. 269 (1), 208–216. doi:10.1016/j.jtbi.2010.10.026
Zhang, M.-L., Zhang, Q.-W., Fang, J.-P., Li, Y.-K., and Geng, X. (2019). Leveraging Implicit Relative Labeling-Importance Information for Effective Multi-Label Learning. IEEE Trans. Knowl. Data Eng. 5 (33), 1. doi:10.1109/TKDE.2019.2951561
Zhang, M.-L., and Zhou, Z.-H. (2014). A Review on Multi-Label Learning Algorithms. IEEE Trans. Knowl. Data Eng. 26 (8), 1819–1837. doi:10.1109/TKDE.2013.39
Zhang, Q., Zhang, Y., Li, S., Han, Y., Jin, S., Gu, H., et al. (2021). Accurate Prediction of Multi-Label Protein Subcellular Localization through Multi-View Feature Learning with RBRL Classifier. Brief. Bioinform. 22 (5), bbab012. doi:10.1093/bib/bbab012
Keywords: protein subcellular localization, class imbalance learning, multi-label classification, generative adversarial networks, deep learning
Citation: Wu L, Gao S, Yao S, Wu F, Li J, Dong Y and Zhang Y (2022) Gm-PLoc: A Subcellular Localization Model of Multi-Label Protein Based on GAN and DeepFM. Front. Genet. 13:912614. doi: 10.3389/fgene.2022.912614
Received: 04 April 2022; Accepted: 20 May 2022;
Published: 15 June 2022.
Edited by:
Pu-Feng Du, Tianjin University, ChinaReviewed by:
Yijie Ding, University of Electronic Science and Technology of China, ChinaGuohua Huang, Shaoyang University, China
Cheng Liang, Shandong Normal University, China
Copyright © 2022 Wu, Gao, Yao, Wu, Li, Dong and Zhang. This is an open-access article distributed under the terms of the Creative Commons Attribution License (CC BY). The use, distribution or reproduction in other forums is permitted, provided the original author(s) and the copyright owner(s) are credited and that the original publication in this journal is cited, in accordance with accepted academic practice. No use, distribution or reproduction is permitted which does not comply with these terms.
*Correspondence: Yunqi Zhang, eXVucWl6aGFuZ0B5bnUuZWR1LmNu