- 1Experimental Research Center, Zhongshan Hospital Qingpu Branch, Fudan University, Shanghai, China
- 2Department of General Family Medicine, The First Affiliated Hospital of Zhejiang Chinese Medical University, Hangzhou, China
- 3The Third Affiliated Hospital of Zhejiang Chinese Medical University, Hangzhou, China
Stomach adenocarcinoma (STAD) is one of the most common malignant tumors of the digestive tract, and its survival predictors are critical for precision medicine but have not been fully investigated. The complement system is a complex multistep cascade at the interface of innate and adaptive immunity, which augments the function of antibodies and phagocytes. This study aimed to construct and validate a CSRG signature based on TCGA (The Cancer Genome Atlas) STAD dataset and revalidated it in an external GEO (Gene Expression Omnibus) STAD cohort. Subsequently, we assessed the association of risk levels with the stromal and immune cell infiltration level in STAD using the ESTIMATE, single-sample Gene Set Enrichment Analysis (ssGSEA), and Microenvironment Cell Populations-counter (MCP-counter) algorithm. It was found that the CSRG signature, based on three genes (SERPINE1, PROC, and CFHR3), was significantly and independently associated with the OS in TCGA STAD patients (p < 0.001). Subsequently, we found that the high-risk STAD harbors more immune cell infiltration than the low-risk group, and the ESTIMATE results indicated that there exists a more stromal component in the tumor microenvironment of the high-risk groups. Compared to the low-risk group, the high-risk STAD patients had higher expressions of marker genes for immune checkpoint inhibitors (ICIs) and showed higher sensitivity to the chemotherapy agents (rapamycin, nilotinib, 5-fluorouracil, axitinib, DMOG, and JNK inhibitor VIII). The prognostic value of the CSRGs was further validated by nomogram plots, which revealed that it was superior to tumor TNM and pathologic stage. Finally, the three expression levels were evaluated in GES-1, HGC27, and AGS cells by qRT-PCR.
Introduction
Stomach adenocarcinoma (STAD) is a major malignant tumor with an incidence rate of 5.6% and a mortality rate of 7.7% based on global cancer statistics in 2020 (1). Despite the 5-year survival rate up to 90–97% at an early stage, the 5-year survival rate is less than 30% in patients with advanced-stage STAD (2).
STAD development is complicated, involving many factors and steps, such as genetic factors, H. pylori infection, smoking, or environmental factors (Liu et al., 2020; Han et al., 2021). The malignant phenotypes of STAD are defined not only by the intrinsic heterogeneity of tumor cells but also by the stromal and immune cells within the tumor microenvironment (TME) (Zeng et al., 2021). Several studies on malignant solid tumors have indicated the importance of non-neoplastic stromal cells, particularly cancer-associated fibroblasts, interacting with the tumor cells that contribute to tumor formation and spread (Guo et al., 2020). Tumor-associated immune cells, primarily T cells, can produce cytokines that promote tumor angiogenesis and migration (Ren et al., 2020).
A complement system is an important innate immune system that protects the host against invading pathogens (Ueda et al., 2017; Garred et al., 2021). It has traditionally been considered as a complex network of proteins that respond rapidly to foreign pathogens and triggering inflammatory reactions (Conigliaro et al., 2019). However, activation of the complement system in the TME may promote tumor progression (Afshar-Kharghan, 2017). Recent studies have reported that complement C3 overexpression can activate the JAK2/STAT3 pathway and correlate with stomach adenocarcinoma progression (Yuan et al., 2020). Chen et al. (2018) indicated that the complement C5a/C5aR pathway can promote stomach adenocarcinoma progression by suppressing p21/p-p21 expression via activation of PI3K/AKT signaling. However, whether these complement system-related genes are correlated with the prognosis of STAD patients remains to be explored.
Herein, we collected the RNA-seq data and the corresponding clinical data from public databases in order to ascertain the association of complement system-related gene (CSRG) expression with STAD overall survival (OS) and treatment sensitivity and explore the possible association of immune cell infiltration with complement system gene expression.
Methods and materials
Cohorts and complement system-related gene selection
The CSRGs were selected according to the pathway definition in Human Biological Pathway Unification (https://pathcards.genecards.org/), the HUGO Gene Nomenclature Committee (https://www.genenames.org), and the Molecular Signatures Database (http://software.broadinstitute.org/gsea/msigdb/index.jsp) by the key word “complement”. After removing the duplicated genes, 248 genes remained and are provided in Supplementary Table S1. TCGA STAD cohort was downloaded from the University of California Santa Cruz Xena webserver in TCGA projects (https://xenabrowser.net/datapages/?cohort=GDC%20TCGA%20Stomach%20Cancer%20(STAD)&removeHub=https%3A%2F%2Fxena.treehouse.gi.ucsc.edu%3A443). Samples without follow-up information or with follow-up time less than 1 day were excluded. A total of 350 stomach adenocarcinoma patients in TCGA cohort were subsequently used for further analysis. In addition, another independent cohort, GSE84437, which contained 433 STAD cases, was retrieved from the Gene Expression Omnibus database for external validation (https://www.ncbi.nlm.nih.gov/geo/query/acc.cgi).
Construction and validation of a prognostic complement system-related gene signature
EdgeR is a package for the analysis of digital gene expression data arising from RNA sequencing technologies, such as serial analysis of gene expression (SAGE), cap analysis of gene expression (CAGE) and deep sequencing, and Tag-seq or RNA-seq, with emphasis on testing for differential expression. Thus, we used the “edgeR” R package to identify the differentially expressed genes (DEGs) between tumor tissues and adjacent normal tissues. In this study, gene sets with false discovery rates (FDRs) < 0.05 and with the threshold of |logFC|>1 were defined as DEGs.
Univariate and multivariate Cox regression analyses were conducted in TCGA cohort to screen complement system-related genes (CSRGs) significantly associated with the OS of TCGA STAD cohort. Only genes that showed significant p < 0.05 in the multivariate and univariate regression were considered as potential survival-related CSRGs. Then, the overlapping prognostic DEGs were selected. These genes were used to construct the risk model. Stepwise multivariate Cox regression with Akaike information criterion (AIC) was performed to obtain the risk model, and the lowest value of AIC provided the sensitivity and specificity. Subsequently, three genes (SERPINE1, PROC, and CFHR3) were selected. The risk score of each patient was calculated by the following formula: risk score =
Functional analysis of the differentially expressed genes
To further understand the potential function of DEGs, the Gene Ontology (GO) analysis and the Kyoto Encyclopedia of Genes and Genomes (KEGG) analysis were employed using TCGA data to understand the potential function of DEGs using DAVID online analyses.
Stromal and immune score determination for the stomach adenocarcinoma microenvironment
ESTIMATE is a tool for analyzing TCGA data and GEO data to estimate infiltrating stromal cells, immune cells, and tumor purity in tumor tissues based on gene expression profiles (Yoshihara et al., 2013). Herein, the ESTIMATE algorithm was applied to the normalized expression data for estimating the immune score, stromal score, and tumor purity for each STAD patient in TCGA cohort and GSE84437 cohort.
Immune cell enrichment analysis
The infiltrating immune cells in the tumor microenvironment were estimated by the SSGSEA and MCP-counter algorithms using TCGA data and GEO data. The MCPcounter was performed within R, as previously described (Becht et al., 2016). The SSGSEA method was performed by its package “gsva” within R, as previously described (Newman et al., 2015). Immune cell marker gene expression information of 28 subsets was obtained from the literature published by Charoentong et al. (2017). The Wilcoxon test was used to compare the differences in immune cell subtypes between the high-risk and low-risk groups.
Significance of the complement system-related gene-based signature in chemotherapy and immunotherapy
In order to predict the response of STAD patients in the two different risk groups to chemotherapy drugs, the “pRRophetic” R package was used to assess the half-maximal inhibitory concentration (IC50) for each STAD patient based on the Genomics of Drug Sensitivity in Cancer (GDSC) database (Geeleher et al., 2014). As several chemotherapy agents have been proven to be ineffective for advanced STAD patients, they are being replaced by immunotherapy agents, particularly the most promising ICIs, so we compared the differences in the expression levels of ICI marker genes and chemokines.
Enrichment analysis by gene set enrichment analysis
In order to clarify the differences of enriched pathways between the low-risk and high-risk groups, Gene Set Enrichment Analysis (GSEA) software (version 4.2.3) was utilized for TCGA data to carry out the Kyoto Encyclopedia of Genes and Genomes (KEGG) pathway enrichment analysis. The random combination was set for 1,000 times.
Nomogram construction and validation
After testing for collinearity, all relevant clinical characteristics and risk score were included in the construction of a prognostic nomogram to predict 1-, 3-, and 5-year overall survival of stomach adenocarcinoma patients in TCGA dataset. The concordance index (C‐index) was used to evaluate the discriminative capacity of the nomogram, and a higher C‐index suggested a superior discriminative capacity for survival outcomes. The nomogram was validated based on the internal (TCGA cohort) and external (GEO cohort) calibration measurements. The calibration curve approach to 45-degree diagonal line shows perfect predictive capability.
Cell culture
We obtained gastric cancer cell lines AGS and HGC27 and the normal human gastric epithelial cell line GES-1 from the Cell Bank of Chinese Academy of Sciences (Shanghai, China). All the cells were cultured in RPMI-1640 medium supplemented with 10% fetal bovine serum (Gibco, Waltham, MA) at 37°C with 5% CO2.
Quantitative real-time PCR
RNA was extracted using the TRIzol reagent (Invitrogen, United States) in accordance with the manufacturer’s protocol. Reverse transcription of RNA to cDNA was carried out according to the manufacturer’s instructions using the PrimeScript RT Reagent Kit (TaKaRa, China). Then, quantitative real-time PCR was performed with TB Green Ex Taq (Takara, China) using Applied Biosystems Prism 7500 system with customized sequences of the primers (Supplementary Table S2). The 2−ΔΔCt statistic was used to calculate the expression levels of genes.
Results
Identification of prognostic complement system-related differentially expressed genes in The Cancer Genome Atlas cohort
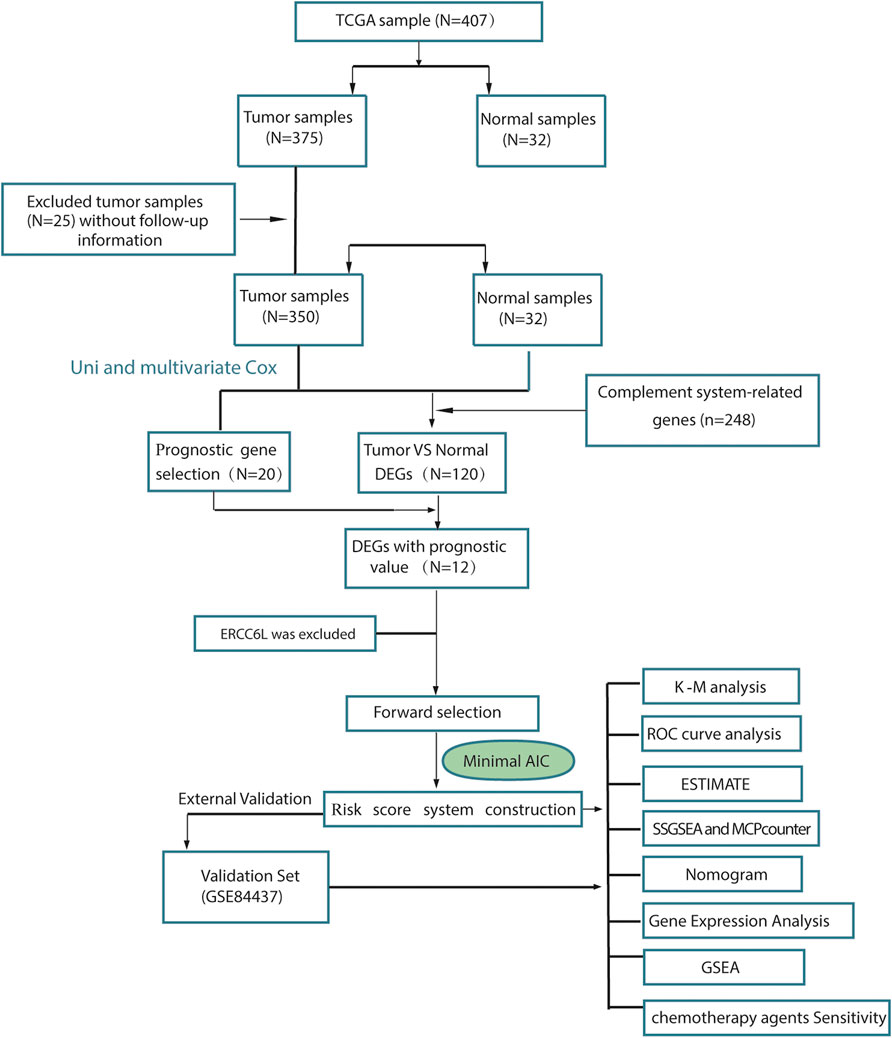
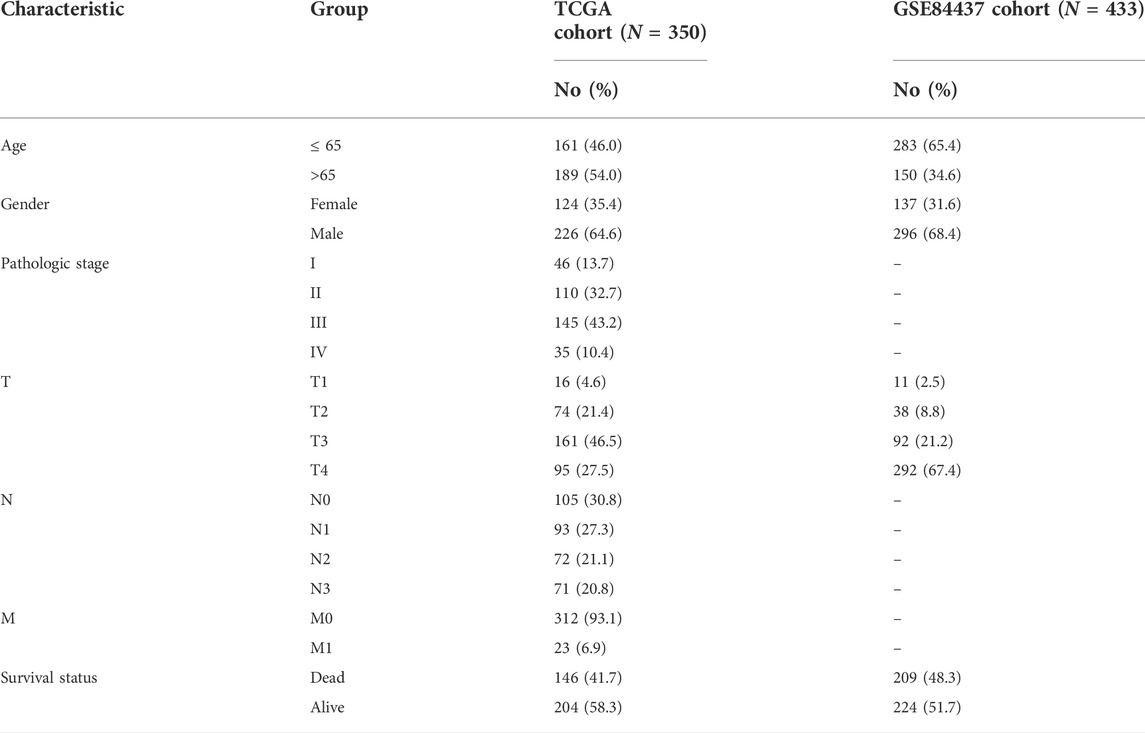
To describe our study more clearly, a flow chart of the analysis procedure was developed (Figure 1), and the basic characteristics of the STAD patients are shown in Table 1. In the present study, 120 DEGs in TCGA dataset were identified. Then, GO and KEGG analyses were performed to better understand the key roles of DEGs using DAVID online analyses. Of the DEGs, 12 were correlated with OS in the univariate and multivariate Cox regression analyses (Figures 2A–D). Unreasonably, ERCC6L was upregulated in tumor samples, but its expression predicted a better prognosis in the univariate and multivariate Cox regression analyses, so it was excluded from further study. A total of 11 prognostic complement system-related DEGs were preserved (all FDR < 0.05 and p < 0.05).
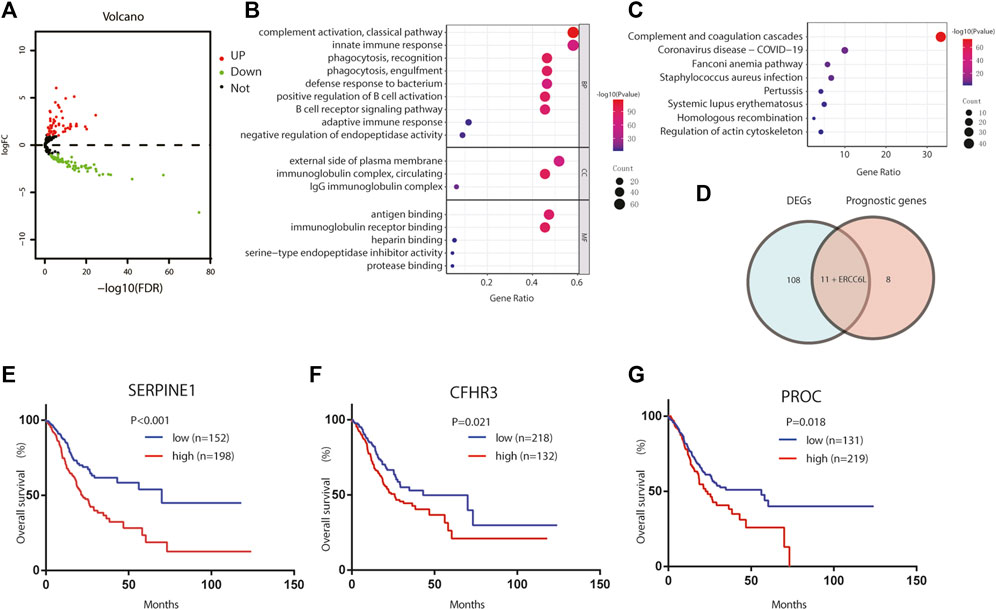
FIGURE 2. Identification of the candidate complement system-related genes in TCGA cohort. (A) Volcano plots visualize the complement system-related DEGs in TCGA STAD. (B) GO analysis of complement system-related DEGs. (C) KEGG analysis of complement system-related DEGs. (D) Venn diagram to identify DEGs between tumor and adjacent normal tissue that were correlated with OS. (E–G) Prognostic values of (E) SERPINE1, (F) CFHR3, and (G) PROC in TCGA STAD. GO, Gene Ontology; KEGG, Kyoto Encyclopedia of Genes and Genomes; DEGs, differentially expressed genes; OS, overall survival.
Construction of the risk score system
Here, we adopted a stepwise multivariate Cox regression analysis to find the best performance efficacy predictive model with the lowest AIC value. Finally, a three-gene-based model, including SERPINE1, PROC, and CFHR3, was successfully developed (Table 2). According to K–M analysis, high SERPINE1, PROC, and CFHR3 expression was significantly correlated with poor prognosis (Figures 2E–G). The prognostic risk score model was established with the following formula: risk score = expression level of PROC × 0.092 + expression level of SERPINE1×0.202 + expression level of CFHR3 × 0.127. The results obtained were used to classify patients into low-risk (n = 180) and high-risk (n = 170) groups based on the optimal cut-off of the risk score, which was calculated by the surv_cutpoint function in the “survminer” package. As shown in Figure 3A, patients in the high-risk group had more occurrences of death and shorter survival times. In addition, the K–M curve indicated that patients in the high-risk group had a significantly worse overall survival than their low-risk counterpart (Figure 3B). Furthermore, the risk heatmap clearly shows that SERPINE1, PROC, and CFHR3 were upregulated as the risk score increases (Figure 3A). Time-dependent ROC curves showed that the classifier had a strong predictive ability in TCGA dataset (Figure 3C), the AUC was 0.702 in 1 year, 0.697 in 3 years, and 0.762 in 5 years. Moreover, the risk score model was an independent factor in both univariate and multivariate Cox regression analyses (p < 0.001, HR: 2.270, and 95% CI: 1.619–3.183; and p < 0.001, HR: 1.999, and 95% CI: 1.384–2.885, respectively) (Table 3).
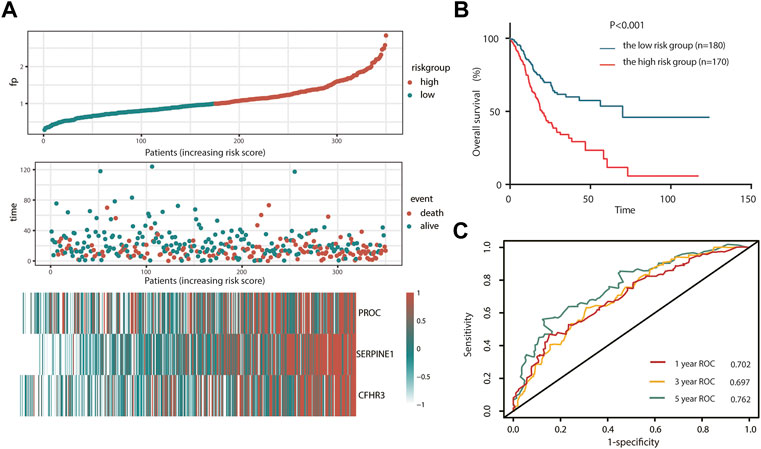
FIGURE 3. Prognosis analysis of complement system-related three-gene signature in TCGA cohort. (A) Detailed risk scores, survival status of TCGA STAD patients, and heatmap of three complement system-related genes in TCGA cohort. (B) K–M curves for the overall survival of patients in high- and low-risk groups. (C) ROC curves. K–M, Kaplan–Meier; ROC, receiver operating characteristic curve.

TABLE 3. Univariate analysis and multivariate analysis of the correlation of risk score with the outcomes among stomach adenocarcinoma patients in two cohorts.
Verification of the prognostic risk score model in the GSE84437 cohort
To test the robustness of the CSRG signature constructed from TCGA cohort, the risk score of an external validation cohort GSE84437 was calculated using the same formula. Then, the patients from the GSE84437 cohort were also categorized into high-risk (113) or low-risk (320) groups by the optimal cutoff value of the risk score. Consistent with the results obtained from TCGA cohort, patients in the high-risk group had a shorter survival time than those in the low-risk group (Figure 4A). In addition, the high-risk group was significantly associated with poor prognosis (p < 0.001, Figure 4B). In addition, the AUC of the signature was 0.740 at 1 year, 0.729 at 3 years, and 0.739 at 5 years (Figure 4C). Also, the risk score model was an independent factor in both the univariate and multivariate Cox analyses (p = 0.008, HR: 2.211, and 95% CI: 1.222–3.999; and p = 0.033, HR: 1.435, and 95% CI: 1.028–2.003, respectively) (Table 3).
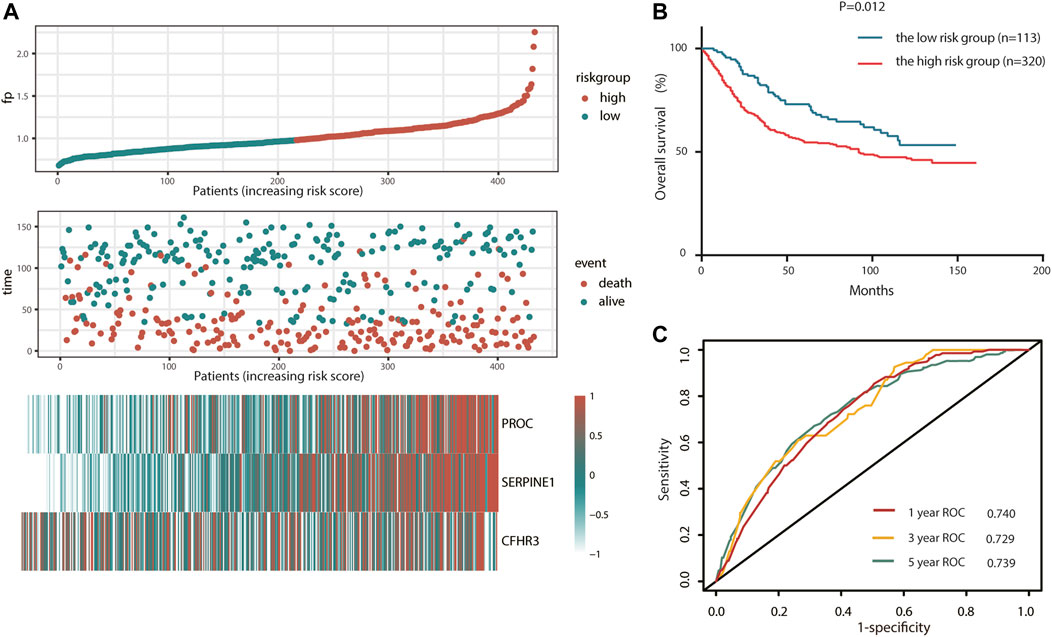
FIGURE 4. Validation of complement system-related three-gene signature in the GEO cohort. (A) Detailed risk scores, survival status of GEO STAD patients, and heatmap of three complement system-related genes in the GEO cohort. (B) K–M curves for the overall survival of patients in high- and low-risk groups. (C) ROC curves.
Landscape of the tumor microenvironment in stomach adenocarcinoma
To explore the relationship between risk score and TME, we used the ESTIMATE algorithm to determine the four scores of each sample by R software. According to the ESTIMATE algorithm, immune score, stromal score, and ESTIMATE score were significantly higher in high-risk groups, while tumor purity was higher in low-risk groups, indicating that there exist more stromal components in the TME of high-risk groups (Figures 5A–D, 6A–D).
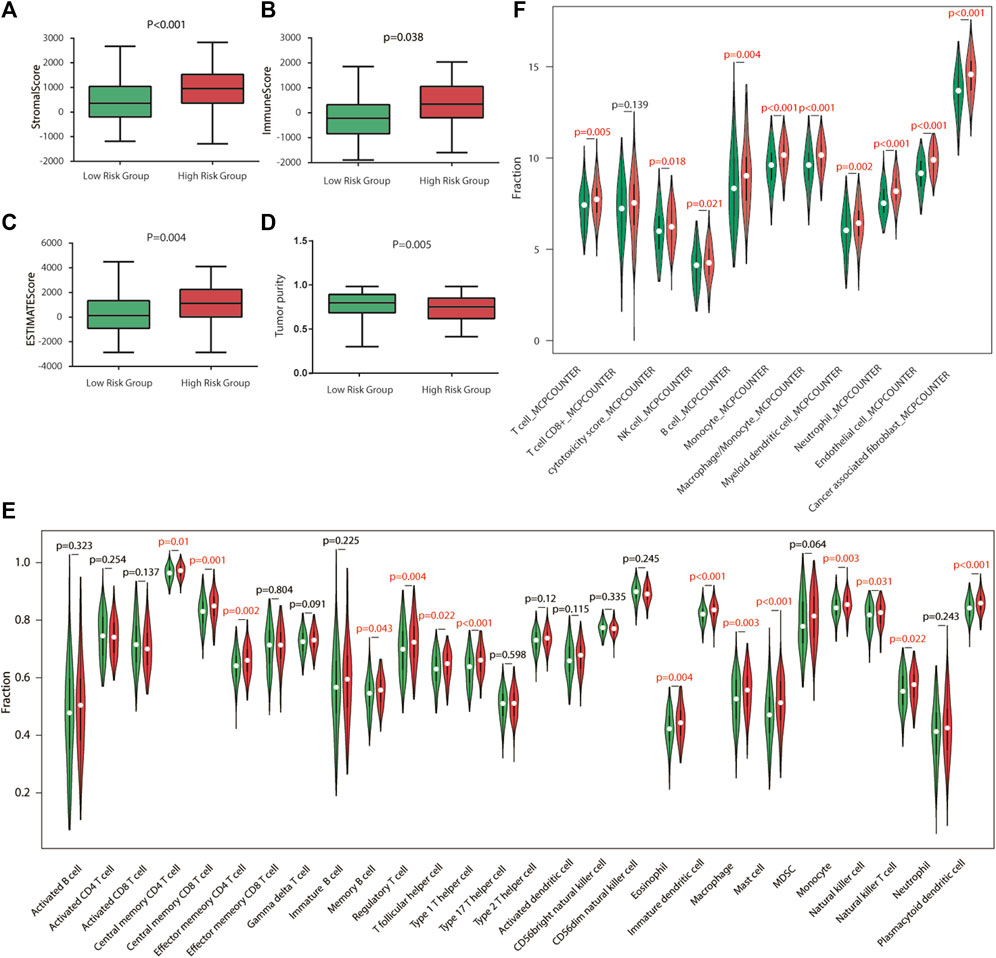
FIGURE 5. Immune characteristics of TCGA cohort. (A–D) Estimation of the proportion of immune-stromal component and tumor purity. Immune score, stromal score, ESTIMATE score (the sum of them), and tumor purity between different risk groups in TCGA cohort. (E) Different infiltrating abundances of 28 TIICs estimated by ssGSEA between subgroups. (F) Different infiltrating abundances of 11 TIICs estimated by MCP-counter between subgroups. TIICs: tumor-infiltrating immune cells.
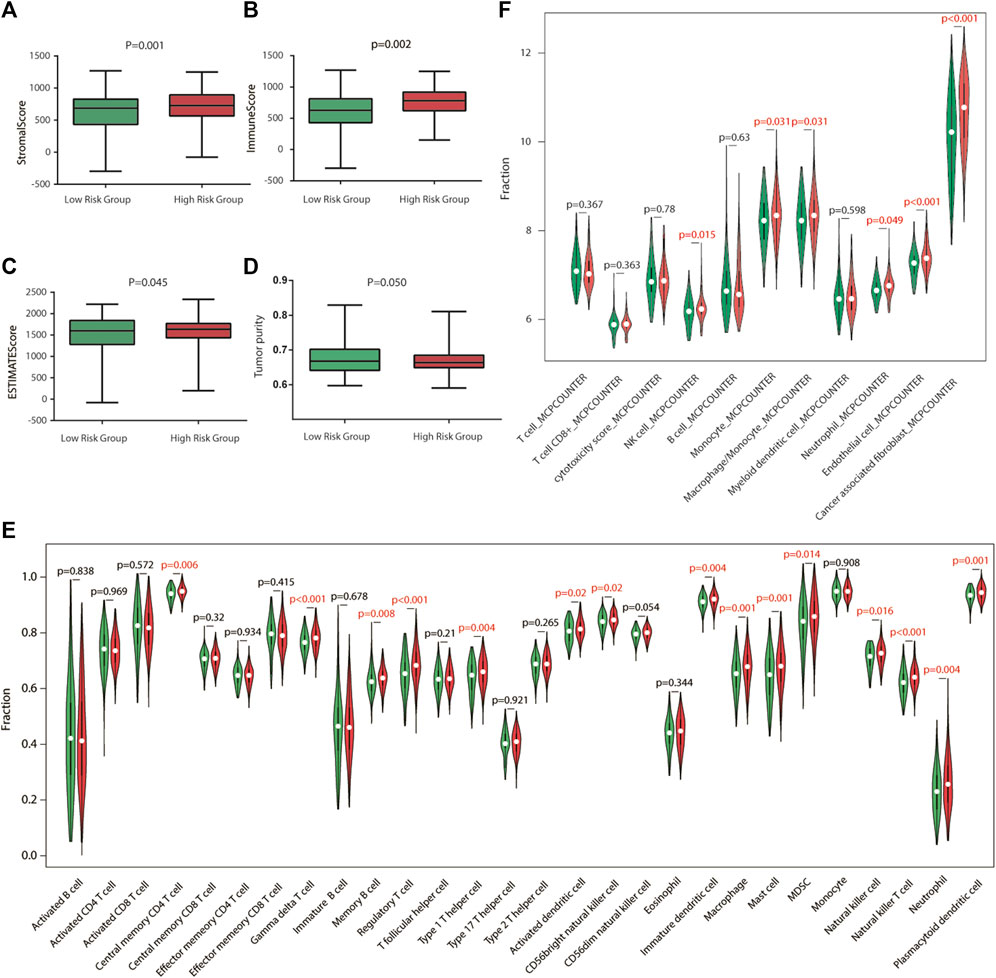
FIGURE 6. Immune characteristics of the GEO validation cohort. (A–D) Estimation of the proportion of immune-stromal component and tumor purity. Immune score, stromal score, ESTIMATE score (the sum of them), and tumor purity between different risk groups in the GEO validation cohort. (E) Different infiltrating abundances of 28 TIICs estimated by ssGSEA between subgroups. (F) Different infiltrating abundances of 11 TIICs estimated by MCP-counter between subgroups.
Landscape of immune infiltration in stomach adenocarcinoma
To analyze the immune status of each sample in TCGA and GSE84437 cohorts, the relative infiltrations of 28 TIICs in the TME were calculated using the SSGSEA algorithm in R. Detailed results are presented in Figures 5,6E. The proportions of immune cells showed differences between groups. Compared with the low-risk group, the high-risk group contained a greater number of central memory CD4 T cells, memory B cells, regulatory T cells, type 1 T helper cells, immature dendritic cells, macrophages, mast cells, natural killer cells, natural killer T cells, and plasmacytoid dendritic cells, implying that their immunological functions associated with the complement system were more active in the high-risk groups. Then, the infiltrating immune cells within TCGA and GSE84437 cohorts were also estimated by MCP-counter methods. For the MCP-counter method, we found that NK cells, monocytes, macrophages, neutrophils, and endothelial cells were elevated in the high-risk groups compared to the low-risk groups (Figures 5,6F).
Sensitivity of stomach adenocarcinoma patients to chemotherapy agents and checkpoint inhibitors
As for chemotherapy sensitivity, the six chemotherapy agents mentioned previously were selected for comparisons of IC50 values between the low- and high-risk groups. STAD high-risk patients showed lower IC50 values for rapamycin, nilotinib, 5-fluorouracil, axitinib, DMOG, and JNK inhibitor VIII (all p < 0.05), and these six drugs may be more applicable for patients with a high risk score based on the CSRGs (Figure 7A). Given the significance of immune checkpoint inhibitor-based immunotherapy, the expression levels of nine immune checkpoint molecules (CD28, CTLA4, CD274, HAVCR2, BTLA, TNFSF4, CD160, PDCD1, and TGFBR1) and nine chemokines (CCL2, CCL17, CCL18, CCL22, CCR2, CCR5, CCR6, CXCL12, and CXCR4) that were closely associated with immune cell recruitment between the low- and high-risk groups were compared to evaluate the responses of STAD patients to immunotherapy. Compared with the low-risk group, seven common immune checkpoint molecules had a higher expression in the high-risk subset, but the overexpression of CD274 and PDCD1 was nonsignificant (p = 0.274 and p = 0.370) (Figure 7B). Also, the expressions of chemokines were all upregulated in the high-risk STAD patients compared with the low-risk patients (all p < 0.05) (Figure 7C). These results suggest that the risk model based on CSRGs shows immunotherapy and chemotherapy benefits to STAD patients. In order to elucidate the differences of enriched pathways between the low-risk and high-risk groups, we performed pathway enrichment analysis by the GSEA method. There was obvious immune pathway enrichment in the high-risk group, such as T-cell receptor signaling, B-cell receptor signaling, and cancer promotion pathway such as the MAPK signaling pathway and the Wnt signaling pathway (Figure 8A). Taken together, our observations provided the clues for the association between CSRGs and abundant microenvironment in tumors (Figure 8B).
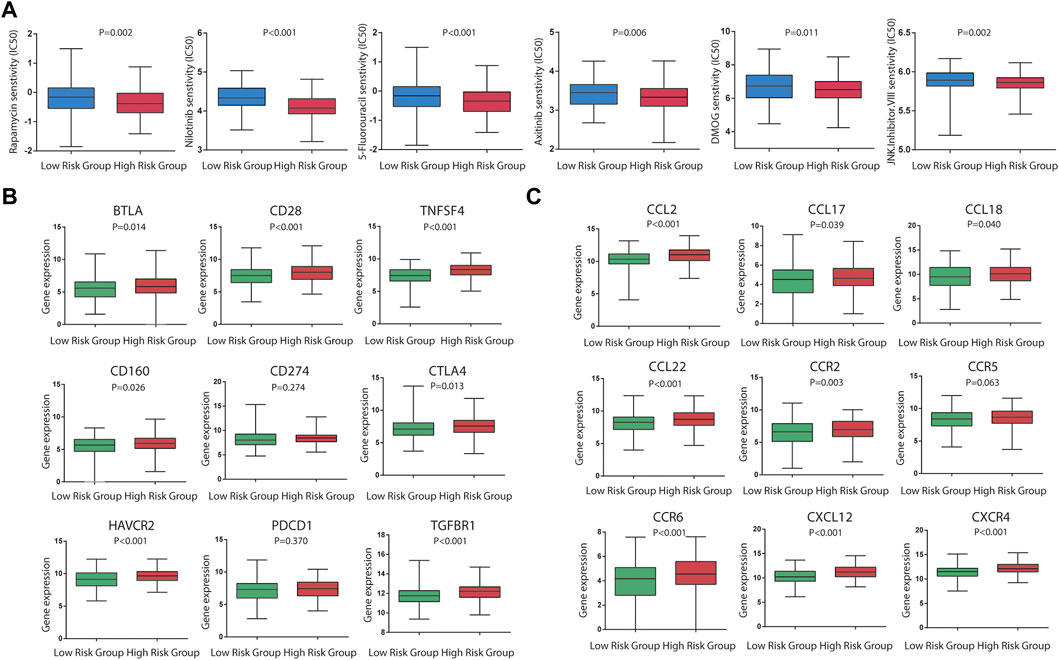
FIGURE 7. Significance of the CSRG-based signature in chemotherapy and immunotherapy. (A) Sensitivity performance of six chemotherapy agents in the high-risk and low-risk subsets (rapamycin, nilotinib, 5-fluorouracil, axitinib, DMOG, and JNK inhibitor VIII). (B) Differential expression levels of nine immune checkpoint molecules (CD28, CTLA4, CD274, HAVCR2, BTLA, TNFSF4, CD160, PDCD1, and TGFBR1) between the high-risk and low-risk patients. (C) Differential expression levels of nine immune checkpoint molecules (CD28, CTLA4, CD274, HAVCR2, BTLA,TNFSF4, CD160, PDCD1, and TGFBR1) between the high-risk and low-risk patients. (C) Differential expression levels of nine chemokines (CCL2, CCL17, CCL18, CCL22, CCR2, CCR5, CCR6, CXCL12, and CXCR4) between the high-risk and low-risk patients.
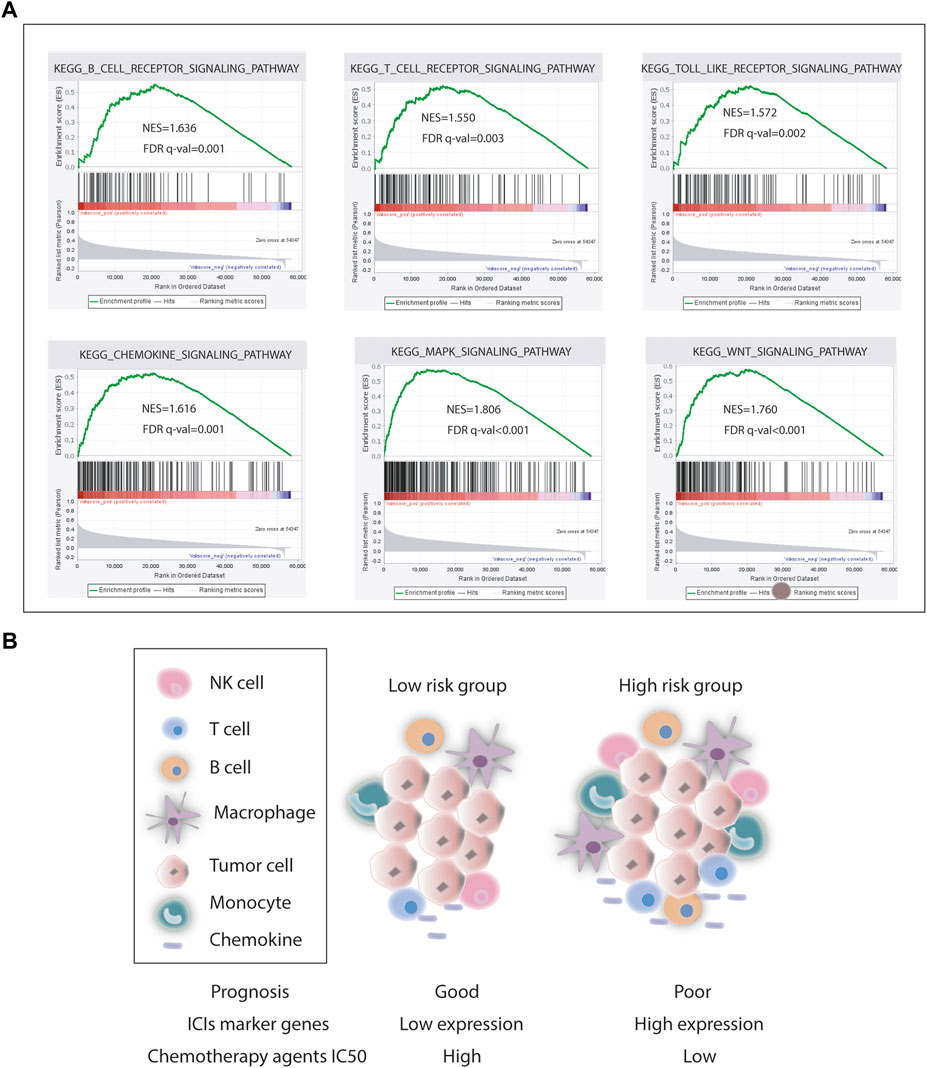
FIGURE 8. Pathway enrichment analysis. (A) Representative pathway enrichment involved in immunity and cancer development. (B) Our association analysis of survival, ICI gene expression, chemotherapy agents IC50, and tumor microenvironment in the low- and high-risk groups.
Construction and validation of the nomogram
To establish a clinically applicable method for predicting the prognosis of stomach adenocarcinoma patients, the risk score and relevant clinical parameters (age, gender, pathologic stage, T, N, and M) were included in the construction of a prognostic nomogram (Figure 9A), and the calculated C-index was 0.700. The nomogram calibration curve was then plotted to compare the predicted overall survival with the observed overall survival. The results showed excellent agreement between the nomogram prediction and actual observation in terms of the 1-, 3-, and 5-year survival rates in both TCGA cohort and the GSE84437 cohort (Figures 9 B–G).
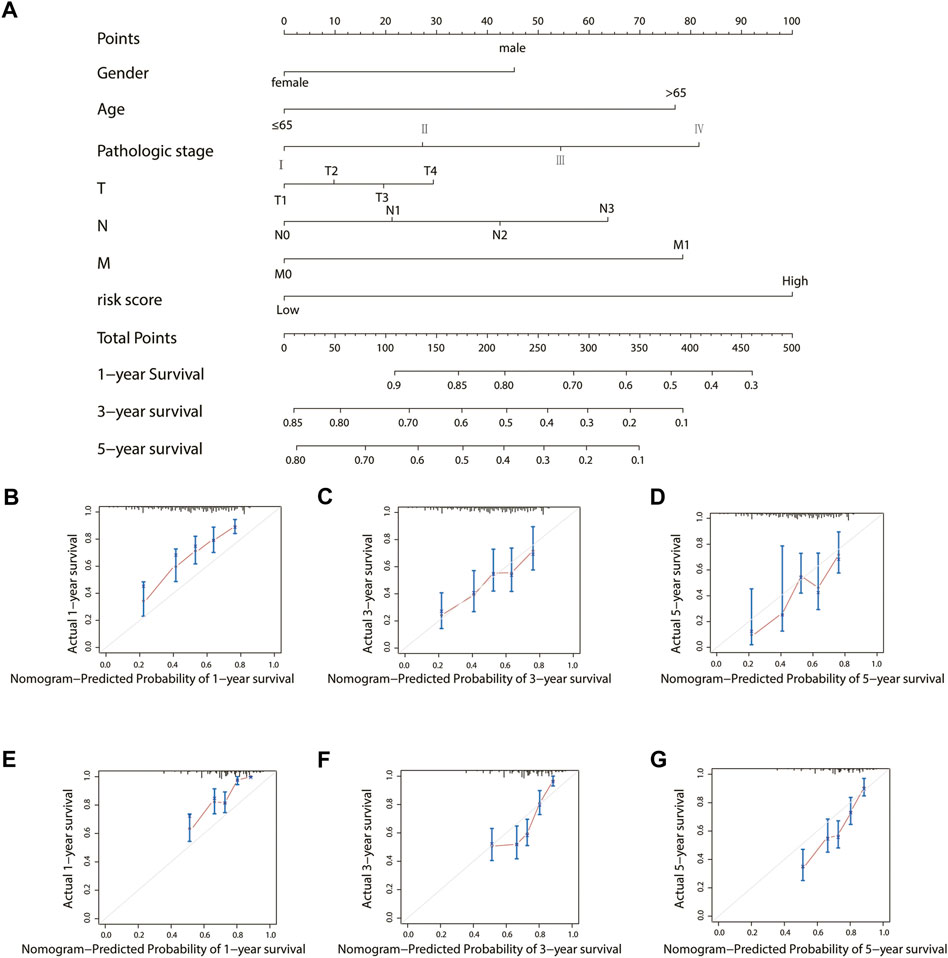
FIGURE 9. Construction and validation of a nomogram for the overall survival prediction in stomach adenocarcinoma. (A) Nomogram of TCGA cohort. (B–D) Calibration curves of the nomogram for the estimation of overall survival rates at 1-, 3-, and 5- years in TCGA cohort. (E–G) Calibration curves of the nomogram for the estimation of overall survival rates at 1-, 3-, and 5- years in the GEO validation cohort.
Exploration of the gene expression in silico and in cell lines
In TCGA database, the three genes’ mRNA expression was significantly higher in tumor tissues than that in adjacent normal tissues, both in unpaired tumor-adjacent normal STAD samples and in the paired tumor-normal STAD samples (Figures 10A–F). Their expression levels were evaluated in AGS, HGC27, and GES-1 by qRT-PCR. Consistently, compared with GES-1, SERPINE1, PROC, and CHFR3 were significantly upregulated in AGS and HGC27 (Figures 10H–J, p < 0.05).
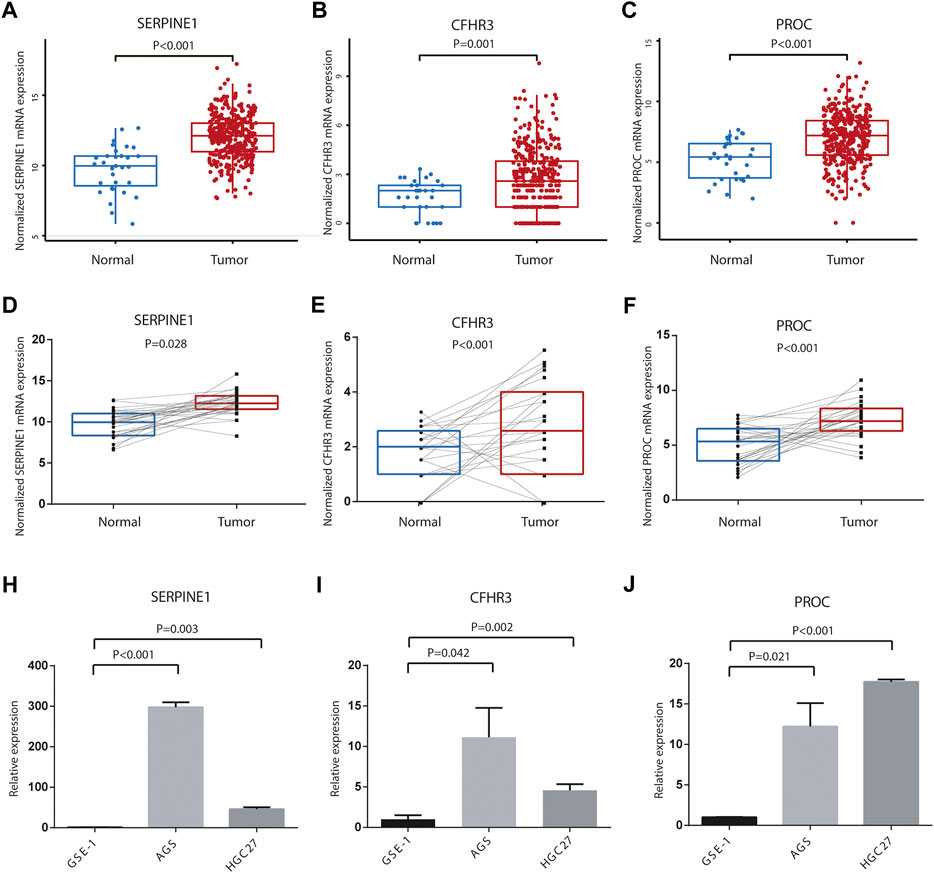
FIGURE 10. Differences of three-gene expression levels. (A) SERPINE1, (B) CFHR3, and (C) PROC mRNA expression levels were significantly different in the unpaired tumor-adjacent normal TCGA STAD samples. (D) SERPINE1, (E) CFHR3, and (F) PROC mRNA expression levels were significantly different in the paired tumor verse normal TCGA STAD samples. Relative expression levels of (H)SERPINE1, (I) CFHR3, and (J) PROC between AGS, HGC27, and GES-1.
Discussion
Stomach adenocarcinoma is a common cancer and a major cause of cancer-related deaths worldwide (Sung et al., 2021). The extremely poor prognosis of patients with stomach adenocarcinoma greatly promotes the development of an effective treatment measure (Slomski, 2019). Finding solid prognosis predictors will help the stratification of STAD patients and guide precision medical intervention (Zheng et al., 2020).
In this study, we constructed a three-gene CSRG signature that predicted both the survival and immune microenvironment for TCGA STAD patients. After discovering the survival-related CSRGs using univariate and multivariate Cox regression analyses in TCGA cohort, the stepwise multivariate Cox regression analysis was applied, and a three-gene-based signature was generated, which was related to the outcome of TCGA STAD patients. Then, the constructed model was validated in the GEO STAD cohort. ROC curve analyses indicated that the risk score derived from the gene signature could be more efficient in predicting the overall survival in the 1-, 3-, and 5-year survival. Furthermore, using the ESTIMATE, SSGSEA, and MCP-counter methods, we estimated the risk score from complement system-associated genes that were positively associated with most of immune cell infiltration and stroma components in the TME of STAD. It is well known that the TME is typically characterized into three categories (Sung et al., 2021): immune-inflamed: immune activation and abundant immune cell infiltration (Suzuki et al., 2016), immune-excluded: abundant infiltration of immune cells but could not penetrate the tumor parenchyma because of the retention of stroma surrounding cancer nests (Han et al., 2021), and immune desert: associated with immune tolerance and ignorance, and lack of activated and priming T cells (Lanitis et al., 2017). These three patterns had significantly distinct TME cell infiltration characterization. In the present study, the results showed that the high-risk group had a higher abundance of immune cell infiltration and a larger ratio of stroma component but poorer prognosis. According to these results, it was reasonable to speculate that the TME of the high-risk group was in accordance with the immune-excluded subtype. Although a high infiltration of immune cells was present in the TME, these immune cells were unable to function for the recognition and elimination of cancer cells because they were impeded by the abundant stromal element (Zhang et al., 2020). We further assessed the expression levels of these immunosuppressive gene markers and found that CSRGS is related to immune checkpoint molecules (CD28, CTLA4, HAVCR2, BTLA, TNFSF4, CD160, and TGFBR1) and chemokines (CCL2, CCL17, CCL18, CCL22, CCR2, CCR5, CCR6, CXCL12, and CXCR4). The resistance and sensitivity of chemotherapy agents were analyzed to predict the potential of CSRGs to determine the therapeutic effect. These results indicate that the CSRG signature was a potential model to determine which STAD patients are more inclined to respond to ICIs and chemotherapy agents.
Among the three genes in the risk signature, SERPINE1 protein is one important member of the serine proteinase inhibitor E superfamily, and serine protease inhibitors, termed as serpins, are key regulators of numerous biological pathways that initiate inflammation, coagulation, angiogenesis, apoptosis, extracellular matrix composition, and complement activation responses (Richardson et al., 2006; Chen et al., 2021). It has been reported as the key player for poor prognosis and carcinogenesis (Vachher et al., 2020; Wang et al., 2021). Yang et al. (2019) discovered that SERPINE1 was elevated in the gastric cancer tissues, and its upregulation contributes to the proliferation, invasion, and migration of gastric cancer cells, insinuating that SERPINE1 may be considered as a novel biomarker for gastric cancer treatment. Several studies indicated that SERPINE1 promoted tumor angiogenesis and interacted with inflammatory factors, suggesting that SERPINE1 may be related to the TME (Tan et al., 2021; Teng et al., 2021). Complement factor H-related 3 (CFHR3), belonging to the human factor H protein family, is a major regulator of the complement system, which is associated with various immune system diseases, such as age-related macular degeneration (Schafer et al., 2021), macular degeneration (SanGiovanni et al., 2017), IgA nephropathy (Jullien et al., 2018), atypical hemolytic‐uremic syndrome (Pouw et al., 2018), and systemic lupus erythematosus (Zhao et al., 2011). Yang et al. (2021) reported that the expression of CFHR3 was higher in gallbladder carcinoma tissues than that in control tissues, and higher CFHR3 was significantly correlated with poor prognosis, but its role in stomach adenocarcinoma was hardly presented. Protein C (PROC), a vitamin K-dependent glycoprotein, is one of the natural anticoagulants, which plays an important role in the inhibition of blood coagulation (Winther-Larsen et al., 2020). Hartmut Weiler reported that vascular endothelial cells are one key anatomical locale on which the protein C pathway operates to control complement, fibrinolysis, and vascular permeability, and the protein C pathway regulates complement activation by several mechanisms (Weiler, 2010). Protein C deficiency is a heritable thrombophilia caused by numerous different genetic alterations in the PROC gene, and protein C deficiency is diagnosed based on the protein C plasma activity and antigen level (Winther-Larsen et al., 2020). However, to the best of our knowledge, no systematic study of PROC in cancer has been reported.
Unlike the previous gene signature in STAD, our study was the first complement system-associated gene signature, which was thought to be highly associated with the immune status in STAD. It can predict which STAD patients are more inclined to respond to ICIs and chemotherapy agents. Our study would present new insights into the association of the complement system with immune status in STAD research.
However, this preliminary study has several limitations. First, our prognostic model was both constructed and validated with the retrospective data from public databases, and it needs to be verified on a large-scale and multicenter clinical cohort. Second, our findings have to be validated by more in vitro and in vivo experimental studies. Lastly, although we have tested the predictive effectiveness of our model several times, the intrinsic weakness is still inevitable.
Conclusion
In summary, a robust complement system-based prognostic risk score named CSRGs was constructed and validated in independent cohorts, and in the following analysis, we concluded that CSRGs and the derived model were significantly associated with immune cell infiltration in STAD, providing new insights on the complement system roles in anticancer immunity.
Data availability statement
The datasets presented in this study can be found in online repositories. The names of the repository/repositories and accession number(s) can be found in the article/Supplementary Material.
Ethics Statement
Ethical review and approval was not required for the study on human participants in accordance with the local legislation and institutional requirements. Written informed consent from the patients/participants or patients/participants’ legal guardian/next of kin was not required to participate in this study in accordance with the national legislation and the institutional requirements.
Author contributions
This work was carried out in collaboration with all authors. YL and XxT designed the theme of the manuscript. XY analyzed data and XxT wrote the manuscript. XjT and DZ reviewed and revised the manuscript.
Conflict of interest
The authors declare that the research was conducted in the absence of any commercial or financial relationships that could be construed as a potential conflict of interest.
Publisher’s note
All claims expressed in this article are solely those of the authors and do not necessarily represent those of their affiliated organizations, or those of the publisher, the editors, and the reviewers. Any product that may be evaluated in this article, or claim that may be made by its manufacturer, is not guaranteed or endorsed by the publisher.
Supplementary material
The Supplementary Material for this article can be found online at: https://www.frontiersin.org/articles/10.3389/fgene.2022.903421/full#supplementary-material.
Abbreviations
AUC, area under the curve; CAGE, cap analysis of gene expression and deep sequencing; CSRGs, complement system-related genes; GEO, Gene Expression Omnibus; GSEA, gene set enrichment analysis; HR, hazard ratio; MCP-counter, Microenvironment Cell Populations-counter; OS, overall survival; SAGE, serial analysis of gene expression; ssGSEA, single-sample Gene Set Enrichment Analysis; STAD, stomach adenocarcinoma; TCGA, The Cancer Genome Atlas; TME, tumor microenvironment.
References
Afshar-Kharghan, V. (2017). The role of the complement system in cancer. J. Clin. Invest. 127 (3), 780–789. doi:10.1172/JCI90962
Becht, E., Giraldo, N. A., Lacroix, L., Buttard, B., Elarouci, N., Petitprez, F., et al. (2016). Estimating the population abundance of tissue-infiltrating immune and stromal cell populations using gene expression. Genome Biol. 17 (1), 218. doi:10.1186/s13059-016-1070-5
Charoentong, P., Finotello, F., Angelova, M., Mayer, C., Efremova, M., Rieder, D., et al. (2017). Pan-cancer immunogenomic analyses reveal genotype-immunophenotype relationships and predictors of response to checkpoint blockade. Cell. Rep. 18 (1), 248–262. doi:10.1016/j.celrep.2016.12.019
Chen, J., Li, G. Q., Zhang, L., Tang, M., Cao, X., Xu, G. L., et al. (2018). Complement C5a/C5aR pathway potentiates the pathogenesis of gastric cancer by down-regulating p21 expression. Cancer Lett. 412, 30–36. doi:10.1016/j.canlet.2017.10.003
Chen, T. Y., Zhou, M., Lin, M. Q., Liang, S. T., Yan, Y., Wang, S. M., et al. (2021). Research progress on the SERPINE1 protein and chronic inflammatory diseases of the upper respiratory tract: A literature review. Int. Arch. Allergy Immunol. 182 (11), 1097–1102. doi:10.1159/000516195
Conigliaro, P., Triggianese, P., Ballanti, E., Perricone, C., Perricone, R., and Chimenti, M. S. (2019). Complement, infection, and autoimmunity. Curr. Opin. Rheumatol. 31 (5), 532–541. doi:10.1097/BOR.0000000000000633
Garred, P., Tenner, A. J., and Mollnes, T. E. (2021). Therapeutic targeting of the complement system: From rare diseases to pandemics. Pharmacol. Rev. 73 (2), 792–827. doi:10.1124/pharmrev.120.000072
Geeleher, P., Cox, N., and Huang, R. S. (2014). pRRophetic: an R package for prediction of clinical chemotherapeutic response from tumor gene expression levels. PloS one 9 (9), e107468. doi:10.1371/journal.pone.0107468
Guo, X., Pan, Y., Xiong, M., Sanapala, S., Anastasaki, C., Cobb, O., et al. (2020). Midkine activation of CD8(+) T cells establishes a neuron-immune-cancer axis responsible for low-grade glioma growth. Nat. Commun. 11 (1), 2177. doi:10.1038/s41467-020-15770-3
Han, C., Zhang, C., Wang, H., Li, K., and Zhao, L. (2021). Angiogenesis-related lncRNAs predict the prognosis signature of stomach adenocarcinoma. BMC cancer 21 (1), 1312. doi:10.1186/s12885-021-08987-y
Jullien, P., Laurent, B., Claisse, G., Masson, I., Dinic, M., Thibaudin, D., et al. (2018). Deletion variants of CFHR1 and CFHR3 associate with mesangial immune deposits but not with progression of IgA nephropathy. J. Am. Soc. Nephrol. 29 (2), 661–669. doi:10.1681/ASN.2017010019
Lanitis, E., Dangaj, D., Irving, M., and Coukos, G. (2017). Mechanisms regulating T-cell infiltration and activity in solid tumors. Ann. Oncol. 28, xii18–xii32. doi:10.1093/annonc/mdx238
Liu, H., Ni, S., Wang, H., Zhang, Q., and Weng, W. (2020). Charactering tumor microenvironment reveals stromal-related transcription factors promote tumor carcinogenesis in gastric cancer. Cancer Med. 9 (14), 5247–5257. doi:10.1002/cam4.3133
Newman, A. M., Liu, C. L., Green, M. R., Gentles, A. J., Feng, W., Xu, Y., et al. (2015). Robust enumeration of cell subsets from tissue expression profiles. Nat. Methods 12 (5), 453–457. doi:10.1038/nmeth.3337
Pouw, R. B., Gomez Delgado, I., Lopez Lera, A., Rodriguez de Cordoba, S., Wouters, D., Kuijpers, T. W., et al. (2018). High complement factor H-related (FHR)-3 levels are associated with the atypical hemolytic-uremic syndrome-risk allele CFHR3*B. Front. Immunol. 9, 848. doi:10.3389/fimmu.2018.00848
Ren, N., Liang, B., and Li, Y. (2020). Identification of prognosis-related genes in the tumor microenvironment of stomach adenocarcinoma by TCGA and GEO datasets. Biosci. Rep. 40 (10), BSR20200980. doi:10.1042/BSR20200980
Richardson, J., Viswanathan, K., and Lucas, A. (2006). Serpins, the vasculature, and viral therapeutics. Front. Biosci. 11, 1042–1056. doi:10.2741/1862
SanGiovanni, J. P., SanGiovanni, P. M., Sapieha, P., and De Guire, V. (2017). miRNAs, single nucleotide polymorphisms (SNPs) and age-related macular degeneration (AMD). Clin. Chem. Lab. Med. 55 (5), 763–775. doi:10.1515/cclm-2016-0898
Schafer, N., Rasras, A., Ormenisan, D. M., Amslinger, S., Enzmann, V., Jagle, H., et al. (2021). Complement factor H-related 3 enhanced inflammation and complement activation in human RPE cells. Front. Immunol. 12, 769242. doi:10.3389/fimmu.2021.769242
Slomski, A. (2019). H pylori treatment may reduce long-term gastric cancer risk. Jama 322 (20), 1948. doi:10.1001/jama.2019.18424
Sung, H., Ferlay, J., Siegel, R. L., Laversanne, M., Soerjomataram, I., Jemal, A., et al. (2021). Global cancer statistics 2020: GLOBOCAN estimates of incidence and mortality worldwide for 36 cancers in 185 countries. Ca. Cancer J. Clin. 71 (3), 209–249. doi:10.3322/caac.21660
Suzuki, H., Oda, I., Abe, S., Sekiguchi, M., Mori, G., Nonaka, S., et al. (2016). High rate of 5-year survival among patients with early gastric cancer undergoing curative endoscopic submucosal dissection. Gastric Cancer 19 (1), 198–205. doi:10.1007/s10120-015-0469-0
Tan, P., Chen, H., Huang, Z., Huang, M., Du, Y., Li, T., et al. (2021). MMP25-AS1/hsa-miR-10a-5p/SERPINE1 axis as a novel prognostic biomarker associated with immune cell infiltration in KIRC. Mol. Ther. Oncolytics 22, 307–325. doi:10.1016/j.omto.2021.07.008
Teng, F., Zhang, J. X., Chen, Y., Shen, X. D., Su, C., Guo, Y. J., et al. (2021). LncRNA NKX2-1-AS1 promotes tumor progression and angiogenesis via upregulation of SERPINE1 expression and activation of the VEGFR-2 signaling pathway in gastric cancer. Mol. Oncol. 15 (4), 1234–1255. doi:10.1002/1878-0261.12911
Ueda, Y., Mohammed, I., Song, D., Gullipalli, D., Zhou, L., Sato, S., et al. (2017). Murine systemic thrombophilia and hemolytic uremic syndrome from a factor H point mutation. Blood 129 (9), 1184–1196. doi:10.1182/blood-2016-07-728253
Vachher, M., Arora, K., Burman, A., and Kumar, B. (2020). NAMPT, GRN, and SERPINE1 signature as predictor of disease progression and survival in gliomas. J. Cell. Biochem. 121 (4), 3010–3023. doi:10.1002/jcb.29560
Wang, S., Pang, L., Liu, Z., and Meng, X. (2021). SERPINE1 associated with remodeling of the tumor microenvironment in colon cancer progression: A novel therapeutic target. BMC cancer 21 (1), 767. doi:10.1186/s12885-021-08536-7
Weiler, H. (2010). Regulation of inflammation by the protein C system. Crit. Care Med. 38, S18–S25. doi:10.1097/CCM.0b013e3181c9cbb5
Winther-Larsen, A., Kjaergaard, A. D., Larsen, O. H., Hvas, A. M., and Nissen, P. H. (2020). Protein C deficiency; PROC gene variants in a Danish population. Thromb. Res. 185, 153–159. doi:10.1016/j.thromres.2019.11.027
Yang, C., Chen, J., Yu, Z., Luo, J., Li, X., Zhou, B., et al. (2021). Mining of RNA methylation-related genes and elucidation of their molecular biology in gallbladder carcinoma. Front. Oncol. 11, 621806. doi:10.3389/fonc.2021.621806
Yang, J. D., Ma, L., and Zhu, Z. (2019). SERPINE1 as a cancer-promoting gene in gastric adenocarcinoma: Facilitates tumour cell proliferation, migration, and invasion by regulating EMT. J. Chemother. 31 (7-8), 408–418. doi:10.1080/1120009X.2019.1687996
Yoshihara, K., Shahmoradgoli, M., Martinez, E., Vegesna, R., Kim, H., Torres-Garcia, W., et al. (2013). Inferring tumour purity and stromal and immune cell admixture from expression data. Nat. Commun. 4, 2612. doi:10.1038/ncomms3612
Yuan, K., Ye, J., Liu, Z., Ren, Y., He, W., Xu, J., et al. (2020). Complement C3 overexpression activates JAK2/STAT3 pathway and correlates with gastric cancer progression. J. Exp. Clin. Cancer Res. 39 (1), 9. doi:10.1186/s13046-019-1514-3
Zeng, D., Wu, J., Luo, H., Li, Y., Xiao, J., Peng, J., et al. (2021). Tumor microenvironment evaluation promotes precise checkpoint immunotherapy of advanced gastric cancer. J. Immunother. Cancer 9 (8), e002467. doi:10.1136/jitc-2021-002467
Zhang, B., Wu, Q., Li, B., Wang, D., Wang, L., and Zhou, Y. L. (2020). m(6 A regulator-mediated methylation modification patterns and tumor microenvironment infiltration characterization in gastric cancer. Mol. Cancer 19 (1), 53. doi:10.1186/s12943-020-01170-0
Zhao, J., Wu, H., Khosravi, M., Cui, H., Qian, X., Kelly, J. A., and et al., (2011). Association of genetic variants in complement factor H and factor H-related genes with systemic lupus erythematosus susceptibility. PLoS Genet. 7 (5), e1002079. doi:10.1371/journal.pgen.1002079
Keywords: stomach adenocarcinoma, complement system, prognostic value, gene signature, tumor immunity
Citation: Tong X, Yang X, Tong X, Zhai D and Liu Y (2022) Complement system-related genes in stomach adenocarcinoma: Prognostic signature, immune landscape, and drug resistance. Front. Genet. 13:903421. doi: 10.3389/fgene.2022.903421
Received: 24 March 2022; Accepted: 17 August 2022;
Published: 08 September 2022.
Edited by:
Lianmei Zhao, Fourth Hospital of Hebei Medical University, ChinaReviewed by:
Amr Ahmed El-Arabey, Al-Azhar University, EgyptQinghong Guo, First Hospital of Lanzhou University, China
Qijie Guan, Jiangnan University, China
Copyright © 2022 Tong, Yang, Tong, Zhai and Liu. This is an open-access article distributed under the terms of the Creative Commons Attribution License (CC BY). The use, distribution or reproduction in other forums is permitted, provided the original author(s) and the copyright owner(s) are credited and that the original publication in this journal is cited, in accordance with accepted academic practice. No use, distribution or reproduction is permitted which does not comply with these terms.
*Correspondence: Yonglei Liu, eW9uZ2xlaWxpdUB5ZWFoLm5ldA==
†These authors have contributed equally to this work
 Xiaoxia Tong
 Xiaohu Yang1†
 Yonglei Liu