 Xinpei Gu
 Liuxi Chu
 Yanlan Kang
95% of researchers rate our articles as excellent or good
Learn more about the work of our research integrity team to safeguard the quality of each article we publish.
Find out more
ORIGINAL RESEARCH article
Front. Genet. , 18 May 2022
Sec. Computational Genomics
Volume 13 - 2022 | https://doi.org/10.3389/fgene.2022.894024
This article is part of the Research Topic Deep Learning to Disease Prediction on Next Generation Sequencing and Biomedical Imaging Data View all 12 articles
Non-small-cell lung cancer (NSCLC) is one of the most common malignancies, and specific molecular targets are still lacking. Angiogenesis plays a central regulatory role in the growth and metastasis of malignant tumors and angiogenic factors (AFs) are involved. Although there are many studies comparing AFs and cancer, a prognostic risk model for AFs and cancer in humans has not been reported in the literature. This study aimed to identify the key AFs closely related to the process of NSCLC development, and four genes have been found, C1QTNF6, SLC2A1, PTX3, and FSTL3. Then, we constructed a novel prognostic risk model based on these four genes in non-small-cell lung cancer (NSCLC) and fully analyzed the relationship with clinical features, immune infiltration, genomes, and predictors. This model had good discrimination and calibration and will perform well in predicting the prognosis of treatment in clinical practice.
Lung cancer is one of the malignant tumors with the highest incidence and mortality worldwide (Hirsch et al., 2017). Every year, 1.8 million people (11.6% of total cases) are diagnosed with lung cancer, and about 1.6 million people (18.4% of total cancer deaths) died because of lung cancer. There are two basic forms of lung cancer, small cell lung cancer (SCLC) and non-small-cell lung cancer (NSCLC), and NSCLC accounts for approximately 85% (Ettinger et al., 2013; Gridelli et al., 2015). NSCLC is characterized by poor survival, and despite significant advances in new chemotherapeutic drugs and clinical surgery, the prognosis remains suboptimal (Ettinger et al., 2013; Gridelli et al., 2015; Ettinger et al., 2021). With the advent of targeted molecular therapy and immune checkpoint inhibitors, the use of biomarkers in identifying patients is becoming increasingly common (Ma et al., 2019; Wang et al., 2019). The existing evidence has suggested that targeted therapies have favorable therapeutic effects. However, acquired resistance has become a major obstacle in the field of targeted therapies (Chatterjee and Bivona 2019). Thus, more novel driver genes, therapeutic targets, and prognostic biomarkers must be discovered and used for targeted therapy in larger populations, more accurate prognosis prediction, and a better understanding of the mechanisms of lung cancer development.
Tumors can promote tumor angiogenesis, leading to angiogenesis, which is the one of hallmarks of cancer (Hanahan and Weinberg 2000). The process of new blood vessel formation is critical in supporting tumor growth, and solid tumors secrete angiogenic factors (AFs) implicated in the complex regulation of angiogenesis (Goveia et al., 2020). Numerous important target molecules of AFs in NSCLC and other cancers, such as vascular endothelial growth factor (VEGF) (Zhang 2015) and epidermal growth factor receptor (EGFR) (Oxnard et al., 2011), have all become clinical targets for antitumor angiogenesis. Antiangiogenic medications are increasingly used as anticancer drugs for first-line treatment. Moreover, since the introduction of the first humanized anti-VEGF monoclonal antibody, bevacizumab (Avastin), available in 2004 (Ferrara et al., 2005), there have been nearly 30 antiangiogenic drugs approved by the FDA (Lugano et al., 2020). AFs are also expected to be optimal therapeutic targets. Several significant global studies noted that angiogenesis inhibitors combined with immunotherapy can enhance the curative effect. There is increasing evidence that targeting angiogenesis improves the efficiency of cancer immunotherapy. A programmed cell death 1 (PD-1) inhibitor and camrelizumab (AiRuiKa™) can improve the treatment effect of chemotherapeutics in multiple types of cancers (Markham and Keam 2019). However, apatinib, a vascular endothelial growth factor receptor 2 (VEGFR2) tyrosine kinase inhibitor, has been shown to increase the infiltration of CD8+ T cells, reduce the recruitment of tumor-associated macrophages, and improve the effect of PD-1 inhibitors (Zhao et al., 2019).
Despite many studies investigating the association between AFs and cancers, whether AFs can be used as biomarkers to predict the prognosis of NSCLC patients is still unknown. In our study, based on the machine algorithms and bioinformatics methods, AF-related risk score (AFRS) was established. Four key prognosis-related AFs, C1QTNF6, SLC2A1, PTX3, and FSTL3, were first screened using bioinformatics analysis of differentially expressed genes (DEGs). Then, we attempted to construct a new risk score model to predict NSCLC, and we further analyzed the clinical features, immune infiltration, genomes, and multiple predictors. To further validate the AF-related prognostic risk score model, we used external dataset validation. An overview of this study is shown in Supplementary Figure S1.
The expression profile data of NSCLC patients were downloaded from the UCSC database. The detailed clinical features of these patients are summarized in Table 1.
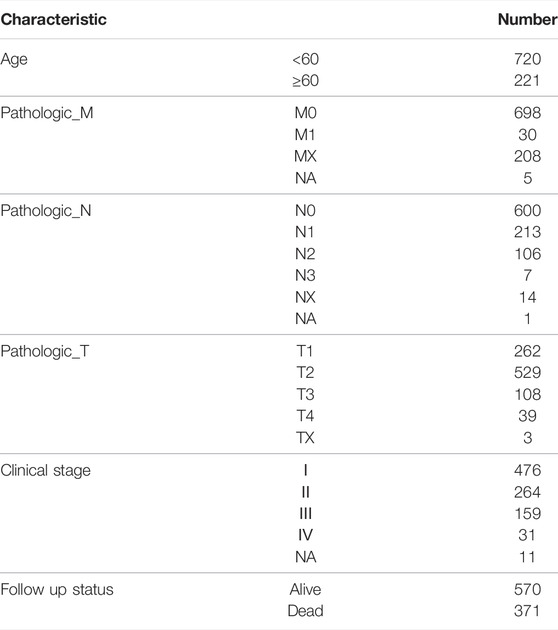
TABLE 1. Clinic pathological data of patients with NSCLC in this study.
We identified a total of 372 differentially expressed AF genes in cancer and normal samples (with a threshold of adj.P.Val<0.01 & |log (FC) |≥1) (Figures 1A,B). GO and KEGG functional enrichment analyses of the differentially expressed AF genes were then performed (Figures 1C–F). The enriched GO terms of DEGs were classified into three categories: molecular functions, cellular components, and biological processes. The results revealed that these genes were enriched for GO terms such as regulation of vasculature development, regulation of angiogenesis, ameboidal-type cell migration, and positive regulation of vasculature development, epithelial cell proliferation, and tissue migration. The KEGG pathway enrichment showed the enrichment of critical pathways involved in tumorigenesis and metastasis, including pathways in cancer, focal adhesion, the MAPK signaling pathway, the chemokine signaling pathway, the TGF-β signaling pathway, and renal cell carcinoma. The top 15 highly enriched KEGG pathways are presented in Figure 1F.
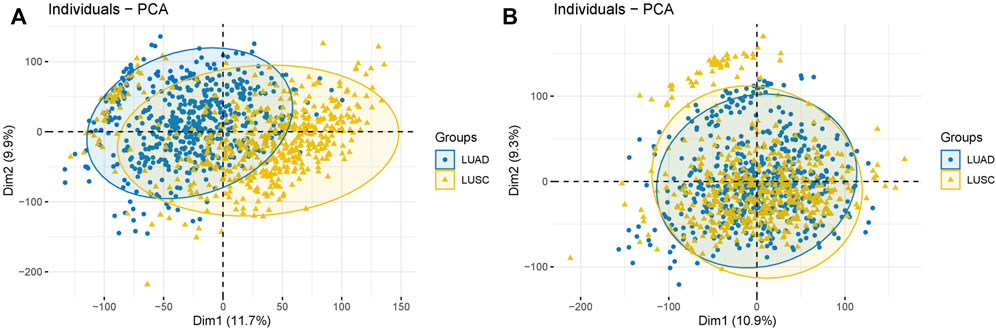
FIGURE 1. Batch effect removal. (A) Before batch effects were removed. (B) After batch effects were removed.
We performed a univariate Cox regression analysis of these differentially expressed AF genes and identified 58 AF-related genes that were associated with the prognosis of NSCLC. We performed survival analyses of the top five genes in terms of the p-value (Figures 2A–E). The low expression of these five genes was associated with a worse prognosis (Figure 2F).
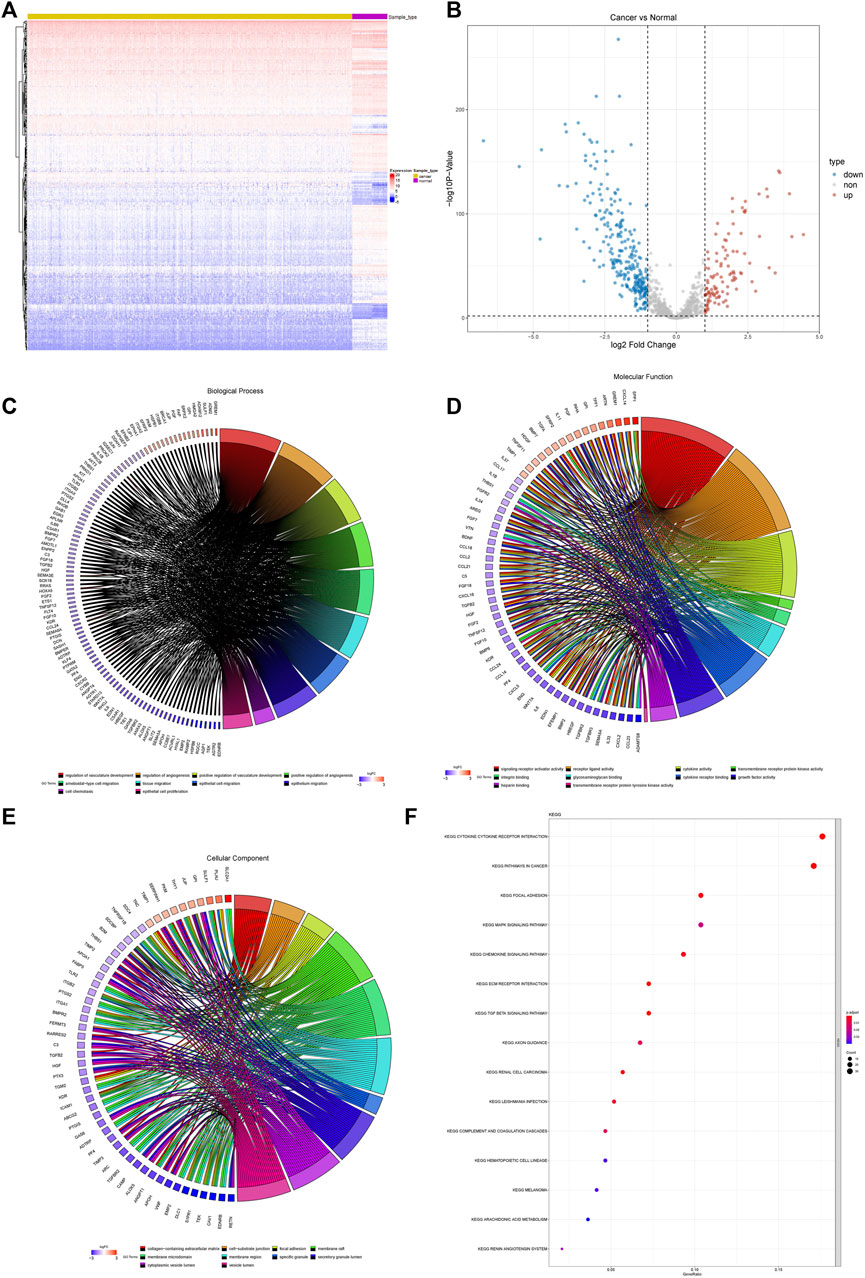
FIGURE 2. Differential expression and functional enrichment of AF genes in non-small-cell lung cancer. (A) Heatmap and clustering of differentially expressed AF genes. (B) Volcano map of differentially expressed AF genes. (C) GO biological processes (D) GO molecular functions (E) GO cellular components and (F) KEGG.
A total of five AF genes significantly associated with prognosis (p < 0.001) in the univariate Cox regression were further selected for lasso regression (Supplementary Figure S2). We first used cross-validation to identify the minimal lambda, i.e. lambda min, and then selected the four most significant genes using lambda min to develop the prognostic risk model. The optimized model was: risk score = 0.104 * SLC2A1 + 0.138 * FSTL3 + 0.069 *C1QTNF6 + 0.046 * PTX3. We calculated the risk scores of each sample using this formula and classified all the samples into high- and low-risk groups according to the median for further analysis.
To validate the performance of our model, we plotted the Kaplan–Meier survival curves of the high- and low-risk groups (Figure 3A). A significant association was shown between the risk group and survival (p < 0.0001), suggesting that the model had a high prognostic value. Time-dependent ROC curves were further plotted, which showed AUC>0.6 in the 1-year, 3-years, and 5-years ROC curves. This indicated that the model had good prediction ability (Figure 3B). Based on the optimistic cutoff, the patients were divided into high AF risk score and low AF risk score groups (Figures 3C–F).
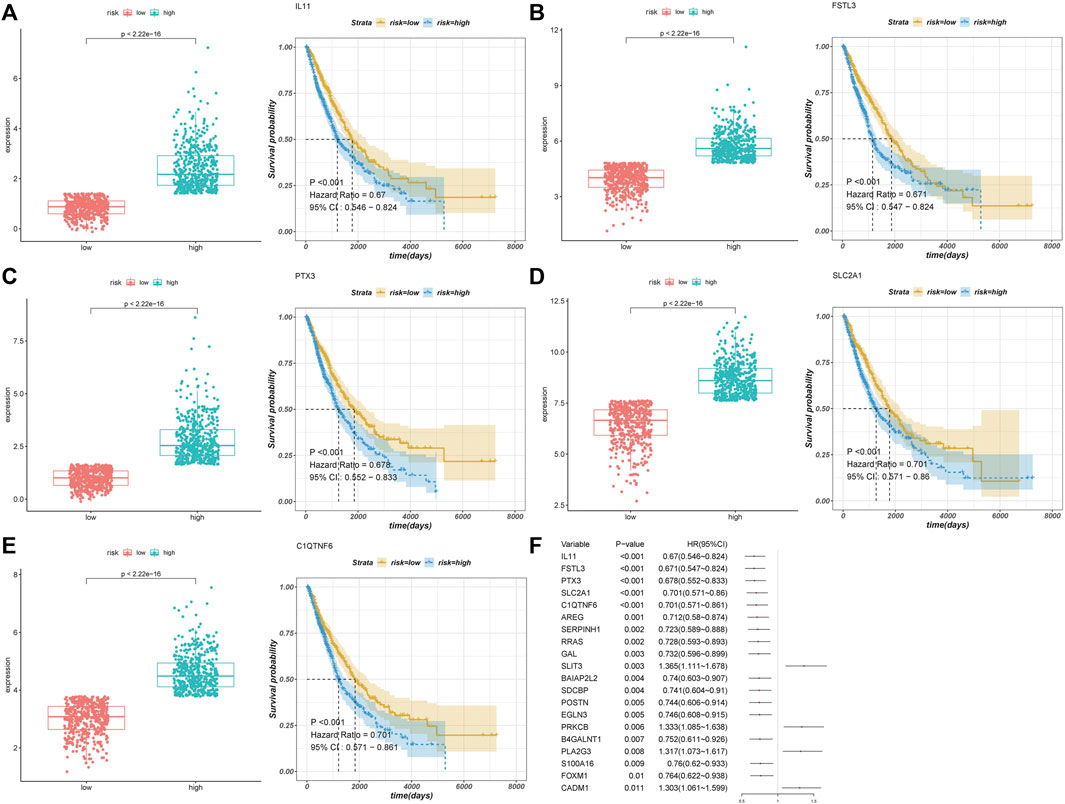
FIGURE 3. Univariate Cox regression analysis. (A–E) Top five prognostic genes. (F) Forest plot of the top 20 genes.
We used the GSE4573 and GSE68465 datasets to validate the model (Figures 4A–D). We combined the two datasets and removed the batch effect. We selected the prognostic genes in the datasets (C1QTNF6 was not identified) and calculated the risk score using the coefficients in the model for validation. The Kaplan–Meier plot showed that the samples in the high-risk group had a worse prognosis with a p-value < 0.05, which indicated that our model had high accuracy.
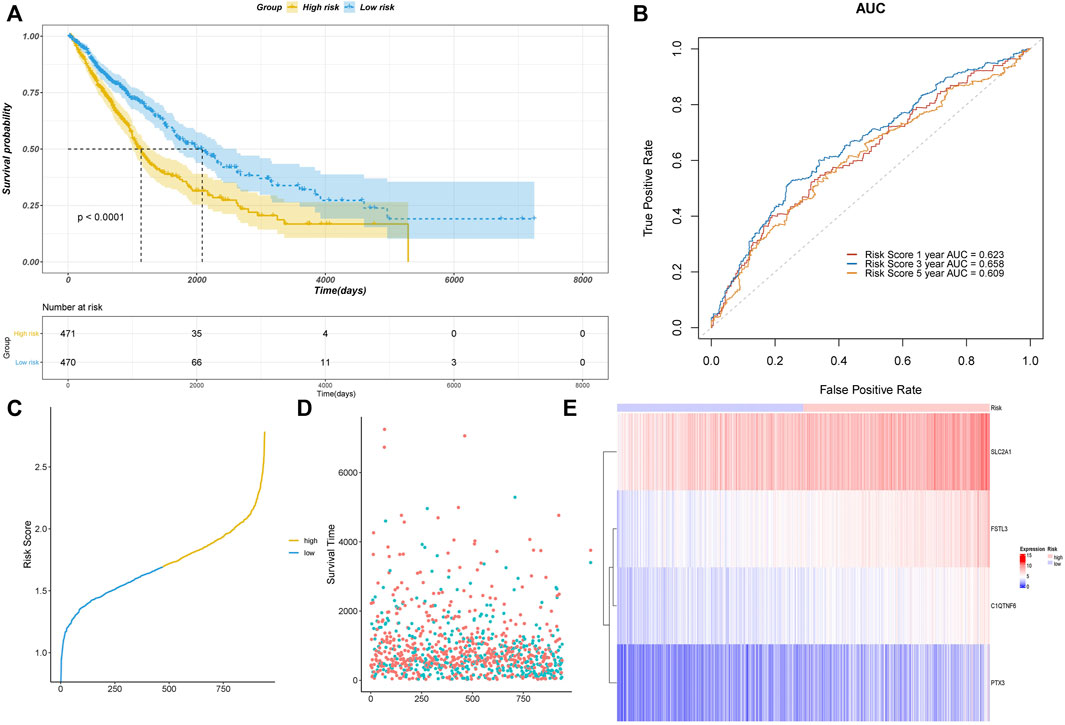
FIGURE 4. Assessment of the risk model based on TCGA data. (A) Kaplan–Meier curve validation. (B) ROC curve validation. (C) Risk score of all samples. (D) Scatter plot of the survival time of all samples. (E) Heatmap of the prognostic genes in high- and low-risk groups.
We analyzed the difference in AF risk scores of each group that was stratified by clinical characteristics. The risk score of LUSC was significantly higher than that of LUAD (Figure 5A). The risk score of the samples with EGFR mutations was significantly lower than that of samples without EGFR mutations (Figure 5B). The risk score also differed significantly across the different tumor stages and TNM stages, which was consistent with the process of carcinogenesis (Figures 5C–F). The patients with a smoking history also had significantly higher risk scores than those who never smoked (Figure 5G).
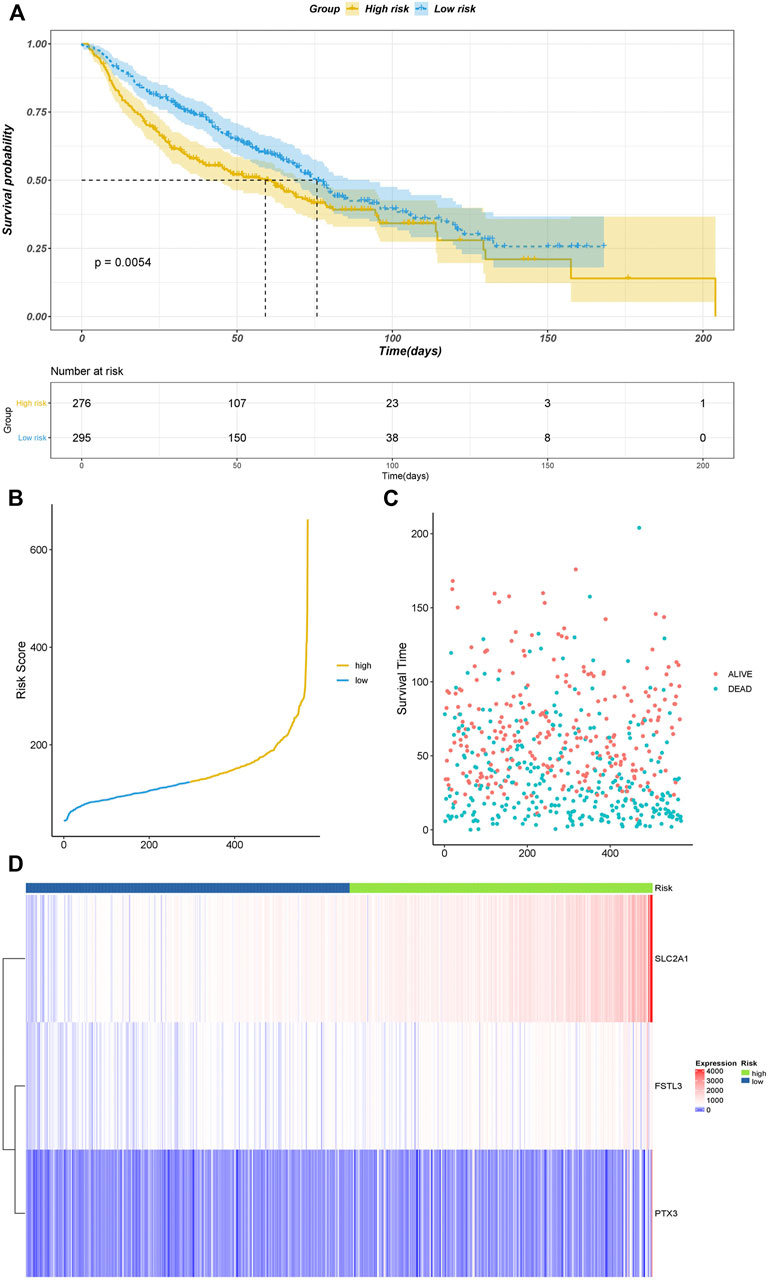
FIGURE 5. Validation results of datasets GSE4573 and GSE68465. (A) Kaplan–Meier plot. (B) Risk score of all samples. (C) Scatter plot of the survival time of all samples. (D) Heatmap of the prognostic genes in high- and low-risk groups.
We also visualized the association of the risk score with tumor mutational burden (TMB), homologous recombination deficiency (HRD), neoantigen burden, chromosomal instability (CIN), and stemness index (mRNAsi) (Figures 6A–D). TMB is a marker for genomic instability measured by sequencing the whole tumor genome and has been shown to correlate with immunotherapy (Gibney et al., 2016). Therefore, TMB is emerging as a predictor of immunotherapeutic responses. For all indexes, the highest correlation was obtained for TMB (Figure 6A). This further illustrates that the interaction of AFs can affect immunotherapy. The discovery of homologous recombination deficiency (HRD) in lung cancer is of great importance for patients who will benefit from poly ADP-ribose polymerase inhibitor (PARPi) (Weston et al., 2010). However, we did not find a correlation between HRD and AFs (Figure 2B). Neoantigens are another important index for predicting the clinical response to immunotherapy. The current studies of neoantigen sources mainly focus on single nucleotide variants (SNVs), such as small insertions and deletions (indels), somatic copy number variations (SCNVs), and large scale transition (LSTms). Similarly, we found no significant differences in these parameters (Figures 6C–H). The stemness index (mRNAsi) is used to measure the tumor development and evaluate the reliability of stem cell indexes as shown in Figures 6A,I significant positive correlation was found between AFs and mRNAsi. These results confirmed that AFs were related to biological processes, cancer metastasis, and the immune microenvironment.
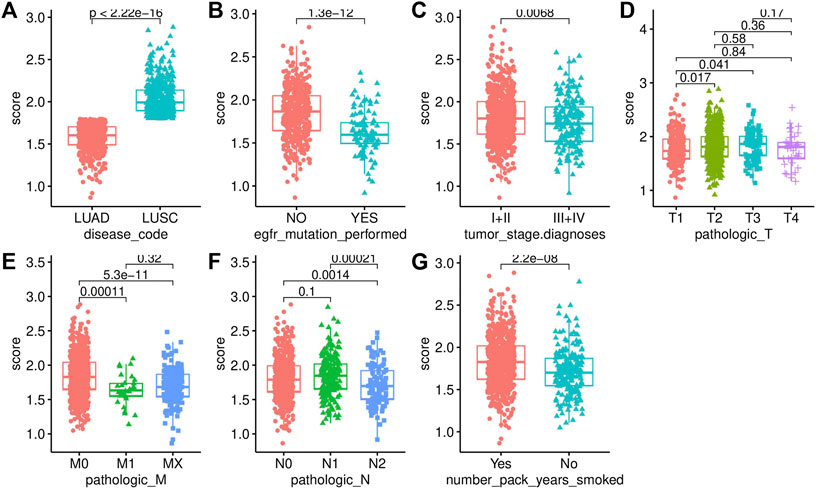
FIGURE 6. Association analysis with clinical characteristics. (A) Disease code. (B) EGFR mutation status. (C) Tumor stage. (D) T stage. (E) M stage. (F) N stage. (G) Smoking history.
The immune infiltration status was highly associated with the prognosis of NSCLC. We used the CIBERSORT algorithm to calculate and compare the proportion of immune infiltration in the high- and low-risk groups based on TCGA data (Figure 7A). The proportions of naive B cells, memory activated CD4 T cells, gammadelta T cells, and resting dendritic cells were significantly increased in the low-risk group, while the proportions of memory B cells, and macrophages. M0, macrophages. M2, and activated mast cells was significantly higher in the high-risk group, which indicated that the immune infiltration status was different in the high- and low-risk groups.
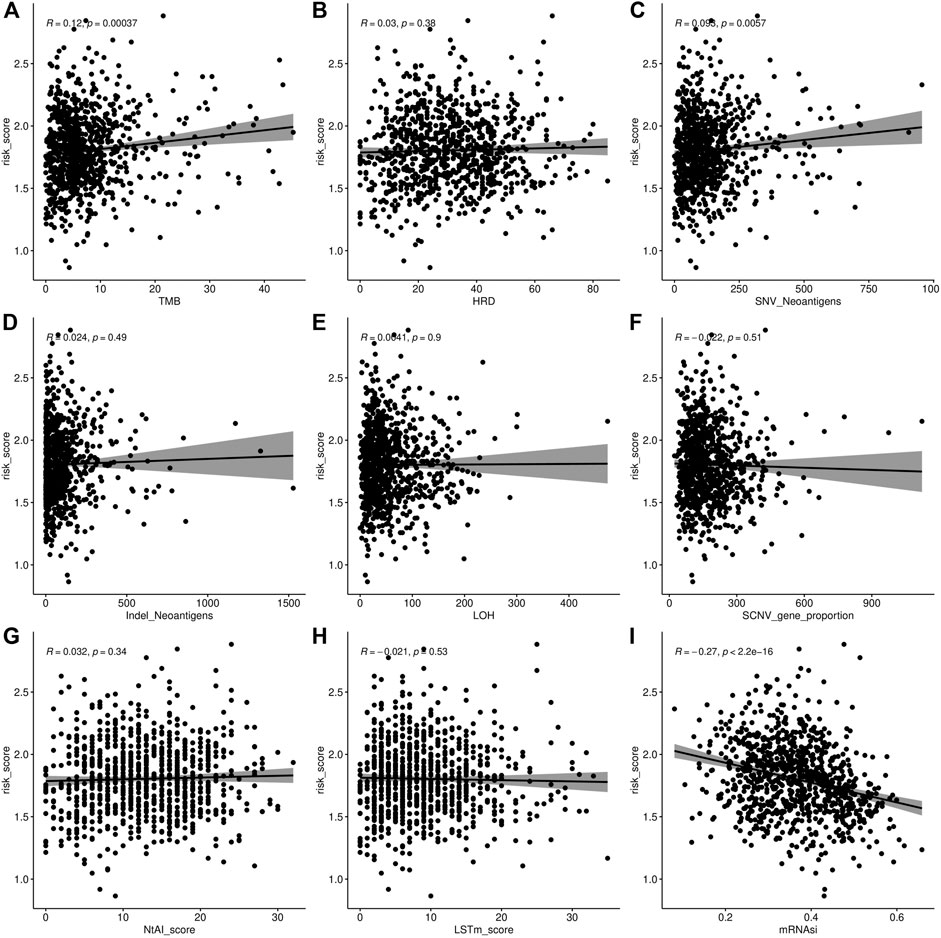
FIGURE 7. Association analysis of AF risk score. (A) Tumor mutational burden and AF risk score. (B) Homologous recombination deficiency and AF risk score. (C–D) Neoantigen burden and AF risk score. (E) Loss of heterozygosity (LOH) in chromosome instability and AF risk score. (F) SCNV of chromosome instability and AF risk score. (G) Telomeric allelic imbalance (NtAI) of chromosome instability and AF risk score. (H) Large scale transition (LSTm) (I) Stemness index and AF risk score.
We also found that the stroma score (p = 7.8e-16), immune score (p = 0.012), and tumor purity (p = 1.7e-08) were significantly higher in the high-risk group than in the low-risk group (Figures 7B–D).
We further investigated the difference in the mutation profiles between the high- and low-risk groups based on TCGA data. The mutation rate of the high-risk group was slightly higher than that of the low-risk group (92.81 vs. 90.91%). The mutation rate of TP53 was the highest in both the high- and low-risk groups. Additionally, missense mutations were the most dominant among all mutation types. Single nucleotide polymorphisms (SNPs) occurred more frequently in the high-risk group than in the low-risk group (Figures 8A,B).
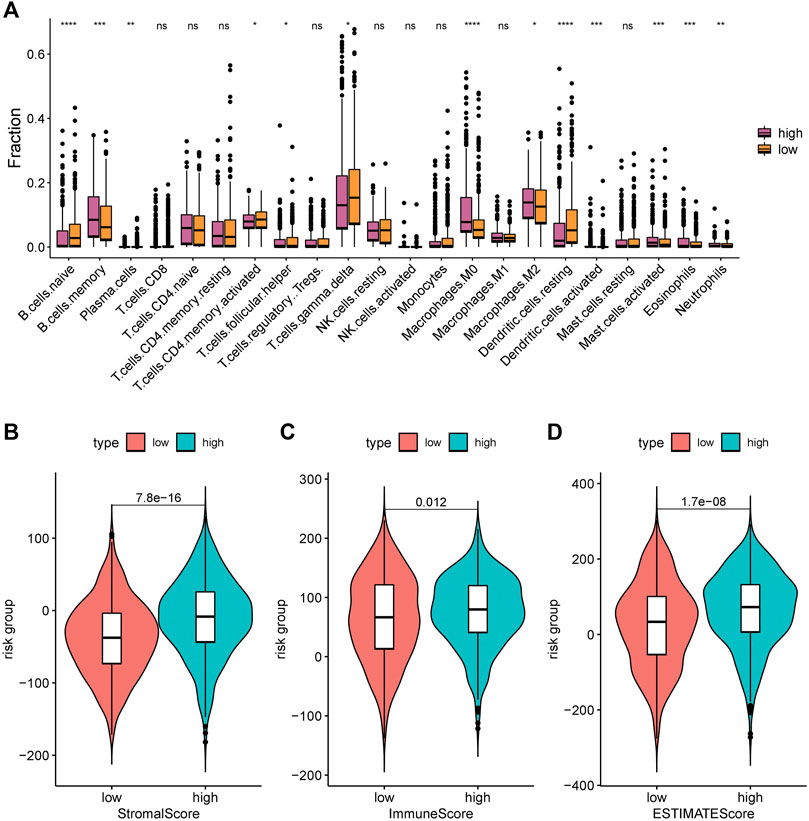
FIGURE 8. Immune infiltration levels of 22 immune cell types in the low-risk group and high-risk group. (A) CIBERSORT algorithm was used to assess the difference in immune infiltration: *, p < 0.05; **, p < 0.001; ***, p < 0.01; ****, p < 0.001; ns, p > 0.05 (nonsignificant). (B) Stromal score; (C) Immune score; and (D) ESTIMATE score.
We also investigated the difference in CNV between the high- and low-risk groups (Figures 8C–E). The copy numbers of amplification and deletion were distributed differently in the same position. Significant differences in distribution could be observed in the figures (Figures 8C,D). We analyzed the Z-score of the high- and low-risk groups (Figure 8E) by t-test. The results showed a significant difference between them (p < 2.22e-16).
Immunotherapy offers a new approach to cancer treatment. For a long period of time, immunotherapy approaches targeting PD1, PDL1, and ctla-4 have all been successfully applied in cancer, with largely promising outcomes. Tumor immune dysfunction and exclusion (TIDE) is a gene expression biomarker developed for predicting the clinical response to immune checkpoint blockade. We used the TIDE score to assess the performance of the risk score to predict the response to immunotherapy and visualized it in R software. A significant difference in the TIDE score was demonstrated between the high- and low-risk groups (p = 0.0027) (Figure 9A), while its prediction accuracy was lower than that of the risk score (Figure 9B).
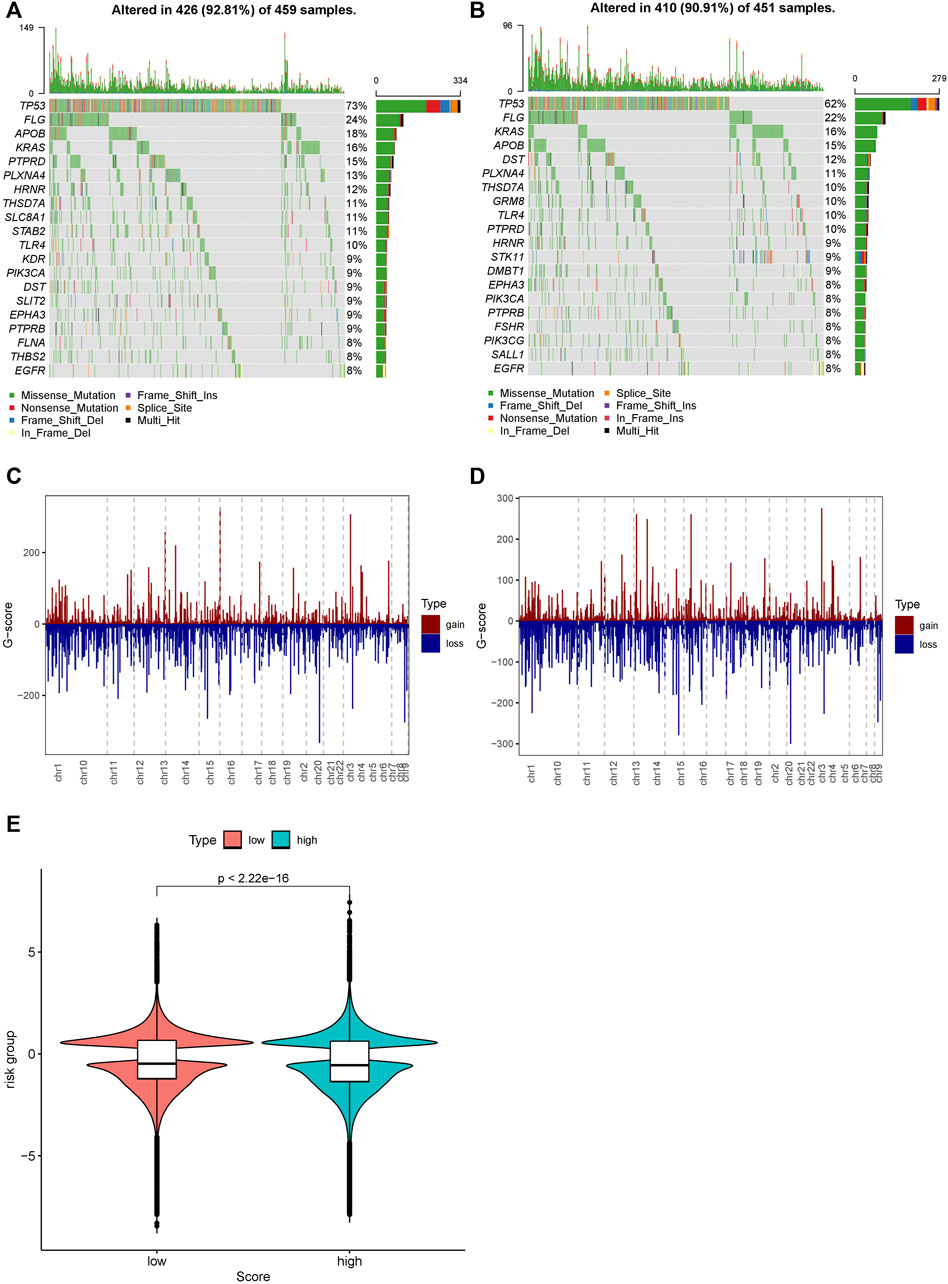
FIGURE 9. Distribution of mutations and CNVs in the high- and low-risk groups. (A) Mutations in the high-risk group. (B) Mutations in the low-risk group. (C) CNVs in the low-risk group. (D) CNVs in the high-risk group. (E) Distribution of the G-score and the p-value of the Wilcoxon test in the high- and low-risk groups.
To assess the effect of the risk score on prognosis, we performed univariate and multivariate Cox regression analyses of the above clinical characteristics and validated the risk model using validation datasets (Figures 10A–D). The risk score showed a significant effect on the prognosis in both univariate and multivariate regression analyses.
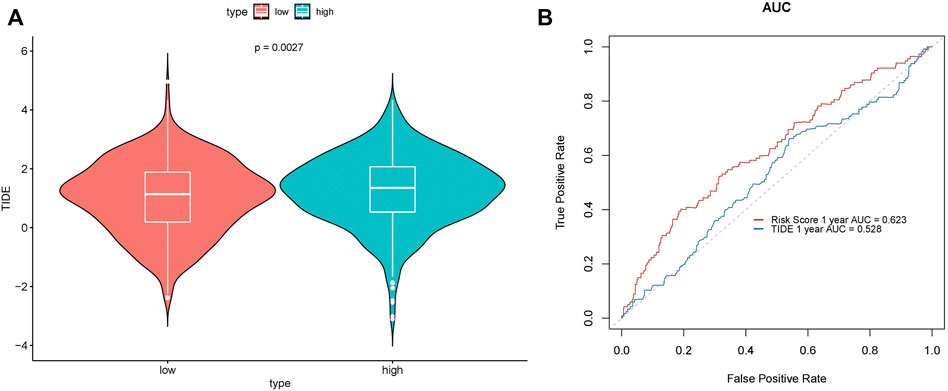
FIGURE 10. Prediction performance of the TIDE score. (A) Difference in TIDE scores in the high- and low-risk groups. (B) ROC curve.
Finally, we developed nomograms using the risk score and clinical characteristics and validated them with calibration plots (Figure 11A). The risk score showed the highest accuracy of prediction (Figure 11B). The 1-year, 2-years, and 3-years calibration plots demonstrated the highest accuracy of our nomograms (Figures 11C–E).
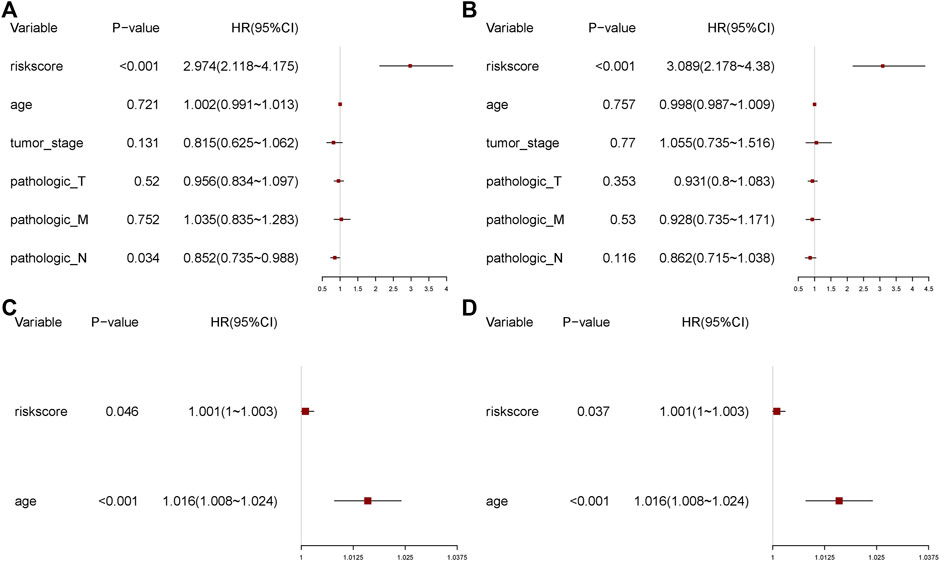
FIGURE 11. Univariate and multivariate regression analyses. (A) Univariate analysis. (B) Multivariate analysis. (C) Univariate analysis of the validation set. (D) Multivariate analysis of the validation set.
Angiogenesis is essential for tumor growth and metastasis and can provide space and nutrients for tumor cells. Multiple angiogenic growth factors play critical roles in this process. The previous studies indicate that targeting tumor angiogenesis is a promising way to fight tumor growth and dissemination in numerous types of cancer (DeBusk et al., 2010; Meng et al., 2017; Chu et al., 2021; Pan et al., 2021).
With the development of next-generation sequencing, more extensive molecules have been discovered as therapeutic targets. However, no study has previously constructed a prediction model of NSCLC based on AFs. In this study, we first identified 372 DE-AFs based on the UCSC database and then confirmed that four genes, C1QTNF6, SLC2A1, PTX3, and FSTL3, were significantly correlated with prognosis by constructing Cox regression and Lasso regression models. High expression of the four genes was also associated with poor prognosis in NSCLC patients. Second, according to the medium-risk score, NSCLC patients were divided into high- and low-risk groups. We calculated each AUC value of the ROC curves for predicting prognosis, which all had significantly good sensitivity. The 1-, 3-, and 5-years AUC values of the ROC were 0.623, 0.658, and 0.609, respectively. The risk score also performed well in validation sets GSE4573 and GSE68465. We also evaluated our AF risk score models on GSE4573 and GSE68465 validation data (batch effect correction). The results showed significant differences between the high- and low-risk groups.
The results of our study were consistent with those of other past studies. Wei et al. (Zhang and Feng 2021) reported that C1QTNF6 was significantly highly expressed in NSCLC tissues and cells and regulated tumor growth, migration, and apoptosis. Similar results have been reported in Japan (Tamotsu et al.) (Takeuchi et al., 2011), in which C1QTNF6 has been implicated in tumor angiogenesis in hepatocellular carcinoma. Solute carrier family 2 member 1 protein (SLC2A1) plays an important role in glucose metabolism in the human body. A previous study suggested that the upregulated expression level of SLC2A1 may increase the tumor cell proliferation and metastasis (Xiong et al., 2020). Hongwei et al. (Xia et al., 2021) found that lncRNA PVT1 can regulate cell growth, migration, and invasion by targeting the miR-378c/SLC2A1 axis. PTX3 is involved in tumor progression in multiple types of cancer and has also been identified as an independent prognostic predictor of cancer (Bonavita et al., 2015; Giacomini et al., 2018). Follistatin-related gene 3 (FSTL3) was proven to be an oncogene, and upregulated the expression of FSTL3 could activate migration by promoting F-actin and BMP/SMAD signaling (Chu et al., 2020; Liu et al., 2021). Although C1QTNF6, SLC2A1, PTX3, and FSTL3 may serve as potential targets for antiangiogenic therapeutic strategies, the molecular mechanisms of angiogenesis remain unclear.
Third, to better guide clinical decision-making, we applied AFRS to different clinical samples. We were pleasantly surprised that AFRS in LUSC patients was significantly higher than that in LUAD patients. AFRS was significantly lower in the patients with EGFR mutation or without smoking. Furthermore, we conducted a correlation between AFRS and different clinical stages and found that AFRS was closely related to the clinical stage and TNM stage.
Fourth, in recent research, immunotherapy has been increasingly recognized for its potential therapeutic effect on a variety of tumors. For example, immune checkpoint (PD-1, CTLA-4) blockade has become an increasingly important part of cancer therapy (Passiglia et al., 2021). There were plenty of clinical trials (Reck et al., 2019; Herbst et al., 2020; Patel et al., 2020) that proved the combination of ICI therapy and angiogenesis therapy can reprogram the immune microenvironment and prune cancer growth-related blood vessels (Ramjiawan et al., 2017; Yi et al., 2019; Giannone et al., 2020), which could have a synergistically better performance in prolonging overall survival, especially in patients with activating mutations of EGFR (Reck et al., 2019). By detecting the immunity indexes of TMB and mRNAsi, we believed that this research might provide bioinformatics evidence to support the design of a combination of immunotherapy and antiangiogenic therapy for NSCLC patients in the future.
Fifth, we found that of all clinical samples, the TP53 mutation type had the highest rate of mutations, neither in the low nor high AFRS group. The SNP mutation in the high AFRS group was remarkably higher than that in the low AFRS group. Numerous studies have proven that TP53 mutation in cancers can influence drug activity, tumor apoptosis, and immune evasion (Alexandrova et al., 2015; Srihari et al., 2018). Notably, gain-of-function p53 mutation promotes neutrophils to tumors, which leads to resistance to immunotherapy (Siolas et al., 2021). As a result, we further analyzed the correlation of AFRS with the infiltration of various immune cells. We found that the immune response was significantly altered between the low and high AFRS groups, including immune cell infiltration (i.e., M2 macrophages and M0, mast cells, B cells), immune score, stromal score, and ESTIMATE score. These results indicated that the high AFRS group could induce stronger immunity activity.
For better clinical applications, we strive to develop a nomogram to predict the prognosis of NSCLC patients. The established nomogram showed a great performance in predicting the clinical outcomes for NSCLC patients.
However, this study has several limitations. First, due to limited resources and funding available, no clinical samples were analyzed, hence, clinical relevance was not assessed. Second, the lack of experimental verification was also limited. We will further confirm our conclusions by performing cell line and animal model experiments in the future and prove the changes in the protein levels by western blot analysis.
In conclusion, assessing the global gene expression profile of Afs in this study was the first. From the perspective of a reliable risk score model using angiogenic factors, the present study provided a new method for NSCLC treatment in the clinic. However, the established model needs to be further confirmed in the future by large scale multicenter clinical studies.
The expression profile combined with patients’ clinical and annotation information in LUAD and LUSC datasets were downloaded from UCSC (https://xenabrowser.net/). Next, we averaged the expression level of genes with the same name and removed the genes with expression levels lower than 30%. We merged the two expression profiles after processing and converted the data type from FPKM to TPM. The samples from patients aged >18 years were extracted, and batch effects were removed (Figures 12A,B). We then searched the NCBI database (https://www.ncbi.nlm.nih.gov/gene/?term=angiogenic) using “angiogenic factor (AF)” as the keyword and extracted AF expression data of 1,054 samples from the downloaded expression profile.
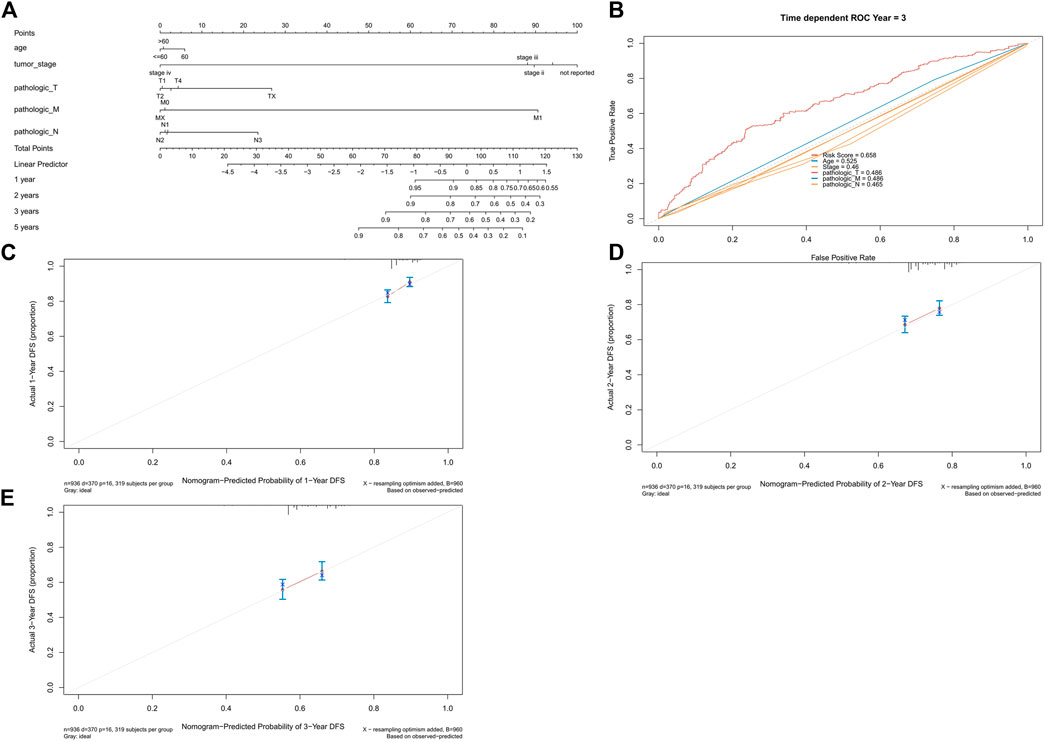
FIGURE 12. Nomogram and calibration plots. (A) Nomogram of age, tumor stage, and TNM stage. (B) ROC curve of risk score, age, tumor stage, and TNM stage. (C) 1-year calibration plot. (D) 2-years calibration plot and (E) 3-years calibration plot.
We used the R package “limma” to identify AF-related differentially expressed genes (DEGs) (threshold: adj.P.Val<0.01 & |log (FC) |≥ 1) in 372 cancer and normal samples. Next, gene ontology (GO) enrichment analysis (p-value cutoff < 0.05) and KEGG pathway enrichment analysis (p-value cutoff < 0.05) of differentially expressed genes were performed using the R package “clusterProfiler”.
Other data of cancer samples were further extracted, and a univariate Cox regression analysis of DEGs associated with overall survival was performed using the R packages “survival” and “survminer” with a threshold of p < 0.05. DEGs associated with prognosis were identified after screening.
Lasso regression was performed using the R package “glmnet” for downscaling prognostic genes. We first screened lambda by cross-validation, and then selected the model with lambda. min. Next, the expression matrix of the selected genes for the model was extracted, and the risk score of each sample was calculated using the following formula:
It represented the expression level of gene j in sample i, and represented the coefficient of gene j in the lasso regression model. All the samples were stratified into high- and low-risk groups according to the median-risk score.
Kaplan–Meier survival curves were plotted according to high- or low-risk groups. The ROC curves were drawn based on the predicted risk score of each sample.
The samples with AF risk scores were grouped according to clinical characteristics. We used the R package “ggplot2” to show the distribution of AF risk scores in each group and the R package “ggpubr” to illustrate the significant difference between groups.
We calculated tumor mutational burden, homologous recombination deficiency (HRD) (from technical support), tumor neoantigen burden (according to the literature The Immune Landscape of Cancer), chromosome instability (CIN) (according to the literature The Immune Landscape of Cancer), and stemness index (according to the literature Machine Learning Identifies Stemness Features Associated with Oncogenic Dedifferentiation) based on AF risk scores and performed association analyses.
The proportion of 22 immune cells in the samples can be derived using the CIBERSORT algorithm based on the expression of certain genes. We assessed the difference in immune infiltration between the high- and low-risk groups by t-test with a significance threshold of p < 0.05.
We analyzed the differences in the immune score, stromal score, and tumor purity of AF in high- and low-risk groups using the R package “ESTIMATE” and assessed the differences in immune infiltration in the high- and low-risk groups by t-test with a threshold of p < 0.05.
MAF files of NSCLC were downloaded from the GDC database, and we extracted the mutation information of AF from the somatic mutation profile. The mutation profile of AF in high- and low-risk groups was demonstrated with the help of the “oncoplot” function, using the R package “maftools”.
The copy number variation (CNV) data of LUSC and LUAD were downloaded from UCSC. The copy numbers of the high- and low-risk groups were extracted to generate files and plotted on the gadget using the “CNV distribution chart - bar graph section”.
The expression profiles of immune genes were extracted from the processed data of endometrial cancer samples, and the immune gene sets were obtained from the ImmPort database (https://www.immport.org/) and InnateDB database (https://www.innatedb.ca/). The expression profiles of the immune gene sets were subsequently normalized. The predicted TIDE scores of the samples were calculated using the TIDE online database. The distribution of TIDE scores in the high- and low-risk groups was illustrated with box plots using ggpubr, and the significance was tested by t-test.
To validate whether the risk score was an independent prognostic factor, univariate Cox regression analyses of the candidate prognostic factors using TCGA sample data were first performed, including risk score, age, tumor stage, and TNM stage. A multivariate Cox regression analysis was subsequently performed to assess the effect size of the risk score. We used the function cph in the R package “rms” to plot the nomograms and calibration plots for visualization.
All statistical analyses were performed using R software version 4.0.3. p < 0.05 was set as the significance criterion.
The original contributions presented in the study are included in the article/Supplementary Material, further inquiries can be directed to the corresponding author.
XG and YK designed the concept of the study. Bioinformatics analysis and statistical analysis were performed by YK. XG and LC wrote the draft of the manuscript. All authors have read and agreed to the published version of the manuscript.
The authors declare that the research was conducted in the absence of any commercial or financial relationships that could be construed as a potential conflict of interest.
All claims expressed in this article are solely those of the authors and do not necessarily represent those of their affiliated organizations, or those of the publisher, the editors, and the reviewers. Any product that may be evaluated in this article, or claim that may be made by its manufacturer, is not guaranteed or endorsed by the publisher.
The Supplementary Material for this article can be found online at: https://www.frontiersin.org/articles/10.3389/fgene.2022.894024/full#supplementary-material
Alexandrova, E. M., Yallowitz, A. R., Li, D., Xu, S., Schulz, R., Proia, D. A., et al. (2015). Improving Survival by Exploiting Tumour Dependence on Stabilized Mutant P53 for Treatment. Nature 523 (7560), 352–356. doi:10.1038/nature14430
Bonavita, E., Gentile, S., Rubino, M., Maina, V., Papait, R., Kunderfranco, P., et al. (2015). PTX3 Is an Extrinsic Oncosuppressor Regulating Complement-dependent Inflammation in Cancer. Cell 160 (4), 700–714. doi:10.1016/j.cell.2015.01.004
Chatterjee, N., and Bivona, T. G. (2019). Polytherapy and Targeted Cancer Drug Resistance. Trends Cancer 5 (3), 170–182. doi:10.1016/j.trecan.2019.02.003
Chu, L., Li, N., Deng, J., Wu, Y., Yang, H., Wang, W., et al. (2020). LC-APCI+-MS/MS Method for the Analysis of Ten Hormones and Two Endocannabinoids in Plasma and Hair from the Mice with Different Gut Microbiota. J. Pharm. Biomed. Anal. 185, 113223. doi:10.1016/j.jpba.2020.113223
Chu, L., Huang, Y., Xu, Y., Wang, L.-K., and Lu, Q. (2021). An LC-APCI+-MS/MS-based Method for Determining the Concentration of Neurosteroids in the Brain of Male Mice with Different Gut Microbiota. J. Neurosci. Methods 360, 109268. doi:10.1016/j.jneumeth.2021.109268
DeBusk, L. M., Boelte, K., Min, Y., and Lin, P. C. (2010). Heterozygous Deficiency of δ-catenin Impairs Pathological Angiogenesis. J. Exp. Med. 207 (1), 77–84. doi:10.1084/jem.20091097
Ettinger, D. S., Akerley, W., Borghaei, H., Chang, A. C., Cheney, R. T., Chirieac, L. R., et al. (2013). Non-Small Cell Lung Cancer, Version 2.2013. J. Natl. Compr. Canc Netw. 11 (6), 645–653. doi:10.6004/jnccn.2013.0084
Ettinger, D. S., Wood, D. E., Aisner, D. L., Akerley, W., Bauman, J. R., Bharat, A., et al. (2021). NCCN Guidelines Insights: Non-small Cell Lung Cancer, Version 2.2021. J. Natl. Compr. Cancer Netw. 19 (3), 254–266. doi:10.6004/jnccn.2021.0013
Ferrara, N., Hillan, K. J., and Novotny, W. (2005). Bevacizumab (Avastin), a Humanized Anti-VEGF Monoclonal Antibody for Cancer Therapy. Biochem. Biophysical Res. Commun. 333 (2), 328–335. doi:10.1016/j.bbrc.2005.05.132
Giacomini, A., Ghedini, G. C., Presta, M., and Ronca, R. (2018). Long Pentraxin 3: A Novel Multifaceted Player in Cancer. Biochim. Biophys. Acta (Bba) - Rev. Cancer 1869 (1), 53–63. doi:10.1016/j.bbcan.2017.11.004
Giannone, G., Ghisoni, E., Genta, S., Scotto, G., Tuninetti, V., Turinetto, M., et al. (2020). Immuno-Metabolism and Microenvironment in Cancer: Key Players for Immunotherapy. Ijms 21 (12), 4414. doi:10.3390/ijms21124414
Gibney, G. T., Weiner, L. M., and Atkins, M. B. (2016). Predictive Biomarkers for Checkpoint Inhibitor-Based Immunotherapy. Lancet Oncol. 17 (12), e542–e551. doi:10.1016/S1470-2045(16)30406-5
Goveia, J., Rohlenova, K., Taverna, F., Treps, L., Conradi, L.-C., Pircher, A., et al. (2020). An Integrated Gene Expression Landscape Profiling Approach to Identify Lung Tumor Endothelial Cell Heterogeneity and Angiogenic Candidates. Cancer Cell 37 (1), 21–36. e13. doi:10.1016/j.ccell.2019.12.001
Gridelli, C., Rossi, A., Carbone, D. P., Guarize, J., Karachaliou, N., Mok, T., et al. (2015). Non-small-cell Lung Cancer. Nat. Rev. Dis. Primers 1 (1), 1. doi:10.1038/nrdp.2015.9
Hanahan, D., and Weinberg, R. A. (2000). The Hallmarks of Cancer. Cell 100 (1), 57–70. doi:10.1016/s0092-8674(00)81683-9
Herbst, R. S., Giaccone, G., de Marinis, F., Reinmuth, N., Vergnenegre, A., Barrios, C. H., et al. (2020). Atezolizumab for First-Line Treatment of PD-L1-Selected Patients with NSCLC. N. Engl. J. Med. 383 (14), 1328–1339. doi:10.1056/NEJMoa1917346
Hirsch, F. R., Scagliotti, G. V., Mulshine, J. L., Kwon, R., Curran, W. J., Wu, Y.-L., et al. (2017). Lung Cancer: Current Therapies and New Targeted Treatments. The Lancet 389 (10066), 299–311. doi:10.1016/S0140-6736(16)30958-8
Liu, Y.-J., Li, J.-P., Zhang, Y., Nie, M.-J., Zhang, Y.-H., Liu, S.-L., et al. (2021). FSTL3 Is a Prognostic Biomarker in Gastric Cancer and Is Correlated with M2 Macrophage Infiltration. Ott 14, 4099–4117. doi:10.2147/ott.S314561
Lugano, R., Ramachandran, M., and Dimberg, A. (2020). Tumor Angiogenesis: Causes, Consequences, Challenges and Opportunities. Cell. Mol. Life Sci. 77 (9), 1745–1770. doi:10.1007/s00018-019-03351-7
Ma, J., Wang, J., Ghoraie, L. S., Men, X., Haibe-Kains, B., and Dai, P. (2019). Network-based Approach to Identify Principal Isoforms Among Four Cancer Types. Mol. Omics 15 (2), 117–129. doi:10.1039/c8mo00234g
Markham, A., and Keam, S. J. (2019). Camrelizumab: First Global Approval. Drugs 79 (12), 1355–1361. doi:10.1007/s40265-019-01167-0
Meng, J., Liu, Y., Han, J., Tan, Q., Chen, S., Qiao, K., et al. (2017). Hsp90β Promoted Endothelial Cell-dependent Tumor Angiogenesis in Hepatocellular Carcinoma. Mol. Cancer 16 (1), 72. doi:10.1186/s12943-017-0640-9
Oxnard, G. R., Arcila, M. E., Chmielecki, J., Ladanyi, M., Miller, V. A., and Pao, W. (2011). New Strategies in Overcoming Acquired Resistance to Epidermal Growth Factor Receptor Tyrosine Kinase Inhibitors in Lung Cancer. Clin. Cancer Res. 17 (17), 5530–5537. doi:10.1158/1078-0432.Ccr-10-2571
Pan, S., Zhao, X., Shao, C., Fu, B., Huang, Y., Zhang, N., et al. (2021). STIM1 Promotes Angiogenesis by Reducing Exosomal miR-145 in Breast Cancer MDA-MB-231 Cells. Cell Death Dis 12 (1), 38. doi:10.1038/s41419-020-03304-0
Passiglia, F., Galvano, A., Gristina, V., Barraco, N., Castiglia, M., Perez, A., et al. (20212021). Is There Any Place for PD-1/CTLA-4 Inhibitors Combination in the First-Line Treatment of Advanced NSCLC?-a Trial-Level Meta-Analysis in PD-L1 Selected Subgroups. Transl Lung Cancer Res. 10 (7), 3106–3119. doi:10.21037/tlcr-21-52
Patel, J. D., Lee, J.-W., Carbone, D. P., Wagner, H., Shanker, A., de Aquino, M. T. P., et al. (2020). Phase II Study of Immunotherapy with Tecemotide and Bevacizumab after Chemoradiation in Patients with Unresectable Stage III Non-squamous Non-small-cell Lung Cancer (NS-NSCLC): A Trial of the ECOG-ACRIN Cancer Research Group (E6508). Clin. Lung Cancer 21 (6), 520–526. doi:10.1016/j.cllc.2020.06.007
Ramjiawan, R. R., Griffioen, A. W., and Duda, D. G. (2017). Anti-angiogenesis for Cancer Revisited: Is There a Role for Combinations with Immunotherapy? Angiogenesis 20 (2), 185–204. doi:10.1007/s10456-017-9552-y
Reck, M., Mok, T. S. K., Nishio, M., Jotte, R. M., Cappuzzo, F., Orlandi, F., et al. (2019). Atezolizumab Plus Bevacizumab and Chemotherapy in Non-small-cell Lung Cancer (IMpower150): Key Subgroup Analyses of Patients with EGFR Mutations or Baseline Liver Metastases in a Randomised, Open-Label Phase 3 Trial. Lancet Respir. Med. 7 (5), 387–401. doi:10.1016/S2213-2600(19)30084-0
Siolas, D., Vucic, E., Kurz, E., Hajdu, C., and Bar-Sagi, D. (2021). Gain-of-function p53R172H Mutation Drives Accumulation of Neutrophils in Pancreatic Tumors, Promoting Resistance to Immunotherapy. Cel Rep. 36 (8), 109578. doi:10.1016/j.celrep.2021.109578
Srihari, S., Kwong, R., Tran, K., Simpson, R., Tattam, P., and Smith, E. (2018). Metabolic Deregulation in Prostate Cancer. Mol. Omics 14 (5), 320–329. doi:10.1039/c8mo00170g
Takeuchi, T., Adachi, Y., and Nagayama, T. (2011). Expression of a Secretory Protein C1qTNF6, a C1qTNF Family Member, in Hepatocellular Carcinoma. Anal. Cell Pathol. 34 (3), 113–121. doi:10.3233/ACP-2011-00910.1155/2011/578097
Wang, M., An, S., Wang, D., Ji, H., Geng, M., Guo, X., et al. (2019). Quantitative Proteomics Identify the Possible Tumor Suppressive Role of Protease-Activated Receptor-4 in Esophageal Squamous Cell Carcinoma Cells. Pathol. Oncol. Res. 25 (3), 937–943. doi:10.1007/s12253-018-0395-7
Weston, V. J., Oldreive, C. E., Skowronska, A., Oscier, D. G., Pratt, G., Dyer, M. J. S., et al. (2010). The PARP Inhibitor Olaparib Induces Significant Killing of ATM-Deficient Lymphoid Tumor Cells In Vitro and In Vivo. Blood 116 (22), 4578–4587. doi:10.1182/blood-2010-01-265769
Xia, H., Zhang, Z., Yuan, J., and Niu, Q. (2021). The lncRNA PVT1 Promotes Invasive Growth of Lung Adenocarcinoma Cells by Targeting miR-378c to Regulate SLC2A1 Expression. Hum. Cel 34 (1), 201–210. doi:10.1007/s13577-020-00434-7
Xiong, Y., Lei, J., Zhao, J., Lu, Q., Feng, Y., Qiao, T., et al. (2020). A Gene-Based Survival Score for Lung Adenocarcinoma by Multiple Transcriptional Datasets Analysis. BMC Cancer 20 (1), 1046. doi:10.1186/s12885-020-07473-1
Yi, M., Jiao, D., Qin, S., Chu, Q., Wu, K., and Li, A. (2019). Synergistic Effect of Immune Checkpoint Blockade and Anti-angiogenesis in Cancer Treatment. Mol. Cancer 18 (1), 60. doi:10.1186/s12943-019-0974-6
Zhang, H. (2015). Apatinib for Molecular Targeted Therapy in Tumor. Dddt 9, 6075–6081. doi:10.2147/Dddt.S97235
Zhang, W., and Feng, G. (2021). C1QTNF6 Regulates Cell Proliferation and Apoptosis of NSCLC In Vitro and In Vivo. Biosci. Rep. 41 (1), BSR20201541. doi:10.1042/BSR20201541
Zhao, S., Ren, S., Jiang, T., Zhu, B., Li, X., Zhao, C., et al. (2019). Low-Dose Apatinib Optimizes Tumor Microenvironment and Potentiates Antitumor Effect of PD-1/pd-L1 Blockade in Lung Cancer. Cancer Immunol. Res. 7 (4), canimm.0640.2017–643. doi:10.1158/2326-6066.CIR-17-0640
AFRS: angiogenic factors related risk score
AFs: angiogenic factors
CIN: chromosomal instability
CNV: copy number variation
DEGs: differentially expressed genes
EGFR: epidermal growth factor receptor
HRD: homologous recombination deficiency
LASSO: least absolute shrinkage and selection operator
WHO: World Health Organization
LSTm: large scale transition
NSCLC: non-small-cell lung cancer
SCLC: small cell lung cancer
SCNV: somatic copy number variations
SNPs: single nucleotide polymorphisms
TMB: tumor mutational burden
VEGF: vascular endothelial growth factor
VEGFR2: vascular endothelial growth factor receptor 2
Keywords: NSCLC, angiogenic factors, immunotherapy response, model validation, biomarkers
Citation: Gu X, Chu L and Kang Y (2022) Angiogenic Factor-Based Signature Predicts Prognosis and Immunotherapy Response in Non-Small-Cell Lung Cancer. Front. Genet. 13:894024. doi: 10.3389/fgene.2022.894024
Received: 11 March 2022; Accepted: 14 April 2022;
Published: 18 May 2022.
Edited by:
Saurav Mallik, Harvard University, United StatesReviewed by:
Asim Bikas Das, National Institute of Technology Warangal, IndiaCopyright © 2022 Gu, Chu and Kang. This is an open-access article distributed under the terms of the Creative Commons Attribution License (CC BY). The use, distribution or reproduction in other forums is permitted, provided the original author(s) and the copyright owner(s) are credited and that the original publication in this journal is cited, in accordance with accepted academic practice. No use, distribution or reproduction is permitted which does not comply with these terms.
*Correspondence: Yanlan Kang, MTY0MTg2NjgzMUBxcS5jb20=
†These authors have contributed equally to this work
Disclaimer: All claims expressed in this article are solely those of the authors and do not necessarily represent those of their affiliated organizations, or those of the publisher, the editors and the reviewers. Any product that may be evaluated in this article or claim that may be made by its manufacturer is not guaranteed or endorsed by the publisher.
Research integrity at Frontiers
Learn more about the work of our research integrity team to safeguard the quality of each article we publish.