- 1State Key Laboratory of Ophthalmology, Zhongshan Ophthalmic Center, Sun Yat-Sen University, Guangzhou, China
- 2Department of Statistical Science, School of Mathematics, Sun Yat-Sen University, Guangzhou, China
Purpose: To demonstrate an interaction-based method for the refinement of Gene Set Enrichment Analysis (GSEA) results.
Method: Intravitreal injection of miR-124-3p antagomir was used to knockdown the expression of miR-124-3p in mouse retina at postnatal day 3 (P3). Whole retinal RNA was extracted for mRNA transcriptome sequencing at P9. After preprocessing the dataset, GSEA was performed, and the leading-edge subsets were obtained. The Apriori algorithm was used to identify the frequent genes or gene sets from the union of the leading-edge subsets. A new statistic
Results: A total of 115,140 assembled transcript sequences were obtained from the clean data. With GSEA, the NOD-like receptor signaling pathway, C-type-like lectin receptor signaling pathway, phagosome, necroptosis, JAK-STAT signaling pathway, Toll-like receptor signaling pathway, leukocyte transendothelial migration, chemokine signaling pathway, NF-kappa B signaling pathway and RIG-I-like signaling pathway were identified as the top 10 enriched pathways, and their leading-edge subsets were obtained. After being refined by the Apriori algorithm and sorted by the value of the modulus of
Conclusion: This study indicated that using the Apriori algorithm and defining the statistic
1 Introduction
MicroRNAs (miRNAs) are a class of noncoding RNAs that play key roles in regulating gene expression and are involved in a variety of biological processes during retinal development (Damiani et al., 2008). In most cases, miRNAs inhibit the expression or promote the degradation of messenger RNA (mRNA) by interacting with the specific sequences located in the 3 UTR of their target mRNA (Ha and Kim, 2014). According to this feature, each miRNA can target hundreds of mRNAs. The development of transcriptomics technologies such as RNA sequencing (RNA-Seq) can provide a broad account of RNA transcripts and consequently insight into changes in the mRNA expression of downstream genes after experimental intervention on the miRNA (Wang et al., 2009).
Due to the large amount of sequencing data generated by RNA-Seq, appropriate bioinformatics methods are needed to handle the data. After preprocessing the data, traditional quantitative analysis for mRNA expression analysis focuses on identifying differentially expressed upregulated and downregulated genes between two individual groups. Traditional strategies usually set an arbitrary cutoff in terms of expression fold-change (e.g., fold-change ≥ 1.5 considered significant) to filter the critical genes. Conservative and relaxed cutoff values may cause false negative and false positive results, respectively, making the results less objective and reproducible. To overcome the analytical challenges of focusing on a single gene, gene set enrichment analysis (GSEA) helps to gain further insight into the distribution of genes preannotated in biological categories by incorporating the entirety of gene expression. However, both single and global gene analysis often generate a large number of candidate genes (Ackermann and Strimmer, 2009). The lack of golden standard datasets also makes the assessment of gene set analysis methods rudimentary (Maleki et al., 2020). Hence, instead of extracting more genes from datasets, the goal of this study was to attempt reducing the dimensionality of analysis results and refining the intricacies from the high-throughput results to the low-throughput experiments.
Several studies have characterized miRNA expression in the developing mammalian retina, and miR-124-3p has been shown to be one of the most abundantly expressed miRNAs (Karali et al., 2007; Hackler et al., 2010; Karali et al., 2010; Karali et al., 2016). Although the miR-124a-3p knockdown mouse exhibited neuronal dysfunction and dysmaturation by disinhibition of Lhx2, its downstream responses in mouse retinal development after birth were still relatively deficient at the transcriptome level. In our previous study, miR-124-3p exhibited a significantly increasing trend after birth, and its related pathways predicted by bioinformatics analysis were associated with biological processes that may play crucial roles in mouse retinal development (Wang et al., 2020). To gain insight into its downstream processes, RNA-Seq was used to obtain the expression profile of mRNA transcripts after the knockdown of miR-124-3p.
In GSEA, given a set of genes sorted depending on given conditions (e.g., mRNA expression level of downstream genes) and a biological category, a running sum statistic is computed iteratively from top to bottom of the sorted set to evaluate whether it is enriched in the given biological category. When processed, the running sum will increase whenever a gene belonging to the given biological category is found and otherwise decrease. Therefore, the running sum will be relatively high if the gene set falls at either the top (overexpressed) or bottom (underexpressed) and is likely to be subsequently related to the given biological category.
Based on the properties mentioned above, GSEA is an appropriate tool to obtain a precise description of the downstream effects of miRNAs. Since a miRNA and its target mRNAs demonstrate negative correlations because of degradation (Ritchie et al., 2009; Wang and Li, 2009), when the expression value of the miRNA is manipulated to decrease, the upregulated and downregulated mRNA expression can be assumed to be its direct effects and indirect effects, which are likely to be enriched at the top and bottom in GSEA, respectively, and vice versa.
Through the analysis of a downstream mRNA dataset from RNA-Seq after miR-124-3p knockdown, we demonstrate how the original GSEA method was extended and the results from GSEA were refined, which could be used as a comprehensive protocol for downstream analysis in the loss- and gain-intervention to a specific miRNA. Some parameters, such as the leading-edge subset, were modified to better describe the characteristics of the bottom (underexpressed) mRNAs based on the classical GSEA approach by Subramanian et al. (2005). The union of the leading-edge subsets in the enriched KEGG pathways was selected. For traditional GSEA, the number of generated candidate genes is usually still too high. One or several key genes or pathways need to be identified for further functional experiments. Apriori algorithm and a new statistic
2 Methods
2.1 Knockdown of miR-124-3p and RNA Extraction
C57BL/6J mice were used to study the transcriptome of miR-124-3p during retinal development. Mice at postnatal day 3 (P3) were given 1 μl of 0.6 nmol/μl miR-124-3p antagomir in the left eye as the anti-miR-124 group and 0.6 nmol/μl antagomir negative control in the right eye as the negative control (NC) group by intravitreal injection. Retinas from mice at P9 were harvested, and total RNA was isolated by TRIzol (Invitrogen; Thermo Fisher Scientific, Inc, Waltham, MA, United States) according to the manufacturer’s instructions. Both groups consisted of 12–15 mixed retina tissues, and one biological replicate was conducted. In addition, to increase the heterogeneity of the sample, the samples in each group were from at least two different litters.
2.2. RT–qPCR Validation for the Knockdown of miR-124-3p and RNA-Seq
Reverse transcription quantitative PCR (RT–qPCR) was performed to validate the knockdown rate of the anti-miR-124 group compared with the NC group. Total RNA from both groups was reverse transcribed using a PrimeScript RT reagent kit (Takara Bio, Inc, Otsu, Japan). Real-time PCR was subsequently performed on the resulting cDNA template with a TB Green™ Premix Ex Taq™ II kit (Takara Bio, Inc, Otsu, Japan) on a StepOnePlus™ Real-Time PCR System (Applied Biosystems; Thermo Fisher Scientific, Inc, Waltham, MA, United States). The 2−ΔΔCt method was used to quantify miRNA expression levels with the u6 gene as an internal reference (Livak and Schmittgen, 2001). After significant knockdown of the expression level of miR-124-3p was confirmed by RT–qPCR, RNA-Seq was carried out to detect the expression levels of mRNAs in both groups. The RNA-Seq data in the present study are deposited in the Gene Expression Omnibus (GEO) repository, accession number GSE200915 (https://www.ncbi.nlm.nih.gov/geo/query/acc.cgi?acc=GSE200915).
2.3 GSEA
GSEA was carried out using Python 3.6 (Python Software Foundation. Python Language Reference, version 3.6, available at https://www.python.org).
2.3.1 Data Preprocessing
To normalize the length of the mRNA sequences and the sequencing depth of a sample, transcripts per million (TPM) were used to assess the expression level of mRNAs. Read counts for all the mRNA transcripts were demonstrated in Data Sheet 1. The method for calculating TPM was described in detail elsewhere (Wagner et al., 2012; Dillies et al., 2013). Based on previous research, the frequency distribution of genes with different expression levels has a mode at TPM nearly equal to 0 and a long tail toward higher TPM values (Wagner et al., 2013; Bush et al., 2018; Monaco et al., 2019). Therefore, to determine an appropriate interval to filter genes with very low expression, a base 10 logarithmic scale was used to evaluate the frequency distribution of TPM for the genes in all groups.
2.3.2 Calculating the Expression Difference
In each group set, the expression difference for a gene between the two groups was defined as the log2-transformed fold-change value of TPM. To reduce the false positive rate of the results, only genes that had the same expression trend between the two biological replicates were considered reliable. Based on these methods, a list of candidate genes and their corresponding gene expression differences was obtained.
2.3.3 Obtaining the Enrichment Score and Its Related Parameters in Kyoto Encyclopedia of Genes and Genomes Pathways
The candidate genes were ranked from highest to lowest expression level, and the enrichment score (ES) for each Kyoto Encyclopedia of Genes and Genomes (KEGG) pathway was calculated based on the GSEA approach (Subramanian et al., 2005). KEGG gene annotation was derived from the KEGG database (https://www.genome.jp/kegg-bin/download_htext?htext=ko00001.keg&format=json&filedir=). After excluding three types of annotations (“09160 Human Diseases”, “09180 Brite Hierarchies”, “09,190 Not Included in Pathway or Brite”) in KEGG pathways that were not related to retinal development, GSEA was performed on 354 pathways whose expression patterns might have changed in the retina. Afterward, the p value for each KEGG pathway was estimated by comparing the absolute value of its maximum ES with randomly generated sets of absolute values of maximum ES. A p value <0.05 was considered significant or enriched. To balance the accuracy of the estimation and the required computing power, the number of permutations used to generate the comparisons was set to 1,000. For an enriched pathway, a leading-edge subset is a set of genes that contributes to the maximum ES in the ranked list of genes. The subset will be found at the top if the maximum ES is positive (upregulated gene subset) or at the bottom if the maximum ES is negative (downregulated gene subset). Afterward, the union of the leading-edge subsets in the enriched KEGG pathways was selected.
2.3.3.1 Calculating the Maximum ES
Since a total of
where
In particular,
2.3.3.2 Estimating the Significance of the Maximum ES
To estimate the significance of the
where
2.3.3.3 Obtaining the Leading-Edge Subsets
In an enriched pathway, the leading-edge subset in
where
2.3.4 Refining the Results From Leading-Edge Subsets
Some genes or gene sets with interactions appear more frequently than others, indicating their pivotal roles in the enriched KEGG pathways. For instance, the interacting gene set Raf1–Map2k1–Erk plays an important role in a series of pathways, such as the ErbB signaling, FoxO signaling, and Ras signaling pathways. The Apriori algorithm designed for finding frequent item sets was introduced to identify these frequently appearing genes or interacting gene sets (Agrawal and Srikant, 1994). The goal of the algorithm is to identify genes (including a single gene or multiple genes with interactions) whose frequency of occurrence in the gene interactions is greater than a specified threshold. Prior knowledge of gene–gene interactions was determined by the Reactome database (Croft et al., 2011) (https://reactome.org/download/tools/ReatomeFIs/FIsInGene_122220_with_annotations.txt). After the frequent gene sets were calculated by the Apriori algorithm, a new statistic
The number of iterations was set to 4, which meant that gene interactions were generated with a maximum item size of 4. As Apriori uses a “bottom up” approach, genes in the union of the leading-edge subsets were used as the first-level candidates. Afterward, the number of genes in a candidate was increased by one, and the candidates that had an infrequent pattern (defined by the threshold) or were not consistent with the gene interaction knowledge were pruned. According to the above method, frequent candidates were extended one gene at a time. The threshold was set to 3, indicating that a candidate would be removed if its frequency was less than 3 among all transactions. The algorithm terminated when no frequent candidates could be generated, and frequent gene sets were identified by screening. Since the frequent gene sets were calculated based on prior annotation, a new statistic
2.3.4.1 Generating the Correlation Matrixes From a Gene Set
According to prior knowledge in the Reactome database, there are three categories of gene effects on another: upregulation, downregulation, or no effect, where the symbols ‘
where
For example, for a 4-dimensional vector of a gene set
the correlation matrix was described as follows:
2.3.4.2 Generating Interactions From the Leading-Edge Subsets
Genes from the union of the leading-edge subsets were used to iteratively generate gene transactions. After obtaining the union of the leading-edge subsets with
For example, let the 4-dimensional vector
2.3.4.3 Mining Frequent Gene Sets by the Apriori Algorithm
To detect frequent gene sets from the gene transactions, the value
For example, the
Given a threshold
Step 1. Start with
Step 2. Repeat Step 1 until no further successful extensions are found.
For example, for the gene interactions
In
In
In
2.3.4.4 Calculating the Weights of the Frequent Gene Set
After the frequent gene set was obtained by the Apriori algorithm, a new statistic
For example, given an element vector
The modulus of
Since gene
Any frequent gene set could be described by
For instance, given the 4-dimensional vector of gene set
According to this method, the weights associated with any frequent gene set will be referred to as its value of
2.4 RT-qPCR Validation for the Candidate Genes
RT-qPCR was performed to validate the candidate genes. Total RNA from retinas was isolated and procedures for reverse transcription and Real-Time PCR were described previously earlier. Gene expression levels were quantified using the 2−ΔΔCt method and normalized to GAPDH levels (Livak and Schmittgen, 2001). Graphical representation of the results was performed using GraphPad Prism v8.3.0 (GraphPad Software, Inc.).
3 Results
3.1 Data Preparation and Normalization
A total of 115,140 assembled transcript sequences were obtained from the clean data, among which 75,959 were distinct mRNA sequences. After TPM normalization, the expression levels of genes were observed on a 10-base logarithmic scale. The overall TPM values showed a one-tailed distribution, which was consistent with previous literature reports (Wagner et al., 2013; Bush et al., 2018; Monaco et al., 2019). Figure 1 shows that several genes had TPM values of 10−4, an amount of which was so small that it could not be clearly observed on the histogram. In addition, the TPM distribution on the order of 10−7 was irregular and inconsistent with the one-tailed distribution of the previous orders of magnitude. TPM data below 10−6 were excluded from further analysis. The expression differences of filtered genes were determined based on the log2-transformed fold-change TPM values. After miR-124-3p was knocked down in the mouse retina, most genes in the anti-miR-124 group were upregulated compared to the NC group, while a small portion were downregulated.
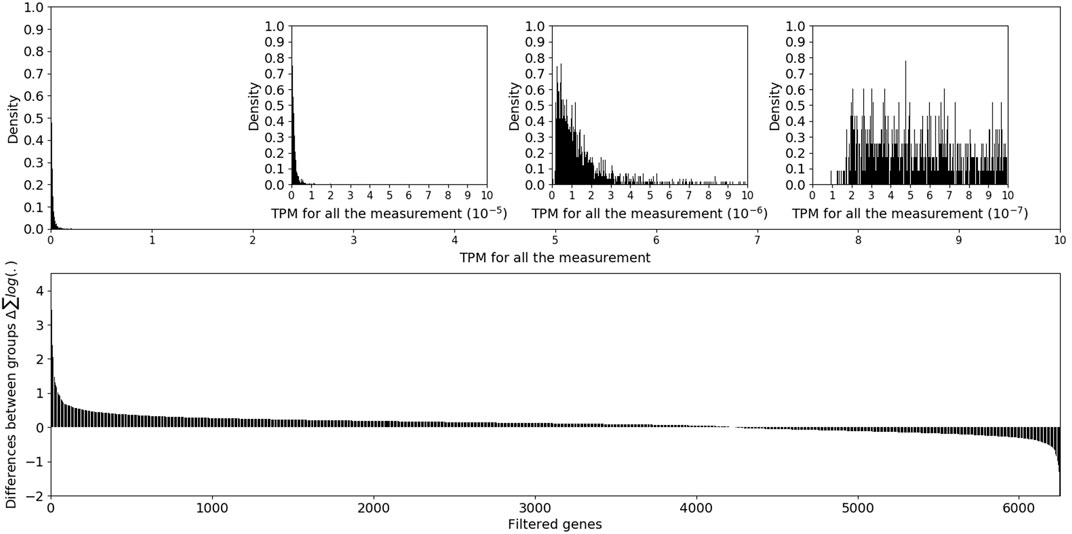
FIGURE 1. The upper panel showed the overall distribution of mRNA TPM values, and the lower panel showed the log2-transformed fold-change in filtered genes.
3.2 Identified Enriched KEGG Pathways and Their Leading-Edge Subsets
Based on GSEA of 354 pathways, the ranked gene list was enriched at the top in most of the pathways and enriched at the bottom in a small number of pathways. After p values were calculated based on 1,000 permutations, pathways related to retinal development with p values <0.05 were selected (Figure 2). The results indicated that only pathways with a positive maximum ES showed significant enrichment in upregulated genes, consistent with the negative regulation of mRNA by miRNA. The top 10 enriched pathways and the expression levels of their leading-edge subsets are shown in Figure 3: the NOD-like receptor signaling pathway, C-type-like lectin receptor signaling pathway, phagosome, necroptosis, JAK-STAT signaling pathway, Toll-like receptor signaling pathway, leukocyte transendothelial migration, chemokine signaling pathway, NF-kappa B signaling pathway and RIG-I-like signaling pathway.
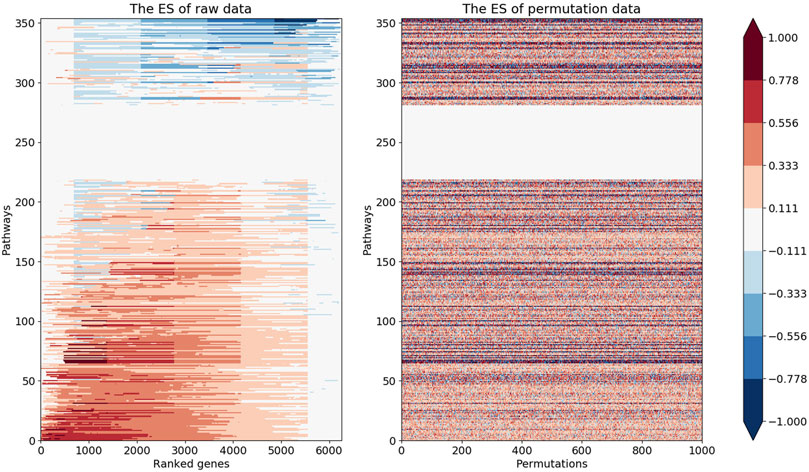
FIGURE 2. The left heatmap demonstrated ES values for all the 354 pathways in GSEA. The right heatmap illustrated randomly generated maximum ES values for the corresponding pathways.
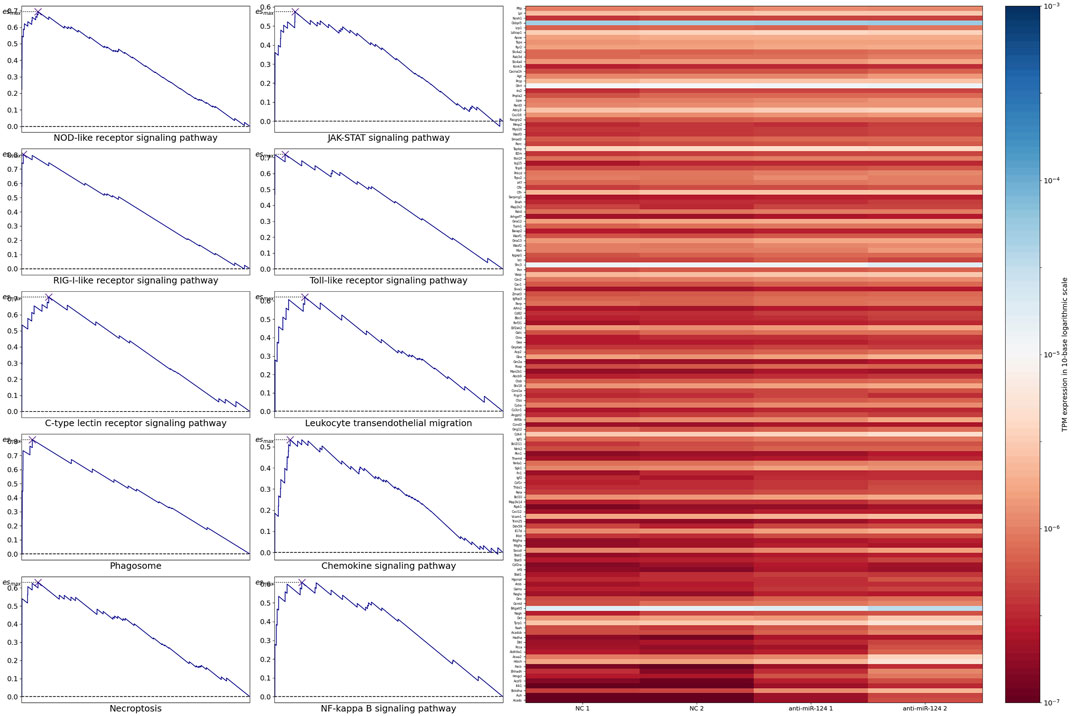
FIGURE 3. The left panel indicated the top 10 enriched pathways. The right panel indicated the expression level of the union of their leading-edge subsets.
3.3 The Weights of Frequent Gene Sets From the Leading-Edge Subsets
The Apriori algorithm was performed on the union of the leading-edge subsets to identify the frequent gene set. After the first iteration, 60 single genes were identified as frequent. Based on this, frequent gene sets with 2 and 3 genes were further identified, and no frequent gene sets were found with more than 4 genes. Values of
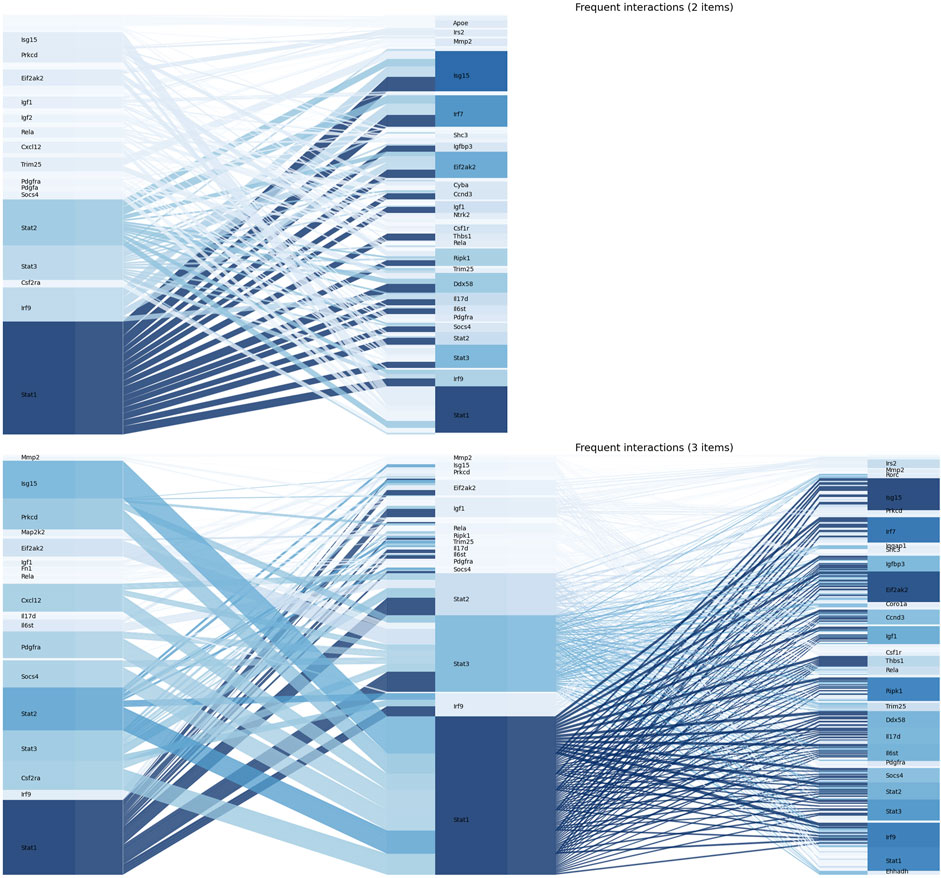
FIGURE 4. The figure illustrated
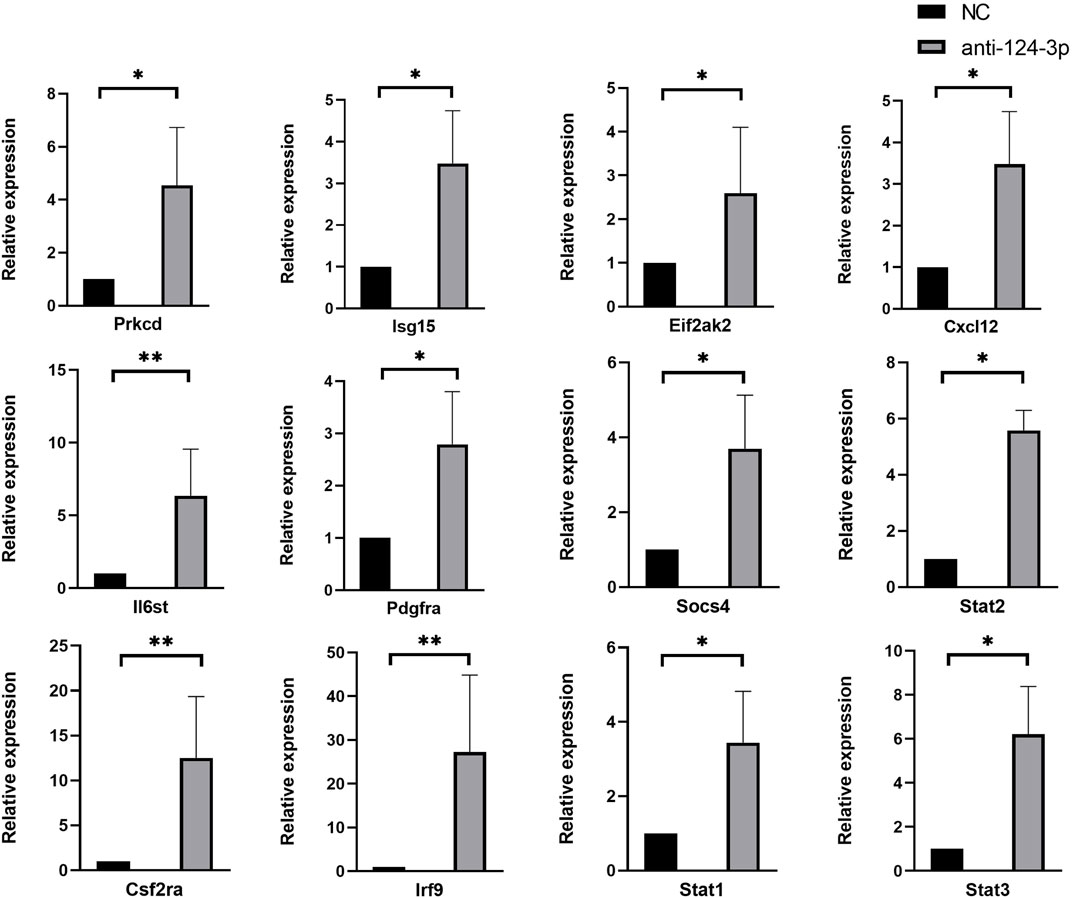
FIGURE 5. Results of RT-qPCR showed the expression of candidate genes bewteen NC and anti-124 group, which exhibited a similar trend to the RNA-Seq results. Each RT-qPCR experiment was repeated three times with independently isolated RNA samples. Results were presented as mean ± standard deviation (anti-miR-124 group, miR-124-3p knockdown group; NC group, negative control group; *p < 0.05, **p < 0.01)
4 Discussion
After gain and loss intervention of the upstream miRNA in a functional experiment, transcriptomics technologies such as RNA-Seq make it possible to obtain a large amount of downstream gene expression data in a single experiment. To handle high-throughput data, although there are many other methods based on the entire gene set analysis, such as CePa (Gu et al., 2012) and SPIA (Tarca et al., 2009), GSEA is still one of the most widely used and outperformed methods by focusing on the entire gene set rather than a single threshold (Bayerlová et al., 2015). Using GSEA, we analyzed the ranked gene list after knockdown of miR-124-3p to determine if they were enriched in given phenotypes, that is, KEGG pathways related to retinal development in our study. In the results, most genes in the anti-miR-124 group were upregulated compared to the NC group, and only pathways in upregulated genes showed significant enrichment, which was consistent with prior theories. A series of KEGG pathways with significant enrichment could be obtained as well as their leading-edge subsets of their associated genes by GSEA. However, for a low-throughput functional experiment, only one or several downstream genes and pathways were selected. The number of generated candidate genes is usually still too high and needs further refinement.
Since not all genes play an equally important role in a pathway, we hypothesized that the genes that have the most interactions with other genes in the entire leading-edge subsets are likely to be the most important. To obtain those genes or gene sets, interactions based on KEGG pathway topology were generated, and the Apriori algorithm was performed. The Apriori algorithm is designed for mining the frequent item set. Although it has exponential time complexity, interactions were generated based on the correlation matrix of
This greatly decreased the calculation time of the Apriori algorithm, making the calculation time acceptable. Moreover, we introduced a new statistic
The statistic
5 Conclusion
In this study, through mRNA sequencing after miR-124-3p knockdown, GSEA was performed to identify significant KEGG pathways and their leading-edge subsets. We demonstrated that using the Apriori algorithm and defining the statistic
Data Availability Statement
The datasets presented in this study can be found in online repositories. The names of the repository/repositories and accession number(s) can be found in the article/Supplementary Material.
Ethics Statement
The animal study was reviewed and approved by The Ethics Committee of the Sun Yat-Sen University Zhongshan Ophthalmic Center.
Author Contributions
YW wrote the code, performed the bioinformatics analysis and contributed to writing manuscript. YH, SM, and YC contributed to the experiments in vivo. YJ and JP assisted with the bioinformatics analysis. YL supervised the study. All authors read and approved the final manuscript.
Funding
This work was supported by the National Natural Science Foundation of China to YL (81770971); and the Natural Science Foundation of Guangdong Province, China to YL (2020A1515010617).
Conflict of Interest
The authors declare that the research was conducted in the absence of any commercial or financial relationships that could be construed as a potential conflict of interest.
Publisher’s Note
All claims expressed in this article are solely those of the authors and do not necessarily represent those of their affiliated organizations, or those of the publisher, the editors and the reviewers. Any product that may be evaluated in this article, or claim that may be made by its manufacturer, is not guaranteed or endorsed by the publisher.
Supplementary Material
The Supplementary Material for this article can be found online at: https://www.frontiersin.org/articles/10.3389/fgene.2022.890672/full#supplementary-material
References
Ackermann, M., and Strimmer, K. (2009). A General Modular Framework for Gene Set Enrichment Analysis. BMC Bioinforma. 10, 47. doi:10.1186/1471-2105-10-47
Agrawal, R., and Srikant, R. (1994). “Fast Algorithms for Mining Association Rules,” in Proceedings of the 20th International Conference on Very Large Data Bases (United States: Morgan Kaufmann Publishers Inc.), 487–499.
Bayerlová, M., Jung, K., Kramer, F., Klemm, F., Bleckmann, A., and Beißbarth, T. (2015). Comparative Study on Gene Set and Pathway Topology-Based Enrichment Methods. BMC Bioinforma. 16, 334. doi:10.1186/s12859-015-0751-5
Bush, S. J., Freem, L., MacCallum, A. J., O’Dell, J., Wu, C., Afrasiabi, C., et al. (2018). Combination of Novel and Public RNA-Seq Datasets to Generate an mRNA Expression Atlas for the Domestic Chicken. BMC genomics 19, 594. doi:10.1186/s12864-018-4972-7
Croft, D., O'Kelly, G., Wu, G., Haw, R., Gillespie, M., Matthews, L., et al. (2011). Reactome: a Database of Reactions, Pathways and Biological Processes. Nucleic acids Res. 39, D691–D697. doi:10.1093/nar/gkq1018
Damiani, D., Alexander, J. J., O'Rourke, J. R., McManus, M., Jadhav, A. P., Cepko, C. L., et al. (2008). Dicer Inactivation Leads to Progressive Functional and Structural Degeneration of the Mouse Retina. J. Neurosci. 28, 4878–4887. doi:10.1523/JNEUROSCI.0828-08.2008
Dillies, M.-A., Rau, A., Aubert, J., Hennequet-Antier, C., Jeanmougin, M., Servant, N., et al. (2013). A Comprehensive Evaluation of Normalization Methods for Illumina High-Throughput RNA Sequencing Data Analysis. Briefings Bioinforma. 14, 671–683. doi:10.1093/bib/bbs046
Gu, Z., Liu, J., Cao, K., Zhang, J., and Wang, J. (2012). Centrality-based Pathway Enrichment: a Systematic Approach for Finding Significant Pathways Dominated by Key Genes. BMC Syst. Biol. 6, 56. doi:10.1186/1752-0509-6-56
Ha, M., and Kim, V. N. (2014). Regulation of microRNA Biogenesis. Nat. Rev. Mol. Cell Biol. 15, 509–524. doi:10.1038/nrm3838
Hackler, L., Wan, J., Swaroop, A., Qian, J., and Zack, D. J. (2010). MicroRNA Profile of the Developing Mouse Retina. Invest. Ophthalmol. Vis. Sci. 51, 1823. doi:10.1167/iovs.09-4657
Karali, M., Peluso, I., Gennarino, V. A., Bilio, M., Verde, R., Lago, G., et al. (2010). miRNeye: a microRNA Expression Atlas of the Mouse Eye. BMC genomics 11, 715. doi:10.1186/1471-2164-11-715
Karali, M., Peluso, I., Marigo, V., and Banfi, S. (2007). Identification and Characterization of microRNAs Expressed in the Mouse Eye. Invest. Ophthalmol. Vis. Sci. 48, 509–515. doi:10.1167/iovs.06-0866
Karali, M., Persico, M., Mutarelli, M., Carissimo, A., Pizzo, M., Singh Marwah, V., et al. (2016). High-resolution Analysis of the Human Retina miRNome Reveals isomiR Variations and Novel microRNAs. Nucleic Acids Res. 44, 1525–1540. doi:10.1093/nar/gkw039
Livak, K. J., and Schmittgen, T. D. (2001). Analysis of Relative Gene Expression Data Using Real-Time Quantitative PCR and the 2−ΔΔCT Method. Methods 25, 402–408. doi:10.1006/meth.2001.1262
Maleki, F., Ovens, K., Hogan, D. J., and Kusalik, A. J. (2020). Gene Set Analysis: Challenges, Opportunities, and Future Research. Front. Genet. 11. doi:10.3389/fgene.2020.00654
Monaco, G., Lee, B., Xu, W., Mustafah, S., Hwang, Y. Y., Carré, C., et al. (2019). RNA-seq Signatures Normalized by mRNA Abundance Allow Absolute Deconvolution of Human Immune Cell Types. Cell Rep. 26, 1627–1640. e1627. doi:10.1016/j.celrep.2019.01.041
Ritchie, W., Rajasekhar, M., Flamant, S., and Rasko, J. E. J. (2009). Conserved Expression Patterns Predict microRNA Targets. PLoS Comput. Biol. 5, e1000513. doi:10.1371/journal.pcbi.1000513
Subramanian, A., Tamayo, P., Mootha, V. K., Mukherjee, S., Ebert, B. L., Gillette, M. A., et al. (2005). Gene Set Enrichment Analysis: A Knowledge-Based Approach for Interpreting Genome-wide Expression Profiles. Proc. Natl. Acad. Sci. U.S.A. 102, 15545–15550. doi:10.1073/pnas.0506580102
Tarca, A. L., Draghici, S., Khatri, P., Hassan, S. S., Mittal, P., Kim, J.-s., et al. (2009). A Novel Signaling Pathway Impact Analysis. Bioinforma. Oxf. Engl. 25, 75–82. doi:10.1093/bioinformatics/btn577
Wagner, G. P., Kin, K., and Lynch, V. J. (2013). A Model Based Criterion for Gene Expression Calls Using RNA-Seq Data. Theory Biosci. 132, 159–164. doi:10.1007/s12064-013-0178-3
Wagner, G. P., Kin, K., and Lynch, V. J. (2012). Measurement of mRNA Abundance Using RNA-Seq Data: RPKM Measure Is Inconsistent Among Samples. Theory Biosci. 131, 281–285. doi:10.1007/s12064-012-0162-3
Wang, Y.-P., and Li, K.-B. (2009). Correlation of Expression Profiles between microRNAs and mRNA Targets Using NCI-60 Data. BMC genomics 10, 218. doi:10.1186/1471-2164-10-218
Wang, Y., Wang, X., Jiang, Y., Liu, R., Cao, D., Pan, J., et al. (2020). Identification of Key miRNAs and Genes for Mouse Retinal Development Using a Linear Model. Mol. Med. Rep. 22, 494–506. doi:10.3892/mmr.2020.11082
Keywords: GSEA, RNA-Seq, MiR-124-3p, apriori algorithm, miRNA
Citation: Wang Y, Hong Y, Mao S, Jiang Y, Cui Y, Pan J and Luo Y (2022) An Interaction-Based Method for Refining Results From Gene Set Enrichment Analysis. Front. Genet. 13:890672. doi: 10.3389/fgene.2022.890672
Received: 06 March 2022; Accepted: 04 May 2022;
Published: 30 May 2022.
Edited by:
Maurice HT. Ling, Temasek Polytechnic, SingaporeReviewed by:
Adison Choonkit Wong, Singapore Institute of Technology, SingaporeJing Wui Yeoh, National University of Singapore, Singapore
Copyright © 2022 Wang, Hong, Mao, Jiang, Cui, Pan and Luo. This is an open-access article distributed under the terms of the Creative Commons Attribution License (CC BY). The use, distribution or reproduction in other forums is permitted, provided the original author(s) and the copyright owner(s) are credited and that the original publication in this journal is cited, in accordance with accepted academic practice. No use, distribution or reproduction is permitted which does not comply with these terms.
*Correspondence: Yan Luo, bHVveWFuMkBtYWlsLnN5c3UuZWR1LmNu
 Yishen Wang1
 Yan Luo