 M. M. De Souza
 D. A. Koltes
 H. Beiki
 M. A. Sales
 T. Tsai
 C. V. Maxwell
 J. Zhao
 J. E. Koltes
95% of researchers rate our articles as excellent or good
Learn more about the work of our research integrity team to safeguard the quality of each article we publish.
Find out more
ORIGINAL RESEARCH article
Front. Genet. , 23 August 2022
Sec. Livestock Genomics
Volume 13 - 2022 | https://doi.org/10.3389/fgene.2022.886875
This article is part of the Research Topic Microbiome Genomics for Livestock Production View all 8 articles
Exposure to less-hygienic conditions during early childhood has been associated with stimulation and development of the immune system. A recent study indicated that exposure of piglets to soil-borne microbes during lactation was related with modulation of gut microbiota and immune function. To identify the potential molecular mechanisms and pathways impacted by early-life topsoil exposure, we analyzed the messenger RNA (mRNA) and micro-RNA (miRNA) expression in peripheral blood mononuclear cells (PBMCs) from these piglets. Total RNA was extracted from the PBMCs of piglets exposed to topsoil only from d 4–d 21 of life (mRNA n = 6; miRNA n = 5) or unexposed control pigs (mRNA n = 6; miRNA n = 8) at 11, 20, and 56 days of age. Small RNA and mRNA were sequenced with 50-bp single-end reads using Illumina chemistry. Sequence data were quality checked with FASTQC software and aligned to the Sscrofa 11.1 genome with the STAR aligner for mRNA and mirDeep2 for miRNA. Differential expression (DE) analysis was performed using PROC Glimmix of SAS to evaluate changes in expression due to topsoil exposure over time with genes declared DE at a false discovery rate (FDR) of q < 0.10. A total of 138 mRNA and 21 miRNAs were identified as DE for the treatment by age interaction. Ontology enrichment analysis of DE mRNA revealed Gene ontology (GO) terms directly involved in the connection between T-cell and antigen-presenting cells that are associated with T-cell activation. Key regulatory genes identified include PTPRJ, ITGB3, TRBV30, CD3D, mir-143, mir-29, and mir-148a. While these results require validation, this study provides data supporting the hypothesis that less-hygienic environments during early life may contribute to the development of the immune system.
Disease resistance of individuals exposed to less-hygienic conditions during early life has been called the hygiene hypothesis, first postulated by Strachan (1989). It proposes that individuals exposed to less-hygienic conditions early in life may have altered immune system development which lowers the incidence of illness later in life (Strachan, 1989). While it is well understood that particular conditions, such as poor water sanitation, lead to the development and propagation of diseases, low environmental exposure has been associated with increased resistance to human chronic illnesses, such as asthma and allergies (Illi et al., 2001; MacNeill et al., 2013; Huang et al., 2021). It has been theorized that this low dose of exposure results in a mild stimulation of the immune system, particularly the adaptive immune system (Su et al., 2013).
A growing number of publications indicate that microbe exposure may be a significant contributor to the development of the immune system (reviewed by Zheng et al., 2020). Ennamorati et al. (2020) identified the gut microbiome as a major presenter of novel antigens to the immune system that influences the generation of regulatory T cells by the thymus in neonatal mice. The authors described how this process may facilitate homeostasis between microbiota and the host immune system in the host to prevent intestinal inflammation later in life. Studies in the chicken also indicate that intestinal microbiota may regulate T-cell production in the thymus in early life (Cheng et al., 2021). Moreover, postnatal microbial colonization of the body may act as a major stimulus of immune tissue development and modulation of miRNA expression (Masotti, 2012), which contributes to “training” of the immune system (Gury-BenAri et al., 2016). This early training of the immune system and development of microbial memory in early life may allow individuals to overcome an illness more quickly, thus, allowing them to spare energy to partition toward growth. In addition, development of a more robust immune system should reduce antibiotic use and subsequently antimicrobial resistance.
As livestock producers have strived to increase sustainability and growth efficiency of pigs, the environment and hygienic conditions have significantly changed over time. During early commercialized swine production, swine were reared outdoors and exposed to soil, weather, and predators. The move to modern, indoor housing has allowed for decreased exposure to parasites, fecal material, predators, and changes in weather conditions, which greatly improved the overall welfare of swine. It has been observed that early-life exposure of pigs to less-hygienic conditions (i.e., topsoil exposure) has increased growth (Dourmad et al., 2009; Lebret et al., 2011; Wenner et al., 2013; Vo et al., 2017) while decreasing feed intake (Lebret et al., 2011; Wenner et al., 2013). One explanation for these findings is that host exposure to microbes from the environment may influence host physiology.
Initial studies of neonatal pigs exposed to topsoil indicate microbial communities (Vo et al., 2017; Wen et al., 2021) and the immune cell population (Tsai et al., 2016; Wen et al., 2021) are altered later in life in response to early-life topsoil exposure. Both Vo et al. (2017) and Wen et al. (2021) identified higher levels of Prevotella at days 13 and 12, respectively, in the gut of piglets exposed to topsoil. In mice, perturbation of Prevotella in the gut microbiome resulted in exacerbated intestinal inflammation (Iljazovic et al., 2021). Moreover, Vo et al. (2017), who used the same animals described in this study, identified a higher abundance of Prevotella at weaning (d 21) and at day 35 (mid-nursery). Vo et al. (2017) also identified higher levels of Bacteroidetes and Ruminococcaceae at day 13 and Clostridium and Clostridium cluster XI, Coprococcus, Campylobacter, Streptococcus, Mitsuokella, Ruminococcus, Dialister, and Sarcina during postweaning at the end of the nursery phase (d 56) in response to topsoil exposure. Interestingly, Clostridium species have been associated with colonic regulatory T-cell accumulation and improvement of the local and systemic immune responses (Atarashi et al., 2011). Although these studies demonstrate that the microbiome is altered in pigs exposed to topsoil, it is still unclear which specific microbes are directly impacting the animal’s physiology. Little is known about the molecular mechanisms responsible for impacting animal growth or the immune system in this model. Understanding how the immune system is programmed in response to microbes and the environment is an important step in the development of technologies (e.g., probiotics) that may enhance efficiency in livestock production, and provide basic science knowledge about host–microbiome interactions that are beneficial to improve human health.
The objective of this study was to identify changes in peripheral blood mononuclear cell (PBMC) gene expression and associated pathways in response to early-life topsoil exposure in piglets from a subset of piglets exposed to topsoil from previous studies (Tsai et al., 2016; Vo et al., 2017). Specifically, we sought to determine if there was evidence of early, enhanced, or altered immune system development based on mRNA and miRNA expression profiles using RNA-sequencing (RNA-seq) technology. Transcriptome profiling is a powerful tool to evaluate global changes in gene expression within a tissue. As miRNAs are well-established regulators of gene expression and may facilitate communication between the host and microbiome, we evaluated the relationship between miRNAs and known or predicted mRNA targets (Masotti, 2012; Yuan et al., 2018; Gebert and MacRae, 2019).
A detailed description of the animal trial can be found in Vo et al. (2017). Briefly, animal experiments were conducted at the University of Arkansas-Division of Agriculture Swine Research Unit in Fayetteville, Arkansas under protocols approved by the University of Arkansas Institute of Animal Care and Use Committee #13060. A total of 14 synthetic large white pigs were used for the experiment. Control piglets (control group; n = 6 for mRNA and n = 8 for miRNA analysis) were reared conventionally in farrowing crates, whereas treatment piglets (topsoil group; n = 6 for mRNA and n = 5 for miRNA analysis) were exposed daily to fresh topsoil from day 4 postpartum until the end of lactation (d 20). All piglets were weaned and transferred to a nursery facility without soil at d 20. Piglets were weighed and blood samples were collected at 11, 20, and 56 days of age. Additional information about the individual pigs (e.g., sex, weight) is provided in Supplementary Tables S1, S2 for mRNA and miRNA experiments, respectively.
Whole blood samples (10 ml) were collected through venipuncture via jugular vena cava into EDTA tubes (BD Vacutainer® K2EDTA-coated blood collection tube, Franklin Lakes, NJ) from piglets with median body weight (BW) in each litter at days 11, 20 (weaning), and 56 (the end of nursery) of age. PBMCs were isolated using Histopaque®-1,077 (MilliporeSigma, Burlington, MA) gradient centrifugation according to the manufacturer’s protocol and stored at -80°C until total RNA extraction.
Total RNA was extracted with TRIzol® using the Direct-Zol RNA Isolation Kit (Zymo Research Corp.), according to the manufacturer’s protocol. RNA quality was determined using an Experion RNA analysis kit (Biorad, Hurcules, CA) to determine RNA degradation using the RNA quality index (RQI) and RNA quantity was measured by fluorometer using a Qubit (ThermoFisher, Waltham, MA). Total RNA samples that passed quantity (100 ng/uL) and quality criteria (RNA quality indicator, RQI = 5.1–9.8) were utilized for sequencing. The RNA-Seq analysis was conducted using Illumina HiSeq4000 chemistry at the Beijing Genomics Institute (BGI) Americas (BGI, Shenzhen, Guangdong, China). Small RNA and mRNA libraries were constructed from the total RNA samples for 50-bp single-end sequencing.
Sequence read quality was evaluated with FastQC version0.11.3 (Andrews and Babraham Bioinformatics, 2010) and adaptors and low-quality reads were trimmed using Trim Galore version 0.4.5 (Krueger, 2015). Sequence reads from mRNA libraries were aligned to the Sscrofa 11.1 reference genome using the STAR alignment software version 2.5.4a (Dobin et al., 2013). The number of read counts for each transcript was quantified with FeatureCounts version 2.0.3 (Liao et al., 2014). To determine miRNA expression levels, sequence reads were aligned to the Sscrofa11.1 reference genome using miRDeep2 (Friedländer et al., 2008).
Prior to analysis, data were filtered to remove unexpressed (i.e., genes with 0 read counts) and lowly expressed genes. Lowly expressed genes were defined as those not present in 24 of 36 mRNA or 17 of 39 miRNA samples, and with an average expression >2 reads/sample. To account for differences in library size, all samples were normalized using the 75% Quantile method (Bullard et al., 2010). Differential expression analysis was performed with PROC Glimmix of SAS (SAS Institute Inc., 2013) using a negative binomial distribution to fit the model:
where y = normalized expression value for each sample k; treatment i = topsoil or control; lane j = sequencing lane 1, 2 or 3; RQI = RNA quality score for each sample k from each individual l; parity m = parity of the piglet’s sow (1–4); age = age of piglet at sample k = d 11, d 20, or d 56; sex n = male or female, litter size = number of piglets within piglet’s litter (range: 5–17), and e = random residual error. In addition, pig was included as a random effect to account for the repeated measure across age. The same model was fit for miRNA, except that only one lane was used for sequencing, so no lane effect was needed. For both the mRNA and miRNA analyses, we focused on identifying genes that changed in expression overtime in response to early-life topsoil exposure (i.e., treatment vs. age interaction). To account for multiple testing, q-values were calculated in R using the q-value package (Storey et al., 2019) to determine the false discovery rate (FDR) for gene lists. Significant differentially expressed (DE) genes were declared at q < 0.10.
To identify pathways of genes that may be impacted by the early-life topsoil exposure treatment, co-expression network analysis was conducted. Co-expression networks were built separately for the control and topsoil mRNA and miRNA groups, respectively, using the Weighted Gene Co-expression Network Analysis (WGCNA) methods and associated R package (Langfelder and Horvath, 2008). The RNA-seq count data were normalized using the Trimmed Mean of M-values method (TMM) in the edgeR package (Robinson et al., 2009). Four network analyses were performed to compare the network modules (putative pathways) between control and topsoil treatments for both the mRNA and miRNA expression data. Spearman’s correlation coefficients were used to obtain the pairwise similarity between gene expression profiles in a signed co-expression network. The soft threshold chosen was β = 14 for all four analyses performed. The minimum module size chosen was 25 and 5 transcripts per module for mRNA and miRNA networks, respectively.
To determine the potential miRNA regulation of mRNA pathways, we identified miRNA modules statistically associated with mRNA modules. Spearman correlations were calculated between eigen values for mRNA and miRNA modules and correlation p-values were adjusted to control the FDR using the R package psych version 1.8.10 (Revelle, 2018). To discover individual mRNA or miRNA that may be regulating pathways, mRNAs and miRNA showing higher connectivity within a module were identified as possible hub genes based on module membership (MM) values. The MM values >0.9 were selected as candidate hub (regulator) genes. We used TargetScan to retrieve the known target genes for each miRNA contained within the modules. Only the correlated target genes for the corresponding miRNA within in the correlated miRNA:mRNA module were kept for ontology enrichment analysis.
Biological processes and molecular pathways that differ in response to early-life topsoil treatment were identified using gene ontology enrichment analysis. Functional analysis was carried out using the human orthologues genes since more complete annotation information is available for human genes. Biomart (Durinck et al., 2009) was used to retrieve Homo sapiens orthologues for all expressed genes, where orthologues were defined as DNA sequences with >60% nucleotide similarity. Enriched pathways and biological processes were enriched for the DE gene list and miRNA target gene list using the Cytoscape plugins ClueGO v. 2.5.3 and CluePedia v. 1.5.3 (Bindea et al., 2009). The background (reference genes) used in the enrichment analysis were set as all expressed genes in PBMCs from our samples. Biological process gene ontology (GO) terms (GO tree level ≥5) were considered significantly enriched within the gene list at a p ≤ 0.05 Benjamini and Hochberg corrected p-value. After identifying the gene-GO matrix, ClueGo clusters similar GO terms into functional groups based on the association strength between the ontology terms, using a kappa score (≥0.5). Group p-values were calculated using the number of unique genes found from the uploaded gene list that were statistically associated with the ontology terms included in the group and the total number of unique genes associated with those terms. p-value was adjusted using Benjamini and Hochberg (BH) (p-value < 0.05). Enrichment of KEGG pathway terms from small RNA target genes was conducted using the DIANA-miRPath, v3.0 software (Vlachos et al., 2015). Predicted targets were identified using the DIANA-microT-CDS Targets of miRNAs analysis, with default setting (Micro T threshold = 0.08, p < 0.05) and enrichment analysis methods (Fisher’s exact test).
A total of 16.5 million sequence reads were mapped, on average, per sample for the mRNA libraries to the Sscrofa 11.1 reference genome. A total of 13 million sequence reads were mapped, on average, per sample for the miRNA libraries. After applying zero and low expression filters, a total of 14,316 transcripts were available for differential expression analysis in SAS. All sequencing statistics are available in Supplementary Tables S1, S2.
A total of 138 genes were identified as DE for the treatment by age interaction (q < 0.10). The full list of DE genes and associated statistics are available in Supplementary Table S3. A heat map displaying the expression levels of DE genes is provided in Figure 1A. Trends in gene expression patterns observed over time when comparing the topsoil treatment to control for all DE genes are shown in Supplementary Figures S1–S6 for all the DE genes. To better understand the function of the DE mRNAs, GO enrichment analysis was performed using the DE genes that had annotations for human orthologues (109 of 138 DE genes). A total of 59 GO terms were identified as statistically enriched for specific biological terms (p-adjusted < 0.05; Figure 1B, Supplementary Table S4). Forty-three of these GO terms were clustered into 13 groups with similar GO term biological processes (BP) (Figure 1B). The most statistically significant ontology term was platelet degranulation (adjusted p < 0.01). The three largest clusters of enriched GO terms (Groups 1, 2, and 12; Figure 1B) were involved in processes related to functionality or components of the immune system. Four additional gene ontology groups identified were also known to be involved in immune system, including the terms microtubule-based protein transport (group 4), integrin-mediated signaling pathways (group 8), positive regulation of peptidyl-tyrosine phosphorylation (group 9) and positive regulation of cell-substrate adhesion (group 13). The genes in these seven combined ontology term groups had higher levels of transcript abundance at day 20 in topsoil-treated animals (with the exception of IFT20 and OPTN; Figure 1C). A total of 15 out of 28 genes in these ontology groups exhibited higher levels of transcript abundance in the control piglets at days 11 and 56. Although the DE genes CD3D and TRBV30 were not included in these ontology term groups, they also had higher expression in topsoil-treated piglets at day 20 in the same pattern observed in the seven ontology groups identified. Since CD3D and TRBV30 play a major role during immune response as components of the T-cells receptor (TCR) complex, they are also highlighted in Figure 1C. Other statistically significant ontology terms (adjusted p < 0.05) included: negative regulation of insulin secretion, positive chemotaxis, BMP signaling, SMAD signaling, iron ion transport, and homeostasis and glucan metabolic process.
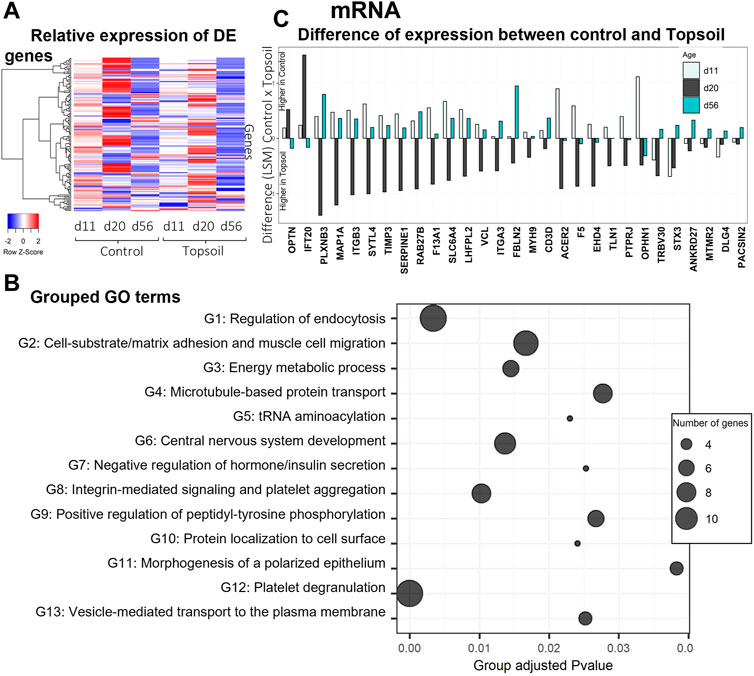
FIGURE 1. Gene expression and gene ontology (GO) enrichment analysis of the differentially expressed (DE) mRNA in response to topsoil treatment (A) A heatmap comparison of the expression of the DE mRNAs across time and treatment (control vs. topsoil) in peripheral blood mononuclear cells (PBMCs.). The three timepoints correspond to when pigs were still exposed to topsoil in the nursery (d 11) and at weaning (d 20) as well as after topsoil was removed at the postweaning (d56) timepoint. The heat map shows the clustered relative gene expression (least squares mean–LSM) for control and topsoil treatments by age (day of life/age of piglet: 11, 20, and 56) (B) Visualization of the number and significance of grouped gene ontology (GO) terms identified using the DE genes in ClueGo software. The group p-values (provided on the x-axis) were calculated using the list of unique DE genes and adjusted using a Benjamini and Hochberg correction (BH). p-values were considered significant at BH adjusted p-value < 0.05. The size of the bubbles represents the number of genes clustered in the ontology term group (C) A histogram showing the difference in transcript abundance between the control and topsoil treatment at days 11, 20, and 56 for selected genes with ontology terms related to functionality or components of the immune system. Differences in mRNA abundance were estimated using the LSM between control and topsoil treatments at each specific time point (piglet age). Positive differences (above zero) means higher abundance in the control group while negative differences (below zero) mean higher in topsoil group.
A total of 542 miRNAs were identified by miRDeep2 software. After filtering for annotations, a total of 254 miRNAs were used for the statistical analysis. Twenty-one unique miRNAs were identified as DE for the treatment by age interaction (q < 0.10; miRNA DE results are listed in Supplementary Table S5). A heat map displaying the expression levels of DE miRNA is provided in Figure 2A. Trends in miRNA expression patterns observed over time when comparing treatments are shown in Supplementary Table S7. The five most significantly DE miRNA included miR-1306, miR-660, miR-126, miR-1285, and miR-1468. Notably, six of the miRNAs identified as DE had gene annotations related to functionality or components of the immune system. To better understand the function of the DE miRNAs, enrichment analysis was performed using the KEGG ontology to identify enriched pathways that may be affected by these miRNAs (Figure 2B, Supplementary Table S6). Enrichment analysis identified 32 different pathways associated with these miRNAs. Of these 32 pathways, seven were directly associated with disease phenotypes and seven were associated with cellular signaling (i.e., neurotrophin signaling to Ras pathway signaling). Additional commonly enriched KEGG pathways were neurological signaling (4 pathways) and development (3 pathways). In total, these KEGG pathways included 11 of the DE miRNAs miR-126–5p, miR-1306–5p, miR-143–3p, 148b-5p, miR199a-3p, miR199b-3p, miR-22–3p, miR26b-5p, miR-296–3p, miR545–5p, miR-628–5p. Most of these 11 miRNAs showed higher abundance at day 20 in piglets exposed to topsoil, except for miR-143–3p, miR-296–3p, and miR-22–3p, as shown in Figure 2C.
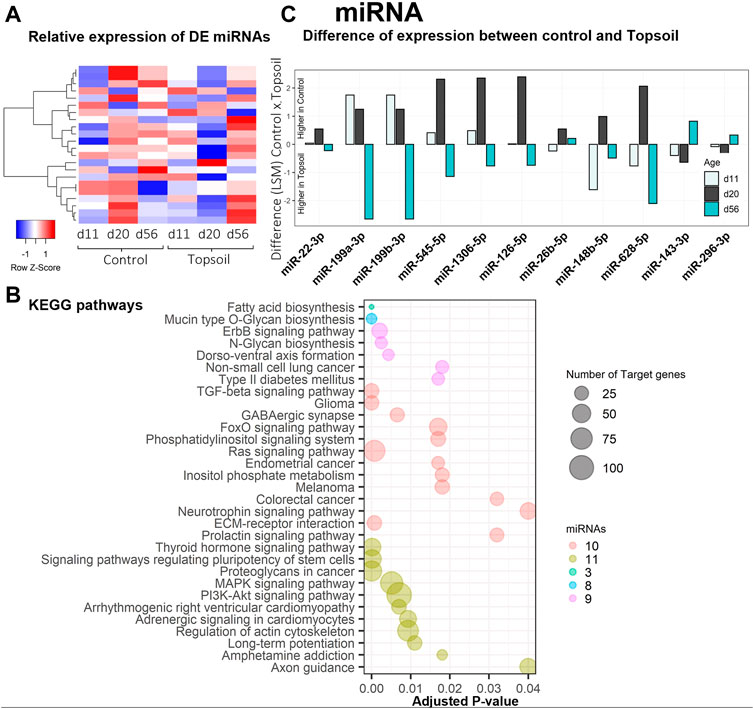
FIGURE 2. Gene expression and gene ontology (GO) enrichment analysis of the differentially expressed (DE) miRNA response to topsoil treatment (A) A heatmap comparison of the expression of the most highly DE miRNAs across time and treatment (control vs. topsoil) in peripheral blood mononuclear cells (PBMCs.) The three timepoints correspond to when pigs were still exposed to topsoil in the nursery (d 11) and at weaning (d 20) as well as after topsoil was removed at the postweaning (d56) timepoint. The heat map shows the clustered relative miRNA expression (least squares mean—LSM) for control and topsoil treatments by age (day of life/age of piglet: 11, 20, and 56) (B) Visualization of the number and significance of KEGG pathway terms identified by DIANA pathway ontology enrichment analysis of DE miRNA. The size of the bubbles represents the number of target genes clustered in the KEGG ontology term group. Bubbles were colored by the number of miRNAs enriched within an ontology group (C) A histogram showing the difference in abundance of miRNA expression between control and topsoil treatment at each time points of miRNAs clustered in the KEGG ontology. Differences in miRNA abundance were estimated using the LSM between control and topsoil treatments at each specific time point (piglet age). Positive differences (above zero) mean higher abundance in the control group while negative differences (below zero) mean higher in topsoil group.
To determine coordinated (i.e., correlated) changes in gene expression in response to early-life topsoil exposure, gene co-expression network modules were identified using 14,316 mRNA genes and 185 miRNAs, separately. A total of 99 control mRNA modules and 144 topsoil mRNA modules were identified (Figures 3A,B). A total of 17 control miRNA modules and 22 topsoil miRNA modules were identified (Figures 3C,D). We identified 22 DE genes as hub genes in control modules and 23 in topsoil modules (Supplementary Table S3). For miRNA, four DE miRNA were hub genes in control modules while eight were hub in topsoil modules (Supplementary Table S5).
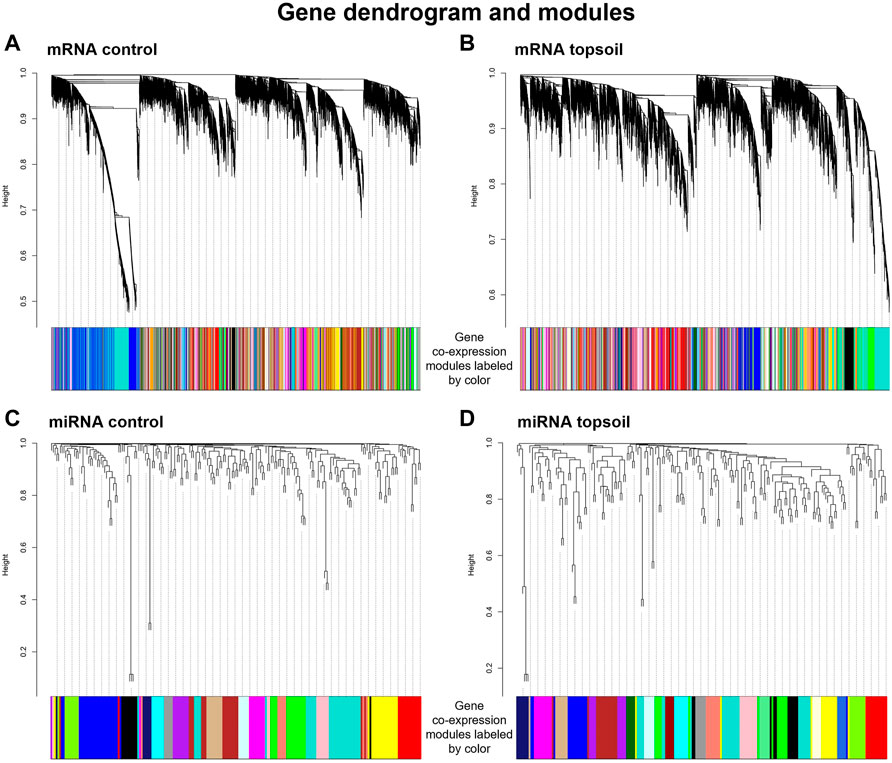
FIGURE 3. Gene co-expression modules identified for the mRNA control group (A), mRNA topsoil (B) miRNA control (C) and miRNA topsoil (D) groups. Co-expression modules are differentiated by color. Each group of co-expression modules is accompanied with the corresponding gene dendrogram.
To identify the potential regulation of mRNA by miRNA, miRNA:mRNA modules were identified. A total of 11 miRNA and mRNA module pairs were identified as significantly correlated (q-value < 0.05; Table 1). In the control group, only one pair of negatively correlated modules was identified (miR-blue:mRNA-turquoise). Five negatively and five positively correlated modules were identified in the topsoil group with some modules identified as correlated across multiple modules. For example, the topsoil miR-blue module was correlated to three different mRNA modules. The black, brown and salmon miRNAs modules were each correlated with two different mRNA modules. Only one mRNA module (turquoise) was correlated to multiple miRNA modules in topsoil. Table 2 summarizes the GO BP enrichment results for the four most highly correlated mRNAs modules with miRNA modules in the topsoil group. The complete list of enriched BPs is presented in Supplementary Table S7. Only seven out of 11 miRNA:mRNA pairs enriched for GO terms. The miRblack:black interaction showed the highest number of enriched BP, totalizing 204 BPs clustered in 36 groups, including pathways directly related to immune response, such as the groups lymphocyte homeostasis, natural killer cell-mediated cytotoxicity and regulation of T-cell receptor signaling pathways. The second highest enrichment was for the miRbrown:brown interaction with 36 BPs clustered in 10 groups including immunity-related pathways such as positive regulation of B-cell receptor signaling pathway and response to lipopolysaccharide. All the groups enriched for MiRblack:antiquewhite4 and miRblue:royalblue modules interaction were related to functionality or components of the immune system.
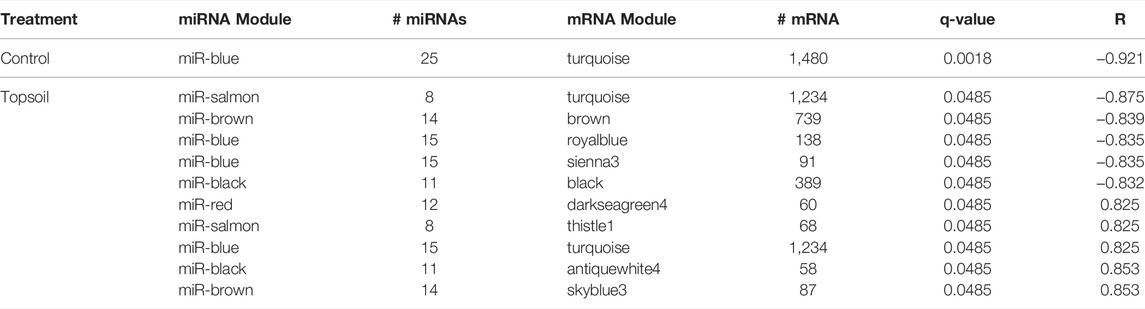
TABLE 1. Identification of correlated (q < 0.05) miRNA:mRNA modules. Modules are identified with colors names designated by WGCNA software within treatment group (topsoil or control). The number of miRNA (# miRNAs) and mRNA (# mRNA) within each module, correlation between module pairs (R), and significance of the correlation (q-value) are presented.
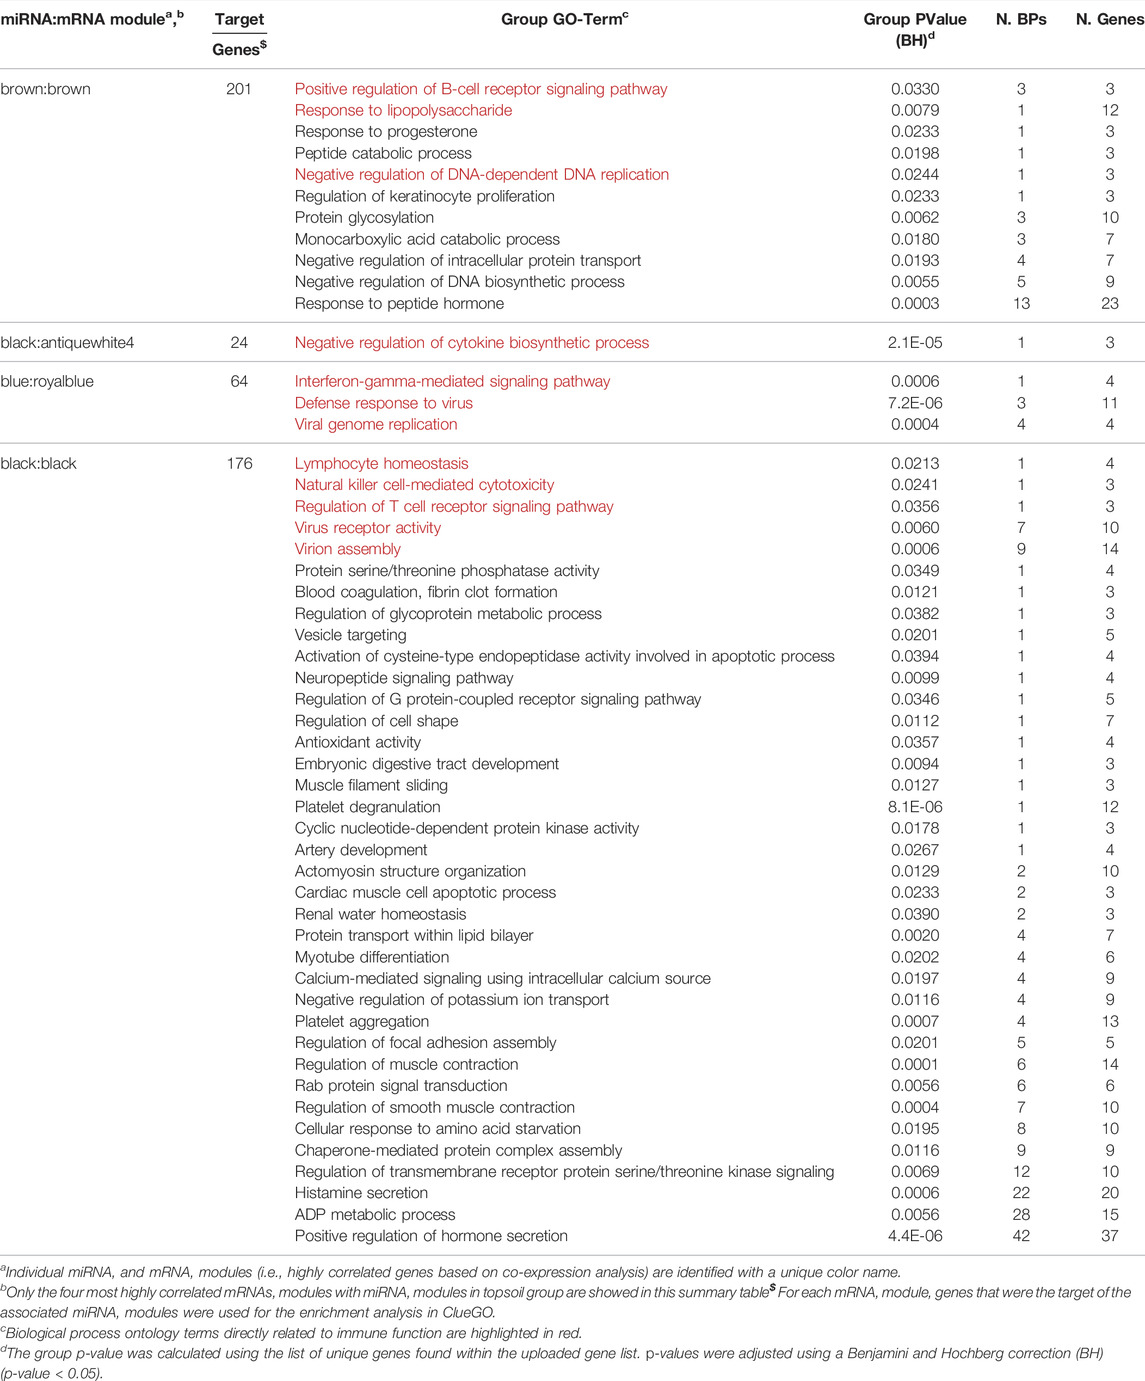
TABLE 2. Summary of enriched Gene Ontology (GO) biological processes (BP) for four miRNA:mRNA co-expression interaction networks in the topsoil group. miRNA targets contained in the correlated mRNA module were used for the enrichment.
The objective of this study was to identify potential mechanisms controlling how the immune system is programmed in response to microbes and the environment. To understand how early-life exposure to less-hygienic conditions alters immune training, piglets were exposed to topsoil only from d 4-d 21 of life, which resulted in the modulation of gut microbiota and growth performance (Vo et al., 2017). To determine changes in immune signaling, PBMC mRNA and miRNA gene expression were analyzed over the first 56 days of life. The following passages provide potential explanations for the observed changes in PBMC gene expression in response to early-life topsoil exposure along with the potential limitations in the interpretation of this study.
Genes identified as DE indicate changes in the development of the immune system which under the parameters of this study may be in response to interactions with novel antigens or nutrient availability. This analysis identified DE genes associated with T-cell activation. The first two DE genes, PTPRJ and ITGB3, are known to be involved in the formation of the immune synapse or area of communication between a T cell and an antigen-presenting cell (APC). Both genes were upregulated at d 20 in the topsoil group (Supplementary Figure S1, Figure 1C) which may be in response to increased contact with microbes during the nursery phase from d 4 to d 21. Corroborating these results, Lin et al. (2004) found increased levels of PTPRJ in T cells upon activation in mice, indicating that this increase in the topsoil-exposed piglets may have elevated T-cell activation at d 20. Conversely, the lower levels of PTPRJ in naïve T cells in mice (Lin et al., 2004) indicate that the lower expression of PTPRJ in the control piglets at d 20, when the piglets were in higher hygienic conditions, results from lower antigen contact and probably higher naïve T cells.
Two of the identified DE genes makeup components of the T-cells receptor (TCR) complex, TRBV30 and CD3D, are crucial to antigen recognition and initiation of cellular signaling. The diversity of paired alpha and beta chains of the TCR repertoire confers broad immune coverage against pathogens. Recent studies using next-generation sequencing have characterized the TCR repertoire of individuals. The TCR repertoire is composed of a diverse combination of alpha and beta TCR chains (Attaf et al., 2015), which may provide the pathogen exposure history and immunological memory of a given individual (DeWitt et al., 2018). TRBV30 is one of the several genes encoding the V region of the variable domain of TCR beta chain which is responsible for recognizing specific peptides presented by APCs (Davis et al., 1995). The CD3D gene is associated with TCR chain activation after antigen recognition (Dave et al., 1997; Garcillán et al., 2021). Both TRBV30 and CD3D exhibited similar trends of expression over time in this study. In piglets exposed to topsoil, expression levels increased from d 11 to d 20 and then decreased at d 56 (Figure 1C). In control piglets, expression levels decreased from d 11 to d 20 and increased at d 56. The increased expression at d 20 followed by a decrease at d 56 in the topsoil group as well as the delayed peak in the control piglets may indicate earlier development of the immune system in topsoil-exposed piglets compared with the control. Early-life exposure to topsoil may have provided microbes or other substances that resulted in these differences in gene expression that allow for faster response to future exposure of these microbes. Once ingested by the piglets, microbes and other constituents of the topsoil would interact with Paneth cells and APCs that stimulate the immune system.
Other DE genes with known function in immune response (i.e., BMP8A, GPD2, PHKA1 and PHKA2) (Supplementary Figure S1) exhibited a similar pattern of expression, which may support the hypothesis that exposure to topsoil alters the timing or development of the immune system. Of particular interest, BMP8A is a transforming growth factor beta (TGF-β) superfamily member contained within a signaling pathway essential to activation and homeostasis of naïve CD4+ T cells (Martínez et al., 2015).
The ontology enrichment analyses identified pathways involved in T-cell activation, specifically those involved in the interaction between the T cell and the APC, including the formation of the interactive space between the two also known as the immunological synapse. The DE genes STX3, PTPRJ, ITGB3, ITGA3, MYH9, and TLN1 were clustered in several GO terms related to processes involved in many aspects of the immune synapse and downstream signaling. These genes function in vesicle-mediated transport to the plasma membrane (GO:0098876), protein transport within plasma membrane (GO:0099632), microtubule-based protein transport (GO:0099118), integrin-mediated signaling pathways (GO:0007229), positive regulation of peptidyl-tyrosine phosphorylation (GO:0050731), and positive regulation of cell-substrate adhesion (GO:0010811). After T-cell receptor stimulation, cytoskeleton reorganization (actin and microtubules) is needed to adapt the cell conformation and formation of the synapse architecture (Valitutti et al., 1995; Martín-Cófreces and Sánchez-Madrid, 2018). Traffic through the membrane is important to regulate the activation of T cells by balancing the cellular localization of a wide type of components as receptors, signaling molecules or cytokines (reviewed by Soares et al., 2013). STX3 has a putative role in the formation of the immune synapse of cytotoxic T cells as it is involved in protein trafficking involving vesicle fusion and exocytosis. STX3 co-localized with CD3 proteins which are components of TCR-CD3 complex on T-cell surfaces (Pattu et al., 2012). Two additional DE genes, PTPRJ and ITGB3, are known to be involved in the formation of the immune synapse and clustered in GO terms related to cell-substrate adhesion and regulation of tyrosine phosphorylation. The ITGB3 gene plays a role in the immune synapse by encoding a subunit of specific integrins. Other DE genes involved in these processes include ITGA3, MYH9, and TLN1 (Figure 1C, Supplementary Figure S1), all of which increase at d 20 in piglets exposed to topsoil suggesting that these genes support the formation of the immune synapse (Figure 1C).
An important finding in relation to the development of the immune system was the identification of mir-143 as DE in response to topsoil exposure over time (Figure 2C). MicroRNAs are important regulators of gene expression with important roles in mediating the function of the immune system (Ma et al., 2011; Zhang et al., 2018). Typically, each miRNA suppresses gene expression in tens to thousands of mRNA transcripts to coordinate the use of pathways within the transcriptome (Gebert and MacRae, 2019). Previous studies indicate that overexpression of mir-143 may enhance the conversion of cytotoxic T cells into memory cells by reprogramming cellular metabolism (Zhang et al., 2018). In addition, mir-143 was identified as a candidate regulator of a miRNA-target co-expression network in response to topsoil and a hub miRNA within the brown miRNA module. It was also negatively correlated with a group of mRNAs (brown mRNA module) only in the piglets exposed to topsoil during early life. Target mRNA genes within the miRNA:mRNA correlated modules containing mir-143 were enriched for biological processes and pathways such as response to lipopolysaccharide and positive regulation of B-cell receptor signaling pathway. Together, mir-143, the other hub miRNAs, and their co-expressed target genes in the brown module make up a miRNA-target network acting as a putative driver of the immune response in the animals exposed to topsoil in early life.
Analysis of mRNA-miRNA interactions also identified mir-29a-3p and mir-148–5p as potential regulators of gene expression only in topsoil-exposed pigs. Upon bacterial infection, mir-29a-3p has been identified to be downregulated in innate immune cells, such as natural killer and adaptive immune cells such as helper T cells and cytotoxic T cells (Ma et al., 2011). Targets of mir-29a-3p were enriched for regulation of mTOR signaling which has a role in the innate and adaptive immune system by regulating metabolism. As reviewed by Chi. (2012), mTOR signaling can act in different pathways affecting T-cell activation, differentiation, and immune homeostasis. The third interesting candidate miRNA-target network identified was driven by mir-148a-5p, which was negatively correlated to the royalblue module. The mRNA genes within the royalblue mRNA module were enriched for genes involved in response to type I interferon and interferon-gamma-mediated signaling pathway. Type I interferon is secreted by the innate immune cells after detection of the pathogen, but also can act in the adaptive immune response by stimulating antibody production of B cells or intensifying the T-cells function (Reviewed by Ivashkiv and Donlin, 2014).
Understanding the role hygienic environments have on host gene expression is important in our understanding of the development of the immune system. The findings of this study indicate that early-life exposure of piglets to topsoil impacts both mRNA and miRNA expression in PBMCs, particularly genes and miRNA involved in the development of T cells and their ability to interact with antigen-presenting cells. Key regulatory genes identified include: PTPRJ, ITGB3, TRBV30, CD3D, mir-143, mir-29, and mir-148a. While these results need to be interpreted with caution as they represent only a snapshot in time across a small window of time from a subset of peripheral immune cells, these results support the current hygiene hypothesis in that less-hygienic environments during early life contribute to the development of the immune system. However, additional studies are needed to characterize how topsoil exposure may impact gene expression within the gut and impact gut phenotypes critical to animal health.
The RNA-Seq data set generated and analyzed during the current study is available in the NCBI’s Gene Expression Omnibus (GEO) under accession numbers GSE205321.
The animal study was reviewed and approved by the University of Arkansas Institute of Animal Care and Use Committee under protocol number 13060.
CM, TT, and MS developed and conducted the experiment. MD performed bioinformatics analysis, interpreted results, and drafted the initial manuscript with JK and DK. HB conducted sample quality check, read trimming and mapping to genome, differential expression analysis, and gene co-expression network analysis. DK and MD conducted statistical analyses. JK oversaw the bioinformatics and statistical analysis of the data. MS and TT conducted animal and wet-lab experiments and coordinated RNA-seq analyses. JZ and CM provided funding for the experiment and analyses. All authors read, reviewed, and contributed to the writing of the manuscript.
This research was supported by a grant from the Arkansas Biosciences Institute (ABI) and the USDA-NIFA project #2018-67015-27479.
The authors declare that the research was conducted in the absence of any commercial or financial relationships that could be construed as a potential conflict of interest.
All claims expressed in this article are solely those of the authors and do not necessarily represent those of their affiliated organizations, or those of the publisher, the editors, and the reviewers. Any product that may be evaluated in this article, or claim that may be made by its manufacturer, is not guaranteed or endorsed by the publisher.
The authors thank Tim Johnson for his assistance in sample collection and Dr. Joan Lunney for helpful comments and feedback regarding early drafts of the manuscript.
The Supplementary Material for this article can be found online at: https://www.frontiersin.org/articles/10.3389/fgene.2022.886875/full#supplementary-material
APC, antigen-presenting cell; BP, biological process; DE, differentially expressed; FDR, false discovery rate; GO, gene ontology; MM, module membership; PBMC, peripheral blood mononuclear cells; RNA-Seq, RNA sequencing; RQI, RNA quality score; TCR, T-cells receptor; TMM, Trimmed Mean of M-values; WGCNA, the Weighted Gene Co-expression Network Analysis.
Andrews, S., and Bioinformatics, Babraham (2010). FastQC: A Quality Control Tool for High Throughput Sequence Data. Manual http://www.bioinformatics.babraham.ac.uk/projects/.
Atarashi, K., Tanoue, T., Shima, T., Imaoka, A., Kuwahara, T., Momose, Y., et al. (2011). Induction of Colonic Regulatory T Cells by Indigenous Clostridium Species. Science 331, 337–341. doi:10.1126/science.1198469
Attaf, M., Huseby, E., and Sewell, A. K. (2015). Αβ T Cell Receptors as Predictors of Health and Disease. Cell. Mol. Immunol. 12, 391–399. doi:10.1038/cmi.2014.134
Bindea, G., Mlecnik, B., Hackl, H., Charoentong, P., Tosolini, M., Kirilovsky, A., et al. (2009). ClueGO: A Cytoscape Plug-In to Decipher Functionally Grouped Gene Ontology and Pathway Annotation Networks. Bioinformatics 25, 1091–1093. doi:10.1093/bioinformatics/btp101
Bullard, J. H., Purdom, E., Hansen, K. D., and Dudoit, S. (2010). Evaluation of Statistical Methods for Normalization and Differential Expression in mRNA-Seq Experiments. BMC Bioinforma. 11, 94. doi:10.1186/1471-2105-11-94
Cheng, J., Yuan, Y., Zhao, F., Chen, J., Chen, P., Li, Y., et al. (2021). Thymic T-Cell Production Is Associated with Changes in the Gut Microbiota in Young Chicks. Front. Immunol. 12, 700603. doi:10.3389/fimmu.2021.700603
Chi, H. (2012). Regulation and Function of mTOR Signalling in T Cell Fate Decisions. Nat. Rev. Immunol. 12, 325–338. doi:10.1038/nri3198
Dave, V. P., Cao, Z., Browne, C., Alarcon, B., Fernandez-Miguel, G., Lafaille, J., et al. (1997). CD3delta Deficiency Arrests Development of the Alpha Beta but Not the Gamma Delta T Cell Lineage. EMBO J. 16, 1360–1370. doi:10.1093/emboj/16.6.1360
Davis, M. M., McHEYZER-Williams,a, M., and Chien, Y.-H. (1995). T-cell Receptor V-Region Usage and Antigen Specificity. Ann. N. Y. Acad. Sci. 756, 1–11. doi:10.1111/j.1749-6632.1995.tb44477.x
DeWitt, W. S., Smith, A., Schoch, G., Hansen, J. A., Matsen, F. A., and Bradley, P. (2018). Human T Cell Receptor Occurrence Patterns Encode Immune History, Genetic Background, and Receptor Specificity. Elife 7, e38358. doi:10.7554/eLife.38358
Dobin, A., Davis, C. A., Schlesinger, F., Drenkow, J., Zaleski, C., Jha, S., et al. (2013). STAR: Ultrafast Universal RNA-Seq Aligner. Bioinformatics 29, 15–21. doi:10.1093/bioinformatics/bts635
Dourmad, J. Y., Hassouna, M., Robin, P., Guingand, N., Meunier-Salaün, M. C., and Lebret, B. (2009). Influence of Pig Rearing System on Animal Performance and Manure Composition. Animal 3, 606–616. doi:10.1017/S1751731108003601
Durinck, S., Spellman, P. T., Birney, E., and Huber, W. (2009). Mapping Identifiers for the Integration of Genomic Datasets with the R/Bioconductor Package biomaRt. Nat. Protoc. 4, 1184–1191. doi:10.1038/nprot.2009.97
Ennamorati, M., Vasudevan, C., Clerkin, K., Halvorsen, S., Verma, S., Ibrahim, S., et al. (2020). Intestinal Microbes Influence Development of Thymic Lymphocytes in Early Life. Proc. Natl. Acad. Sci. U.S.A. 117, 2570–2578. doi:10.1073/pnas.1915047117
Friedländer, M. R., Chen, W., Adamidi, C., Maaskola, J., Einspanier, R., Knespel, S., et al. (2008). Discovering microRNAs from Deep Sequencing Data Using miRDeep. Nat. Biotechnol. 26, 407–415. doi:10.1038/nbt1394
Garcillán, B., Fuentes, P., Marin, A. V., Megino, R. F., Chacon-Arguedas, D., Mazariegos, M. S., et al. (2021). CD3G or CD3D Knockdown in Mature, but Not Immature, T Lymphocytes Similarly Cripples the Human TCRαβ Complex. Front. Cell. Dev. Biol. 9, 608490. doi:10.3389/fcell.2021.608490
Gebert, L. F. R., and MacRae, I. J. (2019). Regulation of microRNA Function in Animals. Nat. Rev. Mol. Cell. Biol. 20, 21–37. doi:10.1038/s41580-018-0045-7
Gury-BenAri, M., Thaiss, C. A., Serafini, N., Winter, D. R., Giladi, A., Lara-Astiaso, D., et al. (2016). The Spectrum and Regulatory Landscape of Intestinal Innate Lymphoid Cells Are Shaped by the Microbiome. Cell. 166, 1231–1246. e13. doi:10.1016/j.cell.2016.07.043
Huang, C.-F., Chie, W.-C., and Wang, I.-J. (2021). Effect of Environmental Exposures on Allergen Sensitization and the Development of Childhood Allergic Diseases: A Large-Scale Population-Based Study. World Allergy Organ. J. 14, 100495. doi:10.1016/j.waojou.2020.100495
Iljazovic, A., Roy, U., Gálvez, E. J. C., Lesker, T. R., Zhao, B., Gronow, A., et al. (2021). Perturbation of the Gut Microbiome by Prevotella Spp. Enhances Host Susceptibility to Mucosal Inflammation. Mucosal Immunol. 14, 113–124. doi:10.1038/s41385-020-0296-4
Illi, S., von Mutius, E., Lau, S., Bergmann, R., Niggemann, B., Sommerfeld, C., et al. (2001). Early Childhood Infectious Diseases and the Development of Asthma up to School Age: A Birth Cohort Study. Br. Med. J. 322, 390–395. doi:10.1136/bmj.322.7283.390
Institute Inc, S. A. S. (2013). Base SAS®9.4 Procedures Guide. Stat. Proced. doi:10.1016/B978-0-444-59425-9.00014-7
Ivashkiv, L. B., and Donlin, L. T. (2014). Regulation of Type I Interferon Responses. Nat. Rev. Immunol. 14, 36–49. doi:10.1038/nri3581
Krueger, F. (2015). Trim Galore!: A Wrapper Tool Around Cutadapt and FastQC to Consistently Apply Quality and Adapter Trimming to FastQ Files. Babraham Inst. doi:10.1002/maco.200603986
Langfelder, P., and Horvath, S. (2008). WGCNA: An R Package for Weighted Correlation Network Analysis. BMC Bioinforma. 9, 559. doi:10.1186/1471-2105-9-559
Lebret, B., Prunier, A., Bonhomme, N., Foury, A., Mormède, P., and Dourmad, J. Y. (2011). Physiological Traits and Meat Quality of Pigs as Affected by Genotype and Housing System. Meat Sci. 88, 14–22. doi:10.1016/j.meatsci.2010.11.025
Liao, Y., Smyth, G. K., and Shi, W. (2014). FeatureCounts: An Efficient General Purpose Program for Assigning Sequence Reads to Genomic Features. Bioinformatics 30, 923–930. doi:10.1093/bioinformatics/btt656
Lin, J., Zhu, J. W., Baker, J. E., and Weiss, A. (2004). Regulated Expression of the Receptor-like Tyrosine Phosphatase CD148 on Hemopoietic Cells. J. Immunol. 173, 2324–2330. doi:10.4049/jimmunol.173.4.2324
Ma, F., Xu, S., Liu, X., Zhang, Q., Xu, X., Liu, M., et al. (2011). The microRNA miR-29 Controls Innate and Adaptive Immune Responses to Intracellular Bacterial Infection by Targeting Interferon-γ. Nat. Immunol. 12, 861–869. doi:10.1038/ni.2073
MacNeill, S. J., Sozanska, B., Danielewicz, H., Debinska, A., Kosmeda, A., Boznanski, A., et al. (2013). Asthma and Allergies: Is the Farming Environment (Still) Protective in Poland? the GABRIEL Advanced Studies. Allergy 68, 771–779. doi:10.1111/all.12141
Martín-Cófreces, N. B., and Sánchez-Madrid, F. (2018). Sailing to and Docking at the Immune Synapse: Role of Tubulin Dynamics and Molecular Motors. Front. Immunol. 9, 1174. doi:10.3389/fimmu.2018.01174
Martínez, V. G., Sacedón, R., Hidalgo, L., Valencia, J., Fernández-Sevilla, L. M., Hernández-López, C., et al. (2015). The BMP Pathway Participates in Human Naive CD4+ T Cell Activation and Homeostasis. PLoS One 10, e0131453. doi:10.1371/journal.pone.0131453
Masotti, A. (2012). Interplays between Gut Microbiota and Gene Expression Regulation by miRNAs. Front. Cell. Inf. Microbio. 2, 137. doi:10.3389/fcimb.2012.00137
Pattu, V., Qu, B., Schwarz, E. C., Strauß, B., Weins, L., Bhat, S. S., et al. (2012). SNARE Protein Expression and Localization in Human Cytotoxic T Lymphocytes. Eur. J. Immunol. 42, 470–475. doi:10.1002/eji.201141915
Revelle, W. (2018). Psych: Procedures for Personality and Psychological Research. Evanston, Illinois, USA: Northwestern University. Available at: https://CRAN.R-project.org/package=psych. Version = 1.8.10.
Robinson, M. D., McCarthy, D. J., and Smyth, G. K. (2009). edgeR: A Bioconductor Package for Differential Expression Analysis of Digital Gene Expression Data. Bioinformatics 26, 139–140. doi:10.1093/bioinformatics/btp616
Soares, H., Lasserre, R., and Alcover, A. (2013). Orchestrating Cytoskeleton and Intracellular Vesicle Traffic to Build Functional Immunological Synapses. Immunol. Rev. 256, 118–132. doi:10.1111/imr.12110
Storey, J., Bass, A., Dabney, A., and Robinson, D. (2019). Qvalue: Q-Value Estimation for False Discovery Rate Control. R package version 2.18.0. Available at: http://github.com/jdstorey/qvalue.
Strachan, D. P. (1989). Hay Fever, Hygiene, and Household Size. Bmj 299, 1259–1260. doi:10.1136/bmj.299.6710.1259
Su, L. F., Kidd, B. A., Han, A., Kotzin, J. J., and Davis, M. M. (2013). Virus-Specific CD4+ Memory-Phenotype T Cells Are Abundant in Unexposed Adults. Immunity 38, 373–383. doi:10.1016/j.immuni.2012.10.021
Tsai, T. C., Kim, H. J., Sales, M. A., Wang, X., Erf, G. F., Kegley, E. B., et al. (2016). 259 Effect of Rearing Strategies during Lactation on Growth Performance and the Population of Innate and Adaptive Immune Cells in Pigs from Pre-weaning to Market. J. Anim. Sci. 94, 122–123. doi:10.2527/msasas2016-259
Valitutti, S., Dessing, M., Aktories, K., Gallati, H., and Lanzavecchia, A. (1995). Sustained Signaling Leading to T Cell Activation Results from Prolonged T Cell Receptor Occupancy. Role of T Cell Actin Cytoskeleton. J. Exp. Med. 181, 577–584. doi:10.1084/jem.181.2.577
Vlachos, I. S., Zagganas, K., Paraskevopoulou, M. D., Georgakilas, G., Karagkouni, D., Vergoulis, T., et al. (2015). DIANA-miRPath v3.0: Deciphering microRNA Function with Experimental Support. Nucleic Acids Res. 43, W460–W466. doi:10.1093/nar/gkv403
Vo, N., Tsai, T. C., Maxwell, C., and Carbonero, F. (2017). Early Exposure to Agricultural Soil Accelerates the Maturation of the Early-Life Pig Gut Microbiota. Anaerobe 45, 31–39. doi:10.1016/j.anaerobe.2017.02.022
Wen, C., van Dixhoorn, I., Schokker, D., Woelders, H., Stockhofe-Zurwieden, N., Rebel, J. M. J., et al. (2021). Environmentally Enriched Housing Conditions Affect Pig Welfare, Immune System and Gut Microbiota in Early Life. Anim. Microbiome 3, 52. doi:10.1186/s42523-021-00115-2
Wenner, B. A., Zerby, H. N., Boler, D. D., Gebreyes, W. A., and Moeller, S. J. (2013). Effect of Mannan Oligosaccharides (Bio-Mos) and Outdoor Access Housing on Pig Growth, Feed Efficiency and Carcass Composition. J. Animal Sci. 91, 4936–4944. doi:10.2527/jas.2013-6582
Yuan, C., Burns, M. B., Subramanian, S., and Blekhman, R. (2018). Interaction between Host MicroRNAs and the Gut Microbiota in Colorectal Cancer. mSystems 3. doi:10.1128/msystems.00205-17
Zhang, T., Zhang, Z., Li, F., Ping, Y., Qin, G., Zhang, C., et al. (2018). miR-143 Regulates Memory T Cell Differentiation by Reprogramming T Cell Metabolism. J. I. 201, 2165–2175. doi:10.4049/jimmunol.1800230
Keywords: immune system, peripheral blood mononuclear cells, livestock, microbiota, RNA sequencing, hygiene hypothesis
Citation: De Souza MM, Koltes DA, Beiki H, Sales MA, Tsai T, Maxwell CV, Zhao J and Koltes JE (2022) Early-Life Exposure of Pigs to Topsoil Alters miRNA and mRNA Expression in Peripheral Blood Mononuclear Cells. Front. Genet. 13:886875. doi: 10.3389/fgene.2022.886875
Received: 01 March 2022; Accepted: 23 June 2022;
Published: 23 August 2022.
Edited by:
Eveline M. Ibeagha-Awemu, Agriculture and Agri-Food Canada, CanadaReviewed by:
Yaoyao Xia, South China Agricultural University, ChinaCopyright © 2022 De Souza, Koltes, Beiki, Sales, Tsai, Maxwell, Zhao and Koltes. This is an open-access article distributed under the terms of the Creative Commons Attribution License (CC BY). The use, distribution or reproduction in other forums is permitted, provided the original author(s) and the copyright owner(s) are credited and that the original publication in this journal is cited, in accordance with accepted academic practice. No use, distribution or reproduction is permitted which does not comply with these terms.
*Correspondence: J. E. Koltes, amVrb2x0ZXNAaWFzdGF0ZS5lZHU=
Disclaimer: All claims expressed in this article are solely those of the authors and do not necessarily represent those of their affiliated organizations, or those of the publisher, the editors and the reviewers. Any product that may be evaluated in this article or claim that may be made by its manufacturer is not guaranteed or endorsed by the publisher.
Research integrity at Frontiers
Learn more about the work of our research integrity team to safeguard the quality of each article we publish.