- 1School of Computer Science and Technology, Hangzhou Dianzi University, Hangzhou, China
- 2Shandong Provincial Hospital Affiliated to Shandong First Medical University, Jinan, China
- 3Computer School, Hubei University of Arts and Science, Xiangyang, China
- 4MyGenostics Inc., Beijing, China
Parasites can cause enormous damage to their hosts. Studies have shown that antiparasitic peptides can inhibit the growth and development of parasites and even kill them. Because traditional biological methods to determine the activity of antiparasitic peptides are time-consuming and costly, a method for large-scale prediction of antiparasitic peptides is urgently needed. We propose a computational approach called i2APP that can efficiently identify APPs using a two-step machine learning (ML) framework. First, in order to solve the imbalance of positive and negative samples in the training set, a random under sampling method is used to generate a balanced training data set. Then, the physical and chemical features and terminus-based features are extracted, and the first classification is performed by Light Gradient Boosting Machine (LGBM) and Support Vector Machine (SVM) to obtain 264-dimensional higher level features. These features are selected by Maximal Information Coefficient (MIC) and the features with the big MIC values are retained. Finally, the SVM algorithm is used for the second classification in the optimized feature space. Thus the prediction model i2APP is fully constructed. On independent datasets, the accuracy and AUC of i2APP are 0.913 and 0.935, respectively, which are better than the state-of-arts methods. The key idea of the proposed method is that multi-level features are extracted from peptide sequences and the higher-level features can distinguish well the APPs and non-APPs.
Introduction
Parasites are a very common source of disease. Parasitic diseases can affect almost all living things, including plants and mammals. The effects of parasitic diseases can range from mild discomfort to death (Momčilović et al., 2019). It is estimated that one billion people worldwide are infected with ascariasis, although it is usually harmless. Necator americanus and Ancylostoma duodenale can cause hookworm infections in humans, resulting in anemia, malnutrition, shortness of breath and weakness. This infection affects about 740 million people in the developing countries, including children and adults (Diemert et al., 2018). Malaria is very harmful to humans. It causes 300 to 500 million illnesses and about 2 million deaths each year, with about half of those deaths occurring in children under the age of 5 (Barber et al., 2017). The main method of treating parasitic diseases today is the use of antibiotics (Zahedifard and Rafati, 2018). However, frequent use of antibiotics can increase parasite resistance and even have some undetected side effects (Ertabaklar et al., 2020). Studies have found that anti-parasite peptide (APP) can effectively inhibit the growth of parasites and even kill them (Lacerda et al., 2016). Anti-parasite peptides are usually composed of 5–50 amino acids and are relatively short in length. They are usually changed by antimicrobial peptides (AMPs) (Mehta et al., 2014). APPs can kill parasites by destroying the cell membrane of the parasite or inhibiting the reductase in the parasite (Bell, 2011; Torrent et al., 2012). Therefore, it is very important to be able to identify APPs.
In the past few years, many methods for predicting functional peptides based on machine learning have been proposed, such as AAPred-CNN (Lin et al., 2022) for anti-angiogenic peptides, mAHTPred (Manavalan et al., 2019) for anti-hypertensive peptides, AVPIden (Pang et al., 2021) for anti-viral peptides. PredictFP2 can predict fusion peptide domains in all retroviruses (Wu et al., 2019). AMPfun (Chung et al., 2020) and PredAPP (Zhang et al., 2021) are proposed for antiparasitic peptides identifiction. Based on random forests, the AMPfun tool can be used to identify anticancer peptides, APP, and antiviral peptides. AMPfun can be used to characterize and identify antimicrobial peptides with different functional activities, but the prediction results for APPs are not very good. In 2021, (Zhang et al., 2021) proposed PredAPP, a model for predicting antiparasitic peptides using an under sampling and ensemble approach. A variety of data under sampling methods are proposed for data balance. This model adopts an ensemble approach, combining 9 feature groups and 6 machine learning algorithms, and finally achieves good results, but there is still room for improvement.
In this work, we propose a new model named i2APP for identifying APPs, which uses a two-stage machine learning framework. In the first stage, we extract dozens of feature groups for each peptide sequence, and then build the first-layer classifiers with these feature groups. The outputs of the first-layer classifiers are used as the higher-level features. What’s more, MIC (Kinney and Atwal, 2014; Ge et al., 2016) is used here to filter out the insignificant features. In the second stage, with the higher-level features, we build the second-layer classifier, whose outputs are the final results of identifying APPs. Through independent test, we will find that the proposed model is better than the state-of-arts methods in most metrics. The tool i2APP is available at https://github.com/greyspring/i2APP.
Materials and Methods
Datasets
A benchmark dataset is the premise for an effective and reliable model. To train our model and compare it with others, the dataset studied by (Zhang et al., 2021) were used in this work, in which 301 APPs were used as positive samples and 1909 non-APPs were negative ones. For the positive samples, 301 APPs were taken out as positive training samples, and the remaining 46 APPs were used as positive testing samples. 46 non-APPs were randomly selected from the negative samples as negative testing samples, and the remaining 1863 non-APPs were used as negative training samples. In this way, 255 APPs and 1863 non-APPs constituted the original training set, and 46 APPs and 46 non-APPs constituted the testing set. Since the samples in the training set are very unbalanced, we use random under sampling (Tahir et al., 2012; Stilianoudakis et al., 2021) on the training set and get 255 APPs and 255 non-APPs to constitute the final training set. For the sake of simplicity, the final training dataset is marked as T255p + 255n, and the testing dataset is marked as V46p + 46n.
We take out the 5 amino acids at the N-terminus and C-terminus of each peptide sequence to compare the differences between positive and negative samples by Two Sample Logo application (Schneider and Stephens, 1990; Crooks et al., 2004), which calculates and visualizes the differences between two sets of aligned samples of amino acids or nucleotides. At each position in the aligned groups of sequences, statistically significant amino acid symbols are plotted using the size of the symbol that is proportional to the difference between the two samples. It can be seen from the comparison in Figure 1 that the amino acid composition at both ends of the APPs and non-APPs sequences have some differences, so it can be considered to extract features from both ends of peptide sequence to distinguish the two types of samples.
Features Representation
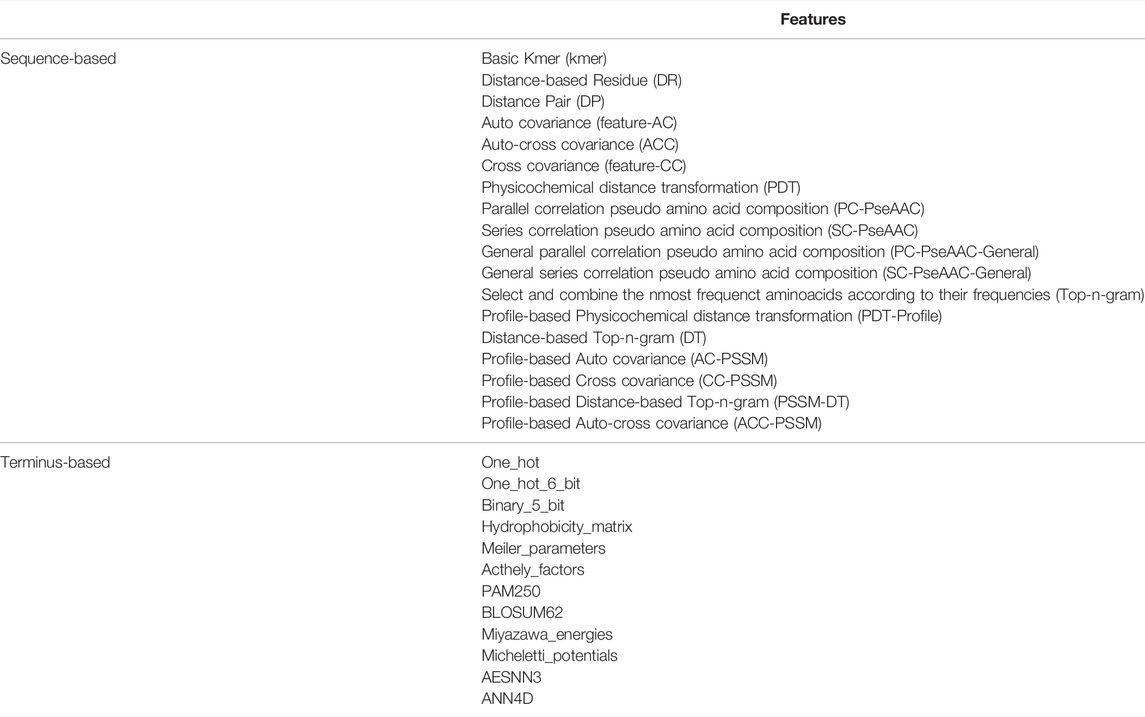
Good features are beneficial to the training of machine learning models and obtain good prediction performance. The classification of peptides mainly depends on the feature set constructed by the structural and functional properties. Extracting features from peptide sequences that effectively reflect their sequence pattern information is a challenging problem. In this study, we extract 18 kinds of physicochemical features from the peptide sequences, some of which contain very important information, such as functional domains, gene ontology and sequential evolution, etc (Liu et al., 2015; Liu et al., 2017). Thus 18 groups of sequence-based features will be obtained for each peptide sequence.
In addition, the N-terminus and C-terminus of a protein or peptide often have very important biological function, so we also extract features from the both ends of peptide sequence. In this study, we take out a fragment with three or five amino acids at the N-terminus or C-terminus of a peptide sequence, and use 12 types of feature extraction method for this fragment (Jing et al., 2019). In such a way, 48 groups of terminus-based features will be obtained for each peptide sequence.
All these feature extraction methods are listed in Table 1.
Computational Models
As shown in Figure 2, the overall framework of i2APP includes four main steps. As a first step, the benchmark datasets are collected from various databases and literates, and then divided into training dataset and testing dataset. To get a balanced training dataset, the random under sampling procedure is performed on the negative training samples. In the second step, we adopt 18 types of feature extraction methods on the whole peptide sequence to get 18 groups of sequence-based features, and 12 types of feature extraction methods on the N-terminus and C-terminus of peptide sequence. Considering that all peptide sequences are at least 5 residues in length, we take 3 and 5 residues at both ends of the sequence. So, a total of 48 groups of terminal-based features are extracted. For each feature group, SVM and LGBM are trained respectively, and 132 probability outputs are got for each peptide sequence. These probabilities can be seemed as higher-level features for further classification. What’s more, the probability greater than 0.5 is recorded as 1, and the probability less than 0.5 is recorded as 0. These binarized values help remove noise from the model. Stacking the probabilities and their binarized values, a total of 264 higher-level features are obtained. However, these higher-level features may have information redundancy, so a feature selection method is needed here to filter out the superfluous ones. In this study, the maximum information coefficient (MIC) is calculated for each feature, and the threshold is set to 0.4, that is, only the feature with the MIC value greater than 0.4 is retained. The third step is to use ten-fold cross-validation to select the best classifier based on the reduced higher-level feature set. The candidate include the popular classifiers, such as SVM, Bayes (Jahromi and Taheri, 2017), Decision Tree (DT) (Wang et al., 2019), K-Nearest Neighbor (KNN) (Wang et al., 2017), Random Forest (RF), Adaboost (Ada) and so on. In the fourth step, we test the effect of the proposed model on an independent test dataset, and compare its performance with other models. In this work, we used the scikit-learn package (Pedregosa et al., 2011) to implement all classifiers.
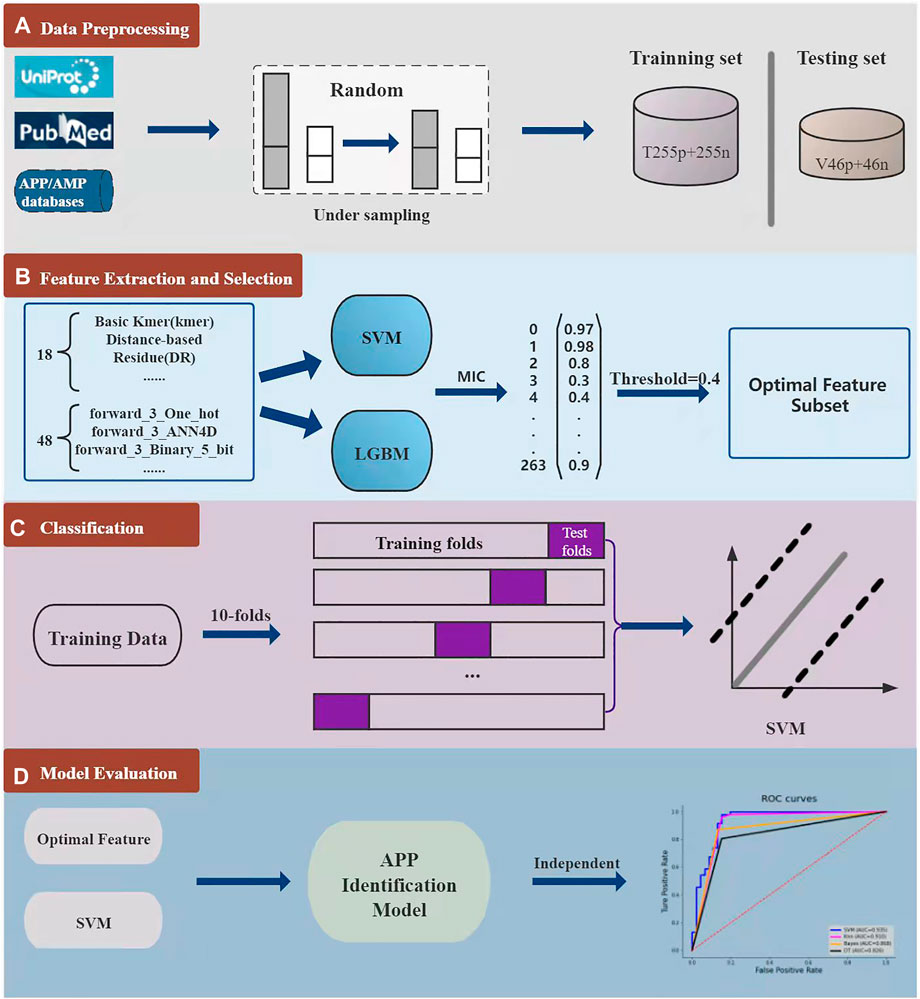
FIGURE 2. The whole model consists of four parts. The first part is the collection, division and down sampling of the dataset. The second part is feature extraction and feature selection for each peptide sequence. The third part is to analyze the effect of different classifiers through 10-fold cross-validation. In the fourth part, the proposed model is evaluated through independent test.
Evaluation
In order to evaluate the results of the final classification and facilitate comparison with other models, we used five commonly used indicators in bioinformatics research (Luo et al., 2019; Yang et al., 2021), including specificity (SP), sensitivity (SN), F1 score (F1), Matthew correlation coefficient (MCC) and accuracy (ACC). The specific calculation formula of these measured values is as follows:
Where TP means the number of APPs correctly predicted by the model; TN means the number of non-APPs that the model correctly predicts; FP means the number of non-APPs that the model mispredicts; FN means the number of APPs that the model mispredicts. In addition, we also use other metrics to evaluate the performance of i2APP, including receiver operating characteristic (ROC) curve (Fawcett, 2006), the area under the ROC curve (AUC) (Lobo et al., 2008), precision-recall (PR) curve (Davis and Goadrich, 2006), and the area under the PR curve (AUPR).
Results
Effects of Different Classifiers
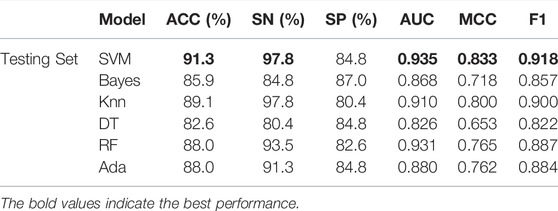
First, we fix the classifier of the second layer as SVM because it is very effective in small sample learning, and then compare the different classification models in the first layer. Through cross-validation experiments, it is found that the effects of SVM and LGBM are better, so we use these two classification models in the first layer. Now we can compare different classifiers in the second layer. As can be seen from Table 2, different classifiers are tested on the training dataset T255p + 255n through ten-fold cross-validation, and the final result is the average of ten evaluations. After parameter tuning, SVM is higher than other classifiers in most metrics, and reaches 90.0%, 0.952, 93.2%, 86.9%, 0.803, and 0.900% in ACC, AUC, SN, SP, MCC, and F1, respectively. Among all classifiers, ACC, AUC, SN, MCC, and F1 obtained by SVM achieved the first position. So we also focused on using SVM as a classifier for the independent test set.
As can be seen from Table 3, SVM has a huge advantage over other classifiers on the independent test set V46p + 46n. The values of ACC, AUC, SN, SP, MCC, and F1 are 91.3%, 0.935, 97.8%, 84.8%, 0.833, and 0.918%, respectively. The values of ACC, AUC, SN, MCC, and F1 obtained by SVM all rank first among all classifiers. Especially MCC and AUC by SVM is 0.033 and 0.025 higher than the second-ranked classifier. The comparison of these results shows that SVM is the most suitable classifier in our work.
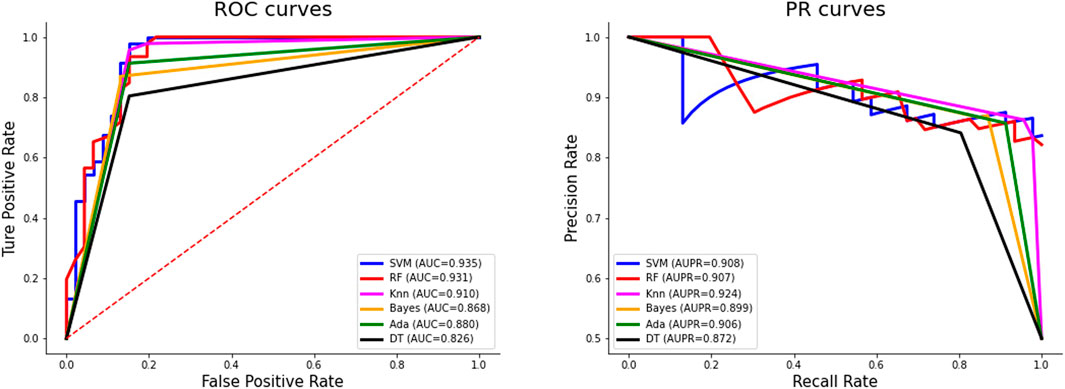
Figure 3 shows the ROC curves and PR curves of different classifiers on the independent test set. The ROC curve of SVM is closest to the upper left corner, surpassing other classifiers. The AUC value of SVM is 0.935, which is the highest and 0.025 higher than the second-ranked classifier KNN. Although the AUPR value of SVM is not the largest, when the recall rate is 1, the precision rate of SVM reaches 0.836, which is the highest.
Comparison With Other Methods
Our model is compared with others through ten-fold cross-validation on the training dataset, and the results are shown in Table 4. NM-BD and RUS-BD are both proposed in (Zhang et al., 2021), and the imbalanced training set was down sampled using NearMiss method (Mani and Zhang, 2003; Li et al., 2021) for the former, while the random under sampling method was used for the latter, which is also adopted in this study. Compared with RUS-BD, our model outperforms it on all metrics, with improvement of 1.8% on ACC, 0.7% on SN, 3% on SP, 1.8% on SP, 0.013 on F1, and 0.035 on MCC. When compared with NM-BD, our model is also the winner on nearly all metrics except SP. These results show that the performance of our model on the training set is better than the others on the whole.

TABLE 4. Comparison of our model with the existing methods through cross-validation on the training set.
To further verify the validity of the proposed model, we compare it with other models on an independent test dataset, and the results are shown in Table 5, from which we can see that the metrics of i2APP are nearly all better than that of other models. The values of ACC, SN, MCC and F1 are 17.4, 45.6, 0.302 and 0.251% higher than AMPfun, and the values of ACC, MCC, F1, and SP are 178 3.3, 0.107, 0.027, and 6.5% higher than PredAPP. All these results show that the proposed model has better generalization ability than the state-of-the-art models for APP prediction.

TABLE 5. Comparison of our model with the existing methods through independent test on the testing set.
Impact of Dataset Balancing
We performed 10-fold cross-validation on the original dataset containing 255 APPs and 1863 non-APPs, and the results were listed in Table 6. It can be found that compared with the balanced dataset, the SP, MCC and ACC metrics have a greater improvement on the unbalanced dataset. However, because there are too few positive samples, the SE metric decreases a lot. In addition, our model achieves large improvements in various metrics compared to the model PredAPP (IMBD) (Zhang et al., 2021) using the same unbalanced dataset.
With the unbalanced dataset as the training set, we tested the proposed model on the independent test set including 46 APPs and 46 non-APPs and listed the results in Table 7, from which we can see that whether using balanced or unbalanced training sets, i2APP has good generalization ability.

TABLE 7. The results of independent test using the balanced or unbalanced datasets as the training set.
Impact of Shuffled Sequence
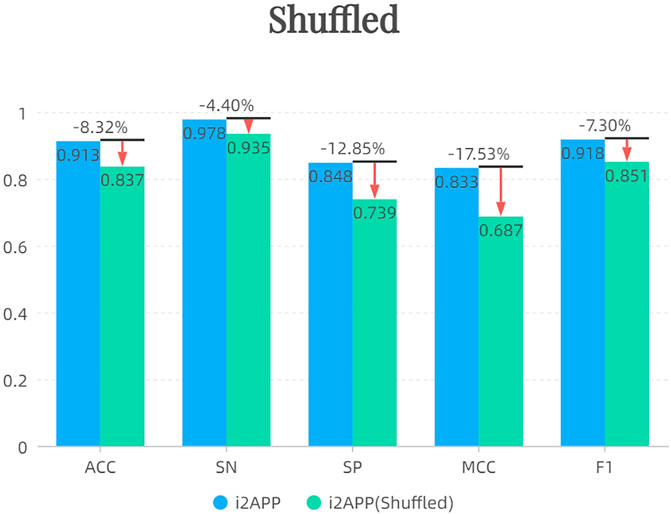
After shuffling the sequence of negative samples in the training set, we randomly sampled 255 new negative samples to form the training set together with 255 positive samples. The results of independent test are shown in Figure 4. It can be seen that the performance of the model decreases after using the shuffled negative samples, probably because the effect of the terminus-based features is reduced after the sequence is shuffled.
Interpretability Analysis
T-distributed stochastic neighbor embedding (t-SNE) (Van der Maaten and Hinton, 2008) is a very popular data visualization tool that can reduce high-dimensional data to 2-3 dimensions, so as to draw samples on a plane or 3D space and observe the sample distribution. Figure 5 shows the visualization results of the test dataset V46p + 46n after dimensionality reduction on the higher-level features, which are the outputs of the first layer classification. The orange points in the figure are APPs, and the blue points are non-APPs. As can be seen from the figure, the two types of samples can be well distinguished with the higher-level features, so that our model can achieve better performance. What’s more, it can be found that the aggregation degree of APPs is higher than that of non-APPs, indicating that it is easier to identify APPs than non-APPs, so the metric SN in our model will be higher than SP.
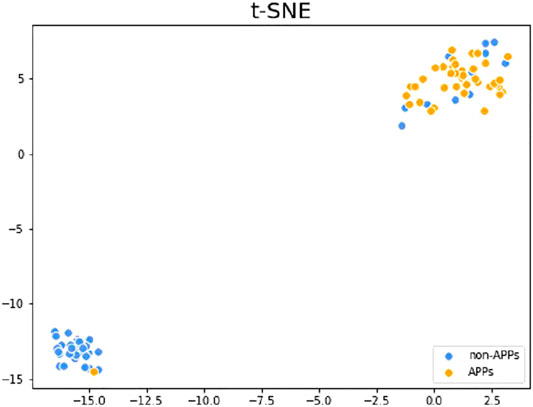
FIGURE 5. t-SNE visualization results of the testing set after dimensionality reduction of the higher-level features.
Conclusion
In this study, we propose a novel model named i2APP to identify APPs efficiently. The main structure of this work consists of four steps. Firstly, the random under sampling method is used to balance the training set. Secondly, a variety of sequence-based and terminus-based features are extracted from any peptide sequence, and then enter these raw features into the first layer classifiers, SVM and LGBM, to get the higher-level features. The maximum information coefficient (MIC) is calculated for each higher-level feature, and only the significant features are retained. Thirdly, based on the optimal feature subset, several popular classifiers are evaluated through cross-validation on the training dataset, and SVM is chosen as the second layer classifier. Finally, independent test is performed on the proposed model and the others, and we can see that i2APP has better generalization ability than the state-of-the-art models for APP prediction. The sequence features used in this paper are all extracted by hand, and some of them are quite complex. Although we simplify the model by two-step learning and feature selection, the overall model still looks complicated. In the future, as the amount of data increases, the RNN or Transformer model can be used for automatic feature learning, which may further improve the accuracy of APP recognition.
Data Availability Statement
Publicly available datasets were analyzed in this study. This data can be found here: https://github.com/greyspring/i2APP/tree/master/datasets.
Author Contributions
RG and PW designed the method and Supervised the whole project. MJ and YX developed the prediction models. RZ, GJ, YY, and JW analysed the data and results. RZ and JW participated in the design, helped in writing the manuscript. All authors have read and approved the revised manuscript.
Funding
This work has been supported by the Zhejiang Provincial Natural Science Foundation of China (No. LY21F020017, 2022C03043), the National key research and development program of China (No. 2019YFC0118404, 2019YFC0118403), Joint Funds of the Zhejiang Provincial Natural Science Foundation of China (U20A20386), National Natural Science Foundation of China (No. 61702146).
Conflict of Interest
Author JW is employed by MyGenostics Inc. The remaining authors declare that the research was conducted in the absence of any commercial or financial relationships that could be construed as a potential conflict of interest.
Publisher’s Note
All claims expressed in this article are solely those of the authors and do not necessarily represent those of their affiliated organizations, or those of the publisher, the editors and the reviewers. Any product that may be evaluated in this article, or claim that may be made by its manufacturer, is not guaranteed or endorsed by the publisher.
References
Barber, B. E., Rajahram, G. S., Grigg, M. J., William, T., and Anstey, N. M. (2017). World Malaria Report: Time to Acknowledge Plasmodium Knowlesi Malaria. Malar. J. 16 (1), 135. doi:10.1186/s12936-017-1787-y
Bell, A. (2011). Antimalarial Peptides: the Long and the Short of it. Cpd 17 (25), 2719–2731. doi:10.2174/138161211797416057
Chung, C.-R., Kuo, T.-R., Wu, L.-C., Lee, T.-Y., and Horng, J.-T. (2020). Characterization and Identification of Antimicrobial Peptides with Different Functional Activities. Brief. Bioinformatics 21 (3), 1098–1114. doi:10.1093/bib/bbz043
Crooks, G. E., Hon, G., Chandonia, J.-M., and Brenner, S. E. (2004). WebLogo: A Sequence Logo Generator: Figure 1. Genome Res. 14 (6), 1188–1190. doi:10.1101/gr.849004
Davis, J., and Goadrich, M. (2006). “The Relationship between Precision-Recall and ROC Curves,” in Proceedings of the 23rd International Conference on Machine Learning. Pittsburgh, PA: Association for Computing Machinery, 233–240.
Diemert, D., Campbell, D., Brelsford, J., Leasure, C., Li, G., Peng, J., et al. (2018). “Controlled Human Hookworm Infection: Accelerating Human Hookworm Vaccine Development,” in Open Forum Infectious Diseases 5 (5). doi:10.1093/ofid/ofy083
Ertabaklar, H., Malatyali, E., Malatyali, E., and Ertug, S. (2020). Drug Resistance in Parasitic Diseases. Eur. J. Ther. 26, 1–5. doi:10.5152/eurjther.2019.18075
Fawcett, T. (2006). An Introduction to ROC Analysis. Pattern recognition Lett. 27 (8), 861–874. doi:10.1016/j.patrec.2005.10.010
Ge, R., Zhou, M., Luo, Y., Meng, Q., Mai, G., Ma, D., et al. (2016). McTwo: a Two-step Feature Selection Algorithm Based on Maximal Information Coefficient. BMC bioinformatics 17 (1), 142. doi:10.1186/s12859-016-0990-0
Jahromi, A. H., and Taheri, M. (2017). “A Non-parametric Mixture of Gaussian Naive Bayes Classifiers Based on Local Independent Features,” in Artificial Intelligence and Signal Processing Conference (Shiraz, Iran: AISP IEEE), 209–212. doi:10.1109/aisp.2017.8324083
Jing, X., Dong, Q., Hong, D., and Lu, R. (2019). Amino Acid Encoding Methods for Protein Sequences: a Comprehensive Review and Assessment. Ieee/acm Trans. Comput. Biol. Bioinform 17 (6), 1918–1931. doi:10.1109/TCBB.2019.2911677
Kinney, J. B., and Atwal, G. S. (2014). Equitability, Mutual Information, and the Maximal Information Coefficient. Proc. Natl. Acad. Sci. U.S.A. 111 (9), 3354–3359. doi:10.1073/pnas.1309933111
Lacerda, A. F., Pelegrini, P. B., de Oliveira, D. M., Vasconcelos, É. A. R., and Grossi-de-Sá, M. F. (2016). Anti-parasitic Peptides from Arthropods and Their Application in Drug Therapy. Front. Microbiol. 7, 91. doi:10.3389/fmicb.2016.00091
Li, M., Wu, Z., Wang, W., Lu, K., Zhang, J., Zhou, Y., et al. (2021). Protein-Protein Interaction Sites Prediction Based on an Under-Sampling Strategy and Random Forest Algorithm. IEEE/ACM Trans. Comput. Biol. Bioinformatics, 1–1. doi:10.1109/tcbb.2021.3123269
Lin, C., Wang, L., and Shi, L. (2022). AAPred-CNN: Accurate Predictor Based on Deep Convolution Neural Network for Identification of Anti-angiogenic Peptides. Methods. doi:10.1016/j.ymeth.2022.01.004
Liu, B., Liu, F., Wang, X., Chen, J., Fang, L., and Chou, K.-C. (2015). Pse-in-One: a Web Server for Generating Various Modes of Pseudo Components of DNA, RNA, and Protein Sequences. Nucleic Acids Res. 43 (W1), W65–W71. doi:10.1093/nar/gkv458
Liu, B., Wu, H., and Chou, K.-C. (2017). Pse-in-One 2.0: an Improved Package of Web Servers for Generating Various Modes of Pseudo Components of DNA, RNA, and Protein Sequences. Ns 09 (04), 67–91. doi:10.4236/ns.2017.94007
Lobo, J. M., Jiménez-Valverde, A., and Real, R. (2008). AUC: a Misleading Measure of the Performance of Predictive Distribution Models. Glob. Ecol Biogeogr. 17 (2), 145–151. doi:10.1111/j.1466-8238.2007.00358.x
Luo, F., Wang, M., Liu, Y., Zhao, X.-M., and Li, A. (2019). DeepPhos: Prediction of Protein Phosphorylation Sites with Deep Learning. Bioinformatics 35 (16), 2766–2773. doi:10.1093/bioinformatics/bty1051
Manavalan, B., Basith, S., Shin, T. H., Wei, L., and Lee, G. (2019). mAHTPred: a Sequence-Based Meta-Predictor for Improving the Prediction of Anti-hypertensive Peptides Using Effective Feature Representation. Bioinformatics 35 (16), 2757–2765. doi:10.1093/bioinformatics/bty1047
Mani, I., and Zhang, I. (2003). “kNN Approach to Unbalanced Data Distributions: a Case Study Involving Information Extraction,” in Proceedings of Workshop on Learning from Imbalanced Datasets. Washington, DC: ICML, 1–7.
Mehta, D., Anand, P., Kumar, V., Joshi, A., Mathur, D., Singh, S., et al. (2014). ParaPep: a Web Resource for Experimentally Validated Antiparasitic Peptide Sequences and Their Structures. Database 2014, bau051. doi:10.1093/database/bau051
Momčilović, S., Cantacessi, C., Arsić-Arsenijević, V., Otranto, D., and Tasić-Otašević, S. (2019). Rapid Diagnosis of Parasitic Diseases: Current Scenario and Future Needs. Clin. Microbiol. Infect. 25 (3), 290–309. doi:10.1016/j.cmi.2018.04.028
Pang, Y., Yao, L., Jhong, J. H., Wang, Z., and Lee, T. Y. (2021). AVPIden: a New Scheme for Identification and Functional Prediction of Antiviral Peptides Based on Machine Learning Approaches. Brief Bioinform 22 (6), bbab263. doi:10.1093/bib/bbab263
Pedregosa, F., Varoquaux, G., Gramfort, A., Michel, V., Thirion, B., Grisel, O., et al. (2011). Scikit-learn: Machine Learning in Python. J. machine Learn. Res. 12, 2825–2830. doi:10.48550/arXiv.1201.0490
Schneider, T. D., and Stephens, R. M. (1990). Sequence Logos: a New Way to Display Consensus Sequences. Nucl. Acids Res. 18 (20), 6097–6100. doi:10.1093/nar/18.20.6097
Stilianoudakis, S. C., Marshall, M. A., and Dozmorov, M. G. (2021). preciseTAD: a Transfer Learning Framework for 3D Domain Boundary Prediction at Base-Pair Resolution. Bioinformatics 38 (3), 621–630. doi:10.1093/bioinformatics/btab743
Tahir, M. A., Kittler, J., and Yan, F. (2012). Inverse Random under Sampling for Class Imbalance Problem and its Application to Multi-Label Classification. Pattern Recognition 45 (10), 3738–3750. doi:10.1016/j.patcog.2012.03.014
Torrent, M., Pulido, D., Rivas, L., and Andreu, D. (2012). Antimicrobial Peptide Action on Parasites. Cdt 13 (9), 1138–1147. doi:10.2174/138945012802002393
Van der Maaten, L., and Hinton, G. (2008). Visualizing Data Using T-SNE. J. machine Learn. Res. 9 (86), 2579–2605.
Wang, G., Li, X., and Wang, Z. (2016). APD3: the Antimicrobial Peptide Database as a Tool for Research and Education. Nucleic Acids Res. 44 (D1), D1087–D1093. doi:10.1093/nar/gkv1278
Wang, J., Yang, B., An, Y., Marquez-Lago, T., Leier, A., Wilksch, J., et al. (2017). Systematic Analysis and Prediction of Type IV Secreted Effector Proteins by Machine Learning Approaches. Brief. Bioinform. 20 (3), 931–951. doi:10.1093/bib/bbx164
Wang, P.-H., Tu, Y.-S., and Tseng, Y. J. (2019). PgpRules: a Decision Tree Based Prediction Server for P-Glycoprotein Substrates and Inhibitors. Bioinformatics 35 (20), 4193–4195. doi:10.1093/bioinformatics/btz213
Wu, S., Wu, X., Tian, J., Zhou, X., and Huang, L. (2019). PredictFP2: a New Computational Model to Predict Fusion Peptide Domain in All Retroviruses. Ieee/acm Trans. Comput. Biol. Bioinform 17 (5), 1714–1720. doi:10.1109/TCBB.2019.2898943
Yang, H., Wang, M., Liu, X., Zhao, X.-M., and Li, A. (2021). PhosIDN: an Integrated Deep Neural Network for Improving Protein Phosphorylation Site Prediction by Combining Sequence and Protein-Protein Interaction Information. Bioinformatics 37 (24), 4668–4676. doi:10.1093/bioinformatics/btab551
Zahedifard, F., and Rafati, S. (2018). Prospects for Antimicrobial Peptide-Based Immunotherapy Approaches in Leishmania Control. Expert Rev. anti-infective Ther. 16 (6), 461–469. doi:10.1080/14787210.2018.1483720
Keywords: antiparasitic peptides, feature representation, maximum information coefficient, feature selection, T-distributed stochastic neighbor embedding
Citation: Jiang M, Zhang R, Xia Y, Jia G, Yin Y, Wang P, Wu J and Ge R (2022) i2APP: A Two-Step Machine Learning Framework For Antiparasitic Peptides Identification. Front. Genet. 13:884589. doi: 10.3389/fgene.2022.884589
Received: 26 February 2022; Accepted: 11 April 2022;
Published: 27 April 2022.
Edited by:
Alfredo Pulvirenti, University of Catania, ItalyReviewed by:
Leyi Wei, Shandong University, ChinaPiyush Agrawal, National Cancer Institute (NIH), United States
Copyright © 2022 Jiang, Zhang, Xia, Jia, Yin, Wang, Wu and Ge. This is an open-access article distributed under the terms of the Creative Commons Attribution License (CC BY). The use, distribution or reproduction in other forums is permitted, provided the original author(s) and the copyright owner(s) are credited and that the original publication in this journal is cited, in accordance with accepted academic practice. No use, distribution or reproduction is permitted which does not comply with these terms.
*Correspondence: Pu Wang, bnl3YW5ncHVAeWVhaC5uZXQ=; Jian Wu, ancyMjMxQG15Z2Vuby5jbg==; Ruiquan Ge, Z2VzcHJpbmdAaGR1LmVkdS5jbg==
†These authors have Co-first authors
 Minchao Jiang
 Renfeng Zhang
 Yixiao Xia
 Gangyong Jia
 Yuyu Yin
 Pu Wang
 Jian Wu
 Ruiquan Ge
