 Haniel C. Oliveira1†
 Martijn F. L. Derks2,3*†
 Marcos S. Lopes2,4
 Ole Madsen3
 Barbara Harlizius2
 Maren van Son5
 Eli H. Grindflek5Marta Gòdia3Arne B. Gjuvsland5
 Pamela Itajara Otto6
 Martien A. M. Groenen3Simone E. F. Guimaraes1
- 1Department of Animal Science, Universidade Federal de Viçosa, Viçosa, Brazil
- 2Topigs Norsvin Research Center, Beuningen, Netherlands
- 3Animal Breeding and Genomics, Wageningen University & Research, Wageningen, Netherlands
- 4Topigs Norsvin, Curitiba, Brazil
- 5Norsvin SA, Hamar, Norway
- 6Department of Animal Science, Universidade Federal de Santa Maria, Santa Maria, Brazil
Backfat is an important trait in pork production, and it has been included in the breeding objectives of genetic companies for decades. Although adipose tissue is a good energy storage, excessive fat results in reduced efficiency and economical losses. A large QTL for backfat thickness on chromosome 5 is still segregating in different commercial pig breeds. We fine mapped this QTL region using a genome-wide association analysis (GWAS) with 133,358 genotyped animals from five commercial populations (Landrace, Pietrain, Large White, Synthetic, and Duroc) imputed to the porcine 660K SNP chip. The lead SNP was located at 5:66103958 (G/A) within the third intron of the CCND2 gene, with the G allele associated with more backfat, while the A allele is associated with less backfat. We further phased the QTL region to discover a core haplotype of five SNPs associated with low backfat across three breeds. Linkage disequilibrium analysis using whole-genome sequence data revealed three candidate causal variants within intronic regions and downstream of the CCND2 gene, including the lead SNP. We evaluated the association of the lead SNP with the expression of the genes in the QTL region (including CCND2) in a large cohort of 100 crossbred samples, sequenced in four different tissues (lung, spleen, liver, muscle). Results show that the A allele increases the expression of CCND2 in an additive way in three out of four tissues. Our findings indicate that the causal variant for this QTL region is a regulatory variant within the third intron of the CCND2 gene affecting the expression of CCND2.
Introduction
Backfat (BF) is an important trait in pork production included in the breeding objectives of genetic companies for decades (Merks, 2000). Pig commercial lines have been selected for efficient meat production selecting for growth and leanness traits and thereby reducing backfat. However, a strong selection for decreased backfat also decreases other fat-related traits such as intra-muscular fat, which is highly valuable for meat quality (Lonergan et al., 2001; Fontanesi et al., 2012; Chen et al., 2014).
Adipose tissue has an important role as the storage of energy (Wang et al., 2016), however, excessive fat may cause economic implications in pig breeding affecting growth, feed efficiency, and meat quality (Lonergan et al., 2001). Furthermore, fat and fatty acids contribute significantly to the quality and nutritional content of the meat (Wood et al., 2008). The amounts of saturated fatty acids (SFA), monounsaturated fatty acids (MUFA) and polyunsaturated fatty acids (PUFA) are important for the meat processing industry.
Hence, to better understand quantitative traits such as backfat, further insight in the genetic basis of these traits is required. The development of commercial SNP chips has enabled genome-wide association studies (GWAS) to efficiently map regions throughout the genome affecting fat-related traits (Fontanesi et al., 2012; Fowler et al., 2013; Okumura et al., 2013; Do et al., 2014; Gozalo-Marcilla et al., 2021). While GWAS identify significant marker associations, the current commercial SNP chip density often leads to clusters of markers (due to extended linkage disequilibrium) covering a region that is still too large to allow accurate identification of the responsible gene(s) or variant(s). Hence, the need for further fine mapping is required to find causative relations between gene(s) or variants that affect economically-important traits such as backfat. The detection and integration of expression quantitative trait loci (eQTLs) can facilitate further fine mapping of QTL regions to study the genetic architecture of complex traits. The eQTL analysis allows to identify variation associated with changes in gene expression that underly the phenotypic differences observed in complex traits.
One region on chromosome 5 (66 Mb) has shown strong association with backfat in a wide range of populations. Gozalo-Marcilla et al. 2021 proposed the FGF23 gene as likely causal given the association with phosphate homeostasis. In this study, we investigate the same QTL region on chromosome 5 with strong association with backfat across four commercial pig populations. Further, we aimed to fine map this QTL region to identify causative mutation(s) related to backfat and to better understand the biology of this trait. We concluded that the causative variant of this QTL region is a regulatory SNP in the third intron of the CCND2 gene.
Material and Methods
Phenotypic Data
The data consisted of five commercial pig populations; Synthetic (Large-White based), Pietrain, Landrace, Large-White and Duroc (Table 1), obtained from herds owned by Topigs Norsvin. The phenotypic data was composed by backfat records, measured at the end of the test period (average live weight of 120 kg) in each evaluated population. The data were classified in two datasets: PHENOTYPED, which consisted of all phenotyped animals and their contemporary’s animals; and GENOTYPED, which is a subset of phenotyped animals with genotypes and phenotypes (Table 1).
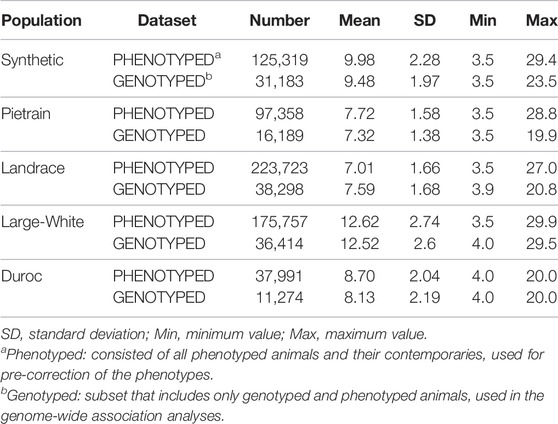
TABLE 1. Summary statistics of the backfat (millimeters) per datasets and per evaluated population.
Using PHENOTYPED dataset, phenotypes were pre-corrected for all non-genetic effects to use as response variable in further analysis. For that, the non-genetic effects were estimated within population using the following animal linear model in ASReml v3.0 (Gilmour et al., 2009):
where
Genotyping and Quality Control
In total, 134,887 animals were genotyped across the different populations and SNP chip densities (Table 2). The GENOTYPED dataset includes animals genotyped using different Illumina’s medium density SNP chips (50, 60 and 80K), as well as animals genotyped with the high-density Axiom™ Porcine Genotyping Array 660K (Thermo Fisher Scientific, Waltham, Massachusetts, United States) (Table 2).
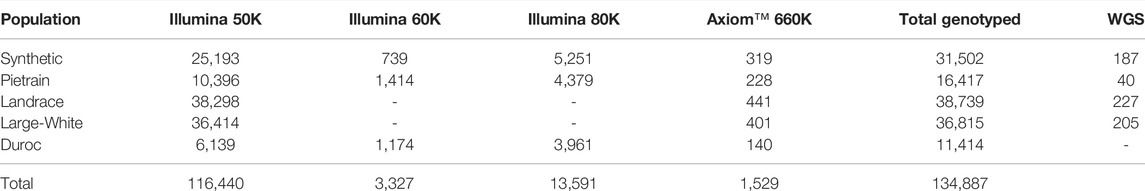
TABLE 2. Number of genotyped and sequenced animals available with backfat measurements per population and per SNP chip.
Genotype quality control analysis was performed within population and SNP chip to exclude SNPs with genotype call rate <0.95, minor allele frequency <0.01, strong deviation from Hardy-Weinberg equilibrium p-value < 1 × 10-12, SNPs located on sex chromosomes and unmapped SNPs. The positions of the SNPs are based on the Sscrofa11.1 assembly of the reference genome (Warr et al., 2020a). All genotyped animals had a frequency of missing genotypes <0.05 and were therefore all kept for further analyses.
After the quality control, the medium density genotypes were imputed towards the high density genotypes within population using Fimpute v2.2 (Sargolzaei et al., 2014). After imputation, a total of 31,183; 16,189; 38,298; 36,414 and 11,274 animals and 488,585, 504,525, 443,619, 518,659 and 417,532 SNPs were available for the Synthetic, Pietrain, Landrace, Large-White and Duroc populations, respectively, and used for the GWAS.
Genome-Wide Association Analysis
A single-SNP GWAS was performed with the imputed GENOTYPED dataset for each population using the following linear animal model in GCTA software (Yang et al., 2011, 2014):
where
The proportion of phenotypic variance explained by a SNP was defined as
Fine-Mapping
To search for possible causal mutations at the chromosome 5 backfat locus, fine mapping analyses using high-throughput sequencing (WGS, ChIP-Seq, ATAC-Seq and RNA-Seq data) was performed using following steps: (1) building and calculation of haplotype frequencies; (2) sequence data processing and evaluation of variants within the haplotype region; (3) evaluation of protein interactions and gene expression.
Haplotype Analysis
From the GWAS results, the most significant SNP (lead SNP) was identified. Subsequently we performed a haplotype analysis up-and downstream of the lead SNP. For that, firstly the Beagle v5.1 software (Browning et al., 2018) was used to phase the imputed genotypes taking 0.5 Mb downstream and 0.5 Mb upstream of the lead SNP (SSC5:66,103,958bp) in the QTL region SSC5:66 ± 0.5 Mb. The lead SNP and the 40 markers with closest vicinity of the lead SNP (20 markers on each side) were selected and used in the HaploPi pipeline (Oliveira, 2019) to build and calculate the haplotype frequencies. After performing the haplotype analyses, the core haplotype (SSC5: 66094630-66140348) was used to perform a haplotype-based association analysis using the number of copies of the core haplotype. For that, the same mixed-model described for the single-SNP GWAS (model 2) was used, in which the SNP genotypes were replaced by the genotype of the core haplotype (0, 1 or 2).
Sequence Data
Whole-genome sequence (WGS) data was used to access the complete set of variants within the haplotype region (SSC5:66094630-66140348). For this purpose, 659 animals (Synthetic = 187; Pietrain = 40; Landrace = 227; Large White = 205) were available (Table 2). Genomic DNA from ear biopsies was extracted using BioSprint DNA Kit (Qiagen) and its concentration and quality was measured using NanoDrop ND-1000 spectrophotometer (Thermo Fisher Scientific). The data was sequenced on Illumina Hiseq 2000 150 bp paired-end reads. The reads were aligned to the Sscrofa11.1 (Warr et al., 2020b) using BWA-MEM v0.7.15 (Li and Durbin, 2009) with an average mappability of 96.51% and a sample coverage ranging from 6.6–22.7X (∼10X average). SAMtools v1.9 dedup function was used to remove PCR duplicates (Li et al., 2009). Variant calling was performed with Freebayes v1.1.0 with following settings: min-base-quality 10, min-alternate-fraction 0.2, haplotype-length 0 and min-alternate-count 2 (Garrison and Marth, 2012). Variants with Phred quality score <20, and within 3 bp of an indel were discarded (Li et al., 2009). Variants were annotated using the Ensembl variant effect predictor (VEP, release 99) (McLaren et al., 2016). The impact of missense variants was predicted using the SIFT tool v6.2.1 (Kumar et al., 2009).
ChIP-Seq and ATAC-Seq Analysis
Chromatin immunoprecipitation–coupled sequencing (ChIP-Seq) marked by trimethylated histone H3 lysine 4 (H3K4me3), mono-methylation histone H3 lysine 4 (H3K4me1) and acetylated histone 3 lysine 27(H3K27ac) and ATAC-Seq data were downloaded from the European Nucleotide Archive (ENA) with accession numbers PRJEB28147 (ChIP-Seq - brain, liver, muscle and testis), and PRJNA665194 (ATAC-Seq – adipose, cerebellum, cerebral cortex, hypothalamus, liver, lung, skeletal muscle and spleen). ChIP-Seq marks and ATAC-Seq data were aligned against the pig reference genome (Sscrofa 11.1) using BWA-mem v. 0.7.17 (Li, 2013), pre-processed using SAMtools v. 1.13 (Li and Durbin, 2009) and broad and narrow peaks calling was performed on MACS v2.2.6 (Zhang et al., 2008) (parameters used for mapping, pre-processing and peak calling can be found in Supplementary Material S1.
RNA-Sequencing in Crossbred Animals in Four Tissues for eQTL Analysis
Four different tissues: liver, spleen, lung and muscle were subjected to RNA extraction from 100 animals. The animals were F2 crosses resulting from a F1 sow (Landrace*LargeWhite) and a Synthetic boar line. The collected tissue was stored with RNAlater (Thermo Fisher Scientific) at -80°C until further use. RNA was extracted from the 400 samples using the QIAshredder homogenizer kit (Qiagen) and RNA extraction was performed with the Rneasy kit (Qiagen) following manufacture’s guidelines. Once all the samples passed the required quality control parameters, they were sequenced at 150 bp paired-end in an Illumina 6000 sequencing platform. DNA from 87 of these animals was also extracted from the spleen tissue and was subjected to high density genotyping with the Axiom™ Porcine Genotyping Array (Thermo Fisher Scientific) that queries 660K variant markers.
For the bioinformatic analysis, RNA-Seq reads were trimmed using Trim Galore v0.3.7 (https://www.bioinformatics.babraham.ac.uk/projects/trim_galore/). We mapped the RNA-seq data to the Sscrofa11.1 reference genome and Ensembl version 104 using STAR v2.7.8 (Dobin et al., 2013). Alignments with an alignment MAPQ score <30 were filtered using SAMtools v0.1.19 (Li and Durbin, 2009). Gene counts were determined using htseq-count v0.11.1, and then TMM-normalized as counts per million (CPM) with EdgeR (Robinson et al., 2009). Plotting of expression levels per genotype class was performed using the seaborn python package (Waskom, 2021). For the eQTL analysis, genotypes were firstly filtered as in (Derks et al., 2021) with plink v.1.9 (Purcell et al., 2007). Only genes ±1 Mbp from the target lead SNP of interest were used for the analysis. The single-SNP association analysis was carried for each of the tissues with the GCTA v1.25.3 software (Yang et al., 2011) with the following model:
where (
Results
The heritability, defined as the proportion of the total phenotypic variance explained by additive genetic variance, for backfat ranged from 0.42 to 0.54 among the five evaluated pig populations: Synthetic (0.54 ± 0.01), Pietrain (0.50 ± 0.01), Landrace (0.42 ± 0.01), Large White (0.52 ± 0.01) and Duroc (0.43 ± 0.01) (Table 3).
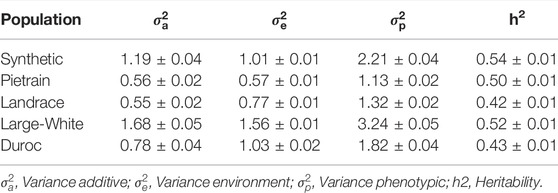
TABLE 3. Summary of the genetic parameters for backfat evaluated in five pig populations.
Genome-Wide Association Study
In this study, the use of large-scale genotype data allowed us to identify a A/G SNP (rs80985094: 5:66,103,958) on SSC5 with a strong association with backfat across populations. This SNP showed significant association with backfat in four (Synthetic, Pietrain, Landrace and Large White) out of the five evaluated pig populations (Figure 1). The association between rs80985094 and backfat was not identified in the Duroc population because the G allele, associated with increased backfat is fixed.
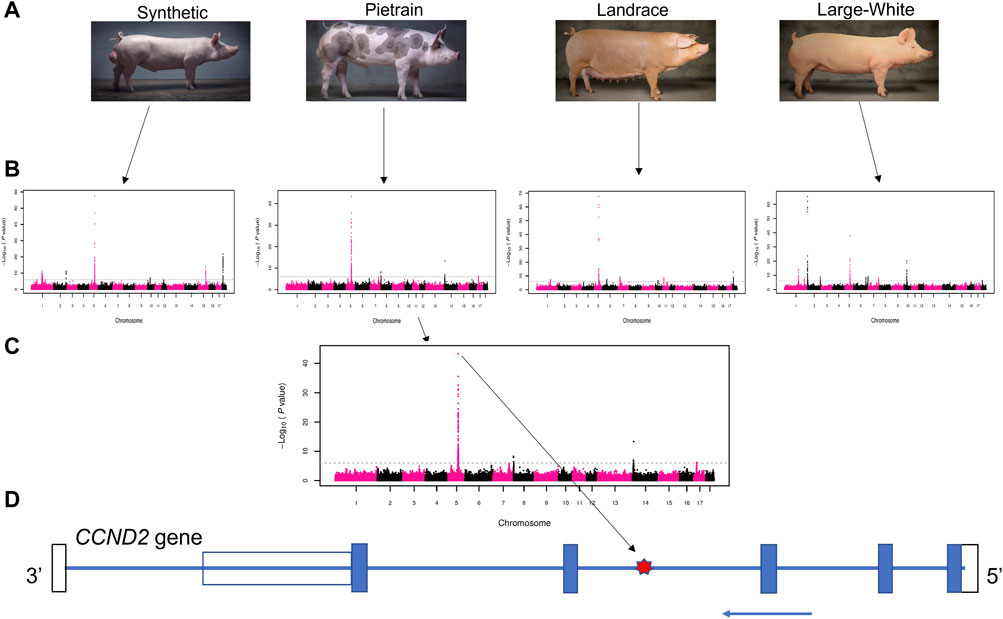
FIGURE 1. Schematic representation of the GWAS results. (A) Four pig populations that presented the significant overlapping GWAS peaks on chromosome 5: Synthetic (Large-White based), Pietrain, Landrace and Large-White. (B) GWAS results for backfat in four populations. (C) Manhattan plot showing the most significant SNP (lead SNP - rs80985094) in the Pietrain population. (D) CCND2 gene model. The location of the lead SNP in the third intron is indicated with a red star. The blue arrow indicates the coding strand, blue boxes depict exons, the open bars the untranslated regions.
The most significant SNP (rs80985094) showed a -log10 (p-value) of 57.67, 43.29, 67.61 and 37.91 in the Synthetic, Pietrain, Landrace and Large-White population, respectively. The lead SNP, located at 66,103,958 bp on SSC5, explains up to 6% of the genetic variance in backfat (Table 4). Among the four populations which showed significant association between the lead SNP and backfat, the frequency of the allele associated with increased backfat (G) is the highest in Large-White population (0.79). In the other populations, the G allele is the minor allele (Table 4).
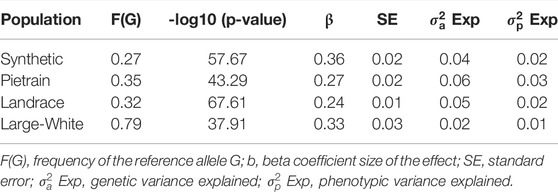
TABLE 4. Description of the lead SNP (rs80985094) for backfat for each population.
Haplotype Analysis
We phased the genotypes using Beagle 5.1 (Browning and Browning, 2007) and selected the most frequent haplotypes either wich contains the A and G allele in the four populations. Based on the haplotype analyses, we identified a core haplotype with four SNPs surrounding the lead SNP (GCAAG) present in all populations (size ∼28 Kb). Assuming that recombination reduced the common interval surrounding a new variant reducing back fat, the region containing the causal mutation was expanded by two more SNPs (one SNP upstream and one SNP downstream) to search for possible functional variants. This increases the final region of interest to 46 kb to search for the causal variant (AGCAAGC = Synthetic; AGCAAGG = Pietrain; GGCAAGA = Landrace; AGCAAGG = Large-White). The frequencies of these core haplotypes are 57.70%, 35.87%, 22.67% and 16.85% for each population (Synthetic, Pietrain, Landrace and Large-White, respectively) (Table 5). No common core haplotype surrounding the lead SNP could be identified across the populations surrounding the G allele (Table 6). Hence, we believe that the G to A mutation happened on the GCGAG haplotype and was subsequently selected to produce pigs with less backfat. This underlines the hypothesis that the G allele is the wild-type variant and the A allele marks the derived new variant. In line with this hypothesis, the core haplotype containing the wild type G allele could be identified at low frequency. Linkage disequilibrium (r2) between the variants in the core haplotype and the lead SNP (A) range from r2 = 0.03 and r2 = 0.96 (Table 7). The additive effect of the A and G allele on backfat across the evaluated pig populations is shown in Figure 2.
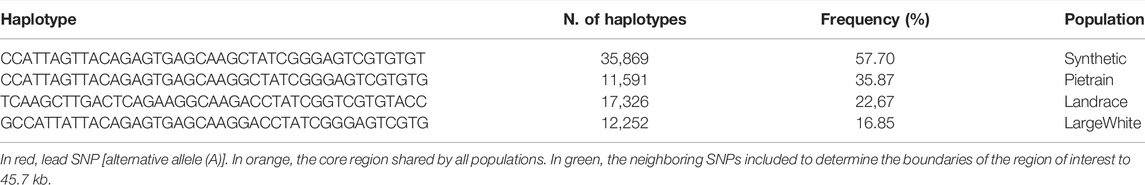
TABLE 5. Most frequent haplotypes decreasing backfat.
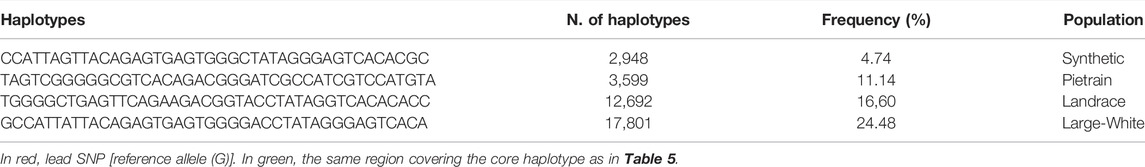
TABLE 6. Most frequent haplotypes increasing backfat.
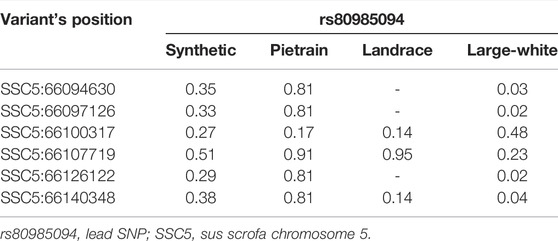
TABLE 7. Linkage disequilibrium (r2) between the lead SNP and the 660K variants present in the core haplotype.
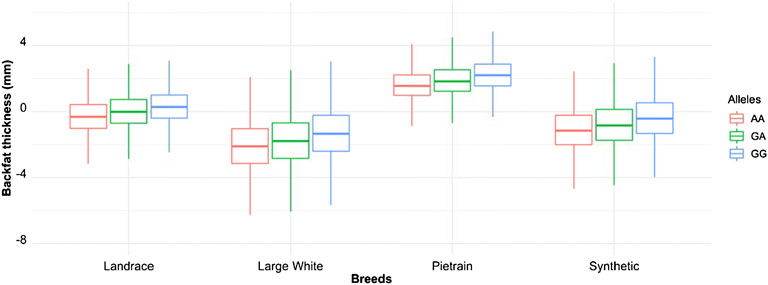
FIGURE 2. Boxplot showing the additive effect of the rs80985094 G/A allele on backfat among the different populations. Phenotype is backfat thickness in mm.
Haplotype-Based Association
A haplotype-based association analysis was performed to compare the association with the lead SNP and the core haplotype (GCAAG) as defined in Table 5 (orange haplotype). The association with the core haplotype was lower than the lead SNP (Table 8). This gives further support that the lead SNP is causal.
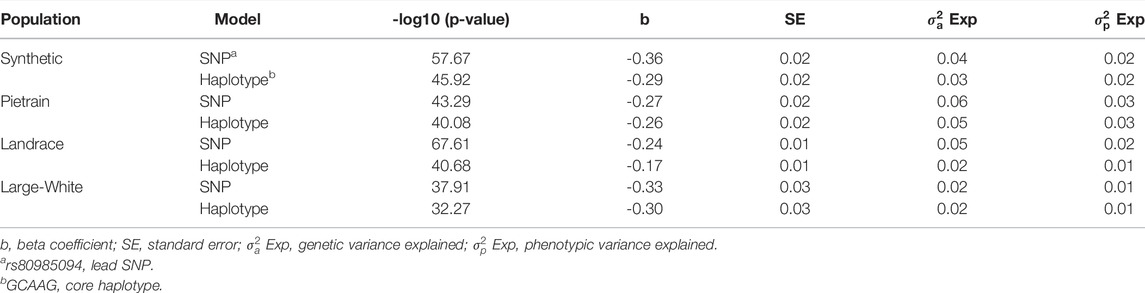
TABLE 8. Most significant SNP (lead SNP—rs80985094) identified in the within-breed association analysis and Haplotype-based association using number of copies of the core haplotype.
Whole-Genome Sequence Data Analysis
For fine mapping, we evaluated a total of 659 whole genome sequenced animals, 222 sequenced animals are homozygous for the A allele, 252 animals are heterozygous, and 185 animals are homozygous for the G allele. Analyzing the data of these subset of animals, we found two variants (besides the lead SNP) with high frequency across populations and in high LD with the lead SNP (Table 9).
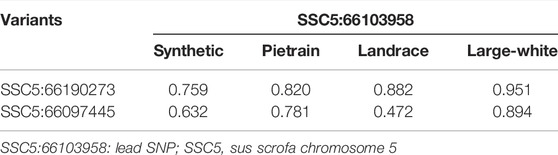
TABLE 9. LD (r2) between the lead SNP SSC5:66103958 and the other variants SSC5:66190273 and SSC5:66097445.
The LD between these variants and the lead SNP varies among the populations (Table 9). The lead SNP and SSC5:66097445 are annotated within the intronic region of the Cyclin D2 (CCND2) gene (ENSSSCG00000038694), while SSC5:66190273 is annotated in intergenic region upstream of the CCND2 gene.
RNA-Seq Analysis in Crossbred Animals Supports CCND2 as the Causal Gene
We studied the expression of the CCND2 and neighboring genes in a population of 100 crossbred animals in four different tissues (liver, spleen, lung, muscle). Table 10 shows the association of the lead SNP with the expression of genes in the backfat locus (SSC5:65-67 Mb) in four tissues.
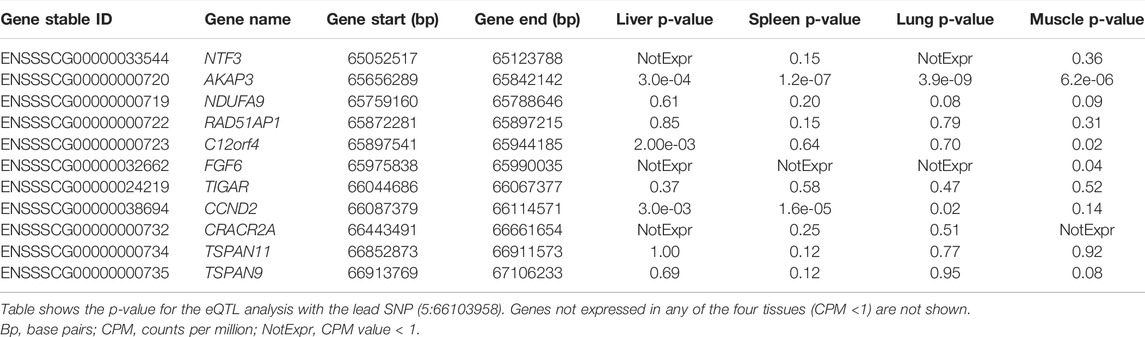
TABLE 10. Expression and eQTL results in the SSC5 backfat locus (5:65-67 Mb).
The results show that the expression of the CCND2 gene is significantly associated with the lead SNP in liver, lung and spleen (Figure 3). Also, the expression of the AKAP3 (all four tissues, although with low expression CPM: 3-5) and the C12orf4 (liver, muscle) gene show significant association with the lead SNP. The AKAP3 gene encodes a member of A-kinase anchoring proteins (AKAPs). This protein is highly expressed in spermatozoa may function as a regulator of motility, capacitation, and the acrosome reaction. The C12orf4 gene encodes a protein involved in mast cell degranulation.
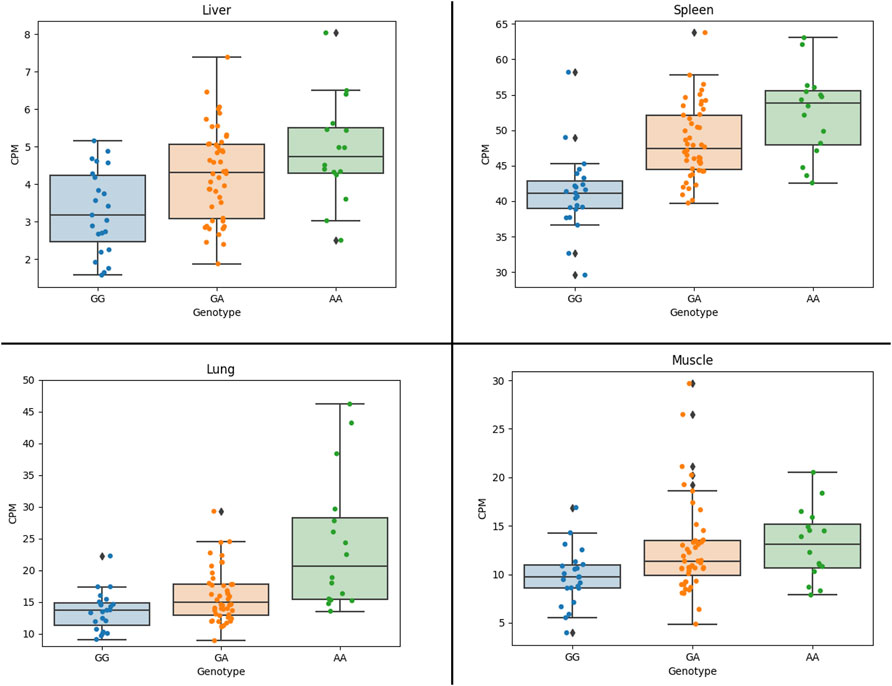
FIGURE 3. Association of CCND2 expression with the lead SNP in four 87 crossbred individuals (4 tissues). Figure shows CCND2 expression in different genotype classes. G allele is associated with more fat, while the A allele is associated with faster growth. Figure shows that the A allele is significantly associated with increased expression of the CCND2 gene in liver (p-value: 3.0 × 10⁻³), spleen (p-value: 1.6 × 10⁻⁵) and lung (p-value: 0.02).
CCND2 Regulatory Region
The core haplotype region ranges from SSC5:66094630 to SSC5:66140348 and it covers the CCND2 gene. Therefore, to discover potentially regulatory elements, we used ChIP-seq and ATAC-Seq public datasets to investigate the region of interest. ChIP-Seq data was used to detect enhancers and promoters marked by H3K4me3, H3K4ac27 and H3K4me1. ATAC-Seq was used to detect open chromatin.
We have called broad peaks for marks on ATAC-Seq and ChIP-Seq (Figure 4 and Supplementary Material S2). All markers have peak signals just downstream of the lead SNP and are partially covered within the core haplotype region (Supplementary Text S1). In human a predicted promoter is located at the lead SNP location, further supporting a potential regulatory role of the lead SNP (Supplementary Material S3).

FIGURE 4. ATAC-Seq and ChIP-Seq (H3K27ac, H3K4me1 and H3K4me3) marks in the CCND2 backfat locus. Broad Peaks in the core haplotype region were called using MACS2.
Discussion
Backfat is one of the most important traits in pork production and is closely related to meat quality and efficiency-related traits in pigs. The composition of lipid in backfat is mainly triacylglycerol (Roongsitthichai and Tummaruk, 2014) which exhibits a strong genetic component but is also influenced by environmental factors like feed intake (Wood et al., 1989)In the current study we have confirmed the presence of a QTL region on SSC5 with strong association with backfat in four out of five evaluated pig populations.
The lead SNP (rs80985094) explains up to 6% of the genetic variance and 3% of the phenotypic variance of backfat in the evaluated populations. However, the G allele of the lead SNP is fixed in the Duroc population, associated with increased backfat, explaining the absence of this QTL in Duroc. Durocs are known to have generally higher fat and intramuscular fat content compared to populations of Large White, Landrace, or Pietrain origin.
Several studies have reported QTLs and candidate genes to possibly identify functional mutations in different loci associated with backfat in pigs (Fontanesi et al., 2012; Zhu et al., 2014; Pant et al., 2015). We have identified one strong candidate SNP (rs80985094) located on SSC5:66103958 with very strong association with backfat across populations. Based on the results reported in the PigQTLdb, 19 QTL were previously reported in the same region (SSC5:66 ± 0.5 Mb), in which three of them were related to backfat (QTL identification = 139184, 139225 and 22298) (Onteru et al., 2013; Reyer et al., 2017). According to Reyer et al. (2017), the lead SNP (rs80985094) was also identified as the most significant SNP in the identified region associated with backfat. However, no functional candidate gene was described by these authors for this QTL region. Recently (Delpuech et al., 2021), describe a backfat QTL in the same region in French Large White at rs342862483 (SSC5:66100317) and (Gozalo-Marcilla et al., 2021) pinpoint FGF23 as a candidate gene in the same QTL region in different pig lines, these differences might be caused due the number of markers used in each study (660K vs 80K). However, given the proximity of the candidate causal SNP and the influence on the expression we argue that the CCND2 gene is the causal gene affecting backfat at this locus.
Pietrain, Synthetic, and Landrace populations have high frequency for the A allele, which is associated with less backfat, while Large White has a high frequency for the G allele which is associated with more backfat. This result is in line with the selection in the Pietrain, Synthetic, and Landrace populations for leanness and feed efficiency compared to the Large-White population.
The CCND2 gene was found to be associated with adipose tissue development and differentiation (Vaittinen et al., 2011). Moreover (Le et al., 2017), identified the CCND2 gene as a possible candidate for backfat conformation in Landrace. These findings are now supported by our results showing that the A allele of the lead SNP is associated with increased expression of the CCND2 gene in liver, spleen and lung. This finding is in line with previous observations showing that adipogenic triggering leads to a strong downregulation of cell cycle and proliferation genes (including CCND2) (Marcon et al., 2019). Moreover, a study in chicken showed that overexpression of Dnmt3a1 significantly upregulated the mRNA level of cell-cycle-related genes including CCND2, but decreasing mRNAs and proteins involved in adipogenesis (Abdalla et al., 2018). In addition, we discovered regulatory elements in the core haplotype region flanking the lead SNP supporting a regulatory role of the causal variant. Together the results reported in literature show that the overexpression of cell-cycle-related genes including the CCND2 gene suppresses adipogenesis.
In addition to the CCND2 gene, the core haplotype covers a region also overlaps with the LOC106507534 (a non-conding RNA). In human, the CCND2 gene region is located on chromosome 12 and LOC106507534 (pig annotation) is orthologous to a long non-coding RNA (lncRNA) named CCND2-AS1 (human annotation). This lncRNA is associated with regulation of Wnt/b-catenin signaling which directly regulates cell proliferation, cell polarity and cell fate determination during embryo development and tissue homeostasis (Logan and Nusse, 2004; Zhang et al., 2017). Moreover, Zhang et al. (2017) have identified that CCND2-AS1 plays an important role in glioma cells proliferation through the regulation of the Wnt/b-Catenin pathway. Hence both CCND2 and CCND2-AS1 are involved in cell proliferation which is associated with the differentiation of the adipogenic and myogenic cell lineages in early development. However, the pig CCND2-AS1 was not expressed in our RNA-seq datasets. At the light of these facts, our findings suggest that CCND2 can also regulate Wnt/b-Catenin pathway in prenatal life impacting fat deposition even after birth in pigs. However, the exact involvement of CCND2-AS1 with this QTL region remains unclear.
We hypothesize that the lead SNP is the causal variant by affecting CCND2 gene expression. The association found on SSC5 is highly significant, and the lead SNP explains up to 6% of the genetic variance of backfat in the evaluated populations. The Duroc population was the only population in which we did not identify the QTL. Interestingly, the Duroc population has been selected for improved meat quality and fixation of the G-allele may indicate that this SNP or underlying gene can have some influence in backfat and meat quality. On the other hand, populations highly selected for leanness and feed efficiency (Synthetic, Landrace and Pietrain) show a low frequency of the G allele. If the mutation from G to A occurred in a common ancestor of the white lines, selection will have acted against the G allele in these populations. Due to recombination, the size of the original haplotype on which the mutation occurred is reduced with each generation. Indeed, we still find a core haplotype surrounding the A variant which the four white lines have in common. Furthermore, we also find the original core haplotype with the wild type G allele GCGAG at low frequency in all four white populations. Indeed, this haplotype increases back fat in all four lines (Table 11). This further supports the hypothesis that the lead SNP is the causative mutation itself as we cannot identify any other variant in high LD across all four populations in this core region surrounding the A allele. It remains to be elucidated why the G allele is still present at a rather high frequency in commercial pig populations that have been heavily selected for leanness. However, this could be linked to correlated effects on other traits.
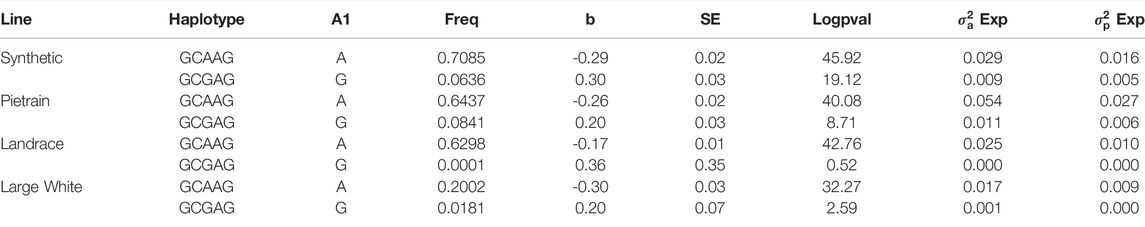
TABLE 11. Frequency of core haplotype and ancient wild-type core haplotype per line and effects on backfat.
Interestingly, the A allele, associated with less backfat seems to be the ancestral allele in other mammals such as human, horse and cow, where the A allele is present. However, we did not find animals that have the A allele in Asian or European wild boars, indicating that for the pig lineage, the G allele is the ancestral allele. We did however find the A allele in several European local breeds including the Angler Sattelschwein, Bunte Bentheimer, and in Tamworth (Supplementary Material S3). The Angler Sattelschwein is a cross between the German black-and-white Landrace and the Wessex Saddleback, while the Tamworth breed is relatively lean. These results show that the A allele has likely originated in white lines in Europe. However, we cannot exclude recent crossbreeding of European local breeds with breeds that carry the A allele.
We report the CCND2 gene as a strong candidate gene for backfat deposition in pigs supported by changes in expression and involvement in adipogenesis. However, the exact molecular mechanisms underlying this QTL region remain to be discovered.
Conclusion
In this study, we identified a QTL region on SSC5 with strong association with backfat across four pig populations. The lead SNP, rs80985094, explained up to 6% of genetic variance of backfat. Gene expression analysis shows that the SNP is associated with the expression of the CCND2 gene which is involved in adipogenesis during prenatal development and thereby influencing the expressed phenotype in the adult life. Moreover, we believe that the lead SNP is the causal mutation based on fine mapping using the WGS data and the significant eQTL result for the CCND2 gene. Our results will open up further study to validate the effect of the causal mutation and gene and to better understand its role on fat deposition and muscularity in pigs.
Data Availability Statement
660K Genotypes, WGS variants (VCF), RNA-sequencing samples, and alignment BAM files are available at the Open Science Framework repository: https://osf.io/xg9cq/.
Ethics Statement
Ethical review and approval was not required for the animal study because the data used in this study have been obtained as part of routine data collection from Topigs Norsvin breeding programmes, and not specifically for the purpose of this project. Therefore, approval of an ethics committee was not mandatory. Sample collection and data recording were conducted strictly according to the Dutch law on animal protection and welfare (Gezondheids‐ en welzijnswet voor dieren).
Author Contributions
The manuscript was first drafted by HO. Further development of manuscript was performed by MD. ML was involved in the GWAS analysis and providing of data. All other authors provided useful comments to help improve the manuscript. All authors approved the manuscript.
Funding
This study was funded by the Instituto Nacional de Ciência e Tecnologia de Ciência Animal (INCT-CA), Grant/Award Number: 465377/2014-9, Coordenação de Aperfeiçoamento de Pessoal de Nível Superior (CAPES).
Conflict of Interest
Author ML was employed by Topigs Norsvin. Authors MS, EG and AG were employed by Norsvin SA.
The remaining authors declare that the research was conducted in the absence of any commercial or financial relationships that could be construed as a potential conflict of interest.
Publisher’s Note
All claims expressed in this article are solely those of the authors and do not necessarily represent those of their affiliated organizations, or those of the publisher, the editors, and the reviewers. Any product that may be evaluated in this article, or claim that may be made by its manufacturer, is not guaranteed or endorsed by the publisher.
Supplementary Material
The Supplementary Material for this article can be found online at: https://www.frontiersin.org/articles/10.3389/fgene.2022.871516/full#supplementary-material
References
Abdalla, B. A., Li, Z., Ouyang, H., Jebessa, E., Sun, T., Yu, J.-a., et al. (2018). A Novel Dnmt3a1 Transcript Inhibits Adipogenesis. Front. Physiol. 9, 1270. doi:10.3389/fphys.2018.01270
Browning, B. L., Zhou, Y., and Browning, S. R. (2018). A One-Penny Imputed Genome from Next-Generation Reference Panels. Am. J. Hum. Genet. 103, 338–348. doi:10.1016/j.ajhg.2018.07.015
Browning, S. R., and Browning, B. L. (2007). Rapid and Accurate Haplotype Phasing and Missing-Data Inference for Whole-Genome Association Studies by Use of Localized Haplotype Clustering. Am. J. Hum. Genet. 81, 1084–1097. doi:10.1086/521987
Chen, J. N., Jiang, Y. Z., Cen, W. M., Xing, S. H., Zhu, L., Tang, G. Q., et al. (2014). Distribution of H-FABP and ACSL4 Gene Polymorphisms and Their Associations with Intramuscular Fat Content and Backfat Thickness in Different Pig Populations. Genet. Mol. Res. 13, 6759–6772. doi:10.4238/2014.August.28.20
Delpuech, E., Aliakbari, A., Labrune, Y., Fève, K., Billon, Y., Gilbert, H., et al. (2021). Identification of Genomic Regions Affecting Production Traits in Pigs Divergently Selected for Feed Efficiency. Genet. Sel. Evol. 53, 49. doi:10.1186/s12711-021-00642-1
Derks, M. F. L., Gross, C., Lopes, M. S., Reinders, M. J. T., Bosse, M., Gjuvsland, A. B., et al. (2021). Accelerated Discovery of Functional Genomic Variation in Pigs. Genomics 113, 2229–2239. doi:10.1016/j.ygeno.2021.05.017
Do, D. N., Ostersen, T., Strathe, A. B., Mark, T., Jensen, J., and Kadarmideen, H. N. (2014). Genome-wide Association and Systems Genetic Analyses of Residual Feed Intake, Daily Feed Consumption, Backfat and Weight Gain in Pigs. BMC Genet. 15, 1–15. doi:10.1186/1471-2156-15-27
Dobin, A., Davis, C. A., Schlesinger, F., Drenkow, J., Zaleski, C., Jha, S., et al. (2013). STAR: Ultrafast Universal RNA-Seq Aligner. Bioinformatics 29, 15–21. doi:10.1093/bioinformatics/bts635
Fontanesi, L., Schiavo, G., Galimberti, G., Calò, D., Scotti, E., Martelli, P., et al. (2012). A Genome Wide Association Study for Backfat Thickness in Italian Large White Pigs Highlights New Regions Affecting Fat Deposition Including Neuronal Genes. BMC Genomics 13, 583. doi:10.1186/1471-2164-13-583
Fowler, K. E., Pong-Wong, R., Bauer, J., Clemente, E. J., Reitter, C. P., Affara, N. A., et al. (2013). Genome Wide Analysis Reveals Single Nucleotide Polymorphisms Associated with Fatness and Putative Novel Copy Number Variants in Three Pig Breeds. BMC Genomics 14, 1. doi:10.1186/1471-2164-14-784
Garrison, E., and Marth, G. (2012). Haplotype-based Variant Detection from Short-Read Sequencing. arXiv.
Gilmour, a. R., Gogel, B. J., Cullis, B. R., and Thompson, R. (2009). ASReml User Guide Release 3.0. Hemel Hempstead: VSN International, 275. doi:10.1017/CBO9781107415324.004
Gozalo-Marcilla, M., Buntjer, J., Johnsson, M., Batista, L., Diez, F., Werner, C. R., et al. (2021). Genetic Architecture and Major Genes for Backfat Thickness in Pig Lines of Diverse Genetic Backgrounds. Genet. Sel. Evol. 53, 76. doi:10.1186/s12711-021-00671-w
Kumar, P., Henikoff, S., and Ng, P. C. (2009). Predicting the Effects of Coding Non-synonymous Variants on Protein Function Using the SIFT Algorithm. Nat. Protoc. 4, 1073–1081. doi:10.1038/nprot.2009.86
Le, T. H., Christensen, O. F., Nielsen, B., and Sahana, G. (2017). Genome-wide Association Study for Conformation Traits in Three Danish Pig Breeds. Genet. Sel. Evol. 49, 1–12. doi:10.1186/s12711-017-0289-2
Li, H., and Durbin, R. (2009). Fast and Accurate Short Read Alignment with Burrows-Wheeler Transform. Bioinformatics 25, 1754–1760. doi:10.1093/bioinformatics/btp324
Li, H., Handsaker, B., Wysoker, A., Fennell, T., Ruan, J., Homer, N., et al. (2009). The Sequence Alignment/Map Format and SAMtools. Bioinformatics 25, 2078–2079. doi:10.1093/bioinformatics/btp352
Logan, C. Y., and Nusse, R. (2004). The Wnt Signaling Pathway in Development and Disease. Annu. Rev. Cell. Dev. Biol. 20, 781–810. doi:10.1146/annurev.cellbio.20.010403.113126
Lonergan, S. M., Huff-Lonergan, E., Rowe, L. J., Kuhlers, D. L., and Jungst, S. B. (2001). Selection for Lean Growth Efficiency in Duroc Pigs Influences Pork Quality. J. Animal Sci. 79, 2075. doi:10.2527/2001.7982075x
Marcon, B. H., Shigunov, P., Spangenberg, L., Pereira, I. T., de Aguiar, A. M., Amorín, R., et al. (2019). Cell Cycle Genes Are Downregulated after Adipogenic Triggering in Human Adipose Tissue-Derived Stem Cells by Regulation of mRNA Abundance. Sci. Rep. 9, 5611. doi:10.1038/s41598-019-42005-3
McLaren, W., Gil, L., Hunt, S. E., Riat, H. S., Ritchie, G. R. S., Thormann, A., et al. (2016). The Ensembl Variant Effect Predictor. Genome Biol. 17, 122. doi:10.1186/s13059-016-0974-4
Merks, J. W. M. (2000). One Century of Genetic Changes in Pigs and the Future Needs. BSAP Occas. Publ. 27, 8–19. doi:10.1017/S1463981500040498
Okumura, N., Matsumoto, T., Hayashi, T., Hirose, K., Fukawa, K., Itou, T., et al. (2013). Genomic Regions Affecting Backfat Thickness and Cannon Bone Circumference Identified by Genome-wide Association Study in a Duroc Pig Population. Anim. Genet. 44, 454–457. doi:10.1111/age.12018
Oliveira, H. C. (2019). HaploPi. Available at: https://github.com/hanielcedraz/HaploPi. (Accessed: July 7, 2020).
Onteru, S. K., Gorbach, D. M., Young, J. M., Garrick, D. J., Dekkers, J. C. M., and Rothschild, M. F. (2013). Whole Genome Association Studies of Residual Feed Intake and Related Traits in the Pig. PLoS ONE 8, e61756. doi:10.1371/journal.pone.0061756
Pant, S. D., Karlskov-Mortensen, P., Jacobsen, M. J., Cirera, S., Kogelman, L. J. A., Bruun, C. S., et al. (2015). Comparative Analyses of QTLs Influencing Obesity and Metabolic Phenotypes in Pigs and Humans. PLoS ONE 10, e0137356–22. doi:10.1371/journal.pone.0137356
Purcell, S., Neale, B., Todd-Brown, K., Thomas, L., Ferreira, M. A. R., Bender, D., et al. (2007). PLINK: A Tool Set for Whole-Genome Association and Population-Based Linkage Analyses. Am. J. Hum. Genet. 81, 559–575. doi:10.1086/519795
Reyer, H., Varley, P. F., Murani, E., Ponsuksili, S., and Wimmers, K. (2017). Genetics of Body Fat Mass and Related Traits in a Pig Population Selected for Leanness. Sci. Rep. 7, 9118. doi:10.1038/s41598-017-08961-4
Robinson, M. D., McCarthy, D. J., and Smyth, G. K. (2009). edgeR: A Bioconductor Package for Differential Expression Analysis of Digital Gene Expression Data. Bioinformatics 26, 139–140. doi:10.1093/bioinformatics/btp616
Roongsitthichai, A., and Tummaruk, P. (2014). Importance of Backfat Thickness to Reproductive Performance in Female Pigs. Thai J. Veterinary Med. 44, 171–178.
Sargolzaei, M., Chesnais, J. P., and Schenkel, F. S. (2014). A New Approach for Efficient Genotype Imputation Using Information from Relatives. BMC Genomics 15, 478. doi:10.1186/1471-2164-15-478
Vaittinen, M., Kolehmainen, M., Schwab, U., Uusitupa, M., and Pulkkinen, L. (2011). Microfibrillar-associated Protein 5 Is Linked with Markers of Obesity-Related Extracellular Matrix Remodeling and Inflammation. Nutr Diabetes 1, e15. doi:10.1038/nutd.2011.10
Wang, S., Peng, D.-q., and Yi, Y. (2016). The Unsolved Mystery of apoA-I Recycling in Adipocyte. Lipids Health Dis. 15, 1–8. doi:10.1186/s12944-016-0203-x
Warr, A., Affara, N., Aken, B., Beiki, H., Bickhart, D. M., Billis, K., et al. (2020a). An Improved Pig Reference Genome Sequence to Enable Pig Genetics and Genomics Research. GigaScience 9 (6), giaa051. doi:10.1093/gigascience/giaa051
Warr, A., Affara, N., Aken, B., Beiki, H., Bickhart, D. M., Billis, K., et al. (2020b). An Improved Pig Reference Genome Sequence to Enable Pig Genetics and Genomics Research. Gigascience, 668921. doi:10.1101/668921
Wood, J. D., Enser, M., Fisher, A. V., Nute, G. R., Sheard, P. R., Richardson, R. I., et al. (2008). Fat Deposition, Fatty Acid Composition and Meat Quality: A Review. Meat Sci. 78, 343–358. doi:10.1016/j.meatsci.2007.07.019
Wood, J. D., Enser, M., Whittington, F. M., Moncrieff, C. B., and Kempster, A. J. (1989). Backfat Composition in Pigs: Differences between Fat Thickness Groups and Sexes. Livest. Prod. Sci. 22, 351–362. doi:10.1016/0301-6226(89)90066-3
Yang, J., Lee, S. H., Goddard, M. E., and Visscher, P. M. (2011). GCTA: A Tool for Genome-wide Complex Trait Analysis. Am. J. Hum. Genet. 88, 76–82. doi:10.1016/j.ajhg.2010.11.011
Yang, J., Zaitlen, N. A., Goddard, M. E., Visscher, P. M., and Price, A. L. (2014). Advantages and Pitfalls in the Application of Mixed-Model Association Methods. Nat. Genet. 46, 100–106. doi:10.1038/ng.2876
Zhang, H., Wei, D.-L., Wan, L., Yan, S.-F., and Sun, Y.-H. (2017). Highly Expressed lncRNA CCND2-AS1 Promotes Glioma Cell Proliferation through Wnt/β-Catenin Signaling. Biochem. Biophysical Res. Commun. 482, 1219–1225. doi:10.1016/j.bbrc.2016.12.016
Zhang, Y., Liu, T., Meyer, C. A., Eeckhoute, J., Johnson, D. S., Bernstein, B. E., et al. (2008). Model-based Analysis of ChIP-Seq (MACS). Genome Biol. 9, R137. doi:10.1186/gb-2008-9-9-r137
Keywords: GWAS, pig genomics, animal breeding, finemapping, backfat
Citation: Oliveira HC, Derks MFL, Lopes MS, Madsen O, Harlizius B, van Son M, Grindflek EH, Gòdia M, Gjuvsland AB, Otto PI, Groenen MAM and Guimaraes SEF (2022) Fine Mapping of a Major Backfat QTL Reveals a Causal Regulatory Variant Affecting the CCND2 Gene. Front. Genet. 13:871516. doi: 10.3389/fgene.2022.871516
Received: 08 February 2022; Accepted: 29 April 2022;
Published: 25 May 2022.
Edited by:
Angela Cánovas, University of Guelph, CanadaReviewed by:
Paolo Zambonelli, University of Bologna, ItalyGuoqing Tang, Sichuan Agricultural University, China
Roger Ros-Freixedes, Universitat de Lleida, Spain
Copyright © 2022 Oliveira, Derks, Lopes, Madsen, Harlizius, van Son, Grindflek, Gòdia, Gjuvsland, Otto, Groenen and Guimaraes. This is an open-access article distributed under the terms of the Creative Commons Attribution License (CC BY). The use, distribution or reproduction in other forums is permitted, provided the original author(s) and the copyright owner(s) are credited and that the original publication in this journal is cited, in accordance with accepted academic practice. No use, distribution or reproduction is permitted which does not comply with these terms.
*Correspondence: Martijn F. L. Derks, bWFydGlqbi5kZXJrc0B0b3BpZ3Nub3JzdmluLmNvbQ==
†These authors have contributed equally to this work and share first authorship