 Wen-Pan Liu1,2†Peng Li3†Xu Zhan4†Lai-Hao Qu5
 Tao Xiong5Fang-Xia Hou1
 Jun-Kui Wang1Na Wei1*
 Fu-Qiang Liu1*
- 1Cardiovascular Department, Shaanxi Provincial People’s Hospital, Xi’an, Shaanxi, China
- 2Department of Cardiothoracic Surgery, The First People’s Hospital of Kunming City and Ganmei Affiliated Hospital of Kunming Medical University, Kunming, Yunnan, China
- 3Department of Surgery, Nanzhao County People’s Hospital, Nanyang, Henan, China
- 4Department of Cardiothoracic Surgery, The First Affiliated Hospital of Chongqing Medical University, Chongqing, China
- 5Department of Cardiothoracic Surgery, Yan’an Affiliated Hospital of Kunming Medical University, Kunming, Yunnan, China
Aim: Coronary artery disease (CAD) is a heterogeneous disorder with high morbidity, mortality, and healthcare costs, representing a major burden on public health. Here, we aimed to improve our understanding of the genetic drivers of ferroptosis and necroptosis and the clustering of gene expression in CAD in order to develop novel personalized therapies to slow disease progression.
Methods: CAD datasets were obtained from the Gene Expression Omnibus. The identification of ferroptosis- and necroptosis-related differentially expressed genes (DEGs) and the consensus clustering method including the classification algorithm used km and distance used spearman were performed to differentiate individuals with CAD into two clusters (cluster A and cluster B) based expression matrix of DEGs. Next, we identified four subgroup-specific genes of significant difference between cluster A and B and again divided individuals with CAD into gene cluster A and gene cluster B with same methods. Additionally, we compared differences in clinical information between the subtypes separately. Finally, principal component analysis algorithms were constructed to calculate the cluster-specific gene score for each sample for quantification of the two clusters.
Results: In total, 25 ferroptosis- and necroptosis-related DEGs were screened. The genes in cluster A were mostly related to the neutrophil pathway, whereas those in cluster B were mostly related to the B-cell receptor signaling pathway. Moreover, the subgroup-specific gene scores and CAD indices were higher in cluster A and gene cluster A than in cluster B and gene cluster B. We also identified and validated two genes showing upregulation between clusters A and B in a validation dataset.
Conclusion: High expression of CBS and TLR4 was related to more severe disease in patients with CAD, whereas LONP1 and HSPB1 expression was associated with delayed CAD progression. The identification of genetic subgroups of patients with CAD may improve clinician knowledge of disease pathogenesis and facilitate the development of methods for disease diagnosis, classification, and prognosis.
Introduction
Coronary artery disease (CAD) is a common cardiac disease and the primary cause of cardiovascular disease-related death (Agha et al., 2019; McCaffrey et al., 2021). CAD is caused by atherosclerosis or atherosclerotic occlusions of the coronary arteries (Thomas et al., 2018). Numerous environmental and genetic variables, including age, smoking habit, hypertension, dyslipidemia, obesity, diabetes, and family history, contribute to CAD (Chiu et al., 2018; Madhavan et al., 2018; Zhang H. W. et al., 2020). According to the CAD prediction model, approximately 20 million deaths and 16 million cases of reduced worker productivity were attributable to CAD in China between 2010 and 2015. Similar numbers are expected between 2000 and 2029 (Moran et al., 2008). The prevalence of CAD continues to increase, and clinical outcomes remain unsatisfactory. Although several studies have reported remarkable progress in the identification of diagnostic biomarkers for CAD in the blood (including long noncoding RNAs, methylation, and mRNAs) (Wang et al., 2020; Zhang X. et al., 2020; Chen Z. et al., 2021; Yang and Xu, 2021; Zhang L. et al., 2021) only two studies have described clinical heterogeneity in patients with different CAD severities (Zhang X. et al., 2020; Zhang B. et al., 2021). Therefore, scientific classification and targeted treatment may facilitate effective management of CAD. Current categorization approaches are based on pathological characteristics, disease development, and clinical symptoms, and the use of genotypic subgroups is developing slowly (Davies et al., 2021). The development of gene chip makes it possible to study the occurrence and development of CAD at the gene level (Franchini, 2016; Musunuru and Kathiresan, 2019).
At present, a review has reported forms of cell death that could affect CAD risk, such as apoptosis, pyroptosis, parthanatos, and autophagy, which have been previously implicated in CAD pathogenesis (Del Re et al., 2019). Additional, both ferroptosis and necroptosis are also involved in the development of CAD (Del Re et al., 2019). At present, Zhou et al.( 2021) has reported the specific mechanism of ferroptosis combined with pyroptosis in coronary atherosclerosis, and screened important marker genes. However, there is no study on ferroptosis combined with necroptosis in CAD. Ferroptosis, a novel type of cell death discovered in the last few years, is accompanied by accumulation of large amounts of iron and lipid peroxidation during the cell death process (Li et al., 2020). Furthermore, ferroptosis is an independent process triggered by the presence of harmful lipid reactive oxygen species and the consumption of polyunsaturated fatty acids (Li et al., 2020); these features distinguish ferroptosis from apoptosis, necrosis, and autophagy. Bai et al. (2020) fed apolipoprotein E (ApoE)−/− mice a high-fat diet (HFD) to induce atherosclerosis in the presence or absence of the widely utilized ferroptosis inhibitor Ferrostatin-1 (Fer-1) and showed that Fer-1 treatment dramatically reduced atherosclerotic lesions, suggesting that ferroptosis occurs in mice with HFD-induced atherosclerosis. Further in vitro investigations using mouse aortic endothelial cells indicated that endothelial dysfunction significantly contributes to ferroptosis in the setting of atherosclerosis. Necroptosis is another newly defined form of cell death similar to necrosis and apoptosis in terms of morphology (e.g., cell swelling and rupture) (Vandenabeele et al., 2010). The necrotic features of necroptosis are marked by cell rupture and the release of immunogenic intracellular components, which activate inflammatory responses, highlighting the pro-inflammatory features of necroptosis. Vandenabeele et al. (2010) found that lipid peroxidation enhances oxidized low-density lipoprotein (ox-LDL) buildup and necroptosis. Moreover, the powerful pro-inflammatory effects of necroptosis can cause atherosclerosis. Therefore, necroptosis and ferroptosis inhibitors are promising strategies for targeting atherosclerosis, oxidative stress, and inflammatory responses. Initially, apoptosis, autophagy, and necrosis were thought to be mutually exclusive. However, recent studies have shown a delicate balance among these modes of death, suggesting that inhibition of one mode of death may increase the sensitivity of cells to activation of the other mode of death (Chen et al., 2018).
As gene chip analysis becomes more affordable, more researchers are using this approach to uncover the molecular pathways underlying the development and progression of CAD. However, most studies have only evaluated differences between CAD cases and normal controls, ignoring variances within CAD cases. Tumor samples are frequently subtyped in cancer research based on the expression patterns of ferroptosis- (Shan et al., 2021), pyroptosis- (Shao et al., 2021), DNA methylation- (Ding et al., 2019), and necroptosis-related genes (Zhao et al., 2021); such analyses can reveal intertumor heterogeneity, predict clinical endpoints, and guide treatment.
Therefore, in this study, we aimed to elucidate the mechanisms through which ferroptosis- and necroptosis-related genes contribute to CAD progression by typing CAD cases according to these genes. We also investigated the correlations between the typing results and clinical characteristics.
Materials and methods
Data collection and processing
mRNA expression profiles obtained from whole-blood samples of patients were downloaded from GEO (https://www.ncbi.nlm.nih.gov/geo/). GSE12288 (Sinnaeve et al., 2009) included 110 CAD samples and 112 normal samples based on the GPL96 platform, GSE20680 (Beineke et al., 2012) included 143 CAD samples and 52 normal samples based on the GPL4133 platform, and GSE20681 (Beineke et al., 2012) included 99 CAD samples and 99 normal samples based on the GPL4133 platform; these three datasets were used as training sets. GSE180083dataset by merging GSE180081 and GSE180082 datasets (McCaffrey et al., 2021) included 116 CAD samples and 60 normal samples based on the GPL14761 platform and was used as the validation dataset. Additionally, information regarding age, CAD index, and sex was collected. The Duke Coronary Artery Disease Index (CAD index) (Felker et al., 2002)was used to quantify the severity of lesions and diseased arteries and to assess the presence of lesions in the left anterior descending branch and main stem as an indicator of the severity of CAD.
The “normalizeBetweenArrays” function of limma package (Ritchie et al., 2015) was used to adjust the microarray data to quartiles for expression matrix of GSE12288, GSE20680 and GSE20681 datasets. Each gene was annotated using platform-provided annotation data. If a gene had several probes, the average expression level was determined. Batch effects were eliminated by combining GSE12288, GSE20680, and GSE20681 into a single dataset using the “sva” package in R software. A two-dimensional principal component analysis (PCA) cluster plot was used to illustrate intersample correction.
Identification of ferroptosis- and necroptosis-related differentially expressed genes between normal and CAD samples
Ferroptosis- and necroptosis-related genes (n = 67 for necroptosis, n = 259 for ferroptosis) were retrieved from the molecular signature database (MSigDB4) and FerrDb5 (Zhou and Bao, 2020) (Supplementary Table S1). We performed differential analysis of ferroptosis- and necroptosis-related genes between normal and CAD samples using the wilcoxon test. Finally, we extracted 25 ferroptosis- and necroptosis-related DEGs (i.e., NCF2, BNIP3, CBS, FTL, RPL8, HSPB1, MAP3K5, MAPK14, ELAVL1, HIC1, STAT3, PGD, SCP2, SLC38A1, MYB, TLR4, MTDH, LONP1, FADD, ITPK1, MYC, TNFSF10, DNMT1, BACH2, and LEF1) from the dataset using difference analysis between normal and CAD samples.
Construction of subgroups based on consensus clustering
We used consensus clustering (Wilkerson and Hayes, 2010) to categorize patients with CAD into distinct subgroups based on the expressed matrix of ferroptosis- and necroptosis-related DEGs between normal and CAD samples. Clustering was carried out using the Kmeans method and the Spearman distance. The maximum number of clusters was set at nine. The consensus matrix determined the final cluster number.
Comparing the clinical characteristics of the two subgroups
Clinical data, such as age, sex, and CAD index, were obtained using the series matrix file downloaded from the three gene sets GSE12288, GSE20680, and GSE20681 in the GEO database. The continuous variables were age and CAD index, which were compared using the pairwise Wilcoxon rank sum test (Divine et al., 2013) and shown using box plots. Male patient proportions were examined as a categorical variable (ratios) and shown using histograms.
Identification of DEGs between the two subgroups and gene ontology functional enrichment analysis
We utilized the R package “limma” to search for DEGs between the two subgroups. The screening criteria were as follows: |log (fold change [FC])| > 0.5 and adjusted p < 0.05. Next, we extracted 22 ferroptosis- and necroptosis-related DEGs using difference analysis between the two subgroups. The genes included NCF2, BNIP3, CBS, FTL, RPL8, HSPB1, MAP3K5, MAPK14, STAT3, PGD, SCP2, SLC38A1, TLR4, MTDH, LONP1, FADD, ITPK1, MYC, TNFSF10, DNMT1, BACH2, and LEF1. Using the “clusterProfiler” function in R, we investigated DEGs between cluster A and B enrichment in gene ontology (GO). GO functional enrichment analysis was used to determine the mechanisms in which the upregulated DEGs were involved in the two subgroups, and the findings were represented using an enrichment circle diagram. Results of enrichment analysis were considered statistically significant when p value was <0.05 and q value was <0.05.
Estimation of immune cell infiltration
The abundance of immune cells in CAD samples was evaluated utilizing single sample gene set enrichment analysis (ssGSEA) and the “GSVA” R package. Gene set variation analysis (GSVA) is a non-parametric, unsupervised technique for calculating the variation of gene set enrichment across an expression dataset’s samples. Each ssGSEA enrichment score reflects the extent to which the genes in a specific gene set are coordinately up- or down-regulated in a sample. The essential criteria were as follows: abs.ranking = TRUE and kcdf = “Gaussian” and method = “ssgsea”. Based on the preceding analysis, we calculated the amount of immune cells in each sample (Xiao et al., 2020).
Screening of subgroup‐specific genes and consensus clustering between subtypes
Subgroup‐specific genes (LONP1, TLR4, CBS, and HSPB1) were identified by intersection of the 22 ferroptosis- and necroptosis-related DEGs and DEGs between cluster A and B. Additionally, we typed all CAD samples (gene cluster A and B) again based on the four subgroup-specific gene expression matrix using the typing method described above. Finally, we compared the clinical characteristics of gene cluster A and B.
Estimation of the subgroup‐specific gene signature
Then, using principal component analysis (PCA), a subgroup-specific gene signature was constructed. Components 1 and 2 were both chosen to act as signature scores. This method had the advantage of focusing the score on the set containing the largest block of highly correlated (or anticorrelated) genes, while down-weighting contributions from genes that do not track with other set members in the set. The subgroup-specific gene score was subsequently calculated using the following formula: subgroup-specific gene score = ∑(PC1i + PC2i) where PC1 denotes principal component 1 and PC2 denotes principal component 2, and i reflects the expression of subgroup-specific genes (Zhang B. et al., 2020).
Validation of 4 subgroup‐specific genes in GSE180083
We used the dataset to validate the differences in 4 subgroup‐specific genes (HSPB1, LONP1, TLR4 and CBS) in normal and CAD samples in the merged dataset and GSE180083 dataset. Results with P values less than 0.05 were considered statistically significant using two-sided tests.
Results
Figure 1 depicts the procedures used in our cohort investigation. Supplementary Table S2 lists feature information for the training datasets (GSE12288, GSE20680, and GSE20681) and validation dataset (GSE180083).
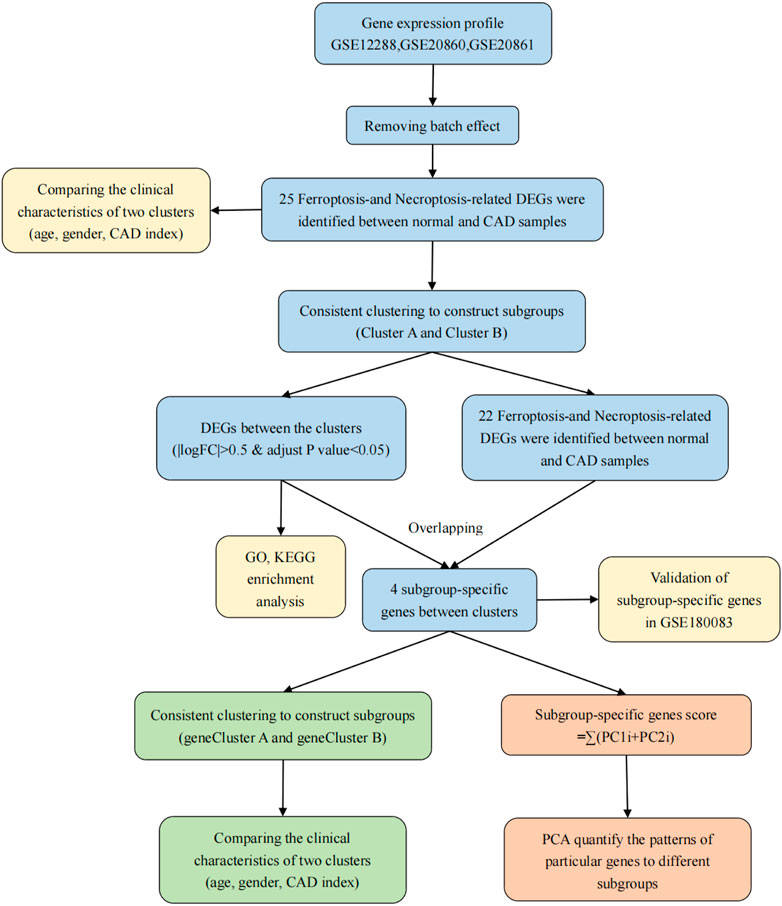
FIGURE 1. Flow chart of the research process.
Elimination of batch effects
First, we assessed the batch effects among GSE12288, GSE20680, and GSE20681 using a PCA cluster diagram. The results indicated that a batch effect did exist among the datasets (Figure 2A). Thus, using the R package “sva”, these three gene expression matrices were normalized and processed. After normalization and elimination of the batch effect, the data were depicted using a PCA cluster diagram (Figure 2B). The findings demonstrated unequivocally that the batch effect between GSE12288, GSE20680, and GSE20681 had been eliminated.
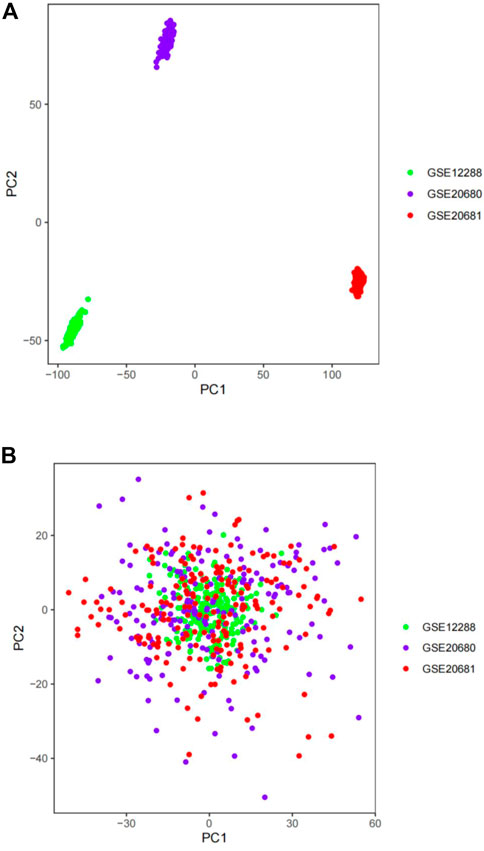
FIGURE 2. The gene expression datasets were processed using principal component analysis (PCA). The top two principal components (PC1 and PC2) of gene expression profiles were visualized as points on a scatter plot. Samples were based on data visualized without (A) and with (B) the batch effect removed. The colors indicate samples from three different datasets, which are represented by the dots.
Expression of 25 significant ferroptosis- and necroptosis-related DEGs in normal and CAD samples
The “limma” package in R was utilized to analyze the differential expression levels of ferroptosis- and necroptosis-related genes in normal and CAD samples. Twenty-five significant ferroptosis- and necroptosis-related DEGs (NCF2, BNIP3, CBS, FTL, RPL8, HSPB1, MAP3K5, MAPK14, ELAVL1, HIC1, STAT3, PGD, SCP2, SLC38A1, MYB, TLR4, MTDH, LONP1, FADD, ITPK1, MYC, TNFSF10, DNMT1, BACH2, and LEF1) were identified between normal and CAD samples and visualized using a heat map and box plot (Figures 3A–D). We found that the necroptosis-related genes MYC, DNMT1, BACH2, LEF1, and BNIP3 and the ferroptosis-related genes BNIP3, RPL8, HSPB1, ELAVL1, HIC1, SCP2, SLC38A1, MYB, MTDH, and LONP1 were overexpressed in normal samples compared with CAD samples. By contrast, the necroptosis-related genes FADD, ITPK1, TNFSF10, STAT3, and DNMT1 and the ferroptosis-related genes NCF2, CBS, FTL, MAP3K5, MAPK14, STAT3, PGD, SLC38A1, MYB, MTDH, and LONP1 displayed decreased expression in normal samples compared with those in CAD samples.
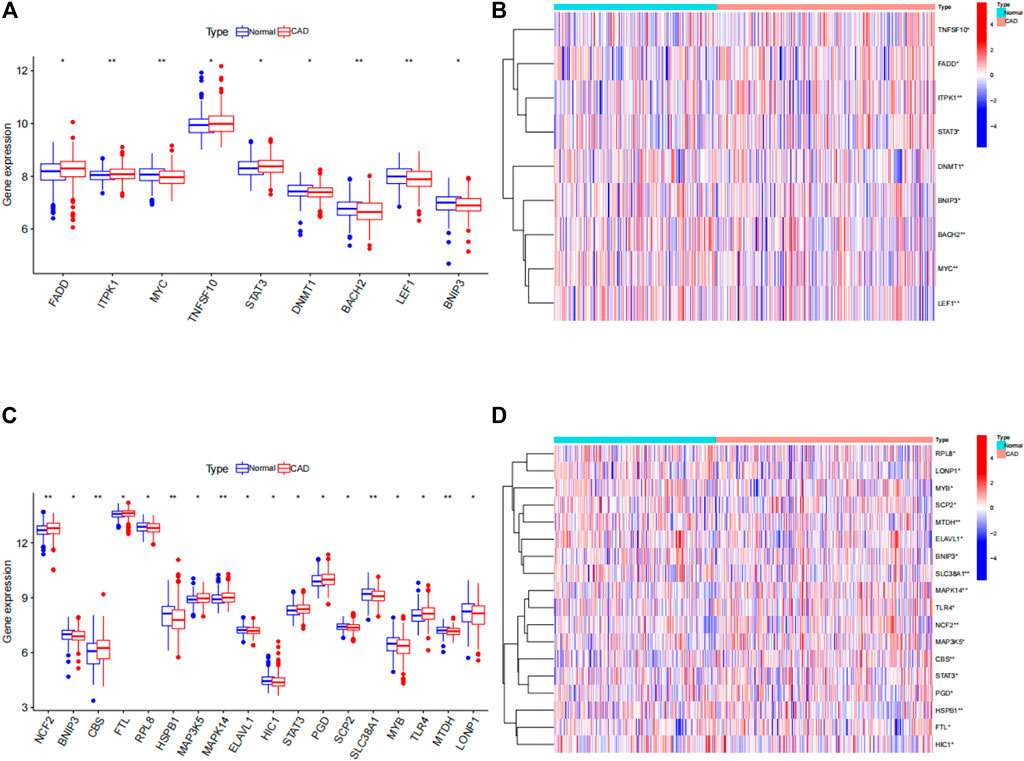
FIGURE 3. Differences in the expression of 25 ferroptosis- and necroptosis-related genes in control (con) and CAD (treat) groups. (A) Differential expression histogram of the nine necroptosis-related genes identified between controls and patients with CAD. (B) Expression heat map of the nine necroptosis-related genes in controls and patients with CAD. (C) Differential expression histogram of the 18 ferroptosis-related genes identified between controls and patients with CAD. (D) Expression heatmap of the 18 ferroptosis-related genes in controls and patients with CAD. *p < 0.05, **p < 0.01, and ***p < 0.001.
Two subtypes were identified based on the expression of ferroptosis- and necroptosis-related DEGs
Using the “ConsensusClusterPlus” package in R software, we performed consensus clustering to identify two subgroups (cluster A and cluster B) based on the expression of the 25 significant ferroptosis- and necroptosis-related DEGs in all CAD samples (n = 352) (Figures 4A–F, Supplementary Table S3). Cluster A included 141 cases, whereas cluster B included 211 cases. The heat map and box plot were then used to depict the differential expression levels of the 25 significant ferroptosis- and necroptosis-related DEGs between the cluster A and B (Figures 5A,B). NCF2, CBS, FTL, MAP3K5, MAPK14, STAT3, PGD, TLR4, FADD, ITPK1, and TNFSF10 were all expressed at higher levels in cluster A than in cluster B, whereas RPL8, HSPB1, ELAVL1, HIC1, SCP2, SLC38A1, MTDH, LONP1, MYC, DNMT1, BACH2, and LEF1 showed the opposite trends. There were no significant differences in ELAVL1, HIC1, or MYB expression between cluster A and cluster B. According to PCA, the expression of the 25 significant ferroptosis- and necroptosis-related DEGs could fully separate the cluster A and B (Figure 5C). Between the cluster A and B, 91 DEGs were identified (Figure 6A; Table 1). To elucidate the potential mechanisms through which 91 DEGs contributed to CAD, we used GO functional enrichment analysis and illustrated the findings using an enrichment circle diagram (Figures 6B–E, Supplementary Table S4). We found that the majority of upregulated genes in cluster A were enriched in GO:0043312 (neutrophil degranulation), GO:0002283 (neutrophil activation involved in immune response), GO:0002446 (neutrophil mediated immunity), and GO:0042119 (neutrophil activation), whereas the majority of upregulated genes in cluster B were enriched in GO:0050851 (antigen receptor-mediated signaling pathway), GO:0050853 (B cell receptor signaling pathway), GO:0002429 (immune response-activating cell surface receptor signaling pathway), and GO:0002757 (immune response-activating signal transduction). All of these categories were associated with inflammation.
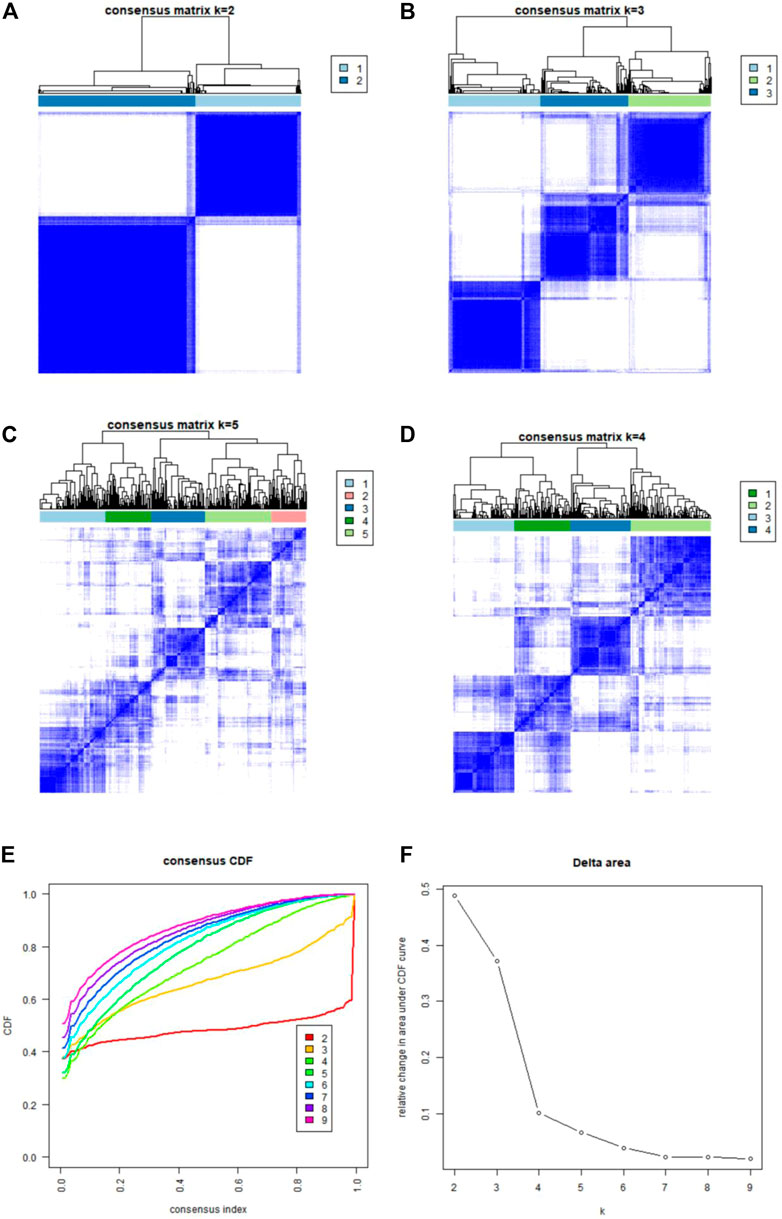
FIGURE 4. Consensus clustering of the 25 ferroptosis- and necroptosis-related genes in patients with CAD. (A–D) Consensus matrices of the 25 ferroptosis- and necroptosis-related genes for k = 2–5. (E) CDF curve for k = 2–9. (F) Delta area scores of the CDF curve for k = 2–9.
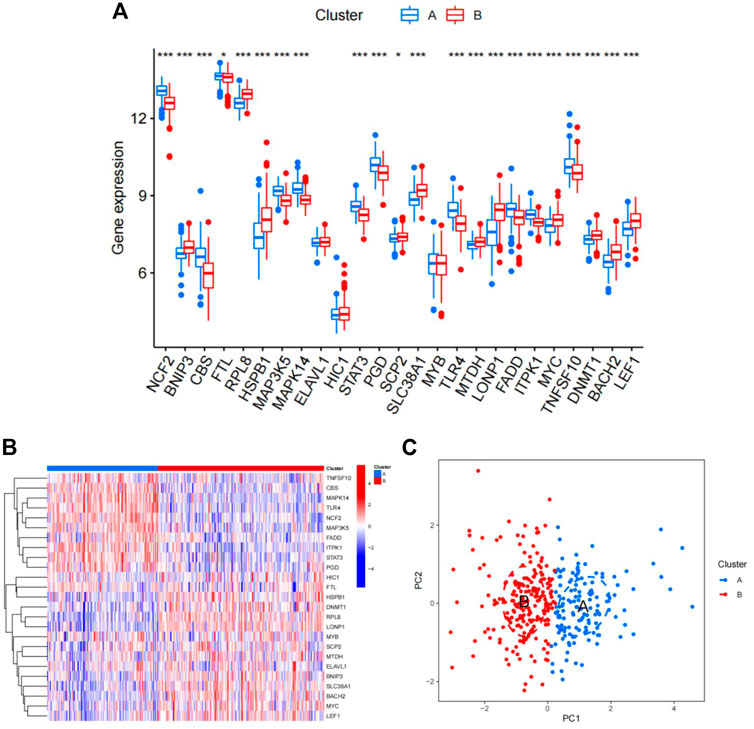
FIGURE 5. Differences in the expression of 25 ferroptosis- and necroptosis-related genes in cluster A and cluster B. (A) Differential expression histogram of the 25 ferroptosis- and necroptosis-related genes in cluster A and cluster B. Red: cluster B; blue: cluster A. (B) Expression heat map of the 25 ferroptosis- and necroptosis-related genes in cluster A and cluster B. Red: cluster B; blue: cluster A; red: high expression; blue: low expression. (C) Principal component analysis of the expression profiles of the 25 ferroptosis- and necroptosis-related genes, demonstrating marked differences in transcriptomes between cluster A and cluster B. Red: cluster B; blue: cluster A. Each dot represents a sample.
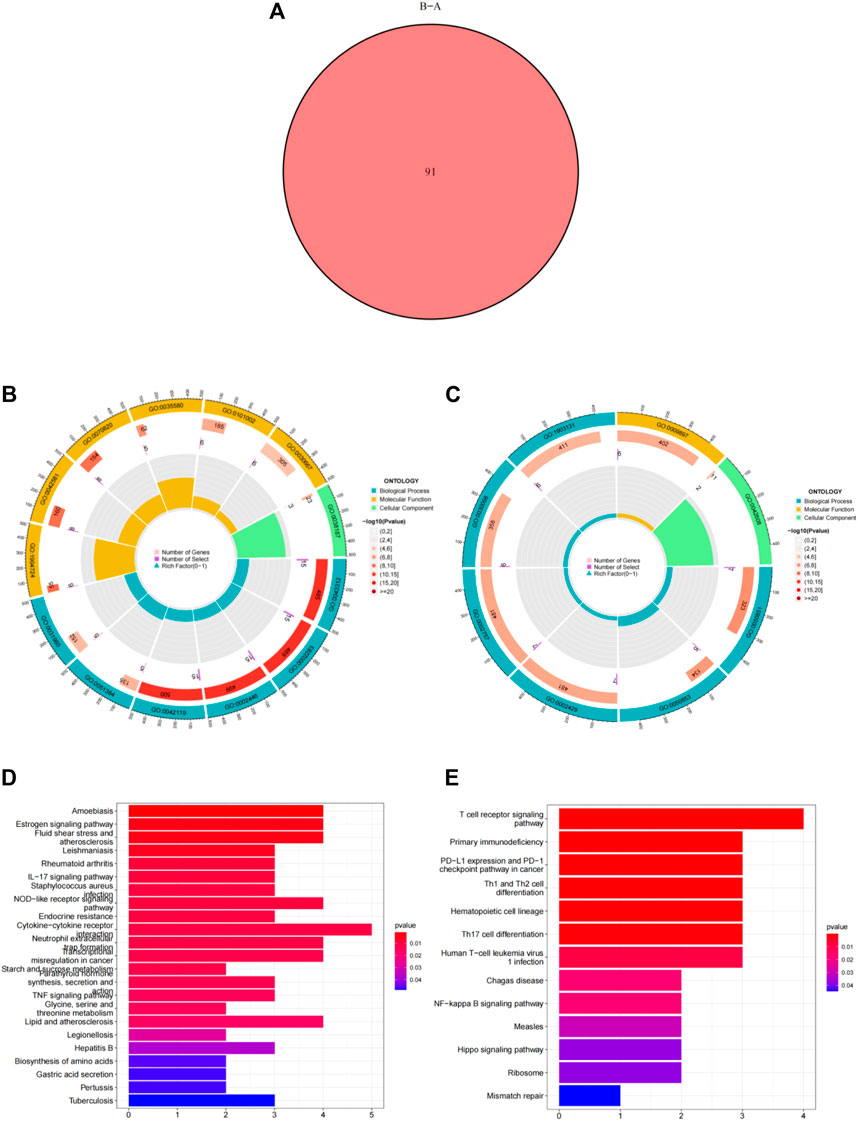
FIGURE 6. Differentially expressed genes (DEGs) and enrichment analysis between cluster A and cluster B. (A) Venn diagram representing the intersection of DEGs between cluster A and cluster B. (B) Gene ontology analysis of upregulated DEGs in cluster A. (C) Gene ontology analysis of upregulated DEGs in cluster B. (D) Kyoto Encyclopedia of Genes and Genomes analysis of the upregulated DEGs in cluster A. (E) Kyoto Encyclopedia of Genes and Genomes analysis of upregulated DEGs in cluster B.
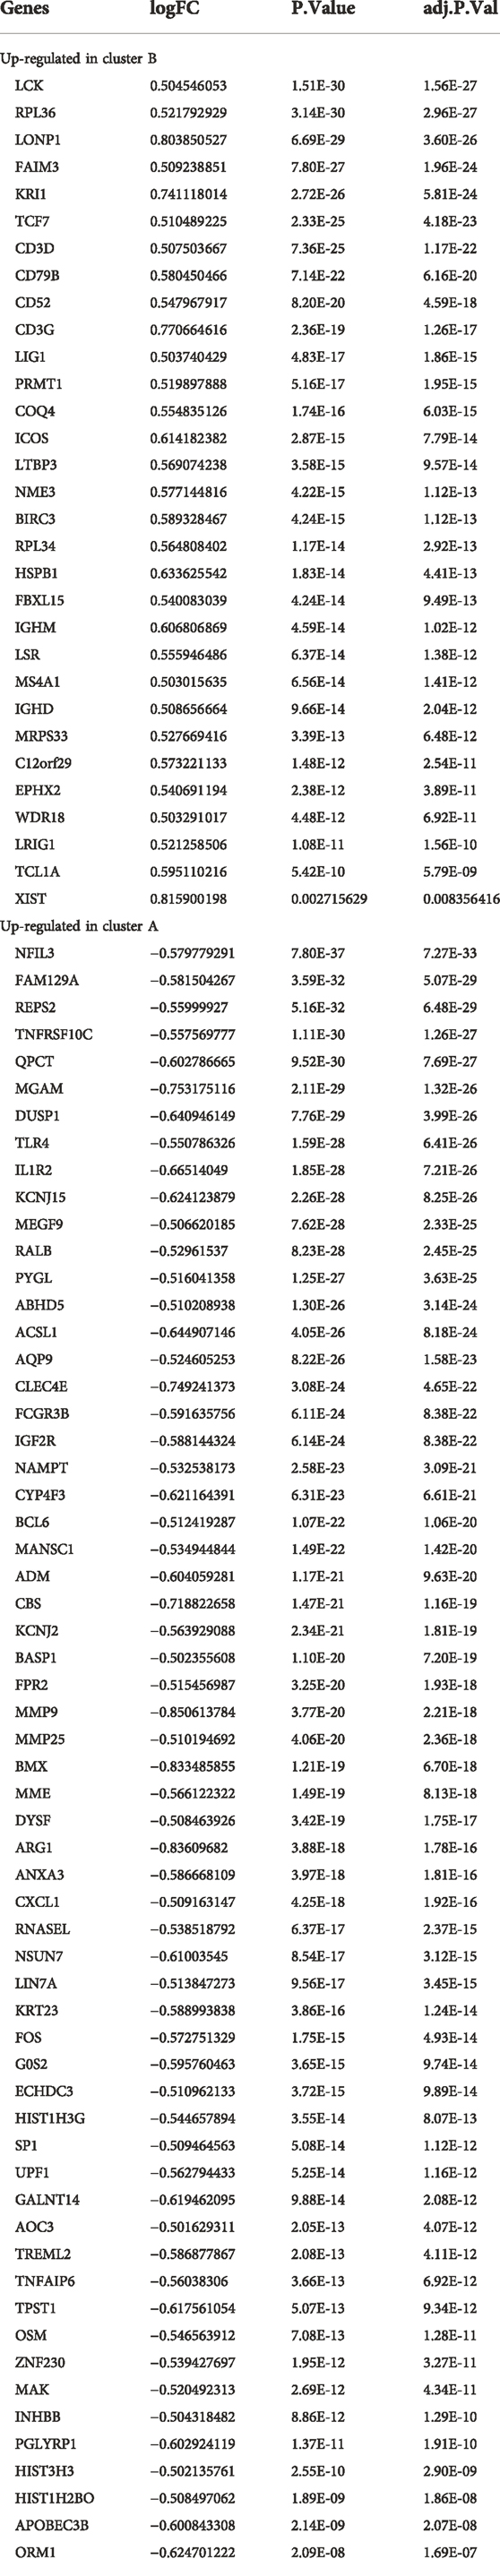
TABLE 1. Differential genes between cluster A and cluster B.
The abundance of immune cells in CAD samples was then calculated using ssGSEA (Supplementary Table S5), and the associations between the 25 significant ferroptosis- and necroptosis-related DEGs and immune cells were investigated by correlation test with spearman method. We found that NCF2, CBS, FTL, MAP3K5, MAPK14, STAT3, PGD, TLR4, FADD, ITPK1, and TNFSF10 all exhibited positive relationships with various types of immune cells, particularly neutrophils (Figure 7B). We then investigated the differences in immune cell infiltration between patients with high and low expression of NCF2, CBS, FTL, MAP3K5, MAPK14, STAT3, PGD, TLR4, FADD, ITPK1, and TNFSF10. The findings indicate that patients with elevated levels of NCF2, CBS, FTL, MAP3K5, MAPK14, STAT3, PGD, TLR4, FADD, ITPK1, and TNFSF10 showed greater infiltration of immune cells than those with low levels (Supplementary Figure S1A–K). Finally, we analyzed the differential infiltration of immune cells between the two subgroups (Figure 7A). Cluster A was found to be closely connected with several types of inflammatory cells, suggesting that the infiltration of various immune cells plays a very important role in cluster A.
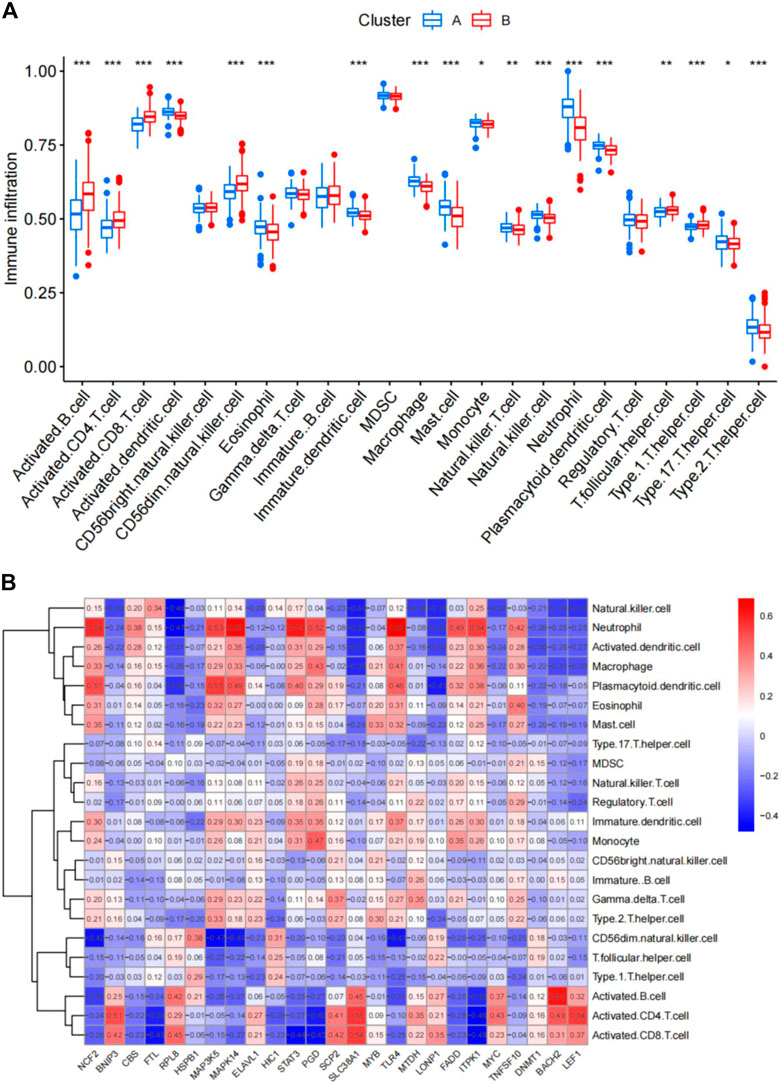
FIGURE 7. Single-sample gene set enrichment analysis. (A) Differential immune cell infiltration between cluster A and cluster B. (B) Correlation between infiltrating immune cells and the 25 ferroptosis- and necroptosis-related genes. *p < 0.05, **p < 0.01, and ***p < 0.001.
Comparison of the clinical characteristics of the two subgroups
Next, sex, age, and CAD index were gained in patients with CAD from the GSE12288 dataset and only sex were gained in patients with CAD from the GSE20681 dataset to identify the clinical features of the two subgroups. There are no useful clinical features in GSE20680 dataset. Specifically, there were no significant variations in the proportion of men or in age between clusters A and B (Figures 8A,B). Additionally, cluster A showed a higher CAD index than cluster B, indicating that individuals in cluster A may have greater disease severity (Figure 8C). We then conducted analysis of variance (ANOVA) to compare ages in the two subgroups and found that subgroup served as an age-independent predictor of the extent of CAD (Table 2, p < 0.05). These findings suggested that the subgroups based on 25 ferroptosis- and necroptosis-related DEGs may reflect not only the phases of CAD development but also the basic biological aspects of CAD.
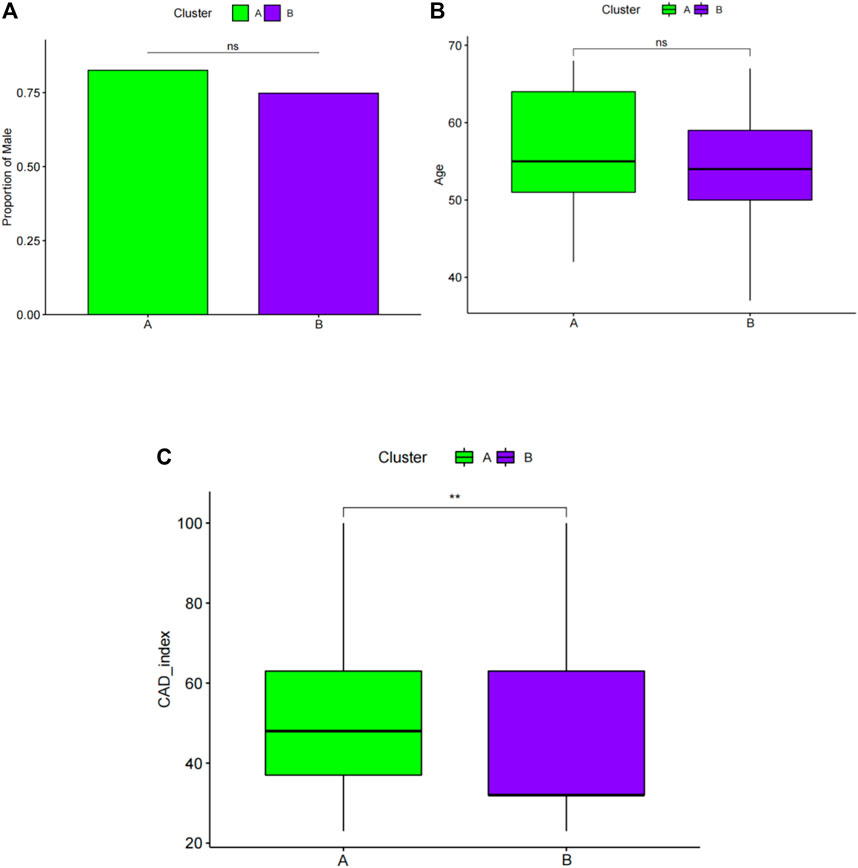
FIGURE 8. Pairwise comparisons of clinical characteristics between cluster A and cluster B. (A) The proportion of men in each subgroup is represented by the bar plot. Boxplots (B,C) display ages and CAD indices for subgroups. CAD: coronary artery disease. *p < 0.05, **p < 0.01, and ***p < 0.001.
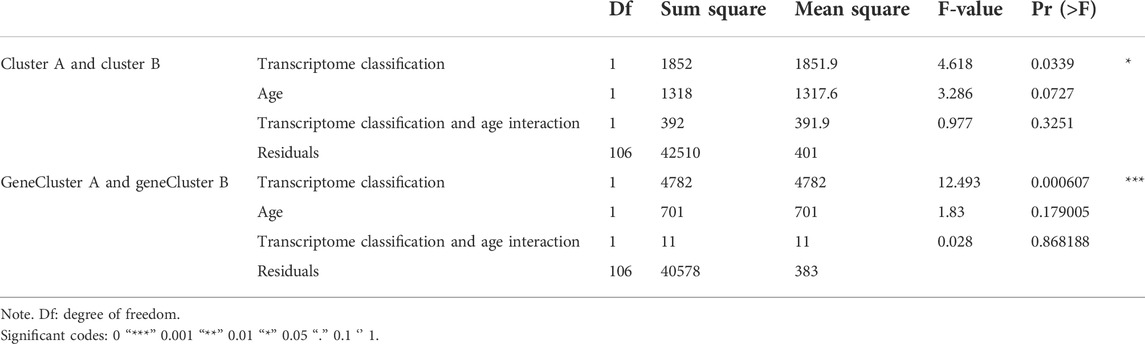
TABLE 2. The analysis of variance for the transcriptome classification, age, and their interaction.
Identification of two subgroup‐specific gene patterns and generation of the subgroup‐specific gene signature
To further confirm the four specific genes (Figure 9A) that determine typing, we performed consensus clustering to divide all CAD samples (n = 352) into gene cluster A and B based on the expression of the four subgroup-specific genes. We observed that the two subgroup-specific gene patterns (gene cluster A and gene cluster B; Supplementary Table S6) were consistent with clustering of ferroptosis- and necroptosis-related gene clusters (cluster A and B) (Figures 9B,C). According to our analysis, differences in subgroup-specific gene expression, immune cell infiltration (Figure 10C), and clinical features (Figures 11A–C) between gene cluster A and gene cluster B were likewise similar to above results in the cluster A and B. Additionally, individuals in gene cluster A were older and had higher CAD indices than individuals in gene cluster B (p < 0.001), indicating that disease may be more severe in individuals in gene cluster A. Additionally, we conducted ANOVA to compare ages and subgroups and found that subgroup was also an age-independent predictor (p < 0.05) (Table 2). This further confirmed the accuracy of our typing using the consensus clustering approach. We used PCA algorithms to calculate the subgroup-specific gene score for each sample in order to quantify the subgroup-specific gene clusters (Supplementary Table S7). The subgroup-specific gene score was then compared between the two separate ferroptosis- and necroptosis-related gene clusters or subgroup-specific gene clusters. The findings indicated that the subgroup-specific gene score was higher in cluster A or gene cluster A than in cluster B or gene cluster B (p < 0.05) (Figures 12A,B). Surprisingly, the subgroup-specific gene scores and CAD indices were greater in cluster A than in cluster B, indicating that these four genes may be critical in the progression of CAD. Additionally, all four of these genes were ferroptosis-related genes, indicating that ferroptosis played critical roles in controlling CAD progression. Interestingly, CBS and TLR4 were overexpressed in individuals with CAD and were therefore considered risk genes, whereas HSPB1 and LONP1 were overexpressed in normal individuals and were thus considered protective genes. According to the findings of the second typing, CBS and TLR4 were overexpressed in cluster A (p < 0.001), whereas HSPB1 and LONP1 were overexpressed in cluster B (p < 0.001). Thus, CBS and TLR4 may accelerate CAD advancement, whereas HSPB1 and LONP1 may suppress CAD progression, underscoring the importance of categorization in determining the degree of CAD. A Sankey diagram was used to depict the association between ferroptosis- and necroptosis-related gene patterns, subgroup-specific gene patterns, and subgroup-specific gene scores (Figure 12C).
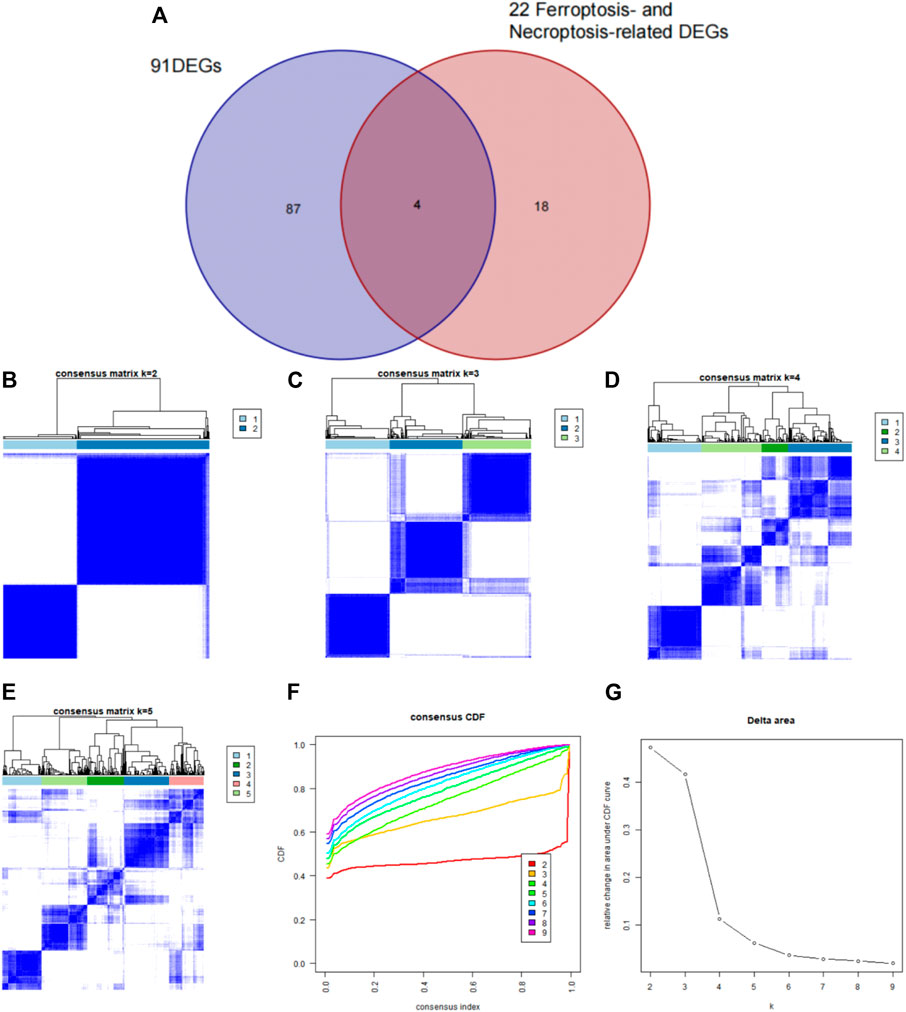
FIGURE 9. Identification of subgroup-specific genes in the two clusters and consensus clustering of the four subgroup-specific genes in patients with CAD. (A) The four subgroup‐specific genes were identified by intersection of 22 ferroptosis- and necroptosis-related DEGs and DEGs between the two clusters. (B–E) Consensus matrices of the four subgroup-specific genes for k = 2–5. (F) CDF curve for k = 2–9. (G) Delta area score of the CDF curve for k = 2–9.
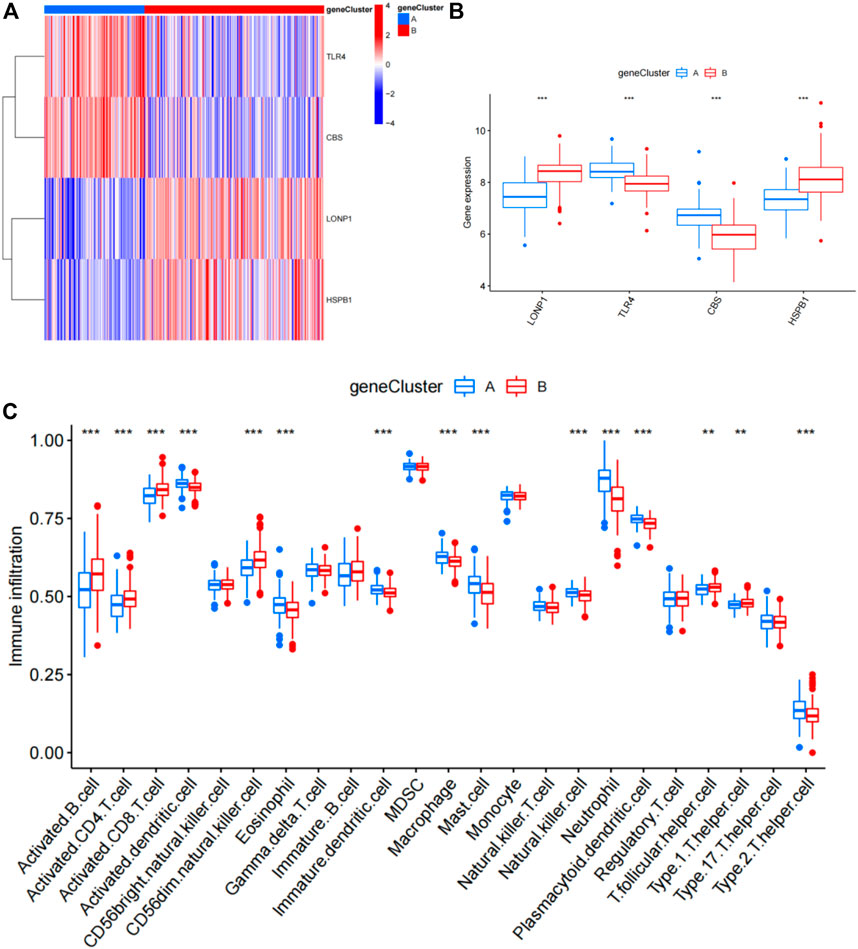
FIGURE 10. Differential analysis of four subgroup-specific genes and infiltrating immune cells between gene cluster A and gene cluster B. (A) Expression heat map of the four subgroup-specific genes in gene cluster A and gene cluster B. Red: gene cluster B; blue: gene cluster A; red: high expression; blue: low expression. (B) Differential expression histogram of the four subgroup-specific genes in gene cluster A and gene cluster B. Red: gene cluster B; blue: gene cluster A. (C) Differential immune cell infiltration between gene cluster A and gene cluster B. Red: gene cluster B; blue: gene cluster A.
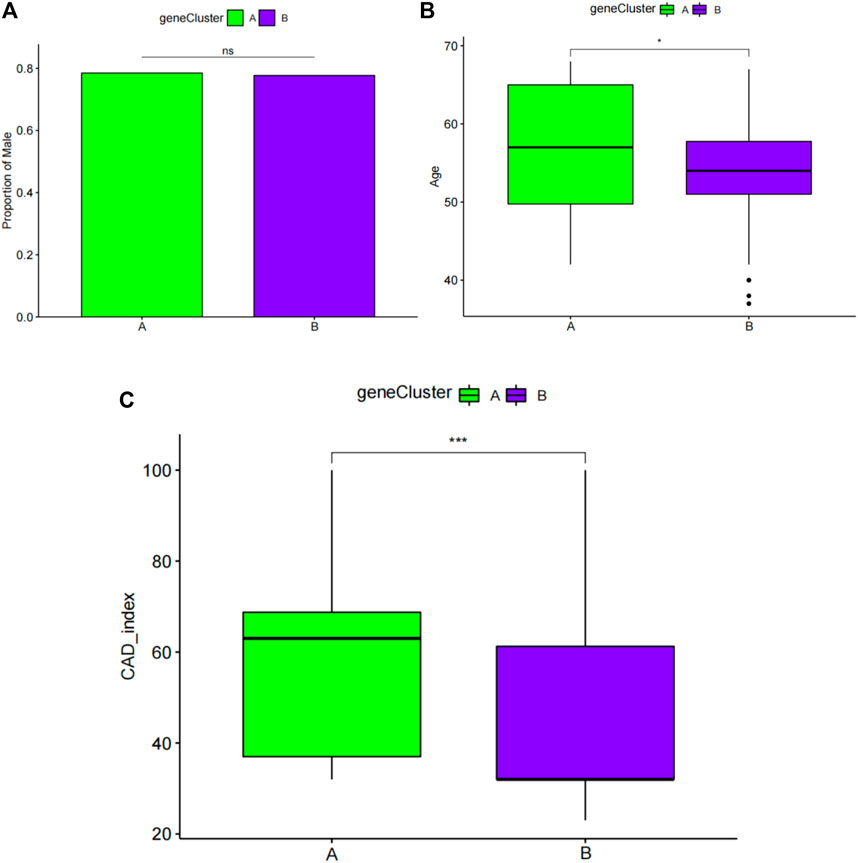
FIGURE 11. Pairwise comparisons of clinical characteristics between gene cluster A and gene cluster B. (A) The proportion of men in each subgroup is represented by the bar plot. Boxplots (B,C) display ages and CAD indices for the subgroups. CAD: coronary artery disease. *p < 0.05, **p < 0.01, and ***p < 0.001.
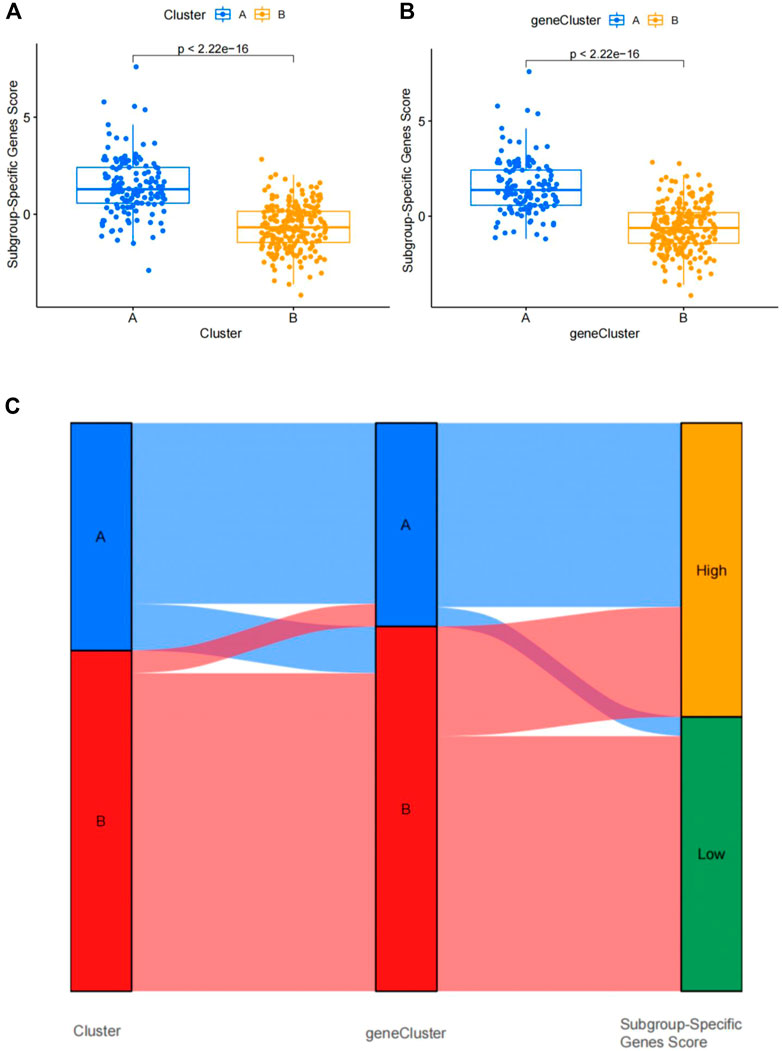
FIGURE 12. Differential analysis of four subgroup-specific gene scores between the two clusters. (A) Differences in four subgroup-specific gene scores between cluster A and cluster B. (B) Differences in four subgroup-specific gene scores between gene cluster A and gene cluster. p < 0.05 indicates significance. (C) Sankey diagram showing the relationships among clusters A and B, gene clusters A and B, and subgroup-specific scores.
Validation of 4 subgroup‐specific genes in the merged dataset and GSE180083 dataset
We used the dataset to validate differences in the 4 subgroup‐specific genes HSPB1, LONP1, CBS and TLR4 in the normal and CAD samples in the merged dataset and GSE180083 dataset. We found that CBS and TLR4 were significantly upregulated and HSPB1 and LONP1 were significantly downregulated in patients with CAD in merged dataset and GSE180083 dataset (Figures 13A–H). To determine the diagnostic accuracy of this model, the area under the receiver operating characteristic curve (ROC) was determined using the “'ROC'” package. The area under the curve (AUC) value of HSPB1, LONP1, CBS and TLR4 in GSE180083 dataset were 0.647, 0.624, 0.812, 0.825, respectively. The distinction was considered good when the area under the curve (AUC) value was between 0.8 and 0.9 and exceptional when the AUC value was greater than 0.9 (Rice and Harris, 2005).
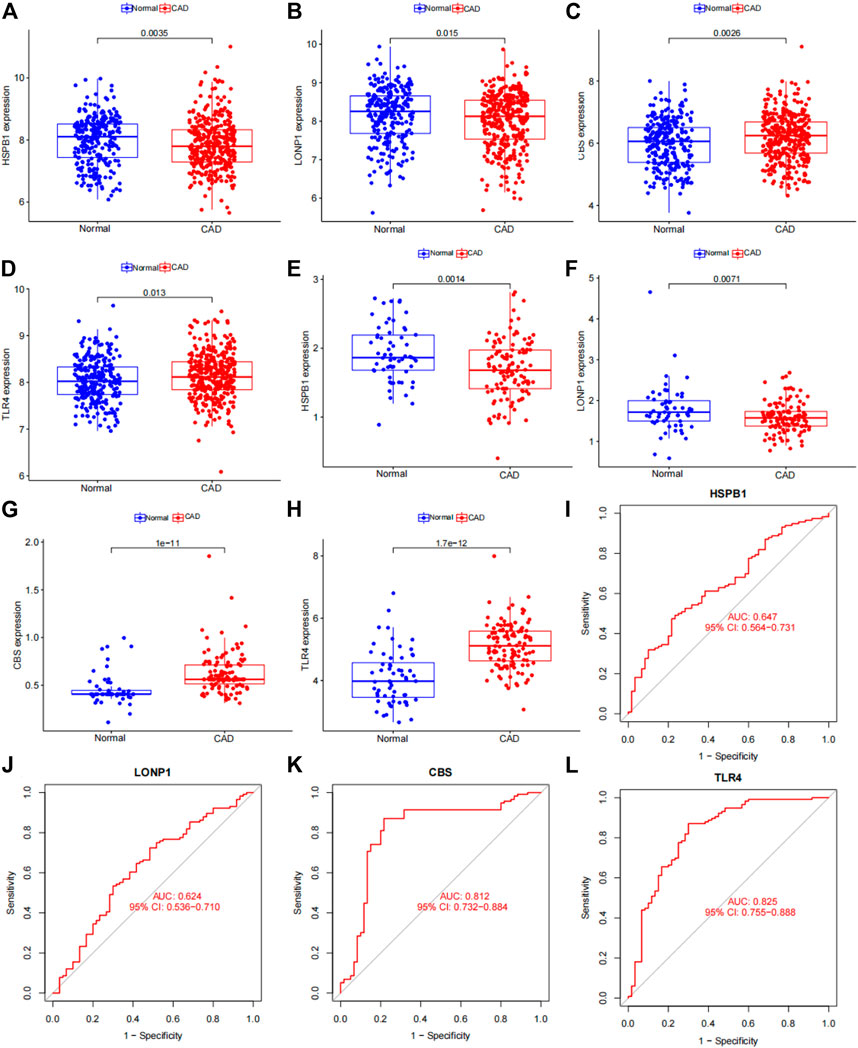
FIGURE 13. Verification of 4 subgroup-specific genes. (A) HSPB1 expression in patients with CAD samples compared with normal samples in the merged dataset. (B) LONP1 expression in patients with CAD samples compared with normal samples in the merged dataset. (C) CBS expression in patients with CAD samples compared with normal samples in the merged dataset. (D) TLR4 expression in patients with CAD samples compared with normal samples in the merged dataset. (E) HSPB1 expression in patients with CAD samples compared with normal samples in the GSE180083 dataset. (F) LONP1 expression in patients with CAD samples compared with normal samples in the GSE180083 dataset. (G) CBS expression in patients with CAD samples compared with normal samples in the GSE180083 dataset. (H) TLR4 expression in patients with CAD samples compared with normal samples in the GSE180083 dataset. (I) Performance of HSPB1 expression in CAD diagnosis in the test dataset. (J) Performance of LONP1 expression in CAD diagnosis in the GSE180083 dataset. (K) Performance of CBS expression in CAD diagnosis in the GSE180083 dataset. (L) Performance of TLR4 expression in CAD diagnosis in the GSE180083 dataset. The distinction was considered good when the AUC value was between 0.8 and 0.9 and exceptional when the AUC value was greater than 0.9. ROC: receiver operating characteristic; AUC, area under the ROC curve.
Discussion
Globally, CAD is a leading cause of death, with mortality predicted to reach 23.6 million by 2030 (Zhang L. et al., 2021). CAD is caused by various genetic and environmental factors, and the cumulative influence of these variables is critical. In this study, we investigated gene expression profiles from three GEO datasets of patients with CAD and normal controls. Additionally, we effectively divided the 352 patients with CAD into two clusters (clusters A and B) for the first time based on the expression of ferroptosis- and necroptosis-related DEGs. Further research identified functional modules or pathways unique to subgroups as a result of the categorization. Subsequently, we correctly categorized the 352 patients with CAD into gene clusters A and B for the second time based on the expression of four subgroup-specific genes. There was a significant correlation between clinical features and categorization. Moreover, when compared with the two gene clusters, patients in gene cluster A had a higher CAD index and were older, suggesting that gene cluster A was associated with more severe CAD. The typing results suggested that ferroptosis and necroptosis may play critical roles in CAD. Taken together, our results showed that categorization of patients with CAD was highly correlated with clinical features and certain functional modules or pathways.
Earlier studies have only explored the heterogeneity between subtypes (Peng et al., 2019; Zhang B. et al., 2021) and have not evaluated the molecular mechanisms responsible for this heterogeneity. The current study is the first to identify differences between subtypes based on ferroptosis- and necroptosis-related genes and to explore the associations between specific pathways and clinical characteristics in individuals with CAD within specific subgroups. We further performed functional enrichment analysis of the two clusters and found that the upregulated genes in cluster A were mainly enriched in neutrophil-related biological processes. According to current research, neutrophils are short-lived phagocytic cells expressing a wide range of physiologically active enzymes, including myeloperoxidases and proteinases. Leukocytosis and neutrophilia are independent risk factors for CAD. Additionally, C-X-C chemokine motif receptor 4 (CXCR4) and its ligand C-X-C chemokine ligand 12 play roles in neutrophil egress from the bone marrow and control neutrophil recruitment to atherosclerotic lesions (Zernecke et al., 2008). Chronic CXCR4 inhibition induces neutrophilia and increases the number of neutrophils in plaques, both of which are linked to apoptosis and a pro-inflammatory phenotype, suggesting that neutrophils may have pro-inflammatory roles in atherosclerosis (Zernecke et al., 2008). Furthermore, we found that cluster A was mainly related to neutrophils by contributing to the inflammatory response in atherosclerosis, suggesting that neutrophil-related pathways, which lead to further inflammatory infiltration, could explain the differences in CAD indices between the clusters. Neutrophil activation is involved in the immunological response, neutrophil-mediated immunity, and atherosclerosis development. In this study, we observed associations among older age, neutrophil pathway activation, and disease severity in cluster A, indicating that an aberrant neutrophil pathway in older patients with CAD may result in severe disease. In addition, upregulated genes in cluster B were mainly enriched in the B-cell receptor signaling pathway and antigen receptor-mediated signaling pathway. B cells were initially detected inside the adventitia in atherosclerotic lesions, and immunoglobulin-positive cells were identified within atherosclerotic plaques (Galkina and Ley, 2007a). The functions of B cells in mediating the immune response in atherosclerosis have recently been investigated. Splenectomy was shown to exacerbate atherosclerosis in ApoE−/− mice, accompanied by a decrease in anti-ox-LDL antibody levels. Adoptive transfer of splenic B cells from atherosclerosis-prone ApoE−/− animals into young ApoE−/− recipients was also shown to prevent atherosclerosis (Caligiuri et al., 2002). These findings suggest that atheroprotective immunity may expand during the development of atherosclerosis and that B cells or their immunoglobulin products may play protective roles. From these results, we inferred that the severity of CAD was lower in individuals in cluster B than in those in cluster A, mainly because of the protective effects of B cells. In addition, the typing results showed that the main genes highly expressed in cluster A were ferroptosis-related genes (e.g., NCF2, CBS, FTL, MAP3K5, MAPK14, STAT3, PGD, and TLR4); thus, ferroptosis was closely associated with the progression of CAD. Current research indicates that ferroptosis and necroptosis differ in morphological characteristics, developmental steps, and key regulators, inducers, and inhibitors. Nonetheless, accumulating evidence suggests that significant cross-talk exists between ferroptosis and necroptosis (Fearns et al., 2006; Xu et al., 2017; Maher et al., 2018; Wang et al., 2018; Proneth and Conrad, 2019; Zhou et al., 2020; Chen C. et al., 2021). In this research, although the last significant genes identified in the analysis were all related to ferroptosis, it cannot be ruled out that necroptosis plays a similar role. The mechanism of the interaction between necroptosis and ferroptosis in CAD should be further investigated. Elucidating this mechanism could provide new perspectives to support advances in CAD treatment.
In addition, with additional exploration of the mechanisms of CAD, monocytes (Lessner et al., 2002), macrophages (Stoneman et al., 2007), mast cells (Bot et al., 2007), neutrophils (Zernecke et al., 2008), T cells (Galkina and Ley, 2007b), natural killer cells (Schiller et al., 2002), and dendritic cells (Bobryshev and Lord, 1995) have been found to be closely associated with the development and progression of CAD. According to the results of our analysis by ssGSEA, the proportion of most immune cells in cluster A was significantly increased, which further explained the severity of the CAD disease in cluster A and also further confirming that the severity of CAD may be associated with degree of immune cell infiltration. Furthermore, by studying the correlations of ferroptosis- and necroptosis-related DEGs with immune cells, we were surprised to find high expression in cluster A and that all DEGs were positively correlated with the aforementioned immune cells and functioned to promote the infiltration of various immune cells. Therefore, we further confirmed the important roles of ferroptosis and necroptosis in CAD progression as reported in Dominic (Del Re et al., 2019).
In this study, we next evaluated DEGs among different subgroups and found that all four significant genes were ferroptosis-related genes. To further validate the roles of these four genes in CAD progression, we typed the four genes and found that the results of typing, clinical features, and immune cell differences between typing were highly similar to the previous typing results, demonstrating the significant roles of these four genes in CAD progression. LONP1 is an important mitochondrial target that is regulated by lipid-induced protein kinase R-like endoplasmic reticulum kinase/eukaryotic initiation factor 2α signaling in macrophages and in lesions (Tian et al., 2011; Crewe et al., 2017). Acute cell stresses, such as hypoxia, oxidative stress, food restriction, and the unfolded protein response at the endoplasmic reticulum, have been found to upregulate LonP1 (Hori et al., 2002; Sepuri et al., 2017). Venkatesh et al. (Venkatesh et al., 2019) showed that LonP1 is an endogenous cardioprotective mediator. Furthermore, overexpression of LonP1 protects the heart from injury by limiting oxidative damage to proteins and lipids, maintaining mitochondrial redox equilibrium, and reprogramming bioenergetics by decreasing complex I content and activity. Mechanisms that enhance LonP1 expression may protect the myocardium from cardiac stress and ischemia/reperfusion damage. Thus, the abovementioned results demonstrate that upregulation of LONP1 may inhibit the progression of CAD. HSPB1 is a well-known small heat shock protein that works as an oligomer and phosphorylated dimer (Mohammad et al., 2018). In rat cardiomyocytes, HSPB1 improves the reductive activity of endogenous glutathione (GSH) reductase/GSH/GSH peroxidase and thioredoxin/peroxiredoxin antioxidant systems, confirming its role in protein oxidation resistance (Liu et al., 2019). Kraemer et al. showed that HSPB1 is upregulated and phosphorylated in ST-elevation myocardial infarction platelets. Additionally, expression of HSPB1 in cardiomyocytes is necessary for wound healing after myocardial infarction, suggesting that this protein may be a target for enhancement of repair after myocardial infarction (Wang et al., 2019). Notably, HSPB1 generates homologous oxidized HSPB1 as a result of its own unique cysteine and subsequently acts as an antioxidant in vitro (Rajagopal et al., 2015). Thus, the abovementioned results also demonstrate that upregulation of HSPB1 may inhibit the progression of CAD. The results of our study showed that LONP1 and HSPB1 were significantly upregulated in cluster B and that the severity of CAD was lower in cluster B than in cluster A, further demonstrating the protective roles of LONP1 and HSPB1 in the progression of CAD. However, this requires our follow-up further experiments to confirm the specific protective mechanism of these two genes in CAD progression.
Interestingly, our analysis also found two genes that were significantly elevated in CAD samples, CBS and TLR4. CBS is a critical enzyme involved in the trans-sulfuration pathway via catabolism of homocysteine (Hcy). Mutations in CBS have been found in homocystinuric individuals and are related to thrombosis and increased plasma Hcy levels (Gaustadnes et al., 2000). Furthermore, Hcy increases atherogenesis by promoting vascular smooth muscle cell proliferation (Tsai et al., 1996), limiting endothelial cell growth and re-endothelialization after damage, decreasing endothelial relaxation, accelerating neointimal formation (Wang et al., 1997; Wang et al., 2002), and reducing high-density lipoprotein production (Liao et al., 2006). The immunological response elicited by Hcy is intricately associated with cardiovascular disease. Thus, upregulation of CBS promotes the onset and progression of CAD. TLR4 is a member of the Toll-like receptor (TLR) family and is involved in the progression of atherosclerosis, including monocyte activation, endothelial cell injury, vascular smooth muscle cell fibrosis, and macrophage and foam cell production (Xu et al., 2001). TLR4 expression is higher in CAD plaques than in controls (Edfeldt et al., 2002). In hypercholesterolemic ApoE−/− mice, TLR4 knockout reduces lesion size, lipid content, and macrophage infiltration (Michelsen et al., 2004; Choi et al., 2009). Additionally, in diabetic ApoE−/− mice, administration of TLR4 antagonist reduces atherosclerotic lesions, blocks inflammatory molecule production, and decreases monocyte and macrophage content (Lu et al., 2013). Under lipid-rich conditions, endogenous TLR4 ligands activate monocytes and macrophages, causing widespread membrane ruffling, macropinocytosis, lipoprotein uptake, and foam cell production (Howell et al., 2011; Liu et al., 2012). The TLR4 signaling pathway is a potential anti-inflammatory and anti-atherosclerosis target. Importantly, TLR4 expression has been reported to be strongly correlated with the severity of CAD, as reflected by the number of coronary stenoses, and may be a clinically useful biomarker of the risk of cardiovascular disease (Shao et al., 2014). Thus, upregulation of TLR4 is involved in promoting the onset and progression of CAD. Taken together, these findings suggested that TLR4 and CBS play key roles in the development of atherosclerosis. Therefore, blocking TLR4 and CBS signaling may be beneficial in the treatment of CAD. In addition, PCA demonstrated that the subgroup-specific gene scores in cluster A or gene cluster A was higher than that in cluster B or gene cluster B. Finally, we found that the subgroup-specific upregulated genes CBS and TLR4 were significantly upregulated in the disease group in the GSE180083 dataset and had very high diagnostic efficacy. Therefore, regarding the role of CBS and TLR4 in the progression of CAD, combined with the above-mentioned related research reports and the results of this study, it is confirmed that the two play an important role in the progression of CAD. And further study of their mechanism of action will provide favorable therapeutic targets for alleviating CAD progression.
Although our findings identified potential subgroups of patients with CAD based on molecular analyses of ferroptosis- and necroptosis-related genes and revealed the characteristics of each subtype, gene expression changes are not necessarily genetically driven or could be partially genetic and partially environmental. Additional, several limitations should be acknowledged. First, some clinical follow-up information was not available for the samples; therefore, we did not consider several important factors, such as the presence of patient comorbidities, when distinguishing among subgroups. Second, the consistency of the CAD subgroups should be confirmed using further analyses. Finally, the results were acquired only through bioinformatics analysis, and the results should be confirmed in further experiments.
Conclusion
High expression of CBS and TLR4 in CAD was associated with increased disease severity and may be promising diagnostic markers of CAD. By contrast, LONP1 and HSPB1 may delay CAD progression. The identification of genetic subgroups of patients with CAD has improved our understanding of the pathogenesis of CAD and has facilitated the development of potential methods for disease diagnosis, classification, and prognosis evaluation.
Data availability statement
The datasets presented in this study can be found in online repositories. The names of the repository/repositories and accession number(s) can be found in the article/Supplementary Material.
Author contributions
W-PL and PL was responsible for study conception; L-HQ, TX, and J-KW provided software; F-XH contributed to the methodology; W-PL and XZ wrote the original draft; and NW and F-QL contributed to reviewing and editing. All authors reviewed and approved the final version of the work.
Funding
This study was supported by the Key Industrial Innovation Chain Project in Shaanxi Province of China (grant no. 2021ZDLSF02-03), Science and Technology Program of Xi’an (grant no. 21YXYJ0095), and the Open Program of Shaanxi Key Laboratory of Integrative Traditional and Western Medicine for Prevention and Treatment of Cardiovascular Diseases, Shaanxi University of Chinese Medicine (grant no. 2022XXG-ZD-001).
Acknowledgments
GEO facilitated in the completion of this work. We would like to express our gratitude to the GEO network for freely sharing huge amounts of data.
Conflict of interest
The authors declare that the research was conducted in the absence of any commercial or financial relationships that could be construed as a potential conflict of interest.
Publisher’s note
All claims expressed in this article are solely those of the authors and do not necessarily represent those of their affiliated organizations, or those of the publisher, the editors and the reviewers. Any product that may be evaluated in this article, or claim that may be made by its manufacturer, is not guaranteed or endorsed by the publisher.
Supplementary material
The Supplementary Material for this article can be found online at: https://www.frontiersin.org/articles/10.3389/fgene.2022.870222/full#supplementary-material
References
Agha, G., Mendelson, M. M., Ward-Caviness, C. K., Joehanes, R., Huan, T., Gondalia, R., et al. (2019). Blood leukocyte DNA methylation predicts risk of future myocardial infarction and coronary heart disease. Circulation 140 (8), 645–657. doi:10.1161/CIRCULATIONAHA.118.039357
Bai, T., Li, M., Liu, Y., Qiao, Z., and Wang, Z. (2020). Inhibition of ferroptosis alleviates atherosclerosis through attenuating lipid peroxidation and endothelial dysfunction in mouse aortic endothelial cell. Free Radic. Biol. Med. 160, 92–102. doi:10.1016/j.freeradbiomed.2020.07.026
Beineke, P., Fitch, K., Tao, H., Elashoff, M. R., Rosenberg, S., Kraus, W. E., et al. (2012). A whole blood gene expression-based signature for smoking status. BMC Med. Genomics 5, 58. doi:10.1186/1755-8794-5-58
Bobryshev, Y. V., and Lord, R. S. (1995). Ultrastructural recognition of cells with dendritic cell morphology in human aortic intima. Contacting interactions of Vascular Dendritic Cells in athero-resistant and athero-prone areas of the normal aorta. Arch. Histol. Cytol. 58 (3), 307–322. doi:10.1679/aohc.58.307
Bot, I., de Jager, S. C., Zernecke, A., Lindstedt, K. A., van Berkel, T. J., Weber, C., et al. (2007). Perivascular mast cells promote atherogenesis and induce plaque destabilization in apolipoprotein E-deficient mice. Circulation 115 (19), 2516–2525. doi:10.1161/CIRCULATIONAHA.106.660472
Caligiuri, G., Nicoletti, A., Poirier, B., and Hansson, G. K. (2002). Protective immunity against atherosclerosis carried by B cells of hypercholesterolemic mice. J. Clin. Invest. 109 (6), 745–753. doi:10.1172/JCI7272
Chen, C., Wang, D., Yu, Y., Zhao, T., Min, N., Wu, Y., et al. (2021). Legumain promotes tubular ferroptosis by facilitating chaperone-mediated autophagy of GPX4 in AKI. Cell Death Dis. 12 (1), 65. doi:10.1038/s41419-020-03362-4
Chen, Q., Kang, J., and Fu, C. (2018). The independence of and associations among apoptosis, autophagy, and necrosis. Signal Transduct. Target. Ther. 3, 18. doi:10.1038/s41392-018-0018-5
Chen, Z., Zhou, D., Zhang, X., Wu, Q., and Wu, G. (2021). Diagnostic biomarkers and potential drug targets for coronary artery disease as revealed by systematic analysis of lncRNA characteristics. Ann. Transl. Med. 9 (15), 1243. doi:10.21037/atm-21-3276
Chiu, M. H., Heydari, B., Batulan, Z., Maarouf, N., Subramanya, V., Schenck-Gustafsson, K., et al. (2018). Coronary artery disease in post-menopausal women: Are there appropriate means of assessment? Clin. Sci. 132 (17), 1937–1952. doi:10.1042/CS20180067
Choi, S. H., Harkewicz, R., Lee, J. H., Boullier, A., Almazan, F., Li, A. C., et al. (2009). Lipoprotein accumulation in macrophages via toll-like receptor-4-dependent fluid phase uptake. Circ. Res. 104 (12), 1355–1363. doi:10.1161/CIRCRESAHA.108.192880
Crewe, C., Schafer, C., Lee, I., Kinter, M., and Szweda, L. I. (2017). Regulation of pyruvate dehydrogenase kinase 4 in the heart through degradation by the lon protease in response to mitochondrial substrate availability. J. Biol. Chem. 292 (1), 305–312. doi:10.1074/jbc.M116.754127
Davies, A., Fox, K., Galassi, A. R., Banai, S., Yla-Herttuala, S., and Luscher, T. F. (2021). Management of refractory angina: An update. Eur. Heart J. 42 (3), 269–283. doi:10.1093/eurheartj/ehaa820
Del Re, D. P., Amgalan, D., Linkermann, A., Liu, Q., and Kitsis, R. N. (2019). Fundamental mechanisms of regulated cell death and implications for heart disease. Physiol. Rev. 99 (4), 1765–1817. doi:10.1152/physrev.00022.2018
Ding, W., Chen, G., and Shi, T. (2019). Integrative analysis identifies potential DNA methylation biomarkers for pan-cancer diagnosis and prognosis. Epigenetics 14 (1), 67–80. doi:10.1080/15592294.2019.1568178
Divine, G., Norton, H. J., Hunt, R., and Dienemann, J. (2013). Statistical grand rounds: a review of analysis and sample size calculation considerations for wilcoxon tests. Anesth. Analg. 117 (3), 699–710. doi:10.1213/ANE.0b013e31827f53d7
Edfeldt, K., Swedenborg, J., Hansson, G. K., and Yan, Z. Q. (2002). Expression of toll-like receptors in human atherosclerotic lesions: a possible pathway for plaque activation. Circulation 105 (10), 1158–1161. doi:10.1161/circ.105.10.1158
Fearns, C., Pan, Q., Mathison, J. C., and Chuang, T. H. (2006). Triad3A regulates ubiquitination and proteasomal degradation of RIP1 following disruption of Hsp90 binding. J. Biol. Chem. 281 (45), 34592–34600. doi:10.1074/jbc.M604019200
Felker, G. M., Shaw, L. K., and O'Connor, C. M. (2002). A standardized definition of ischemic cardiomyopathy for use in clinical research. J. Am. Coll. Cardiol. 39 (2), 210–218. doi:10.1016/s0735-1097(01)01738-7
Franchini, M. (2016). Genetics of the acute coronary syndrome. Ann. Transl. Med. 4 (10), 192. doi:10.21037/atm.2016.02.12
Galkina, E., and Ley, K. (2007a). Leukocyte influx in atherosclerosis. Curr. Drug Targets 8 (12), 1239–1248. doi:10.2174/138945007783220650
Galkina, E., and Ley, K. (2007b). Vascular adhesion molecules in atherosclerosis. Arterioscler. Thromb. Vasc. Biol. 27 (11), 2292–2301. doi:10.1161/ATVBAHA.107.149179
Gaustadnes, M., Rudiger, N., Rasmussen, K., and Ingerslev, J. (2000). Intermediate and severe hyperhomocysteinemia with thrombosis: a study of genetic determinants. Thromb. Haemost. 83 (4), 554–558. doi:10.1055/s-0037-1613862
Hori, O., Ichinoda, F., Tamatani, T., Yamaguchi, A., Sato, N., Ozawa, K., et al. (2002). Transmission of cell stress from endoplasmic reticulum to mitochondria: enhanced expression of lon protease. J. Cell Biol. 157 (7), 1151–1160. doi:10.1083/jcb.200108103
Howell, K. W., Meng, X., Fullerton, D. A., Jin, C., Reece, T. B., and Cleveland, J. C. (2011). Toll-like receptor 4 mediates oxidized LDL-induced macrophage differentiation to foam cells. J. Surg. Res. 171 (1), e27–31. doi:10.1016/j.jss.2011.06.033
Lessner, S. M., Prado, H. L., Waller, E. K., and Galis, Z. S. (2002). Atherosclerotic lesions grow through recruitment and proliferation of circulating monocytes in a murine model. Am. J. Pathol. 160 (6), 2145–2155. doi:10.1016/S0002-9440(10)61163-7
Li, J., Cao, F., Yin, H. L., Huang, Z. J., Lin, Z. T., Mao, N., et al. (2020). Ferroptosis: past, present and future. Cell Death Dis. 11 (2), 88. doi:10.1038/s41419-020-2298-2
Liao, D., Tan, H., Hui, R., Li, Z., Jiang, X., Gaubatz, J., et al. (2006). Hyperhomocysteinemia decreases circulating high-density lipoprotein by inhibiting apolipoprotein A-I Protein synthesis and enhancing HDL cholesterol clearance. Circ. Res. 99 (6), 598–606. doi:10.1161/01.RES.0000242559.42077.22
Liu, R., He, Y., Li, B., Liu, J., Ren, Y., Han, W., et al. (2012). Tenascin-C produced by oxidized LDL-stimulated macrophages increases foam cell formation through Toll-like receptor-4. Mol. Cells 34 (1), 35–41. doi:10.1007/s10059-012-0054-x
Liu, X., Liu, K., Li, C., Cai, J., Huang, L., Chen, H., et al. (2019). Heat-shock protein B1 upholds the cytoplasm reduced state to inhibit activation of the Hippo pathway in H9c2 cells. J. Cell. Physiol. 234 (4), 5117–5133. doi:10.1002/jcp.27322
Lu, Z., Zhang, X., Li, Y., Jin, J., and Huang, Y. (2013). TLR4 antagonist reduces early-stage atherosclerosis in diabetic apolipoprotein E-deficient mice. J. Endocrinol. 216 (1), 61–71. doi:10.1530/JOE-12-0338
Madhavan, M. V., Gersh, B. J., Alexander, K. P., Granger, C. B., and Stone, G. W. (2018). Coronary artery disease in Patients ≥80 Years of age. J. Am. Coll. Cardiol. 71 (18), 2015–2040. doi:10.1016/j.jacc.2017.12.068
Maher, P., van Leyen, K., Dey, P. N., Honrath, B., Dolga, A., and Methner, A. (2018). The role of Ca(2+) in cell death caused by oxidative glutamate toxicity and ferroptosis. Cell Calcium 70, 47–55. doi:10.1016/j.ceca.2017.05.007
McCaffrey, T. A., Toma, I., Yang, Z., Katz, R., Reiner, J., Mazhari, R., et al. (2021). RNA sequencing of blood in coronary artery disease: involvement of regulatory T cell imbalance. BMC Med. Genomics 14 (1), 216. doi:10.1186/s12920-021-01062-2
Michelsen, K. S., Wong, M. H., Shah, P. K., Zhang, W., Yano, J., Doherty, T. M., et al. (2004). Lack of Toll-like receptor 4 or myeloid differentiation factor 88 reduces atherosclerosis and alters plaque phenotype in mice deficient in apolipoprotein E. Proc. Natl. Acad. Sci. U. S. A. 101 (29), 10679–10684. doi:10.1073/pnas.0403249101
Mohammad, M. A., Karlsson, S., Haddad, J., Cederberg, B., Jernberg, T., Lindahl, B., et al. (2018). Christmas, national holidays, sport events, and time factors as triggers of acute myocardial infarction: SWEDEHEART observational study 1998-2013. BMJ 363, k4811. doi:10.1136/bmj.k4811
Moran, A., Zhao, D., Gu, D., Coxson, P., Chen, C. S., Cheng, J., et al. (2008). The future impact of population growth and aging on coronary heart disease in China: projections from the coronary heart disease policy model-China. BMC Public Health 8, 394. doi:10.1186/1471-2458-8-394
Musunuru, K., and Kathiresan, S. (2019). Genetics of common, complex coronary artery disease. Cell 177 (1), 132–145. doi:10.1016/j.cell.2019.02.015
Peng, X. Y., Wang, Y., Hu, H., Zhang, X. J., and Li, Q. (2019). Identification of the molecular subgroups in coronary artery disease by gene expression profiles. J. Cell. Physiol. 234, 16540–16548. doi:10.1002/jcp.28324
Proneth, B., and Conrad, M. (2019). Ferroptosis and necroinflammation, a yet poorly explored link. Cell Death Differ. 26 (1), 14–24. doi:10.1038/s41418-018-0173-9
Rajagopal, P., Liu, Y., Shi, L., Clouser, A. F., and Klevit, R. E. (2015). Structure of the α-crystallin domain from the redox-sensitive chaperone, HSPB1. J. Biomol. NMR 63 (2), 223–228. doi:10.1007/s10858-015-9973-0
Rice, M. E., and Harris, G. T. (2005). Comparing effect sizes in follow-up studies: ROC area, cohen's d, and r. Law Hum. Behav. 29 (5), 615–620. doi:10.1007/s10979-005-6832-7
Ritchie, M. E., Phipson, B., Wu, D., Hu, Y., Law, C. W., Shi, W., et al. (2015). Limma powers differential expression analyses for RNA-sequencing and microarray studies. Nucleic Acids Res. 43 (7), e47. doi:10.1093/nar/gkv007
Schiller, N. K., Boisvert, W. A., and Curtiss, L. K. (2002). Inflammation in atherosclerosis: Lesion formation in LDL receptor-deficient mice with perforin and lyst(beige) mutations. Arterioscler. Thromb. Vasc. Biol. 22 (8), 1341–1346. doi:10.1161/01.atv.0000024082.46387.38
Sepuri, N. B. V., Angireddy, R., Srinivasan, S., Guha, M., Spear, J., Lu, B., et al. (2017). Mitochondrial LON protease-dependent degradation of cytochrome c oxidase subunits under hypoxia and myocardial ischemia. Biochim. Biophys. Acta. Bioenerg. 1858 (7), 519–528. doi:10.1016/j.bbabio.2017.04.003
Shan, G., Zhang, H., Bi, G., Bian, Y., Liang, J., Valeria, B., et al. (2021). Multi-omics analysis of cancer cell lines with high/low ferroptosis scores and development of a ferroptosis-related model for multiple cancer types. Front. Cell Dev. Biol. 9, 794475. doi:10.3389/fcell.2021.794475
Shao, L., Zhang, P., Zhang, Y., Lu, Q., and Ma, A. (2014). TLR3 and TLR4 as potential clinically biomarkers of cardiovascular risk in coronary artery disease (CAD) patients. Heart Vessels 29 (5), 690–698. doi:10.1007/s00380-013-0421-3
Shao, W., Yang, Z., Fu, Y., Zheng, L., Liu, F., Chai, L., et al. (2021). The pyroptosis-related signature predicts prognosis and indicates immune microenvironment infiltration in gastric cancer. Front. Cell Dev. Biol. 9, 676485. doi:10.3389/fcell.2021.676485
Sinnaeve, P. R., Donahue, M. P., Grass, P., Seo, D., Vonderscher, J., Chibout, S. D., et al. (2009). Gene expression patterns in peripheral blood correlate with the extent of coronary artery disease. PLoS One 4 (9), e7037. doi:10.1371/journal.pone.0007037
Stoneman, V., Braganza, D., Figg, N., Mercer, J., Lang, R., Goddard, M., et al. (2007). Monocyte/macrophage suppression in CD11b diphtheria toxin receptor transgenic mice differentially affects atherogenesis and established plaques. Circ. Res. 100 (6), 884–893. doi:10.1161/01.RES.0000260802.75766.00
Thomas, H., Diamond, J., Vieco, A., Chaudhuri, S., Shinnar, E., Cromer, S., et al. (2018). Global atlas of cardiovascular disease 2000-2016: The path to prevention and control. Glob. Heart 13 (3), 143–163. doi:10.1016/j.gheart.2018.09.511
Tian, Q., Li, T., Hou, W., Zheng, J., Schrum, L. W., and Bonkovsky, H. L. (2011). Lon peptidase 1 (LONP1)-dependent breakdown of mitochondrial 5-aminolevulinic acid synthase protein by heme in human liver cells. J. Biol. Chem. 286 (30), 26424–26430. doi:10.1074/jbc.M110.215772
Tsai, J. C., Wang, H., Perrella, M. A., Yoshizumi, M., Sibinga, N. E., Tan, L. C., et al. (1996). Induction of cyclin A gene expression by homocysteine in vascular smooth muscle cells. J. Clin. Invest. 97 (1), 146–153. doi:10.1172/JCI118383
Vandenabeele, P., Galluzzi, L., Vanden Berghe, T., and Kroemer, G. (2010). Molecular mechanisms of necroptosis: An ordered cellular explosion. Nat. Rev. Mol. Cell Biol. 11 (10), 700–714. doi:10.1038/nrm2970
Venkatesh, S., Li, M., Saito, T., Tong, M., Rashed, E., Mareedu, S., et al. (2019). Mitochondrial LonP1 protects cardiomyocytes from ischemia/reperfusion injury in vivo. J. Mol. Cell. Cardiol. 128, 38–50. doi:10.1016/j.yjmcc.2018.12.017
Wang, H., Yoshizumi, M., Lai, K., Tsai, J. C., Perrella, M. A., Haber, E., et al. (1997). Inhibition of growth and p21ras methylation in vascular endothelial cells by homocysteine but not cysteine. J. Biol. Chem. 272 (40), 25380–25385. doi:10.1074/jbc.272.40.25380
Wang, H., Jiang, X., Yang, F., Chapman, G. B., Durante, W., Sibinga, N. E., et al. (2002). Cyclin A transcriptional suppression is the major mechanism mediating homocysteine-induced endothelial cell growth inhibition. Blood 99 (3), 939–945. doi:10.1182/blood.v99.3.939.h80302000939_939_945
Wang, Z., Guo, L. M., Wang, Y., Zhou, H. K., Wang, S. C., Chen, D., et al. (2018). Inhibition of HSP90α protects cultured neurons from oxygen-glucose deprivation induced necroptosis by decreasing RIP3 expression. J. Cell. Physiol. 233 (6), 4864–4884. doi:10.1002/jcp.26294
Wang, Y., Liu, J., Kong, Q., Cheng, H., Tu, F., Yu, P., et al. (2019). Cardiomyocyte-specific deficiency of HSPB1 worsens cardiac dysfunction by activating NFκB-mediated leucocyte recruitment after myocardial infarction. Cardiovasc. Res. 115 (1), 154–167. doi:10.1093/cvr/cvy163
Wang, C., Li, Q., Yang, H., Gao, C., Du, Q., Zhang, C., et al. (2020). MMP9, CXCR1, TLR6, and MPO participant in the progression of coronary artery disease. J. Cell. Physiol. 235 (11), 8283–8292. doi:10.1002/jcp.29485
Wilkerson, M. D., and Hayes, D. N. (2010). ConsensusClusterPlus: A class discovery tool with confidence assessments and item tracking. Bioinformatics 26 (12), 1572–1573. doi:10.1093/bioinformatics/btq170
Xiao, B., Liu, L., Li, A., Xiang, C., Wang, P., Li, H., et al. (2020). Identification and verification of immune-related gene prognostic signature based on ssGSEA for osteosarcoma. Front. Oncol. 10, 607622. doi:10.3389/fonc.2020.607622
Xu, X. H., Shah, P. K., Faure, E., Equils, O., Thomas, L., Fishbein, M. C., et al. (2001). Toll-like receptor-4 is expressed by macrophages in murine and human lipid-rich atherosclerotic plaques and upregulated by oxidized LDL. Circulation 104 (25), 3103–3108. doi:10.1161/hc5001.100631
Xu, Y., Ma, H. B., Fang, Y. L., Zhang, Z. R., Shao, J., Hong, M., et al. (2017). Cisplatin-induced necroptosis in TNFα dependent and independent pathways. Cell. Signal. 31, 112–123. doi:10.1016/j.cellsig.2017.01.004
Yang, Y., and Xu, X. (2021). Identification of key genes in coronary artery disease: An integrative approach based on weighted gene co-expression network analysis and their correlation with immune infiltration. Aging (Albany NY) 13 (6), 8306–8319. doi:10.18632/aging.202638
Zernecke, A., Bot, I., Djalali-Talab, Y., Shagdarsuren, E., Bidzhekov, K., Meiler, S., et al. (2008). Protective role of CXC receptor 4/CXC ligand 12 unveils the importance of neutrophils in atherosclerosis. Circ. Res. 102 (2), 209–217. doi:10.1161/CIRCRESAHA.107.160697
Zhang, B., Wu, Q., Li, B., Wang, D., Wang, L., and Zhou, Y. L. (2020). m(6 A regulator-mediated methylation modification patterns and tumor microenvironment infiltration characterization in gastric cancer. Mol. Cancer 19 (1), 53. doi:10.1186/s12943-020-01170-0
Zhang, H. W., Jin, J. L., Cao, Y. X., Liu, H. H., Zhang, Y., Guo, Y. L., et al. (2020). Heart-type fatty acid binding protein predicts cardiovascular events in patients with stable coronary artery disease: A prospective cohort study. Ann. Transl. Med. 8 (21), 1349. doi:10.21037/atm-20-2493
Zhang, X., Xiang, Y., He, D., Liang, B., Wang, C., Luo, J., et al. (2020). Identification of potential biomarkers for CAD using integrated expression and methylation data. Front. Genet. 11, 778. doi:10.3389/fgene.2020.00778
Zhang, B., Zeng, K., Li, R., Jiang, H., Gao, M., Zhang, L., et al. (2021). Construction of the gene expression subgroups of patients with coronary artery disease through bioinformatics approach. Math. Biosci. Eng. 18 (6), 8622–8640. doi:10.3934/mbe.2021427
Zhang, L., Lou, D., He, D., Wang, Y., Wu, Y., Cao, X., et al. (2021). Dysregulated circulating apoptosis- and autophagy-related lncRNAs as diagnostic markers in coronary artery disease. Biomed. Res. Int. 2021, 5517786. doi:10.1155/2021/5517786
Zhao, Z., Liu, H., Zhou, X., Fang, D., Ou, X., Ye, J., et al. (2021). Necroptosis-related lncRNAs: Predicting prognosis and the distinction between the cold and hot tumors in gastric cancer. J. Oncol. 2021, 6718443. doi:10.1155/2021/6718443
Zhou, N., and Bao, J. (2020). FerrDb: A manually curated resource for regulators and markers of ferroptosis and ferroptosis-disease associations. Database. 2020, baaa021. doi:10.1093/database/baaa021
Zhou, B., Liu, J., Kang, R., Klionsky, D. J., Kroemer, G., and Tang, D. (2020). Ferroptosis is a type of autophagy-dependent cell death. Semin. Cancer Biol. 66, 89–100. doi:10.1016/j.semcancer.2019.03.002
Zhou, Y., Zhou, H., Hua, L., Hou, C., Jia, Q., Chen, J., et al. (2021). Verification of ferroptosis and pyroptosis and identification of PTGS2 as the hub gene in human coronary artery atherosclerosis. Free Radic. Biol. Med. 171, 55–68. doi:10.1016/j.freeradbiomed.2021.05.009
Glossary
CAD Coronary artery disease
DEGs differentially expressed genes
CBS cystathionine beta-synthase
TLR4 toll-like receptor 4
LONP1 lon peptidase 1, mitochondrial
HSPB1 heat shock protein family B (small) member 1
Fer-1 Ferrostatin-1
NCF2 neutrophil cytosolic factor 2
BNIP3 BCL2 interacting protein 3
FTL ferritin light chain
RPL8 ribosomal protein L8
MAP3K5 mitogen-activated protein kinase kinase 5
MAPK14 mitogen-activated protein kinase 14
ELAVL1 ELAV-like RNA-binding protein 1
HIC1 HIC ZBTB transcriptional repressor 1
STAT3 signal transducer and activator of transcription 3
PGD phosphogluconate dehydrogenase
SLC38A1 solute carrier family 38 member 1
MYB MYB proto-oncogene, transcription factor
MTDH metadherin
FADD Fas associated via death domain
ITPK1 inositol-tetrakisphosphate 1-kinase
MYC MYC proto-oncogene, bHLH transcription factor
TNFSF10 TNF superfamily member 10
DNMT1 DNA methyltransferase 1
BACH2 BTB domain and CNC homolog 2
LEF1 lymphoid enhancer binding factor 1
GO gene ontology
ssGSEA single-sample gene set enrichment analysis
PCA principal component analysis
ANOVA analysis of variance
ROC receiver operating characteristic
AUC area under the curve
CXCR4 C-X-C motif chemokine receptor 4
CXCL12 C-X-C motif chemokine ligand 12
oxLDL oxidized low-density lipoprotein
Hcy homocysteine
HHcy high homocysteine.
Keywords: coronary artery disease, ferroptosis, necroptosis, subgroup, single-sample gene set enrichment analysis
Citation: Liu W-P, Li P, Zhan X, Qu L-H, Xiong T, Hou F-X, Wang J-K, Wei N and Liu F-Q (2022) Identification of molecular subtypes of coronary artery disease based on ferroptosis- and necroptosis-related genes. Front. Genet. 13:870222. doi: 10.3389/fgene.2022.870222
Received: 25 February 2022; Accepted: 12 August 2022;
Published: 20 September 2022.
Edited by:
Sofya Pchelina, Petersburg Nuclear Physics Institute (RAS), RussiaReviewed by:
Majid Katebi, Iran University of Medical Sciences, IranJin Cheng, Peking University Third Hospital, China
Copyright © 2022 Liu, Li, Zhan, Qu, Xiong, Hou, Wang, Wei and Liu. This is an open-access article distributed under the terms of the Creative Commons Attribution License (CC BY). The use, distribution or reproduction in other forums is permitted, provided the original author(s) and the copyright owner(s) are credited and that the original publication in this journal is cited, in accordance with accepted academic practice. No use, distribution or reproduction is permitted which does not comply with these terms.
*Correspondence: Na Wei, d2VpbmEyMDA3MUAxMjYuY29t; Fu-Qiang Liu, bGl1ZnVxaWFuZzA5MDlAMTYzLmNvbQ==
†These authors have contributed equally to this work