 Chunxia Yang
94% of researchers rate our articles as excellent or good
Learn more about the work of our research integrity team to safeguard the quality of each article we publish.
Find out more
ORIGINAL RESEARCH article
Front. Genet., 21 March 2022
Sec. Epigenomics and Epigenetics
Volume 13 - 2022 | https://doi.org/10.3389/fgene.2022.865015
This article is part of the Research TopicGenetics and Epigenetics of Psychiatric Diseases - Volume IIView all 13 articles
Objectives: Mood disorders are a kind of serious mental illness, although their molecular factors involved in the pathophysiology remain unknown. One approach to examine the molecular basis of mood disorders is co-expression network analysis (WGCNA), which is expected to further divide the set of differentially expressed genes into subgroups (i.e., modules) in a more (biologically) meaningful way, fascinating the downstream enrichment analysis. The aim of our study was to identify hub genes in modules in mood disorders by using WGCNA.
Methods: Microarray data for expression values of 4,311,721 mRNA in peripheral blood mononuclear cells drawn from 21 MDD, 8 BD, and 24 HC individuals were obtained from GEO (GSE39653); data for genes with expression in the bottom third for 80% or more of the samples were removed. Then, the top 70% most variable genes/probs were selected for WGCNA: 27,884 probes representing 21,840 genes; correlation between module genes and mood disorder (MDD+BD vs. HC) was evaluated.
Results: About 52% of 27,765 genes were found to form 50 co-expression modules with sizes 42–3070. Among the 50 modules, the eigengenes of two modules were significantly correlated with mood disorder (p < 0.05). The saddlebrown module was found in one of the meta-modules in the network of the 50 eigengenes along with mood disorder, 6 (IER5, NFKBIZ, CITED2, TNF, SERTAD1, ADM) out of 12 differentially expressed genes identified in Savitz et al. were found in the saddlebrown module.
Conclusions: We found a significant overlap for 6 hub genes (ADM, CITED2, IER5, NFKBIZ, SERTAD1, TNF) with similar co-expression and dysregulation patterns associated with mood disorder. Overall, our findings support other reports on molecular-level immune dysfunction in mood disorder and provide novel insights into the pathophysiology of mood disorder.
Mood disorders including major depressive disorder (MDD) and bipolar disorder (BD) are a kind of serious mental illness and are the third leading cause of the global disease burden (Collins et al., 2011; Murray et al., 2012; Jabbi et al., 2020). The molecular factors involved in the pathophysiology of MDD remain challenging (Gagne et al., 2020). Despite their diagnostic distinction, multiple approaches have shown considerable sharing of risk factors across the mood disorders (Coleman et al., 2020). Various hypotheses regarding the pathogenesis of mood disorders, such as the hypothesis of disturbed neuroplasticity (Christoffel et al., 2011) and the inflammatory (Leonard and Maes, 2012; Zeng et al., 2019), have been proposed. Many studies suggested that neural immune activation may be a primary pathway influencing the observed changes in key neuroendocrine and neurotrophic systems (Miller et al., 2013). Substantial evidence supports the changes in mRNA expression in proinflammatory genes and the elevated levels of peripheral inflammatory markers in mood disorder patients (Kohler et al., 2018; Wiedlocha et al., 2018). However, there is no definitive evidence to support the belief of shared inflammation and neurological abnormalities of molecular biology in mood disorders (Savitz et al., 2013).
Mood disorders share several genetic associations, and can be combined effectively to increase variant discovery (Coleman et al., 2020). Several genome-wide association studies (GWAS) in MDD and BD have indicated that the genetic heterogeneity architecture of mood disorder is complex, with many polymorphisms of small effect contributing to the clinical phenotype (Okbay et al., 2016; Ciobanu et al., 2018; Wray et al., 2018). A recent meta-analysis was conducted using results from the Psychiatric Genomics Consortium (PGC) genome-wide association studies for MDD and BD using data including those from 23andMe and UK Biobank to identify numerous shared and disorder-specific associations between mood disorders. In addition, clinical heterogeneity has been recognized as a major limiting factor for robust characterization of gene expression alterations in MDD. For example, the first RNA sequencing study of 463 lifetime MDD cases, consisting of a mixture of individuals with current and remitted MDD, found no differentially expressed genes between cases and controls (Mostafavi et al., 2014). For BD, neuroimaging-guided RNA-sequencing in two studies showed gene-expression changes associated with disease morbidity and related suicide mortality in an independent postmortem cohort (Jabbi et al., 2020).
To elucidate the relationship between inflammation and neuroimaging abnormalities, Savitz et al. conducted a whole genome expression analysis of peripheral blood mononuclear cells and identified 12 differentially expressed genes including TNF and others that related to neurological disorders and/or apoptosis between patients with a mood disorder and healthy controls. There was mounting evidence that was associated with functional and chemical abnormalities within and beyond the neural reward circuitry and was linked to elevated peripheral levels of inflammatory biomarkers in depression (Ely et al., 2021). An Ingenuity Pathway Analysis on these differentially expressed genes yielded two gene networks centered around TNF and related to cell circle and kinase anomalies, respectively. The authors also found that the expression levels of some of these differentially expressed genes were significantly correlated with morphometric abnormalities of the left sgACC, hippocampus, and caudate. However, there are some limitations in a traditional pathway analysis using IPA, for example. One of the limitations is that the gene networks and regulatory indicated in these networks are modeled based only on currently available knowledge. To fully utilize the gene expression information captured by the microarray data, in this study, we conducted a co-expression network analysis for the microarray data generated in and downloaded from GSE using the WGCNA approach, which was a systems biology approach developed for creating gene network models to explore and identify key functional modules and hub genes.
As far as molecular biology is concerned, genes do not act in isolation. In mood disorder, genes interaction within each other with complex networks might be disrupted. At the same time, gene expression data do not function in isolation but rather are highly multidimensional with complex non-linear biological processes. Molecular interactions are not captured by traditional statistical methods (Ciobanu et al., 2020). Weighted gene co-expression network analysis (WGCNA) is a hypothesis-free systems biology approach that identifies “modules” of co-regulated, and therefore functionally related, genes in a given phenotype (Langfelder and Horvath, 2008), extending classic bivariate approaches (Ciobanu et al., 2018). WGCNA: A systems biology approach developed for analysis of transcriptomic data, providing more information than a set of differentially expressed genes. Used sophisticated algorithms and information on correlation patterns among genes, WGCNA is expected to further divide the set of differentially expressed genes into subgroups (i.e., modules) in a more biologically meaningful way, fascinating the downstream enrichment analysis (Wang et al., 2017).
In this study, we aimed to investigate the relationship between global gene co-expression profiles and mood disorder subgroups. Microarray data for expression values of 4,311,721 mRNA in peripheral blood mononuclear cells drawn from 21 MDD, 8 BD, and 24 HC individuals were obtained from GEO (GSE39653). We applied WGCNA and explored the correlation of co-expressed modules 1) construct a gene-gene similarity network; 2) divide the network into modules (group genes with similar expressions); 3) correlate traits to gene modules; and 4) identify hub genes in modules. We then sought molecular-level immune dysfunction in mood disorder and provide novel insights into the pathophysiology of mood disorder.
Microarray data of GSE39653 was downloaded from the National Center for Biotechnology Information (NCBI) Gene Expression Omnibus (GEO, http://www.ncbi.nlm.org/geo/) database, which includes expression levels of 4,311,721 mRNA in peripheral blood mononuclear cells drawn from 21 MDD, 8 BD, and 24 HC individuals. Details on the recruitment of subjects, sampling and processing of the blood samples, and microarray experiment were given in. Briefly, the mood disorder patients met DSM-IV criteria for recurrent primary MDD in a current major depressive episode or BD in a current major depressive episode with a moderate-to-high Hamilton Depression Rating Scale score and did not receive any psychotropic medications for at least 3 weeks. The healthy control individuals had no personal or family history of psychiatric illness. Quantile normalization and log-transformation were performed for the expression data.
First, the microarray data were preprocessed as follows. Data for genes with expression in the bottom third for 80% or more of the samples were removed (Ballouz et al., 2015). The top 70% most variable genes/probs were selected for the construction of the co-expressed network. Using the preprocessed and transformed data, a co-expressed network was constructed using the WGCNA R package (Zhang and Horvath, 2005). Briefly, a correlation matrix for all pair-wise correlations of transcripts was calculated and then transformed into a weighted adjacency matrix with a soft threshold power set to beta = 5 to achieve approximate scale-free topology (model fit R^2 > 0.88 while the mean connectivity was kept as large as possible). The connection strengths were then used to calculate the topological overlap (TO), which is a pair-wise measure of two genes’ similarity with other genes in the network. Genes were then hierarchically clustered using 1-TO as the distance measure and modules of genes were identified using a dynamic tree-cutting algorithm using the following parameters: minimum modulesize = 30, deepSplit = 4, mergeCutSize = 0.15, and maximumBlockSize = 5000.
The first principal component of each module defined the module eigengene (ME). Genes weakly corrected with the ME (Pearson correlation coefficient<0.3) were removed from the module. For each gene, Pearson correlation coefficient was calculated with the eigengenes of all modules and defined as the model membership (kME). If a gene had the highest correlation and with correlation p < 0.05 with the eigengene of a module other than the module it was assigned to initially in the hierarchical clustering, it would be reassigned to this module. Associations between mood disorder (MDD or BD) and MEs were determined by Pearson correlations. Finally, MEs along with the traits were clustered based on their correlation, and the meta-modules were identified to represent groups of correlated modules and/or the traits, which was the affection status of mood disorder in this case.
For modules, significantly associated with mood disorder, the top hub genes were identified as those with the highest intramodular connectivity K_IM, representing the highly connected genes within a module. Functional annotation was performed for those hub genes using the Database for Annotation, Visualization, and Integrated Discovery (DAVID). Gene Ontology (GO) analysis was then performed using the function hyperGTest in the R package Gostats.
We drew a histogram by mapping the GO (Ashburner et al., 2000; Tweedie et al., 2009) function of genes in modules of interest to the corresponding secondary features. The Pearson Chi-Square test was applied to indicate significant relationships between the two input datasets if all the expected counts were greater than. The top five annotation clusters for each analysis were focused on as these clusters are more likely to contain biologically meaningful annotations as these clusters have the highest enrichment score. Then we implemented GO enrichment analysis based on a hypergeometric test. The p-value <0.05 was used as the enrichment cut-off criterion.
After removing genes with expression in the bottom third for 80% or more of the samples, the top 70% most variable probes (27,884, representing 21,840 genes) for 29 patients with mood disorder (21 MDD and 8 BD) and 24 HC were selected for WGCNA.
Weighted gene co-expression networks construction and gene modules identification. Using the preprocessed data for all 53 participants, a weighted co-expression network was constructed using the WGCNA package. The hierarchical clustering procedure and the dynamic tree-cutting algorithm resulted in 50 modules (Figure 1 and Supplementary Table S1), each of which is assigned a unique color label and visualized in the color band underneath the cluster tree in Figure 1. These modules ranged in size from 42 genes in the thistle2 module to 3070 in the turquoise module. Among all 27,765 probes, 13,240 (47.7%) were found to belong to none of the 50 proper modules and were put in an improper module (gray).
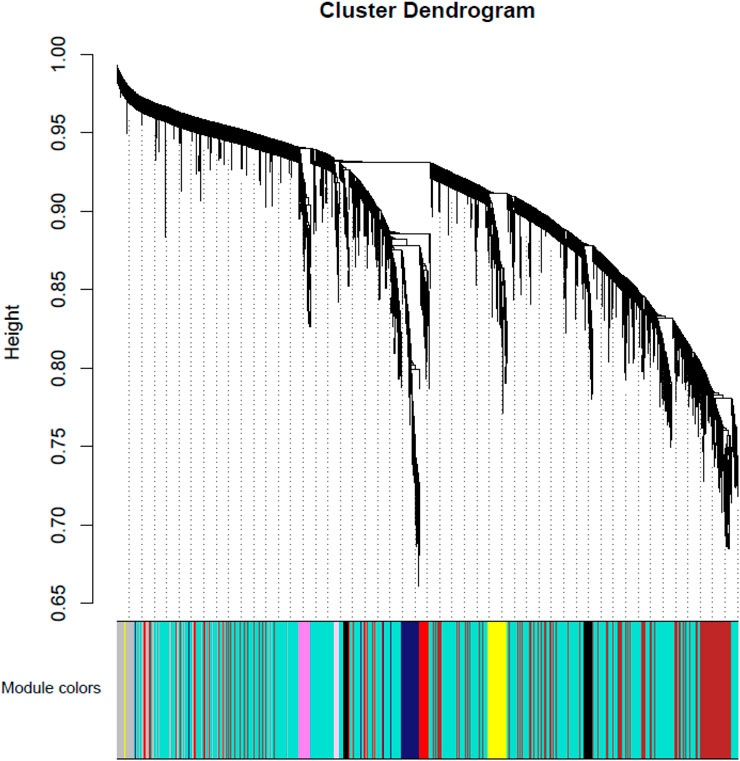
FIGURE 1. Module-MD vs. Control relationship. Each row corresponds to a module eigengene. Each cell contains the corresponding correlation in the first line and the p-value in the second line. The table is color-coded by correlation according to the color legend. Among them, red represents a positive correlation and blue represents a negative correlation.
To identify modules related to mood disorder, we correlated each of the 50 module eigengenes with the mood disorder status. As shown in Table 1, the saddlebrown module and the lightcyan module were significantly associated with mood disorder. The saddlebrown module, which was positively associated with mood disorder, included 10 out of the 26 genes that were found in Coleman et al. (2020) to be differentially expressed between patients with mood disorder and heathy controls. Among these 10 genes, the following 6 are protein coding genes: ADM, CITED2, IER5, NFKBIZ, SERTAD1, and TNF, which were mostly related to neurological features or psychiatric illness. The lightcyan module was negatively associated with mood disorder, and did not include any of the 26 differentially expressed genes identified in Coleman et al. (2020). This implies that the lightcyan module might represent some pathway which may not be identified using differential expression analysis of individual genes. It should be noted that 6 coding genes in the saddlebrown module that were differentially expressed are all over-expressed in the mood disorder cases. The saddlebrown module was also found in the same meta-module in the network of the 50 eigengenes along with mood disorder, as shown in Figure 2. In the same meta-module, there were two more eigengenes representing the darkmagenta module and the darkolivegreen module.
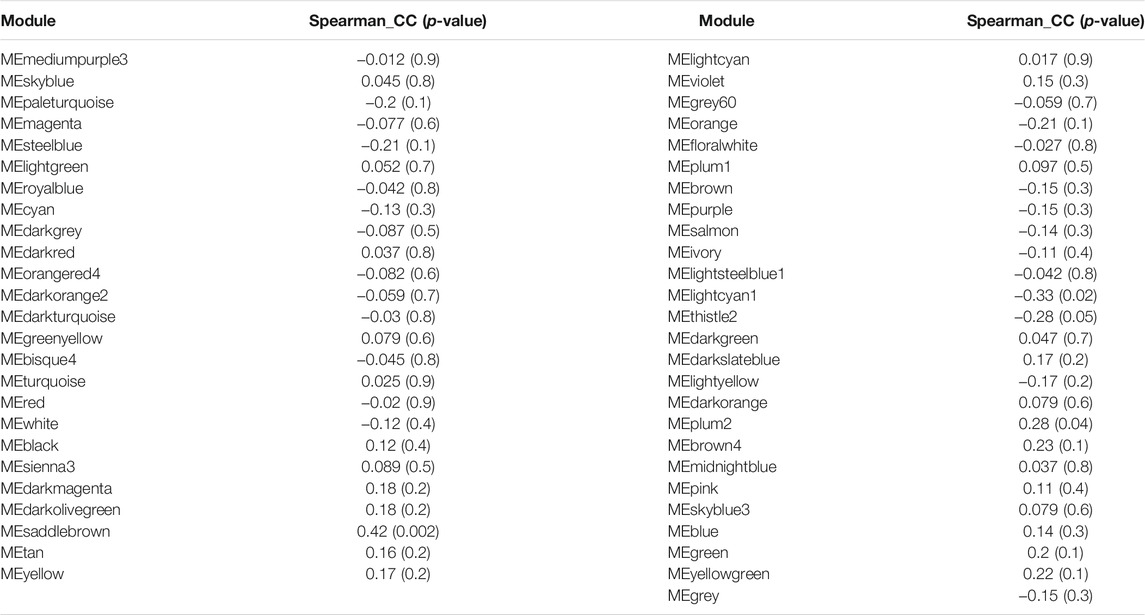
TABLE 1. Two candidate modules speculated the critical role for the pathophysiology of MD.
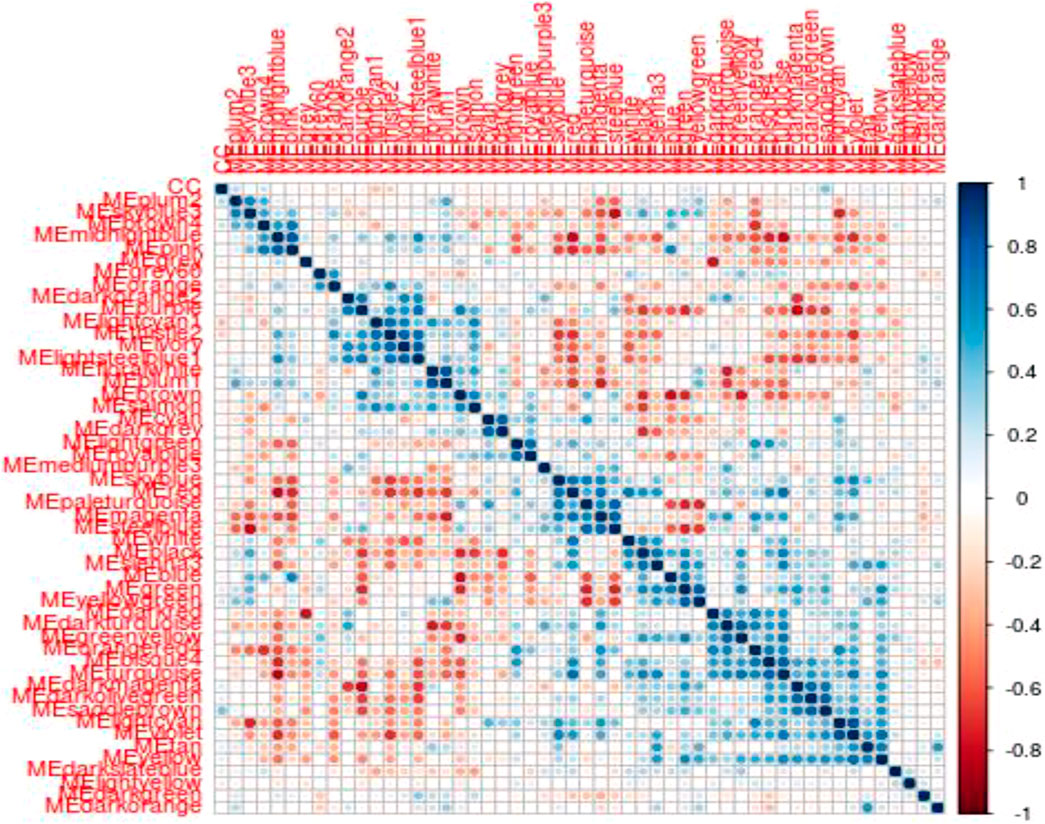
FIGURE 2. Eigengene heatmap: The scatterplots of MM vs. GS in saddlebrown module exhibited very significant positive correlations.
Hub genes for the saddlebrown and lightcyan1 modules were extracted and ranked based on the intramodular connectivity values (Wang et al., 2017). Thus, we identified the hub genes from the saddlebrown module (Table 1 for the saddlebrown module). Among the 12 genes identified in Savitz et al. (2013) as differentially expressed between controls and cases (mood disorder), 6 appeared in the saddlebrown module (Supplementary Table S2).
Hub genes for the saddlebrown and lightcyan1 modules were extracted and ranked based on the intramodular connectivity values. The top hub genes were annotated using the GeneCard website. Most of the hub genes in the saddlebrown module were related to the similar function of RNA processing, in which mRNA 5′-splice site recognited, mRNA cis spliced via spliceosome, and branching involved in labyrinthine layer morphogenesis. Moreover, most of the hub genes in the lightcyan1 module were related to the similar function of regulating steroid hormone secretion. GO analysis for the hub genes of these two modules suggested the genes were enriched in the regulation of corticosteroid hormone secretion. Interestingly, 10 of the 19 GO terms pathway in these two modules were associated with the steroid hormone secretion pathway, including negative regulation of steroid hormone secretion (GO:2000832, p = 2.29E−05) and regulation of corticosteroid hormone secretion (GO:2000846 p = 6.31E−04) (Table 2).
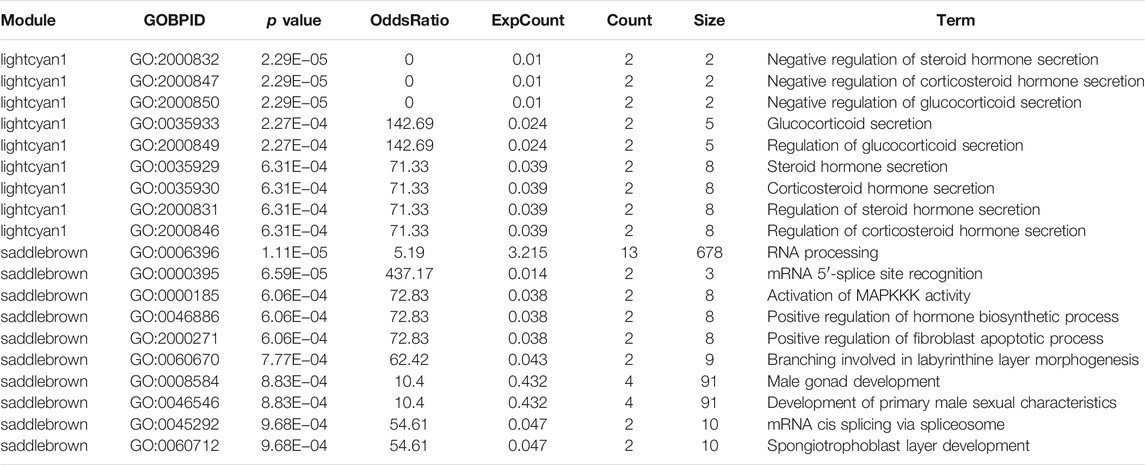
TABLE 2. Functional annotation of modules and network analysis.
In this study, we utilized the WGCNA to explore the gene co-expression modules networks for expression values of 4,311,721 mRNA in peripheral blood mononuclear cells drawn from MDD, 8 BD, and 24 HC individuals were obtained from GEO (GSE39653) (Savitz et al., 2013). We identified 50 co-expression modules in which the number of eigengenes ranged in size from 42 to 13,240 genes. Two co-expression modules (saddlebrown and lightcyan1) showed striking correlation with the phenotypic trait between MD and healthy controls. Among the 12 genes identified in Savitz et al. as differentially expressed between controls and cases (mood disorder), 6 (IER5, NFKBIZ, CITED2, TNF, SERTAD1, ADM) appeared in module saddlebrown. Based on the GO pathway analysis, biological function of the saddlebrown module and lightcyan1 module were found to be focused on inflammation and neurological response and RNA processing.
The algorithm of WGCNA software could construct a gene co-expression network to provide the expanded explanation of gene expression information. As it has some advantages over traditional approaches to differential expression analysis, the software has been conducted for the gene expression pattern in the mental illness (Geng et al., 2020). WGCNA analysis has been widely used in transcriptional analysis of major depression, schizophrenia, autism, and Alzheimer’s disease (Miller et al., 2008; Voineagu et al., 2011; Ciobanu et al., 2020). Recently, Belzeaux et al. collected a discovery queue and two duplicate queues with similar designs by using WGCNA analysis, 9 of the 59 modules were associated with clinical improvement (Belzeaux et al., 2016). Another study also reported that WGCNA analysis explored candidate modules and central genes associated with subsyndromic depressive symptoms (SSD). Gene expression studies of SSD observed different patterns between cases and controls, which may provide new insights into the molecular mechanisms of SSD (Geng et al., 2020). To the best of our knowledge, this is the first study that used WGCNA to explore candidate modules and hub genes associated with MD.
In the current study, the 6 hub genes (IER5, NFKBIZ, CITED2, TNF, SERTAD1, ADM) appeared in module saddlebrown were among the 12 differentially expressed genes identified in Savitz et al. (2013) This indicates that a significant proportion of differentially expressed genes related to mood disorder may be tightly co-regulated, functionally related, or in the same pathway. IER5, as an immediate early genes/transcription factor, was likely to affect basic cellular functions such as RNA and protein synthesis, neural plasticity, neurotransmission, and metabolism (Cirelli and Tononi, 2000). IER5 gene encodes an activator of HSF1 which was to control hippocampal PSA-NCAM levels through the transcriptional regulation of polysialyltransferases, a process that might be involved in neuronal and behavioral development in mice (Yamano et al., 2020). Transcription of NFKBIZ mediates the transcriptional response to TNF and IL-17A. In fibroblasts, CUX1 and NFKBIZ mediate the synergistic inflammatory response to TNF and IL-17A in stromal fibroblasts (Slowikowski et al., 2020). Moreover, Harrison et al., Inagaki et al., and Savitz et al. showed the correlations between hemodynamic response of the amygdala to sad faces and genes such as CFD and NFKBIZ which are involved in the inflammatory response (Harrison et al., 2009; Inagaki et al., 2012; Savitz et al., 2013). Su et al. reported that the NF-κB was activated in the hippocampi of wild-type (WT) mice after CUMS exposure by regulating the expression of cytokines. Previous studies demonstrated that depression-like behaviors caused by stress were dependent on HMGB1/TLR4/NF-κB and TNF-α/TNFR1/NF-κB signalling pathways in CUMS-exposed mice (Su et al., 2017; Liu et al., 2019; Lu et al., 2019). Arctigenin exerts antidepressant-like effects by attenuating microglial activation and neuroinflammation through the HMGB1/TLR4/NF-κB and TNF-α/TNFR1/NF-κB signalling pathways (Xu et al., 2020). CITED2 represses innate immune cell pathogenic response by modulating broad inflammatory gene programming in macrophages and protecting the host from pathogenic inflammation (Pong Ng et al., 2020). SERTAD1, which appeared to be essential for neuron death in trophic support deprivation in vitro and in vivo and in models of DNA damage, was associated with Alzheimer’s disease (Biswas et al., 2010). It may therefore be a suitable target for neuropsychiatric diseases, such as MD. Adrenomedullin (ADM) has been confirmed as a vasorelaxant that is part of the first-line protective (i.e., anti-inflammatory) response to toxic or aversive stimuli such as lipopolysaccharide (LPS) (Wong et al., 2005). Genome-wide association study (GWAS) implicated a single nucleotide polymorphism (SNP) in the vicinity of the ADM gene in a sample of subjects with type II BD. In addition, a functional SNP in the ADM gene was associated with response to paroxetine, an SSRI antidepressant (Glubb et al., 2010). Recently, a whole transcriptome RNA-sequencing study revealed 30 genes (included ADM) differentially expressed in MDD compared to controls (Mahajan et al., 2018). Together, these data implicate neuro-inflammation in a large number of genes and functional pathways in MD and playing a crucial role in MD. A growing number of studies suggest behavioral and genetic function of the central nervous system, as well as their involvement affected in many neurologic and psychiatric conditions, such as neurodegenerative diseases and mood disorders (Jeremic et al., 2021). This mounting evidence on the involvement of inflammatory/immune systems and their relationships with neurotransmitters seems to represent intriguing avenues for the development of real innovative therapeutic strategies of mood disorders (Mucci et al., 2020). Neuro-inflammation is potentially important in the pathophysiology of MD. Thus, the current study has confirmed the 6 hub genes (IER5, NFKBIZ, CITED2, TNF, SERTAD1, ADM) of neuro-inflammation in MD.
Interestingly, we also found that the GO about the MD was associated with the saddlebrown and lightcyan1 module. Ten of the 19 GO terms pathway in two modules were associated with the steroid hormone secretion pathway, which included negative regulation of steroid hormone secretion (GO:2000832, p = 2.29E−05) and regulation of corticosteroid hormone secretion (GO:2000846 p = 6.31E−04).
Growing evidence implicates involvement of endogenous glucocorticoids in adverse health effects beyond neurological/neurobehavioral outcomes (neurodegenerative disease, cognitive decline, perceived stress, depression, and suicide) (Thomson et al., 2016). These data provided insight into potential biological mechanisms underlying health impacts and susceptibility in neuropsychiatric diseases, such as MD.
Comparing the results of the WGCNA here with what Savitz et al.’s results were, we think they found that the network of saddlebrown module is clustered based on the similar function of RNA processing. In our study, the RNA processing of mRNA 5′-splice site was recognized, mRNA cis spliced via spliceosome, and branching involved in the labyrinthine layer morphogenesis. Recently, regulating gene expression through splicing, as a novel mechanism, has been described and could contribute to depression by changing gene expression (Le Francois et al., 2018). Alternative splicing is a prevalent modification, especially in human neuronal genes (Kang et al., 2011), resulting in a greater diversity of RNA transcripts (Darnell, 2013; Raj and Blencowe, 2015).
In this study, we applied WGCNA to transcriptomic data from 21 MDD, 8 BD, and 24 HC individuals that were obtained from GEO (GSE39653). We found a significant overlap for 6 hub genes (ADM, CITED2, IER5, NFKBIZ, SERTAD1, TNF) with similar co-expression and dysregulation patterns associated with mood disorder. Interestingly, we also found that the GO about the MD was associated with the saddlebrown and lightcyan1 modules. These pathways in two modules were associated with the steroid hormone secretion pathway and function of RNA processing, which have been described could contribute to depression. Our findings support other reports on molecular-level immune dysfunction in mood disorder and provide novel insights into the pathophysiology of mood disorder.
Publicly available datasets were analyzed in this study. This data can be found here: http://www.ncbi.nlm.org/geo/.
Written informed consent was obtained from the individuals for the publication of any potentially identifiable images or data included in this article.
Zhang and NS designed and supervised this study. NS and CY were responsible for data analysis and manuscript drafting. ZL revised the manuscript. AZ and KZ participated in sample collection and carried out the experimental procedures. All authors reviewed and approved the final manuscript.
This work was supported by the National Natural Science Foundation of China (82171534), Natural Science Foundation of Shanxi Province (20210302123251, 20210302123257), a research project supported by the Shanxi Scholarship Council of China (HGKY2019098) and 136 Medical Rejuvenation Project of Shanxi Province. We sincerely thank the patients and their families, as well as the healthy volunteers for their participation, and all the medical staff involved in the collection of specimens.
The authors declare that the research was conducted in the absence of any commercial or financial relationships that could be construed as a potential conflict of interest.
All claims expressed in this article are solely those of the authors and do not necessarily represent those of their affiliated organizations, or those of the publisher, the editors and the reviewers. Any product that may be evaluated in this article, or claim that may be made by its manufacturer, is not guaranteed or endorsed by the publisher.
The Supplementary Material for this article can be found online at: https://www.frontiersin.org/articles/10.3389/fgene.2022.865015/full#supplementary-material
Ashburner, M., Ball, C. A., Blake, J. A., Botstein, D., Butler, H., Cherry, J. M., et al. (2000). Gene Ontology: Tool for the Unification of Biology. The Gene Ontology Consortium. Nat. Genet. 25 (1), 25–29. doi:10.1038/75556
Ballouz, S., Verleyen, W., and Gillis, J. (2015). Guidance for RNA-Seq Co-Expression Network Construction and Analysis: Safety in Numbers. Bioinformatics 31 (13), 2123–2130. doi:10.1093/bioinformatics/btv118
Belzeaux, R., Lin, C.-W., Ding, Y., Bergon, A., Ibrahim, E. C., Turecki, G., et al. (2016). Predisposition to Treatment Response in Major Depressive Episode: A Peripheral Blood Gene Coexpression Network Analysis. J. Psychiatr. Res. 81, 119–126. doi:10.1016/j.jpsychires.2016.07.009
Biswas, S. C., Zhang, Y., Iyirhiaro, G., Willett, R. T., Rodriguez Gonzalez, Y., Cregan, S. P., et al. (2010). Sertad1 Plays an Essential Role in Developmentaland Pathological Neuron Death. J. Neurosci. 30 (11), 3973–3982. doi:10.1523/jneurosci.6421-09.2010
Christoffel, D. J., Golden, S. A., and Russo, S. J. (2011). Structural and Synaptic Plasticity in Stress-Related Disorders. Rev. Neurosci. 22 (5), 535–549. doi:10.1515/RNS.2011.044
Ciobanu, L. G., Sachdev, P. S., Trollor, J. N., Reppermund, S., Thalamuthu, A., Mather, K. A., et al. (2018). Co-Expression Network Analysis of Peripheral Blood Transcriptome Identifies Dysregulated Protein Processing in Endoplasmic Reticulum and Immune Response in Recurrent MDD in Older Adults. J. Psychiatr. Res. 107, 19–27. doi:10.1016/j.jpsychires.2018.09.017
Ciobanu, L. G., Sachdev, P. S., Trollor, J. N., Reppermund, S., Thalamuthu, A., Mather, K. A., et al. (2020). Downregulated Transferrin Receptor in the Blood Predicts Recurrent MDD in the Elderly Cohort: A Fuzzy Forests Approach. J. Affective Disord. 267, 42–48. doi:10.1016/j.jad.2020.02.001
Cirelli, C., and Tononi, G. (2000). Gene Expression in the Brain across the Sleep-Waking cycle11Published on the World Wide Web on 30 October 2000. Brain Res. 885 (2), 303–321. doi:10.1016/s0006-8993(00)03008-0
Coleman, J. R. I., Gaspar, H. A., Bryois, J., Bipolar Disorder Working Group of the Psychiatric Genomics, C., Major Depressive Disorder Working Group of the Psychiatric Genomics, C., and Breen, G. (2020). The Genetics of the Mood Disorder Spectrum: Genome-wide Association Analyses of More Than 185,000 Cases and 439,000 Controls. Biol. Psychiatry 88 (2), 169–184. doi:10.1016/j.biopsych.2019.10.015
Collins, C., Copeland, B., and Croucher, M. (2011). Bipolar Affective Disorder, Type II, Apparently Precipitated by Donepezil. Int. Psychogeriatr. 23 (3), 503–504. doi:10.1017/s1041610210002206
Darnell, R. B. (2013). RNA Protein Interaction in Neurons. Annu. Rev. Neurosci. 36, 243–270. doi:10.1146/annurev-neuro-062912-114322
Ely, B. A., Nguyen, T. N. B., Tobe, R. H., Walker, A. M., and Gabbay, V. (2021). Multimodal Investigations of Reward Circuitry and Anhedonia in Adolescent Depression. Front. Psychiatry 12, 678709. doi:10.3389/fpsyt.2021.678709
Gagné, A.-M., Moreau, I., St-Amour, I., Marquet, P., and Maziade, M. (2020). Retinal Function Anomalies in Young Offspring at Genetic Risk of Schizophrenia and Mood Disorder: The Meaning for the Illness Pathophysiology. Schizophrenia Res. 219, 19–24. doi:10.1016/j.schres.2019.06.021
Geng, R., Li, Z., Yu, S., Yuan, C., Hong, W., Wang, Z., et al. (2020). Weighted Gene Co-Expression Network Analysis Identifies Specific Modules and Hub Genes Related to Subsyndromal Symptomatic Depression. World J. Biol. Psychiatry 21 (2), 102–110. doi:10.1080/15622975.2018.1548782
Glubb, D. M., McHugh, P. C., Deng, X., Joyce, P. R., and Kennedy, M. A. (2010). Association of a Functional Polymorphism in the Adrenomedullin Gene (ADM) with Response to Paroxetine. Pharmacogenomics J. 10 (2), 126–133. doi:10.1038/tpj.2009.33
Harrison, N. A., Brydon, L., Walker, C., Gray, M. A., Steptoe, A., and Critchley, H. D. (2009). Inflammation Causes Mood Changes through Alterations in Subgenual Cingulate Activity and Mesolimbic Connectivity. Biol. Psychiatry 66 (5), 407–414. doi:10.1016/j.biopsych.2009.03.015
Inagaki, T. K., Muscatell, K. A., Irwin, M. R., Cole, S. W., and Eisenberger, N. I. (2012). Inflammation Selectively Enhances Amygdala Activity to Socially Threatening Images. Neuroimage 59 (4), 3222–3226. doi:10.1016/j.neuroimage.2011.10.090
Jabbi, M., Arasappan, D., Eickhoff, S. B., Strakowski, S. M., Nemeroff, C. B., and Hofmann, H. A. (2020). Neuro-Transcriptomic Signatures for Mood Disorder Morbidity and Suicide Mortality. J. Psychiatr. Res. 127, 62–74. doi:10.1016/j.jpsychires.2020.05.013
Jeremic, D., Sanchez-Rodriguez, I., Jimenez-Diaz, L., and Navarro-Lopez, J. D. (2021). Therapeutic Potential of Targeting G Protein-Gated Inwardly Rectifying Potassium (GIRK) Channels in the central Nervous System. Pharmacol. Ther. 223, 107808. doi:10.1016/j.pharmthera.2021.107808
Kang, H. J., Kawasawa, Y. I., Cheng, F., Zhu, Y., Xu, X., Li, M., et al. (2011). Spatio-Temporal Transcriptome of the Human Brain. Nature 478 (7370), 483–489. doi:10.1038/nature10523
Köhler, C. A., Freitas, T. H., Stubbs, B., Maes, M., Solmi, M., Veronese, N., et al. (2018). Peripheral Alterations in Cytokine and Chemokine Levels after Antidepressant Drug Treatment for Major Depressive Disorder: Systematic Review and Meta-Analysis. Mol. Neurobiol. 55 (5), 4195–4206. doi:10.1007/s12035-017-0632-1
Langfelder, P., and Horvath, S. (2008). WGCNA: An R Package for Weighted Correlation Network Analysis. BMC Bioinformatics 9, 559. doi:10.1186/1471-2105-9-559
Le Francois, B., Zhang, L., Mahajan, G. J., Stockmeier, C. A., Friedman, E., and Albert, P. R. (2018). A Novel Alternative Splicing Mechanism that Enhances Human 5-HT1A Receptor RNA Stability Is Altered in Major Depression. J. Neurosci. 38 (38), 8200–8210. doi:10.1523/jneurosci.0902-18.2018
Leonard, B., and Maes, M. (2012). Mechanistic Explanations How Cell-Mediated Immune Activation, Inflammation and Oxidative and Nitrosative Stress Pathways and Their Sequels and Concomitants Play a Role in the Pathophysiology of Unipolar Depression. Neurosci. Biobehav Rev. 36 (2), 764–785. doi:10.1016/j.neubiorev.2011.12.005
Liu, L., Dong, Y., Shan, X., Li, L., Xia, B., and Wang, H. (2019). Anti-Depressive Effectiveness of Baicalin In Vitro and In Vivo. Molecules 24 (2), 326. doi:10.3390/molecules24020326
Lu, Y., Xu, X., Jiang, T., Jin, L., Zhao, X.-D., Cheng, J.-H., et al. (2019). Sertraline Ameliorates Inflammation in CUMS Mice and Inhibits TNF-α-Induced Inflammation in Microglia Cells. Int. Immunopharmacology 67, 119–128. doi:10.1016/j.intimp.2018.12.011
Mahajan, G. J., Vallender, E. J., Garrett, M. R., Challagundla, L., Overholser, J. C., Jurjus, G., et al. (2018). Altered Neuro-Inflammatory Gene Expression in Hippocampus in Major Depressive Disorder. Prog. Neuro-Psychopharmacology Biol. Psychiatry 82, 177–186. doi:10.1016/j.pnpbp.2017.11.017
Miller, A. H., Haroon, E., Raison, C. L., and Felger, J. C. (2013). Cytokine Targets in the Brain: Impact on Neurotransmitters and Neurocircuits. Depress. Anxiety 30 (4), 297–306. doi:10.1002/da.22084
Miller, J. A., Oldham, M. C., and Geschwind, D. H. (2008). A Systems Level Analysis of Transcriptional Changes in Alzheimer's Disease and normal Aging. J. Neurosci. 28 (6), 1410–1420. doi:10.1523/jneurosci.4098-07.2008
Mostafavi, S., Battle, A., Zhu, X., Potash, J. B., Weissman, M. M., Shi, J., et al. (2014). Type I Interferon Signaling Genes in Recurrent Major Depression: Increased Expression Detected by Whole-Blood RNA Sequencing. Mol. Psychiatry 19 (12), 1267–1274. doi:10.1038/mp.2013.161
Mucci, F., Marazziti, D., Della Vecchia, A., Baroni, S., Morana, P., Carpita, B., et al. (2020). State-of-the-Art: Inflammatory and Metabolic Markers in Mood Disorders. Life (Basel) 10 (6), 82. doi:10.3390/life10060082
Murray, C. B., Murphy, L. K., Palermo, T. M., and Clarke, G. M. (2012). Pain and Sleep-Wake Disturbances in Adolescents with Depressive Disorders. J. Clin. Child. Adolesc. Psychol. 41 (4), 482–490. doi:10.1080/15374416.2012.658613
Okbay, A., Baselmans, B. M., Baselmans, B. M. L., De Neve, J.-E., Turley, P., Nivard, M. G., et al. (2016). Genetic Variants Associated with Subjective Well-Being, Depressive Symptoms, and Neuroticism Identified through Genome-Wide Analyses. Nat. Genet. 48 (6), 624–633. doi:10.1038/ng.3552
Pong Ng, H., Kim, G. D., Ricky Chan, E., Dunwoodie, S. L., and Mahabeleshwar, G. H. (2020). CITED2 Limits Pathogenic Inflammatory Gene Programs in Myeloid Cells. FASEB j. 34 (9), 12100–12113. doi:10.1096/fj.202000864r
Raj, B., and Blencowe, B. J. (2015). Alternative Splicing in the Mammalian Nervous System: Recent Insights into Mechanisms and Functional Roles. Neuron 87 (1), 14–27. doi:10.1016/j.neuron.2015.05.004
Savitz, J., Frank, M. B., Victor, T., Bebak, M., Marino, J. H., Bellgowan, P. S. F., et al. (2013). Inflammation and Neurological Disease-Related Genes Are Differentially Expressed in Depressed Patients with Mood Disorders and Correlate with Morphometric and Functional Imaging Abnormalities. Brain Behav. Immun. 31, 161–171. doi:10.1016/j.bbi.2012.10.007
Slowikowski, K., Nguyen, H. N., Noss, E. H., Simmons, D. P., Mizoguchi, F., Watts, G. F. M., et al. (2020). CUX1 and IκBζ (NFKBIZ) Mediate the Synergistic Inflammatory Response to TNF and IL-17A in Stromal Fibroblasts. Proc. Natl. Acad. Sci. USA 117 (10), 5532–5541. doi:10.1073/pnas.1912702117
Su, W.-J., Zhang, Y., Chen, Y., Gong, H., Lian, Y.-J., Peng, W., et al. (2017). NLRP3 Gene Knockout Blocks NF-κB and MAPK Signaling Pathway in CUMS-Induced Depression Mouse Model. Behav. Brain Res. 322 (Pt A), 1–8. doi:10.1016/j.bbr.2017.01.018
Thomson, E. M., Pal, S., Guénette, J., Wade, M. G., Atlas, E., Holloway, A. C., et al. (2016). Ozone Inhalation Provokes Glucocorticoid-Dependent and -Independent Effects on Inflammatory and Metabolic Pathways. Toxicol. Sci. 152 (1), 17–28. doi:10.1093/toxsci/kfw061
Tweedie, S., Ashburner, M., Falls, K., Leyland, P., McQuilton, P., Marygold, S., et al. (2009). FlyBase: Enhancing Drosophila Gene Ontology Annotations. Nucleic Acids Res. 37 (Database issue), D555–D559. doi:10.1093/nar/gkn788
Voineagu, I., Wang, X., Johnston, P., Lowe, J. K., Tian, Y., Horvath, S., et al. (2011). Transcriptomic Analysis of Autistic Brain Reveals Convergent Molecular Pathology. Nature 474 (7351), 380–384. doi:10.1038/nature10110
Wang, W., Jiang, W., Hou, L., Duan, H., Wu, Y., Xu, C., et al. (2017). Weighted Gene Co-Expression Network Analysis of Expression Data of Monozygotic Twins Identifies Specific Modules and Hub Genes Related to BMI. BMC Genomics 18 (1), 872. doi:10.1186/s12864-017-4257-6
Wiedlocha, M., Marcinowicz, P., Krupa, R., Janoska-Jazdzik, M., Janus, M., Debowska, W., et al. (2018). Effect of Antidepressant Treatment on Peripheral Inflammation Markers - A Meta-Analysis. Prog. Neuropsychopharmacol. Biol. Psychiatry 80 (Pt C), 217–226. doi:10.1016/j.pnpbp.2017.04.026
Wong, L. Y. F., Cheung, B. M. Y., Li, Y.-Y., and Tang, F. (2005). Adrenomedullin Is Both Proinflammatory and Antiinflammatory: Its Effects on Gene Expression and Secretion of Cytokines and Macrophage Migration Inhibitory Factor in NR8383 Macrophage Cell Line. Endocrinology 146 (3), 1321–1327. doi:10.1210/en.2004-1080
Wray, N. R., Ripke, S., Ripke, S., Mattheisen, M., Trzaskowski, M., Byrne, E. M., et al. (2018). Genome-Wide Association Analyses Identify 44 Risk Variants and Refine the Genetic Architecture of Major Depression. Nat. Genet. 50 (5), 668–681. doi:10.1038/s41588-018-0090-3
Xu, X., Piao, H. N., Aosai, F., Zeng, X. Y., Cheng, J. H., Cui, Y. X., et al. (2020). Arctigenin Protects against Depression by Inhibiting Microglial Activation and Neuroinflammation via HMGB1/TLR4/NF‐κB and TNF‐α/TNFR1/NF‐κB Pathways. Br. J. Pharmacol. 177 (22), 5224–5245. doi:10.1111/bph.15261
Yamano, S., Kimura, M., Chen, Y., Imamoto, N., and Ohki, R. (2020). Nuclear Import of IER5 Is Mediated by a Classical Bipartite Nuclear Localization Signal and Is Required for HSF1 Full Activation. Exp. Cel Res. 386 (1), 111686. doi:10.1016/j.yexcr.2019.111686
Zeng, D., He, S., Ma, C., Wen, Y., Xie, Y., Zhao, N., et al. (2019). Co-Expression Network Analysis Revealed that the ATP5G1 Gene Is Associated with Major Depressive Disorder. Front. Genet. 10, 703. doi:10.3389/fgene.2019.00703
Keywords: mood disorder, co-expression network analysis (WGCNA), hub genes, inflammation, neurological
Citation: Yang C, Zhang K, Zhang A, Sun N, Liu Z and Zhang K (2022) Co-Expression Network Modeling Identifies Specific Inflammation and Neurological Disease-Related Genes mRNA Modules in Mood Disorder. Front. Genet. 13:865015. doi: 10.3389/fgene.2022.865015
Received: 29 January 2022; Accepted: 23 February 2022;
Published: 21 March 2022.
Edited by:
Weihua Yue, Peking University Sixth Hospital, ChinaReviewed by:
Chuanjun Zhuo, Tianjin Anding Hospital, ChinaCopyright © 2022 Yang, Zhang, Zhang, Sun, Liu and Zhang. This is an open-access article distributed under the terms of the Creative Commons Attribution License (CC BY). The use, distribution or reproduction in other forums is permitted, provided the original author(s) and the copyright owner(s) are credited and that the original publication in this journal is cited, in accordance with accepted academic practice. No use, distribution or reproduction is permitted which does not comply with these terms.
*Correspondence: Zhifen Liu, liuzhifen5518@163.com; Kerang Zhang, atomsxmu@vip.163.com
Disclaimer: All claims expressed in this article are solely those of the authors and do not necessarily represent those of their affiliated organizations, or those of the publisher, the editors and the reviewers. Any product that may be evaluated in this article or claim that may be made by its manufacturer is not guaranteed or endorsed by the publisher.
Research integrity at Frontiers
Learn more about the work of our research integrity team to safeguard the quality of each article we publish.