 Qiqi Xu
 Xiaodong Xun
 Pengji Gao
94% of researchers rate our articles as excellent or good
Learn more about the work of our research integrity team to safeguard the quality of each article we publish.
Find out more
ORIGINAL RESEARCH article
Front. Genet., 02 May 2022
Sec. Cancer Genetics and Oncogenomics
Volume 13 - 2022 | https://doi.org/10.3389/fgene.2022.864655
This article is part of the Research TopicGenetic and proteomic biomarkers in solid tumor detection and treatmentView all 64 articles
Some previous studies have shown that PLOD2 has some value in tumorigenesis. However, the broad significance of PLOD2 has not been discussed in depth. This study was aimed at elaborated and summarized the value of PLOD2 in various tumors. First, we integrated GTEx, The Cancer Genome Atlas and Cancer Cell Line Encyclopedia databases to analyze the expression of PLOD2, and found that it was expressed differently in normal tissues and significantly highly expressed in most tumors compared with normal tissues. Second, our analysis revealed that PLOD2 expression was negatively correlated with the prognosis of several tumors. For gastric cancer, the median overall survival time was significantly higher in the PLOD2 low expression group [HR 0.616 (95%CI 0.442–0.858), p = 0.004]. Third, for tumor immunity, PLOD2 was significantly associated with tumor infiltration, including immune infiltrating cells; immune checkpoint expression; immune microenvironment scores (immune score, stromal score and estimate scores); immunotherapy-related scores (tumor mutational burden, microsatellite instability, tumor neoantigen burden); expression of DNA repair genes Mismatch Repairs and methyltransferase; and enrichment analyses identified PLOD2-associated terms and pathways. Lastly, twenty pairs of gastric cancer and adjacent immunohistochemistry showed that PLOD2 was significantly overexpressed in gastric cancer (p < 0.001). Collectively, PLOD2 played a significant role in tumorigenesis and maybe serve as a potential biomarker for diagnosis and prognosis in cancers.
The incidence of malignant neoplasms has increased at an alarming rate over the past few decades (Bray et al., 2021; Sung et al., 2021). Pan-cancer analysis aims to examine the similarities and differences between genomic and cellular changes found in different tumor types (Chang et al., 2013; Gentles et al., 2015). Pan-cancer analysis projects, such as the Cancer Cell Line Encyclopedia (CCLE) and The Cancer Genome Atlas (TCGA), were created based on the evaluation of different human cancer cell lines and tissues at the epigenomic, genomic, proteomic, and transcriptomic levels. TCGA provides medical researchers with irreplaceable genomic, epigenomic, transcriptomic, and clinical data (Hutter and Zenklusen, 2018). What’s more, it has boosted the study of tumor immunology and immunotherapy (Thorsson et al., 2018). Pan-cancer analysis has made an important contribution to the development of life science and medicine. For example, on 4 February 2020, Pan-Cancer Analysis of Whole Genomes (PCAWG) Consortium of the International Cancer Genome Consortium (ICGC) and TCGA published six articles in Nature (Author Anonyms, 2020), proposing the most comprehensive cancer genome analysis so far. Different from the previous focus on protein coding regions, this time is to analyze the whole genome of cancer. This program covers six aspects: pan-cancer analysis of whole genomes (ICGC/TCGA Pan-Cancer Analysis of Whole Genomes Consortium, 2020); analyses of non-coding somatic drivers in 2,658 cancer whole genomes (Rheinbay et al., 2020); the repertoire of mutational signatures in human cancer (Alexandrov et al., 2020); patterns of somatic structural variation in human cancer genomes (Li Y et al., 2020); the evolutionary history of 2,658 cancers (Gerstung et al., 2020); genomic basis for RNA alterations in cancer (Calabrese et al., 2020).
PLOD2 (Procollagen-Lysine,2-Oxoglutarate 5-Dioxygenase 2) was a member of PLOD family (PLOD1, PLOD2, PLOD3), which encodes a special protein (also known as LH2, TLH2 and BRKS2) mediating the formation of stabilized collagen cross-links (Genecards, 2021). Collagen crosslinking played a key role in extracellular matrix (Du et al., 2017). Various studies have shown the extracellular matrix (ECM) to be closely to tumor cell growth and metastasis (Gilkes et al., 2014; Tadeo et al., 2016). Upregulation of PLOD2 has been observed in several malignancies such as bladder cancer (Miyamoto et al., 2016), lung cancer (Kocher et al., 2021), gastric cancer (Song et al., 2021), head and neck squamous cell cancer (Xin et al., 2021), breast cancer (Gilkes et al., 2013), etc. Kiyozumi et al. showed that PLOD2 was significantly associated with peritoneal dissemination in gastric cancer (Kiyozumi et al., 2018). In the metastatic group, PLOD2 was significantly highly expressed, both at the mRNA and protein level. Silencing PLOD2 significantly reduced cell invasiveness and migration in vitro. Further experiments showed that this was mainly regulated by HIF-1a in hypoxia condition. Another study on PLOD2 and 5-FU resistance in gastric cancer showed that PLOD2 could enhance 5-FU resistance by regulating BCRP and inhibit cell apoptosis by affecting the expression of Bax and Bcl2 (Wang et al., 2020). Downregulation of PLOD2 facilitated the sensitivity of gastric cancer to 5-FU in vivo. Generally, PLOD2 plays an important role in both tumor growth and closely related to the prognosis of patients. Although a number of studies have been carried out on PLOD2, no single study exists which could overall evaluate its effects on considerable types of cancers. To understand the functions (especially cancer immunity) of PLOD2 in different tumors, a comprehensive pan-cancer analysis was necessary.
To that end, we will elucidate the expression of PLOD2 in 33 different malignant tumors in the following aspects and focus on gastric cancer. All in all, the results of our study provide information regarding the role of PLOD2 in tumors, reveal the relationship between PLOD2 and tumor-immune interactions, and clarify the potential underlying mechanisms.
This study has been approved by the Ethics Committee of Beijing Jishuitan Hospital (202004-58). First, we analyzed the PLOD2 gene expression levels in each normal tissue using the GTEx (Genotype-Tissue Expression) database (https://xena.ucsc.edu/). Second, the data of each tumor cell line were downloaded from the CCLE database (https://sites.broadinstitute.org/ccle), and the expression levels of 21 tissues were analyzed according to the tissue source. Third, we obtained gene expression differences between cancer and para-cancer tissues in individual tumor samples from the TCGA database (https://portal.gdc.cancer.gov/). Fourth, considering the small number of normal samples in TCGA database, we integrated data from GTEx and TCGA database to analyze the differences expression in multiple tumors.
The differences of PLOD2 gene expression were compared according to TNM stages of different tumors (data from TCGA database). Next, univariable and multivariable Cox regression analysis was used to compare the relationship between different PLOD2 expression (divided into high and low expression groups with the median cutoff value) and prognosis. Prognosis includes OS (overall survival; period from the start of treatment to death from any cause), DSS (disease specific survival; cancer survival in the absence of other causes of death), and PFI (progression free interval; period from the start of treatment to disease progression or death from any cause). Subsequently, our findings were verified in the GSE84433 cohort.
We used CIBERSORT(Newman et al., 2019) to explore the association of PLOD2 gene expression with the level of immune infiltration in different types of cancer. CIBERSORT (https://CIBERSORT.stanford.edu/) is a tool for deconvolution of expression matrices of immune cell subtypes based on the principle of linear support vector regression, and can be used to estimate immune cell infiltration with data from RNA-Seq. Then we used xCell algorithm (Aran et al., 2017) and MCP-Counter algorithm (Becht et al., 2016) to verify the result of CIBERSORT.
In the tumor microenvironment, immune cells and stromal cells are two major non-tumor components (Bejarano et al., 2021; Dey et al., 2021). The immune score and stromal score calculated based on ESTIMATE algorithm (Yoshihara et al., 2013). The ESTIMATE algorithm produces three scores on the basis of single sample Gene Set Enrichment Analysis (ssGSEA): stromal score, immune score, and estimate score. In this study, we estimated these 3 scores and then calculated the relationship between these scores and PLOD2 expression.
Furthermore, we examined the correlation between PLOD2 expression and immune checkpoint-related genes (BTLA, CD200, TNFRSF14, NRP1, LAIR1, TNFSF4, CD244, LAG3, ICOS, CD40LG, CTLA4, CD48, CD28, CD200R1, HAVCR2, ADORA2A, CD276, KIR3DL1, CD80, PDCD1, LGALS9, CD160, TNFSF14, IDO2, ICOSLG, TMIGD2, VTCN1, IDO1, PDCD1LG2, HHLA2, TNFSF18, BTNL2, CD70, TNFSF9, TNFRSF8, CD27, TNFRSF25, VSIR, TNFRSF4, CD40, TNFRSF18, TNFSF15, TIGIT, CD274, CD86, CD44, TNFRSF9, shown in Supplementary Figure S4) using R software.
Next, we analyzed the relationship between PLOD2 expression and TMB, MSI, and TNB. TMB is usually defined as the number of somatic nonsynonymous mutations or all mutations occurring per MB in the gene region detected by whole-exome sequencing or targeted sequencing in one tumor sample (Passaro et al., 2020). Somatic mutations calculated by TMB include point mutations and insertion/deletion mutations (Valero et al., 2021). TNB is an indicator of the total number of neoantigens in tumor cells, usually expressed as the number of tumor neoantigens per million bases of tumor genomic region (Wang et al., 2021). The combination of TMB and TNB can better predict the efficacy of immunotherapy. MSI, the insertion or loss of base pairs in microsatellite regions due to replication errors, was first identified in colorectal cancer and is thought to be a feature of hereditary non-polyposis colorectal cancer (Lynch syndrome) (Vilar and Gruber, 2010) and has since been found in a variety of sporadic tumors.
We downloaded the PLOD2 genetic mutation data, transcriptome data, and clinical data from the TCGA database. To identify the somatic mutations of the patients with PLOD2 in the TCGA database, mutation data were downloaded and visualized using the “maftools” package in R software. Horizontal histogram showed the genes have the higher mutation frequency in patients with PLOD2.
Finally, we evaluated the relationship between the expression of PLOD2 and 5 DNA repair genes (MMRs: MLH1, MSH2, MSH6, PMS2, EPCAM) and 4 methyltransferases (DNMT1, DNMT2, DNMT3A, DNMT3B) genes.
Using JAVA (http://software.broadinstitute.org/gsea/index.jsp), we conducted GSEA to assess for possible underlying mechanisms based on the ‘Molecular Signatures Database’ of c5.all.v7.1.symbols and c2.cp.kegg.v7.1.symbols. When the number of random sample arrangements was 100 and the significance threshold was p < 0.05, R software and Bioconductor (http://bioconductor.org/) were applied to visualize our results.
Tissue sections were prepared from the paraffin-embedded tissue samples. Then PLOD2 immunostaining was performed according to the instructions (proteintech 21214-1-AP, China). Immunohistochemical scoring was performed by semi-quantitative analysis (20 pairs of gastric cancer and adjacent tissues). Two pathologists analyzed and scored the immunohistochemistry of gastric tissue. Each slice was randomly observed for 5 high-power visual fields, and scored according to the percentage of positive cells (0–5%, 6–25%, 26–50%, 51–75%, 76–100% were recorded as 0, 1, 2, 3, and 4 points respectively) and the intensity of staining (0, 1, 2, and 3 points respectively for non-staining, light, medium, and deep). The total score was the sum of staining intensity and percentage of positive cells. Next, we validated the expression of PLOD2 in STAD and normal tissues in the Human Protein Atlas (HPA) database (Uhlén et al., 2015).
The Wilcoxon log-rank test was used to determine the presence or absence of a markedly increased sum of gene expression z-scores for tumor tissues, as compared to adjacent normal tissues. The difference in PLOD2 expression between different tumor stages was compared using the Kruskal–Wallis H test. Survival was analyzed using the K-M curves, log-rank test, and Cox proportional hazards regression model. Spearman’s test was used for correlation analysis. R language (version 3.6.0; R Foundation) was used for all analyses. A two-sided p < 0.05 indicated a statistically significant difference.
Firstly, we analyzed the expression levels of PLOD2 in 7858 normal samples using the GTEx dataset. As shown in Figure 1A, the differences in PLOD2 gene expression were significant (p < 0.001) in 31 tissues. Subsequently, we analyzed data downloaded from the CCLE database for each tumor cell line. There were significant differences in expression among the 21 tumor cell lines (Figure 1B), with the highest in renal tumors. Further, we obtained the differences in PLOD2 from the TCGA database between cancer and para-cancer in individual tumor samples; and as shown in Figure 1C, PLOD2 was highly expressed in 11 (ESCA, GBM, HNSC, KIRC, KIRP, LGG, LIHC, LUAD, LUSC, STAD, UCEC) of 20 different tumors, lowly expressed in 4 tumors (COAD, KICH, PRAD, READ). Finally, considering the small number of normal samples in TCGA database, we integrated data from GTEx and TCGA database to analyze the differences expression in multiple tumors (Supplementary Table S1). As shown in Figure 1D, PLOD2 was highly expressed in 18 tumors (BRCA, CESC, ESCA, GBM, HNSC, KIRC, KIRP, LGG, LIHC, LUAD, LUSC, OV, PAAD, STAD, TGCT, THCA, UCEC, UCS) and lowly expressed in 3 tumors (LAML, PRAD, READ).
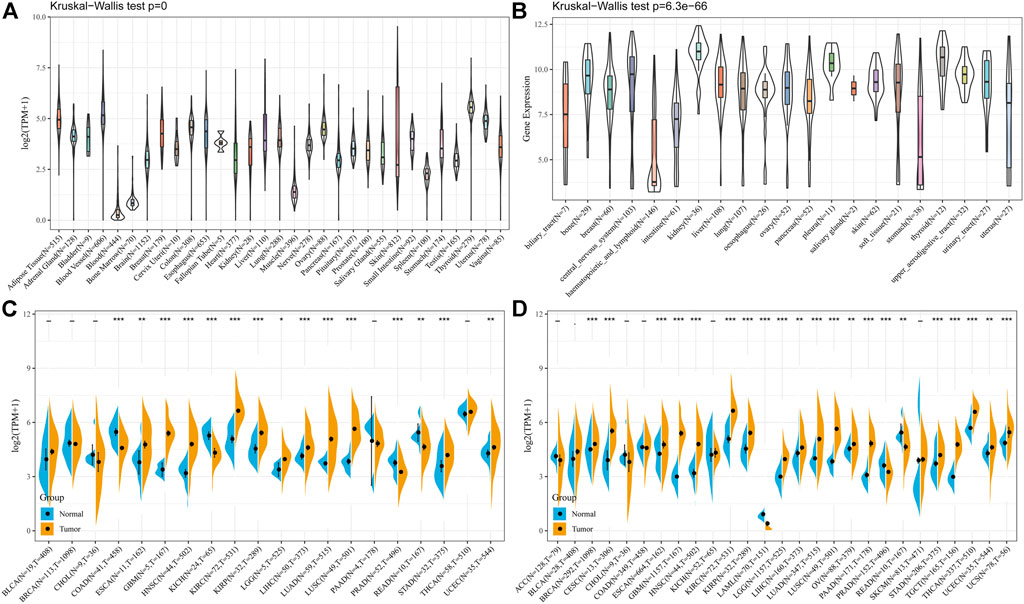
FIGURE 1. The PLOD2 expression level in human pan-cancer analyses. (A) Expression of PLOD2 in normal tissues in GTEx. (B) Expression of PLOD2 in CCLE. (C) The level of PLOD2 in TCGA. (D) The expression level in TCGA combined with GTEx. The blue and yellow bar graphs indicate normal and tumor tissues, respectively. *p < 0.05; **p < 0.01; ***p < 0.001. The significance of the two groups of samples passed the Wilcox test.
To assess the levels of gene expression for all tumor stages, we compared PLOD2 expression in patients with different stages. As demonstrated in Supplementary Figure S1, PLOD2 expression was upregulated at the advanced stages in BLCA, COAD, HNSC, KIRC, KIRP, LIHC, LUAD, and READ.
In the OS analysis, Cox regression identified that high PLOD2 expression was a risk factor for CESC (p < 0.001), CHOL (p = 0.032), HNSC (p = 0.005), KICH (p < 0.001), KIRC (p = 0.001), KIRP (p = 0.034), LGG (p < 0.001), LIHC (p < 0.001), LUAD (p = 0.001), MESO (p = 0.020), PAAD (p = 0.006), SARC (p = 0.005), and STAD (p = 0.001); however, it appeared to be a protective factor in LAML (p = 0.024) and SKCM (p = 0.049), as shown in Supplementary Figure S2A. The Cox regression analysis of DSS indicated that high PLOD2 expression is a risk factor in CESC (p < 0.001), CHOL (p = 0.038), ESCA (p = 0.045), HNSC (p = 0.020), KICH (p < 0.001), KIRC (p < 0.001), LGG (p < 0.001), LIHC (p < 0.001), LUAD (p = 0.001), MESO (p = 0.007), PAAD (p = 0.004), SARC (p = 0.005) and STAD (p = 0.006) as illustrated in Supplementary Figure S2B. The Cox regression analysis of PFI revealed that higher PLOD2 expression is a risk factor in CESC(p < 0.001), ESCA (p = 0.049), KICH (p < 0.001), KIRC (p < 0.001), LGG (p < 0.001), LIHC (p = 0.001), LUAD (p = 0.004), MESO (p = 0.028), PAAD (p = 0.015), SARC (p < 0.001) and STAD (p = 0.047). In the DFI analysis, Cox regression identified that high PLOD2 expression was a risk factor for CESC (p = 0.010), CHOL (p = 0.038), KIRC (p = 0.023), LIHC (p = 0.019), LUAD (p = 0.022), PAAD (p < 0.001) and SARC (p = 0.007).
We further analyzed the relationship between PLOD2 gene expression and prognosis in gastric cancer patients in detail (Figure 2). Figures 2A–C showed the relationship between PLOD2 gene expression and OS, DSS and PFI, respectively. In the OS analysis, as illustrated in Figure 2A, we split cases into high-risk and low-risk groups according to the median expression. The median OS time was significantly higher in the PLOD2 low expression group than in the high expression group [HR 1.69 (95% CI 1.21–2.36), p = 0.002]. Time-dependent receiver operating characteristic (ROC) curves were plotted and the area under curve (AUC) values of the classifier to predict 1-, 3-, and 5-year OS were 0.612, 0.619, and 0.731, respectively (Figure 2D). In DSS analysis (Figure 2B) and PFI analysis (Figure 2C), hazard ratio was 1.77 (95% CI 1.16–2.69, p = 0.008) and 1.64 (95% CI 1.15–2.34, p = 0.006), respectively. AUC values of the classifier to predict 1-, 3-, and 5-year DSS were 0.608, 0.622, and 0.728, respectively (Figure 2E). AUC values of the classifier to predict 1-, 3-, and 5-year PFI were 0.611, 0.629, and 0.663, respectively (Figure 2F). As shown in Figure 3A, in the GSE84433 validation cohort (355 patients remained after deleting 2 patients who survived less than 1 month), the overall survival time of the PLOD2 low expression group was also significantly longer than that of the high expression group [HR 0.73, 95% CI (0.54–0.99), p = 0.041].
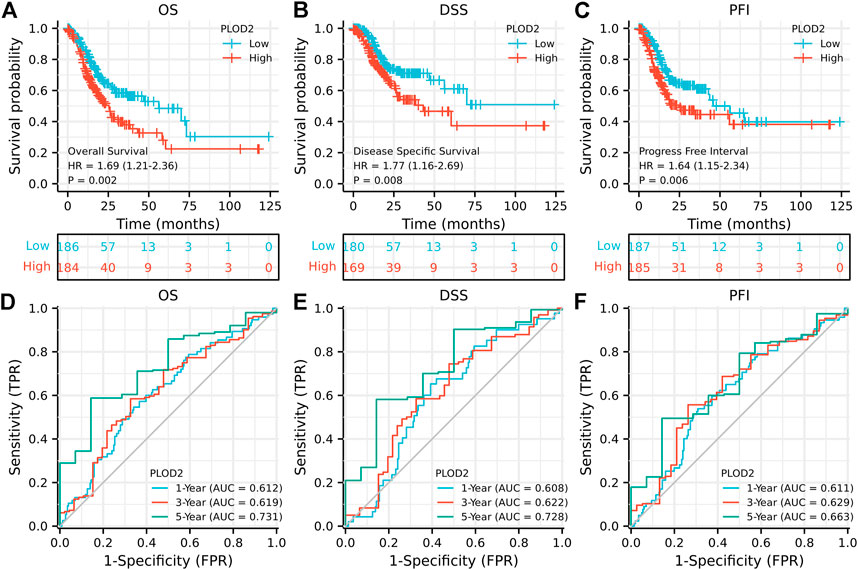
FIGURE 2. Prognostic analysis of PLOD2 gene signature in STAD in the TCGA set. (A) overall survival (B) disease-specific survival (C) progression-free interval (D) ROC of overall survival (E) ROC of disease-specific survival (F) ROC of progression-free interval.
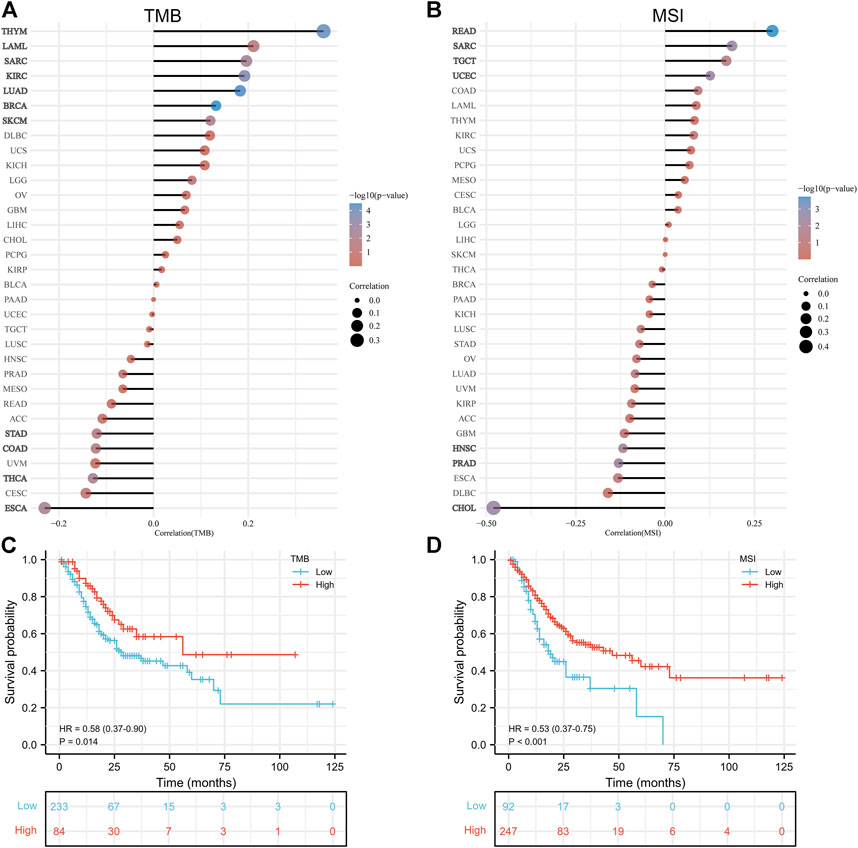
FIGURE 3. Correlation analysis of PLOD2 expression with tumor mutational burden and microsatellite instability. (A) with TMB (B) with MSI (C) relationship between TMB and overall survival (D) relationship between MSI and overall survival.
As shown in Table 1, univariate analysis showed that age (p = 0.005), T stage, N stage, M stage, pathologic stage and PLOD2 expression were significantly correlated with OS (all p < 0.05). However, in multivariate analysis, only age [HR: 1.731 (95% CI 1.194–2.508), p = 0.004], M stage [HR: 2.038 (95% CI 1.094–3.799), p = 0.025] and PLOD2 expression [HR: 1.484 (95% CI 1.034–2.131), p = 0.032] were significantly correlated with prognosis. In the GSE84433 validation cohort, both univariate [HR 1.369 95% CI (1.013–1.851), p = 0.041] and multivariate [HR 1.434 95% CI (1.057–1.947), p = 0.021] analysis, the overall survival of PLOD2 high expression group was significantly worse than that of low expression group (Figure 3B).
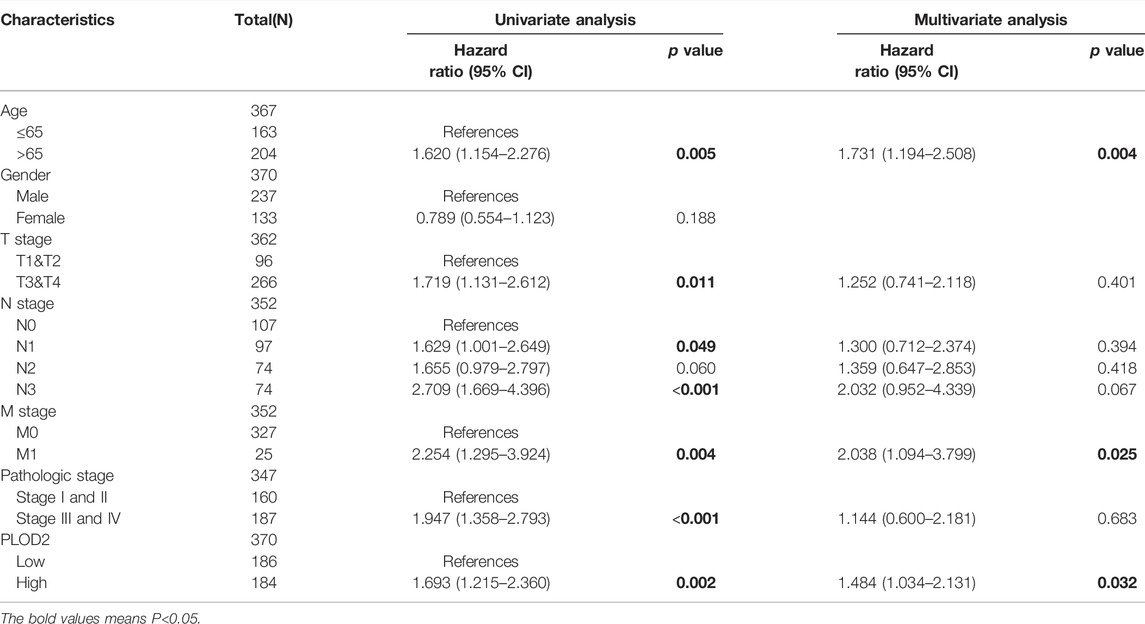
TABLE 1. Univariate and multivariate Cox regression analysis of overall survival.
Tumor-infiltrating lymphocytes are independent predictors of lymph node status and survival in cancer precursors. Immune infiltrating cells were analyzed using CIBERSORT. Although the tumor types differed, the relationship between PLOD2 expression and immune cells was similar. For example, PLOD2 expression was significantly negatively correlated with memory B cell, activated NK cell, Plasma cell, CD8 T cell, follicular helper T cell, regulatory T cell in most tumors; and significantly positively correlated with Macrophages M0, Macrophages M1, Macrophages M2, activated Mast cell, resting NK cell, CD4 memory activated T cell, CD4 memory resting T cell. As shown in Figure 4C, PLOD2 was significantly correlated with 19 immune checkpoints in patients with STAD, of which 80% (14/19, CD200, CD276, CD28, CD44, CD80, CD86, HAVCR2, LAIR1, NRP1, PDCD1LG2, TNFRSF25, TNFRSF9, TNFSF14, TNFSF18, TNFSF4) was positively correlated.
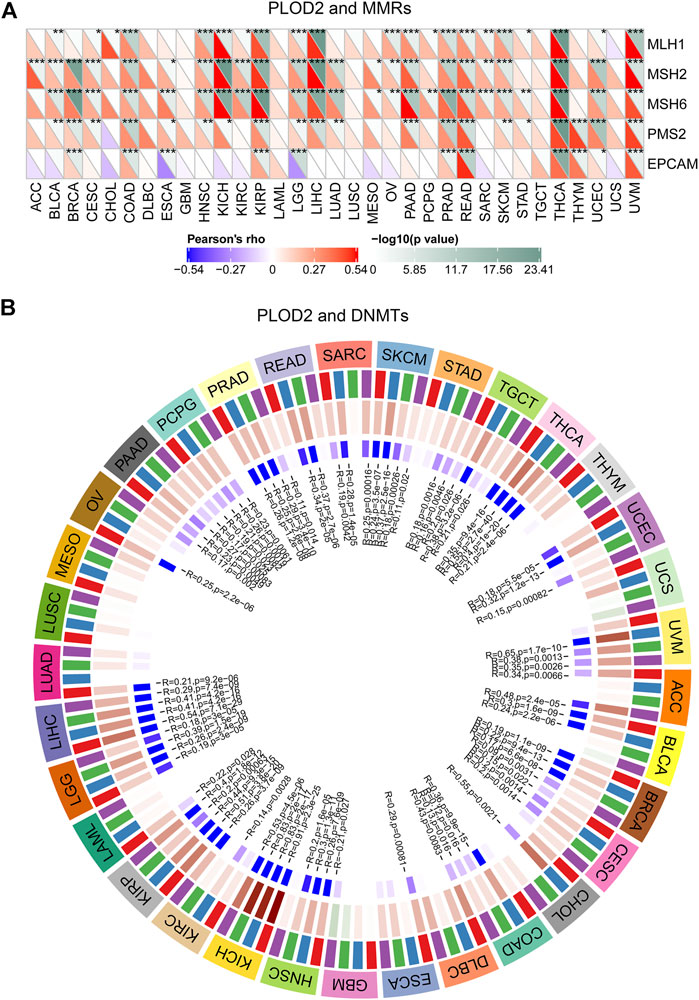
FIGURE 4. Relationship between PLOD2 expression and MMRS and methyltransferase in pan-cancer. (A) Relationship between PLOD2 expression and mutation of 5 MMRs genes. (B) Relationship between 4 methyltransferases and PLOD2 expression. Red, blue, green, and purple colors are indicated DNMT1, DNMT2, DNMT3A, and DNMT3B, respectively.
Next, we analyzed the relationship between PLOD2 expression and infiltrating immune cells in gastric cancer based on the xCELL algorithm. As shown in Figure 4B, the proportion of T cell CD4+ Th1, Macrophage, Macrophage M1, Plasmacytoid dendritic cell, B cell, Monocyte, Neutrophil, and Endothelial cell were significantly higher in the PLOD2 high expression group than low expression group. Contrarily, the proportion of B cell plasma, microenvironment score, T cell CD8+ effector memory, T cell CD8+ central memory, Class-switched memory B cell, B cell memory, Granulocyte-monocyte progenitor, Hematopoietic stem cell and stroma score were higher in the PLOD2 low expression group. we also used MCP-Counter deconvolution methods to verify our results (Supplementary Figures S7A,B). In the GSE84433 validation cohort, macrophage M0 (p < 0.05) and macrophage M2 (p < 0.05) increased significantly in the PLOD2 high expression group, while T cell CD4 + memory activated (p < 0.001) decreased significantly (Figure 3C).
Numerous studies indicated that the tumor immune microenvironment has an important role in tumor development. As shown in Table 2, in 9 kinds of tumors (BLCA, COAD, GBM, KIRC, LGG, OV, PAAD, PCPG, and PRAD), immune scores were positively correlated with the expression of PLOD2 and negatively correlated with the expression of CESC, SARC, TGCT, THCA, THYM, and UCEC. For stromal scores, 22 kinds of tumors (BLCA, BRCA, COAD, DLBC, ESCA, GBM, HNSC, KIRC, LAML, LGG, LUAD, LUSC, OV, PAAD, PCPG, PRAD, READ, SARC, SKCM, STAD, TGCT and THYM) were positively correlated with the expression of PLOD2. Combining immune scores and stromal scores gives estimate scores. PLOD2 gene expression was positively correlated with estimate scores in 17 tumors (BLCA, BRCA, COAD, DLBC, ESCA, GBM, HNSC, KIRC, LAML, LGG, LUAD, OV, PAAD, PCPG, PRAD, READ, and STAD, in Supplementary Figure S3).
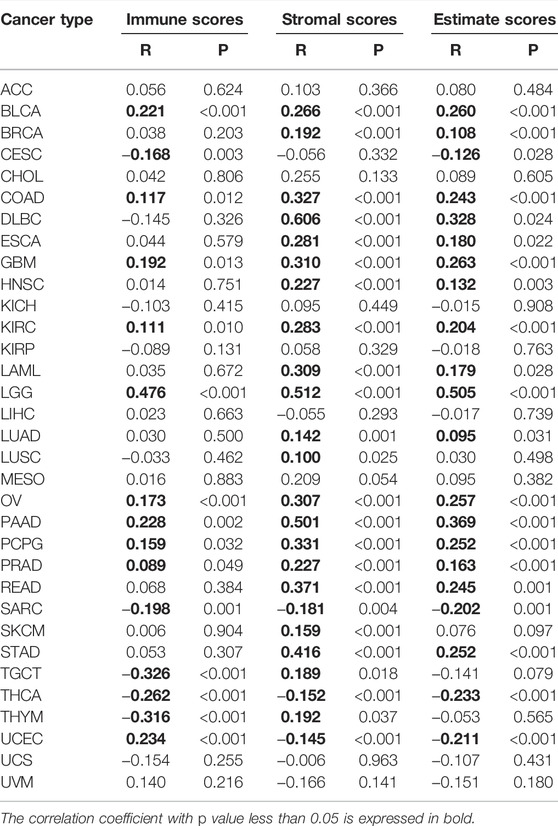
TABLE 2. Correlation analysis of PLOD2 expression with immune scores, stromal scores, and estimate scores.
Finally, we collected more than forty common immune checkpoint genes to analyze the relationship between PLOD2 gene expression and immune checkpoint gene expression (Supplementary Figure S4). Among them, TNFRSF14, NRP1, LAIR1, TNFSF4, CD276, CD80, PDCD1LG2, CD274, CD86, and CD44 were significantly positively correlated with PLOD2 expression.
In general, high TMB is associated with better OS; higher TMB is associated with better response to immune checkpoint inhibition. The association between TMB and PLOD2 expression was evaluated, as seen in Figure 5A. PLOD2 expression was positively correlated with TMB in BRCA (p < 0.001), LUAD (p <0.001), THYM (p < 0.001), KIRC (p < 0.001), SARC (p = 0.003), SKCM (p = 0.009), and LAML (p = 0.041); but negatively correlated with ESCA (p = 0.004), THCA (p = 0.005), STAD (p = 0.021) and COAD (p = 0.022). In addition, in the low expression group of PLOD2, there was a significant negative correlation between PLOD2 and TMB (r = -0.160, p = 0.030), but there was no significant correlation in the high expression group (r = 0.013, p = 0.862). As shown in Figure 5C, TMB was significantly correlated with OS. OS in the TMB high group was significantly longer than that in the low group [HR 0.58 95% CI (0.37–0.90), p = 0.014].
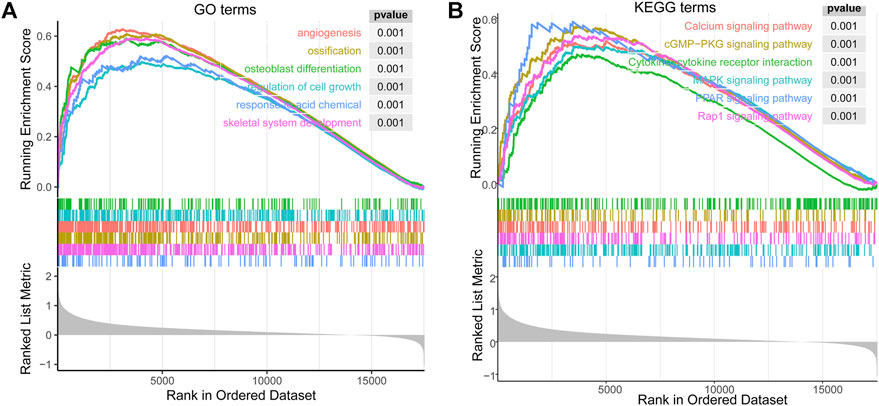
FIGURE 5. The enrichment results of GSEA correlated with PLOD2 expression in STAD. (A) top 6 significant enrichment GO terms. (B) top 6 KEGG terms.
PLOD2 was positively correlated with MSI in READ (p < 0.001), SARC (p = 0.003), UCEC (p = 0.003), and TGCT (p = 0.048); but negatively correlated with CHOL (p = 0.003), PRAD (p = 0.004) and HNSC (p = 0.008), as shown in Figure 5B. With similarly, the results of TMB, PLOD2 was negatively correlated with MSI in the low expression group (r = -0.148, p = 0.043), but not in the high expression group (r = -0.049, p = 0.505). The OS of high MSI group was significantly longer than that of low group, in Figure 5D [HR 0.53 95% CI (0.37–0.75), p < 0.001].
We downloaded mutect-processed mutation data from TCGA to analyze the mutation of PLOD2 gene in these tumors. As Supplementary Figure S6A demonstrated, the proportion of PLOD2 mutations in each tumor, which ranged from 5.09% (UCEC) to 0.23% (OV). Supplementary Figure S6B shown the distribution of mutations in the top 3 tumors, UCEC (5.09%), COAD (2.76%) and STAD (2.75%). In STAD, the most common of the was Missense Mutation, followed by Frame Shift Del and Nonsense Mutation.
MMRs (Mismatch Repairs) was the repair of nucleotide sequences to normal in DNA molecules containing mismatched bases. Thus, the MMR system was a safety and security system in vivo that maintains the integrity and stability of genetic material. As shown in Figure 6A, the expression of PLOD2 was positively correlated with MLH1, MSH2, and MSH6 in a variety of tumors. In STAD, PLOD2 expression was positively correlated with MLH1, MLH6, and PSM2.
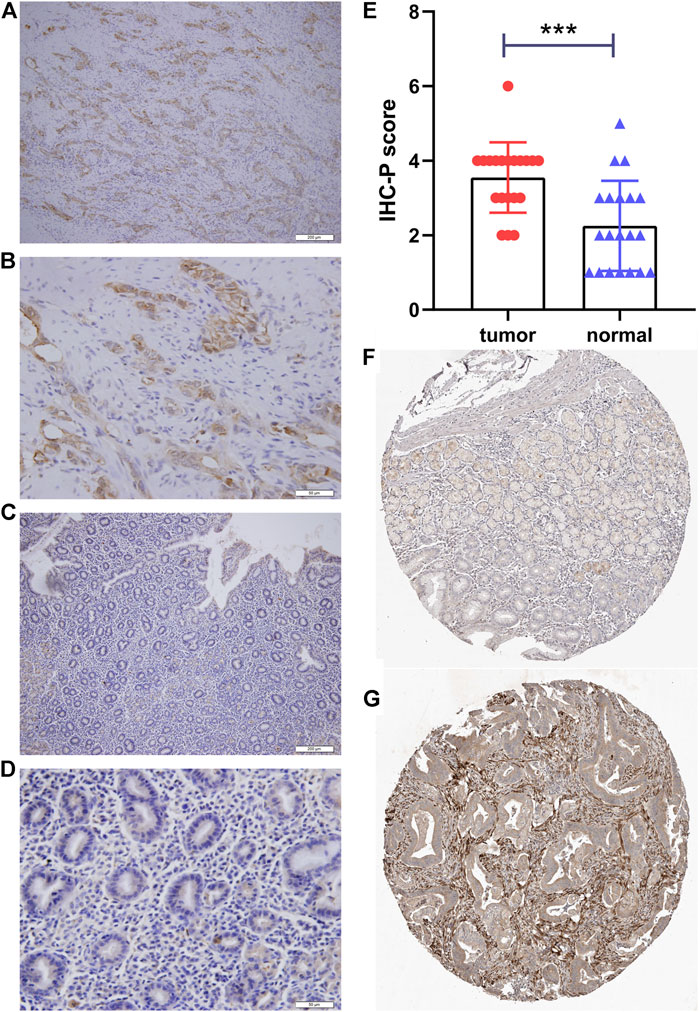
FIGURE 6. Immunohistochemical staining of PLOD2. (A) gastric cancer, ×10. (B) gastric cancer, ×40. (C) adjacent tissue, ×10. (D) adjacent tissue, ×40. (E) Statistical analysis of cancer and adjacent tissue. (F) validation the expression of PLOD2 in normal tissues (Patient ID 1650, staining low) in the Human Protein Atlas (HPA) database (G) validation the expression of PLOD2 in STAD (Patient ID 2557, staining medium) in the HPA database ***p < 0.001.
In addition, a close relationship was observed between PLOD2 expression and mutations in 4 methyltransferases (DNMT1, DNMT2, DNMT3A, DNMT3B) in several cancer types (Figure 6B). For example, in STAD, POLD2 expression was positively correlated with DNMT3A (marked green, R = 0.18, p = 0.002) and DNMT3B (marked purple, R = 0.16, p = 0.005) expression.
The biological effect of PLOD2 expression was assessed using GSEA. In STAD, Figure 7A showed top 6 significant enrichment GO terms: angiogenesis (GO:0001525); ossification (GO:0001503); osteoblast differentiation (GO:0001649); regulation of cell growth (GO:0001558); response to acid chemical (GO:0001101); skeletal system development (GO:0001501). The top 6 KEGG terms also showed significant enrichment (Figure 7B): Calcium signaling pathway (hsa04020); cGMP−PKG signaling pathway (hsa04022); Cytokine−cytokine receptor interaction (hsa04060); MAPK signaling pathway (hsa04010); PPAR signaling pathway (hsa03320); Rap1 signaling pathway (hsa04015).
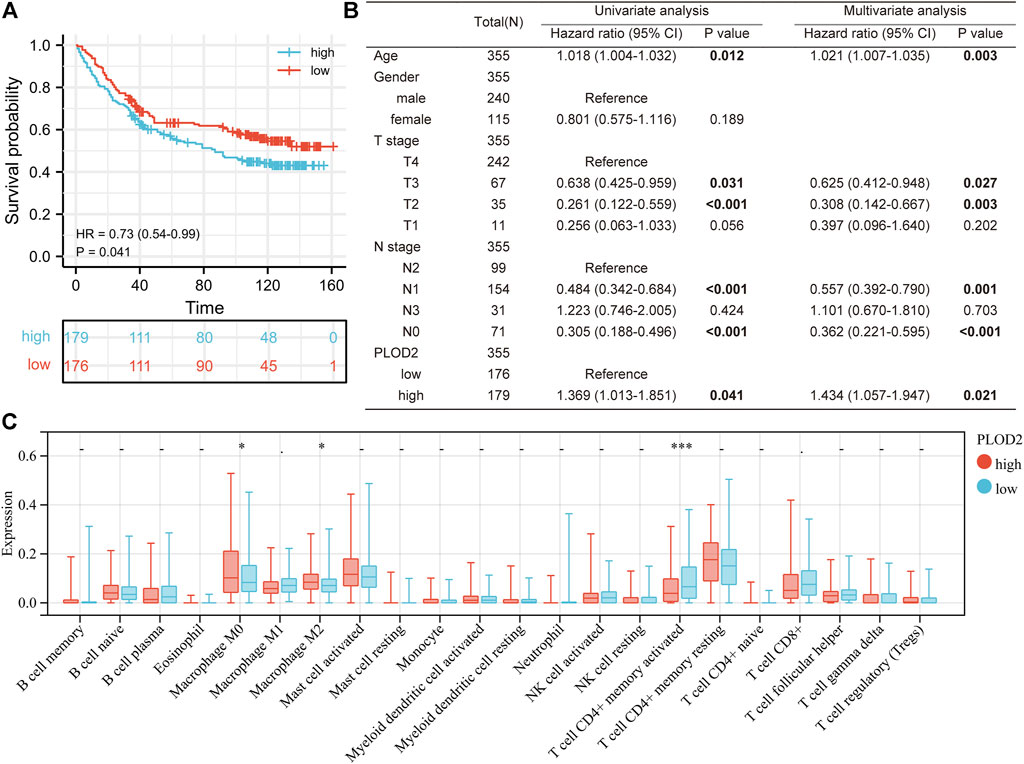
FIGURE 7. Validation PLOD2 expression in GSE84433 cohort. (A) survival curve of high and low PLOD2 expression. (B) univariate and multivariate analysis of overall survival in GSE84433 cohort. (C) immune infiltration difference between high and low PLOD2 expression in GSE84433 cohort, based on CIBERSORT deconvolution method.
As shown in Table 3, the average age of the 20 gastric cancer patients was 62 years old, and women accounted for 35%. Among the clinical stages, stage III or IV accounted for 55%, signet ring cell carcinoma accounted for 25%, and diffuse, intestinal and mixed accounted for 55%, 15%, and 30% respectively. We note that clinical stage III or IV in PLOD2-high group accounted for 75%, and Lauren’s type was mainly diffuse and mixed; while clinical stage III or IV in PLOD2-high group accounted for 25%. Lauren’s classification was mainly diffuse and intestinal. However, due to the small sample size, there was no significant difference. Figure 8 showed the immunohistochemical staining results of 20 pairs of gastric cancer and corresponding adjacent tissues. In the gastric cancer group, PLOD2 was significantly overexpressed, while the expression in adjacent tissues was low. The median values of the two groups were 4 and 2 respectively. There was significant difference in staining score (p < 0.001, Figure 8E). Figures 8A,B were cancer tissues, and Figures 8C,D were adjacent tissues. The results of HPA database also showed that the expression of PLOD2 in STAD was higher than that normal gastric tissue (Figures 8F,G).
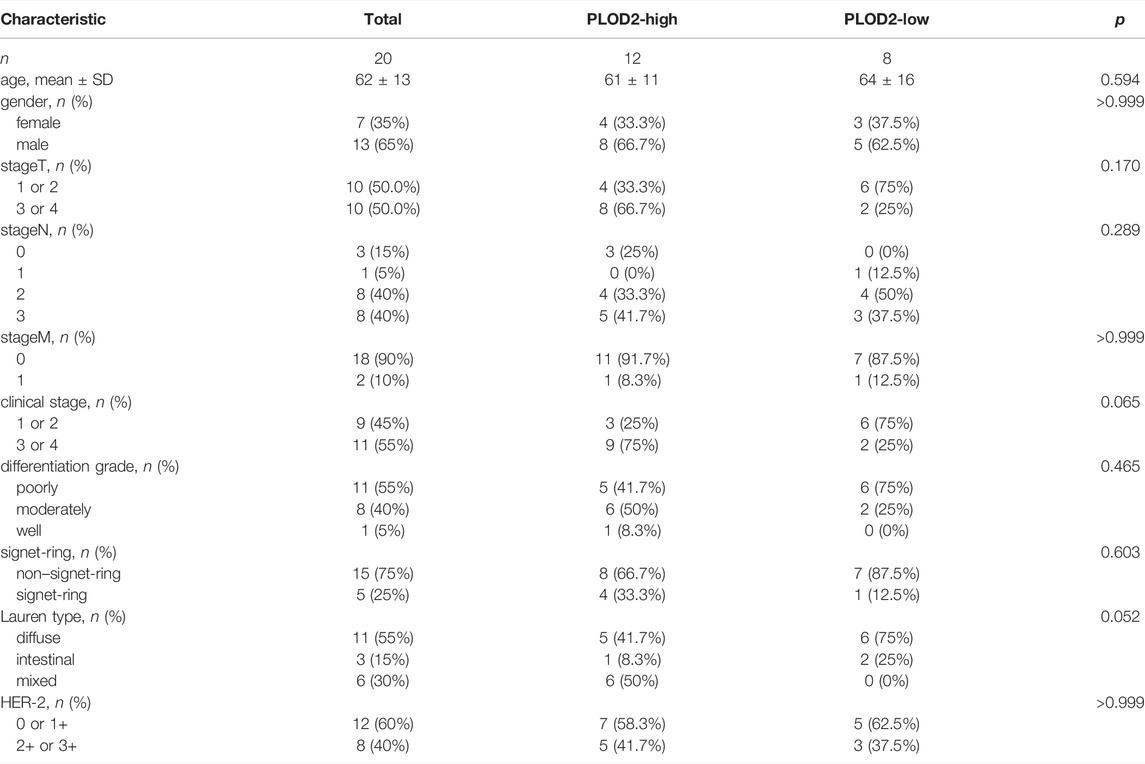
TABLE 3. Relationship between PLOD2 expression and clinicopathology.
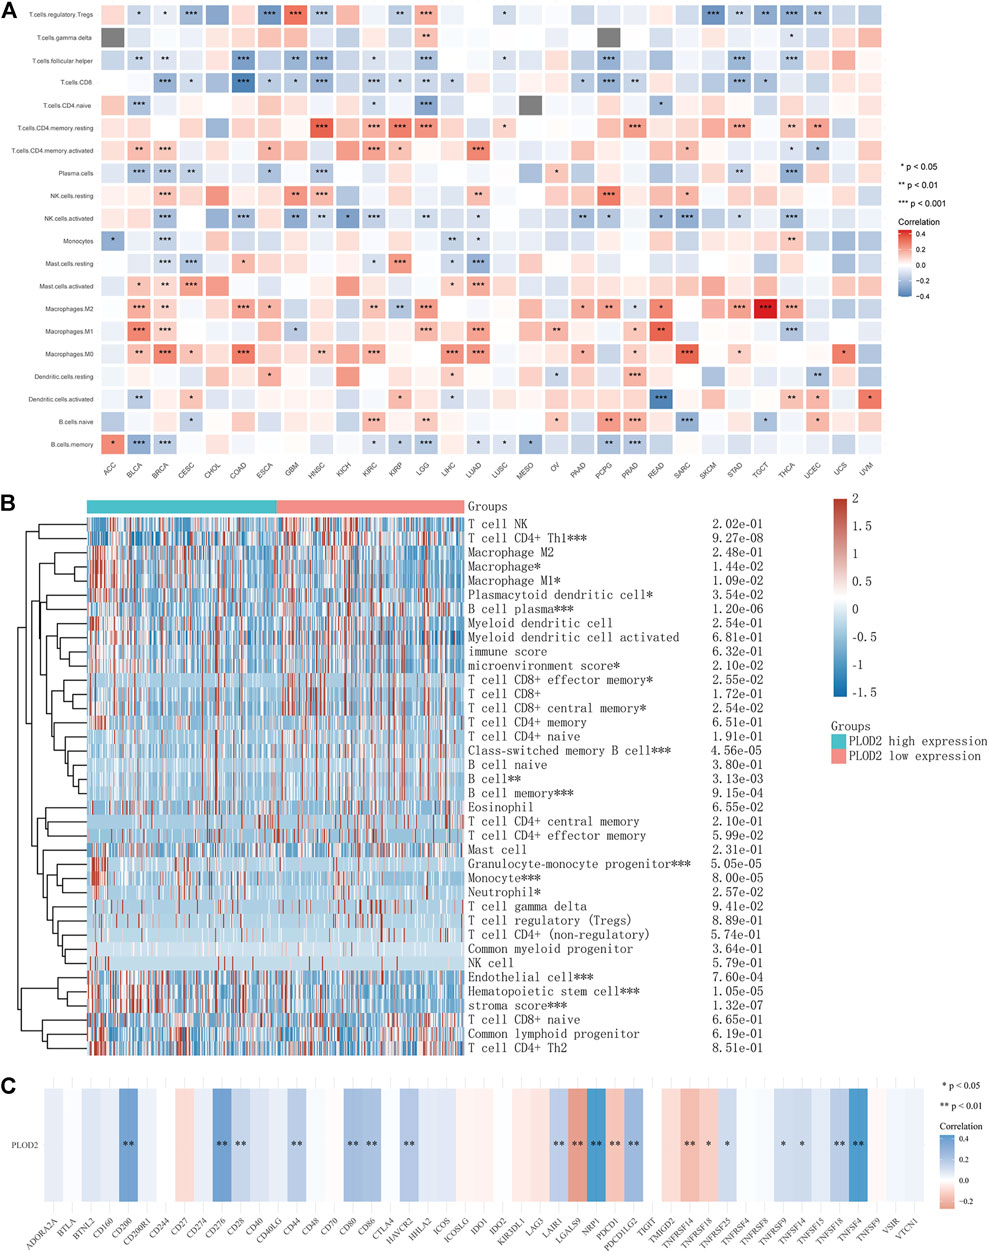
FIGURE 8. Relationship between PLOD2 expression and immune cells in pan-cancer. (A) CIBERSORT predicts that PLOD2 expression is correlated with immunocytes. (B) Heatmap of PLOD2 expression and infiltrating immune cells in STAD based on the xCELL algorithm. (C) relationship between PLOD2 and immune checkpoint in STAD.
The present study aimed to demonstrate a comprehensive workflow for pan-cancer analysis and to extensively investigate the role of PLOD2 as it related to various cancers. Based on our results, we found that PLOD2 overexpression was associated with prognosis in a variety of tumors (CHOL, HNSC, KIRC, KIRP, LAML, LUAD, MESO, PAAD, SARC, SKCM, and STAD) based on Cox proportional risk models and KM survival analysis. We focused on the relationship between PLOD2 expression and STAD. Univariate and multivariate analysis showed that the overall survival time of PLOD2 high expression group was significantly less than low group. Immunohistochemical results also showed that the PLOD2 expression in gastric cancer was significantly higher than normal tissues.
In order to investigate the research status of PLOD2 and gastric cancer, we conducted a search on the PubMed using the following search strategy: [“stomach neoplasms” (Title/Abstract) OR “stomach neoplasms” (MeSH Terms) OR “gastric adenocarcinoma” (Title/Abstract)] AND [“PLOD2” (Title/Abstract)]. Finally, seven studies were found (Kiyozumi et al., 2018; Li S. S et al., 2020; Luo et al., 2020; Wang et al., 2020; Dai et al., 2021; Li et al., 2021; Song et al., 2021). Dai et al. constructed a prognostic model for five genes including PLOD2, which was subsequently validated by RT-PCR in normal tissue and gastric cancer cell lines (Dai et al., 2021). However, their study did not perform analyses related to tumor immunity (including infiltrating immune cells, TMB, etc.). Similarly, Li J et al.(Li et al., 2021), Li SS et al. (Li S. S et al., 2020), Luo et al. (Luo et al., 2020), and Song et al.(Song et al., 2021) were also constructed multiple genes (including PLOD2) prognostic model, but all lacked tumor immune-related analysis or only had comparisons of different immune cell classifications. Kiyozumi et al. study showed that PLOD2 promotes cell invasion and migration in gastric cancer under hypoxic conditions and leads to dissemination to the peritoneum, in vitro (Kiyozumi et al., 2018). This might be even better when coupled with a PLOD2 knockout or overexpression mouse model. Wang et al. conducted a study on the relationship between PLOD2 gene expression and gastric cancer chemotherapy (Wang et al., 2020). Their results showed that PLOD2 knockdown in BGC823 cells significantly reduced the IC50 value of 5-FU, which contributed to the reduction of migration and invasion and promoted apoptosis of gastric cancer cells. The opposite result appeared in PLOD2 overexpressing MGC803 cells. In vivo experiments showed that knockdown of PLOD2 gene enhanced the inhibitory effect of 5-FU on the growth of transplanted tumors in nude mice. It is particularly unfortunate that the study was only cellular and animal-based, and extrapolation to human gastric cancer requires further validation. In brief, all of the above studies have their own merits and there were many areas for further improvement also.
Our study showed that both OS, DSS, and PFI suggested that the prognosis of PLOD2 high group of was significantly worse than that low group. This may be related to the following reasons. Firstly, the immune cell infiltration in the low group was more abundant (DC, M1 macrophages, CD4 + T cells, CD8 + T cells higher than PLOD2 low group (Figure 4B). Secondly, immune checkpoint gene was also significantly overexpressed in the high expression group. Thirdly, the tumor stroma score in the high group was significantly higher than low group (shown in Figure 4B). This indicates that the proportion of non-immune cells [e.g., cancer associated fibroblasts (Chen and Song, 2019)] was aplenty in the high group. Derks et al. showed that the infiltration of non-immune cells (such as fibroblasts and stromal cells) was associated with poor prognosis in gastroesophageal adenocarcinomas (Derks et al., 2020). In addition, immunohistochemical results showed that in the high PLOD2 group, the clinical stages were mainly stage III and stage IV, and the proportion of signet ring cell carcinoma was also higher. Signet ring cell carcinomas was usually “cold tumor” (i.e., lack of immune infiltration) (Garcia-Pelaez et al., 2021; Monster et al., 2022). Therefore, we speculated that the high expression of PLOD2 and poor prognosis may be related to immune infiltration and pathological types. However, further animal experiments were needed to prove it.
In conclusion, we have found that PLOD2 can serve as a valuable prognostic biomarker for some tumors, especially gastric cancer. We believe that these findings may lay the groundwork for prospective functional experiments and eventually have an impact in clinical work.
The datasets presented in this study can be found in online repositories. The names of the repository/repositories and accession number(s) can be found in the article/Supplementary Material.
The studies involving human participants were reviewed and approved by the Ethics Committee of Beijing Jishuitan Hospital. Written informed consent for participation was not required for this study in accordance with the national legislation and the institutional requirements.
QX and PG designed the manuscript. QX wrote and completed the manuscript. QX, NK, YZ, QW, XW, and XX completed the data download and analysis. All authors contributed to the article and approved the submitted version.
This study was supported by Beijing JST Research Funding (ZR-201919).
The authors declare that the research was conducted in the absence of any commercial or financial relationships that could be construed as a potential conflict of interest.
All claims expressed in this article are solely those of the authors and do not necessarily represent those of their affiliated organizations, or those of the publisher, the editors and the reviewers. Any product that may be evaluated in this article, or claim that may be made by its manufacturer, is not guaranteed or endorsed by the publisher.
We thanks to Sangerbox platform (http://sangerbox.com/) and Assistant for Clinical Bioinformatics platform (https://www.aclbi.com/) for providing support in data analysis and plotting.
The Supplementary Material for this article can be found online at: https://www.frontiersin.org/articles/10.3389/fgene.2022.864655/full#supplementary-material
CCLE, cancer cell line encyclopedia; TCGA, the cancer genome atlas; PLOD2, procollagen-lysine,2-oxoglutarate 5-dioxygenase 2; ECM, extracellular matrix; TMB, tumor mutational burden; MSI, microsatellite instability; TNB, tumor neoantigen burden; GSEA, gene set enrichment analysis; GTEx, genotype-tissue expression; OS, overall survival; DFI, disease free interval; DSS, disease specific survival; PFI, progression free interval; KM, Kaplan-Meier.
Alexandrov, L. B., Kim, J., Kim, J., Haradhvala, N. J., Huang, M. N., Tian Ng, A. W., et al. (2020). The Repertoire of Mutational Signatures in Human Cancer. Nature 578 (7793), 94–101. doi:10.1038/s41586-020-1943-3
Aran, D., Hu, Z., and Butte, A. J. (2017). xCell: Digitally Portraying the Tissue Cellular Heterogeneity Landscape. Genome Biol. 18 (1), 220. doi:10.1186/s13059-017-1349-1
Author Anonyms, (2020). The Era of Massive Cancer Sequencing Projects Has Reached a Turning point. Nature 578 (7793), 7–8. doi:10.1038/d41586-020-00308-w
Becht, E., Giraldo, N. A., Lacroix, L., Buttard, B., Elarouci, N., Petitprez, F., et al. (2016). Estimating the Population Abundance of Tissue-Infiltrating Immune and Stromal Cell Populations Using Gene Expression. Genome Biol. 17 (1), 218. doi:10.1186/s13059-016-1070-5
Bejarano, L., Jordāo, M. J. C., and Joyce, J. A. (2021). Therapeutic Targeting of the Tumor Microenvironment. Cancer Discov. 11 (4), 933–959. doi:10.1158/2159-8290.cd-20-1808
Bray, F., Laversanne, M., Weiderpass, E., and Soerjomataram, I. (2021). The Ever‐increasing Importance of Cancer as a Leading Cause of Premature Death Worldwide. Cancer 127 (16), 3029–3030. doi:10.1002/cncr.33587
Calabrese, C., Davidson, N. R., Davidson, N. R., Demircioğlu, D., Fonseca, N. A., He, Y., et al. (2020). Genomic Basis for RNA Alterations in Cancer. Nature 578 (7793), 129–136. doi:10.1038/s41586-020-1970-0
Chang, K., Weinstein, J. N., Collisson, E. A., Mills, G. B., Shaw, K. R., Ozenberger, B. A., et al. (2013). The Cancer Genome Atlas Pan-Cancer Analysis Project. Nat. Genet. 45 (10), 1113–1120. doi:10.1038/ng.2764
Chen, X., and Song, E. (2019). Turning Foes to Friends: Targeting Cancer-Associated Fibroblasts. Nat. Rev. Drug Discov. 18 (2), 99–115. doi:10.1038/s41573-018-0004-1
Dai, W., Xiao, Y., Tang, W., Li, J., Hong, L., Zhang, J., et al. (2021). Identification of an EMT-Related Gene Signature for Predicting Overall Survival in Gastric Cancer. Front. Genet. 12, 661306. doi:10.3389/fgene.2021.661306
Derks, S., de Klerk, L. K., Xu, X., Fleitas, T., Liu, K. X., Liu, Y., et al. (2020). Characterizing Diversity in the Tumor-Immune Microenvironment of Distinct Subclasses of Gastroesophageal Adenocarcinomas. Ann. Oncol. 31 (8), 1011–1020. doi:10.1016/j.annonc.2020.04.011
Dey, P., Kimmelman, A. C., and DePinho, R. A. (2021). Metabolic Codependencies in the Tumor Microenvironment. Cancer Discov. 11 (5), 1067–1081. doi:10.1158/2159-8290.cd-20-1211
Du, H., Pang, M., Hou, X., Yuan, S., and Sun, L. (2017). PLOD2 in Cancer Research. Biomed. Pharmacother. 90, 670–676. doi:10.1016/j.biopha.2017.04.023
Garcia-Pelaez, J., Barbosa-Matos, R., Gullo, I., Carneiro, F., and Oliveira, C. (2021). Histological and Mutational Profile of Diffuse Gastric Cancer: Current Knowledge and Future Challenges. Mol. Oncol. 15 (11), 2841–2867. doi:10.1002/1878-0261.12948
Genecards (2021). GeneCards Symbol: PLOD2. Available at: https://www.genecards.org/cgi-bin/carddisp.pl?gene=PLOD2 (Accessed August 2nd, 2021).
Gentles, A. J., Newman, A. M., Liu, C. L., Bratman, S. V., Feng, W., Kim, D., et al. (2015). The Prognostic Landscape of Genes and Infiltrating Immune Cells across Human Cancers. Nat. Med. 21 (8), 938–945. doi:10.1038/nm.3909
Gerstung, M., Jolly, C., Jolly, C., Leshchiner, I., Dentro, S. C., Gonzalez, S., et al. (2020). The Evolutionary History of 2,658 Cancers. Nature 578 (7793), 122–128. doi:10.1038/s41586-019-1907-7
Gilkes, D. M., Bajpai, S., Wong, C. C., Chaturvedi, P., Hubbi, M. E., Wirtz, D., et al. (2013). Procollagen Lysyl Hydroxylase 2 Is Essential for Hypoxia-Induced Breast Cancer Metastasis. Mol. Cancer Res. 11 (5), 456–466. doi:10.1158/1541-7786.mcr-12-0629
Gilkes, D. M., Semenza, G. L., and Wirtz, D. (2014). Hypoxia and the Extracellular Matrix: Drivers of Tumour Metastasis. Nat. Rev. Cancer 14 (6), 430–439. doi:10.1038/nrc3726
Hutter, C., and Zenklusen, J. C. (2018). The Cancer Genome Atlas: Creating Lasting Value beyond its Data. Cell 173 (2), 283–285. doi:10.1016/j.cell.2018.03.042
Icgc/Tcga Pan-Cancer Analysis of Whole Genomes Consortium (2020). Pan-cancer Analysis of Whole Genomes. Nature 578 (7793), 82–93. doi:10.1038/s41586-020-1969-6
Kiyozumi, Y., Iwatsuki, M., Kurashige, J., Ogata, Y., Yamashita, K., Koga, Y., et al. (2018). PLOD2 as a Potential Regulator of Peritoneal Dissemination in Gastric Cancer. Int. J. Cancer 143 (5), 1202–1211. doi:10.1002/ijc.31410
Kocher, F., Tymoszuk, P., Amann, A., Sprung, S., Salcher, S., Daum, S., et al. (2021). Deregulated Glutamate to Pro-collagen Conversion Is Associated with Adverse Outcome in Lung Cancer and May Be Targeted by Renin-Angiotensin-Aldosterone System (RAS) Inhibition. Lung Cancer 159, 84–95. doi:10.1016/j.lungcan.2021.06.020
Li, J., Pu, K., Li, C., Wang, Y., and Zhou, Y. (2021). A Novel Six-Gene-Based Prognostic Model Predicts Survival and Clinical Risk Score for Gastric Cancer. Front. Genet. 12, 615834. doi:10.3389/fgene.2021.615834
Li, S.-S., Lian, Y.-F., Huang, Y.-L., Huang, Y.-H., and Xiao, J. (2020). Overexpressing PLOD Family Genes Predict Poor Prognosis in Gastric Cancer. J. Cancer 11 (1), 121–131. doi:10.7150/jca.35763
Li, Y., Roberts, N. D., Roberts, N. D., Wala, J. A., Shapira, O., Schumacher, S. E., et al. (2020). Patterns of Somatic Structural Variation in Human Cancer Genomes. Nature 578 (7793), 112–121. doi:10.1038/s41586-019-1913-9
Luo, T., Du, Y., Duan, J., Liang, C., Chen, G., Jiang, K., et al. (2020). Development and Validation of a Scoring System Based on 9 Glycolysis-Related Genes for Prognosis Prediction in Gastric Cancer. Technol. Cancer Res. Treat. 19, 1533033820971670. doi:10.1177/1533033820971670
Miyamoto, K., Seki, N., Matsushita, R., Yonemori, M., Yoshino, H., Nakagawa, M., et al. (2016). Tumour-suppressive miRNA-26a-5p and miR-26b-5p Inhibit Cell Aggressiveness by Regulating PLOD2 in Bladder Cancer. Br. J. Cancer 115 (3), 354–363. doi:10.1038/bjc.2016.179
Monster, J. L. J., Kemp, M., Gloerich, R. S., and van der Post, R. (2022). Diffuse Gastric Cancer: Emerging Mechanisms of Tumor Initiation and Progression. Biochim. Biophys. Acta (Bba) - Rev. Cancer 1877, 188719. doi:10.1016/j.bbcan.2022.188719
Newman, A. M., Steen, C. B., Liu, C. L., Gentles, A. J., Chaudhuri, A. A., Scherer, F., et al. (2019). Determining Cell Type Abundance and Expression from Bulk Tissues with Digital Cytometry. Nat. Biotechnol. 37 (7), 773–782. doi:10.1038/s41587-019-0114-2
Passaro, A., Stenzinger, A., and Peters, S. (2020). Tumor Mutational Burden as a Pan-Cancer Biomarker for Immunotherapy: The Limits and Potential for Convergence. Cancer Cell 38 (5), 624–625. doi:10.1016/j.ccell.2020.10.019
Rheinbay, E., Nielsen, M. M., Nielsen, M. M., Abascal, F., Wala, J. A., Shapira, O., et al. (2020). Analyses of Non-coding Somatic Drivers in 2,658 Cancer Whole Genomes. Nature 578 (7793), 102–111. doi:10.1038/s41586-020-1965-x
Song, W., Bai, Y., Zhu, J., Zeng, F., Yang, C., Hu, B., et al. (2021). A Novel Prognostic Model Based on Epithelial-Mesenchymal Transition-Related Genes Predicts Patient Survival in Gastric Cancer. World J. Surg. Onc 19 (1), 216. doi:10.1186/s12957-021-02329-9
Sung, H., Ferlay, J., Siegel, R. L., Laversanne, M., Soerjomataram, I., Jemal, A., et al. (2021). Global Cancer Statistics 2020: GLOBOCAN Estimates of Incidence and Mortality Worldwide for 36 Cancers in 185 Countries. CA A. Cancer J. Clin. 71 (3), 209–249. doi:10.3322/caac.21660
Tadeo, I., Berbegall, A. P., Castel, V., García-Miguel, P., Callaghan, R., Påhlman, S., et al. (2016). Extracellular Matrix Composition Defines an Ultra-high-risk Group of Neuroblastoma within the High-Risk Patient Cohort. Br. J. Cancer 115 (4), 480–489. doi:10.1038/bjc.2016.210
Thorsson, V., Gibbs, D. L., Brown, S. D., Wolf, D., Bortone, D. S., Ou Yang, T.-H., et al. (2018). The Immune Landscape of Cancer. Immunity 48 (4), 812–830. doi:10.1016/j.immuni.2018.03.023
Uhlén, M., Fagerberg, L., Hallström, B. M., Lindskog, C., Oksvold, P., Mardinoglu, A., et al. (2015). Proteomics. Tissue-Based Map of the Human Proteome. Science 347 (6220), 1260419.
Valero, C., Lee, M., Hoen, D., Wang, J., Nadeem, Z., Patel, N., et al. (2021). The Association between Tumor Mutational burden and Prognosis Is Dependent on Treatment Context. Nat. Genet. 53 (1), 11–15. doi:10.1038/s41588-020-00752-4
Vilar, E., and Gruber, S. B. (2010). Microsatellite Instability in Colorectal Cancer-The Stable Evidence. Nat. Rev. Clin. Oncol. 7 (3), 153–162. doi:10.1038/nrclinonc.2009.237
Wang, X., Guo, J., Dai, M., Wang, T., Yang, T., Xiao, X., et al. (2020). PLOD2 Increases Resistance of Gastric Cancer Cells to 5-fluorouracil by Upregulating BCRP and Inhibiting Apoptosis. J. Cancer 11 (12), 3467–3475. doi:10.7150/jca.41828
Wang, P., Chen, Y., and Wang, C. (2021). Beyond Tumor Mutation Burden: Tumor Neoantigen Burden as a Biomarker for Immunotherapy and Other Types of Therapy. Front. Oncol. 11, 672677. doi:10.3389/fonc.2021.672677
Xin, W., Zhao, C., Jiang, L., Pei, D., Zhao, L., and Zhang, C. (2021). Identification of a Novel Epithelial-Mesenchymal Transition Gene Signature Predicting Survival in Patients with HNSCC. Pathol. Oncol. Res. 27, 585192. doi:10.3389/pore.2021.585192
Keywords: PLOD2, prognostic biomarker, pan-cancer analysis, immune infiltration, cancer immunity
Citation: Xu Q, Kong N, Zhao Y, Wu Q, Wang X, Xun X and Gao P (2022) Pan-Cancer Analyses Reveal Oncogenic and Immunological Role of PLOD2. Front. Genet. 13:864655. doi: 10.3389/fgene.2022.864655
Received: 28 January 2022; Accepted: 07 April 2022;
Published: 02 May 2022.
Edited by:
Apeng Chen, Chinese Academy of Agricultural Sciences, ChinaReviewed by:
Wallax Ferreira, Evandro Chagas Institute, BrazilCopyright © 2022 Xu, Kong, Zhao, Wu, Wang, Xun and Gao. This is an open-access article distributed under the terms of the Creative Commons Attribution License (CC BY). The use, distribution or reproduction in other forums is permitted, provided the original author(s) and the copyright owner(s) are credited and that the original publication in this journal is cited, in accordance with accepted academic practice. No use, distribution or reproduction is permitted which does not comply with these terms.
*Correspondence: Pengji Gao, MTAxMTIxMDM3MEBiam11LmVkdS5jbg==
Disclaimer: All claims expressed in this article are solely those of the authors and do not necessarily represent those of their affiliated organizations, or those of the publisher, the editors and the reviewers. Any product that may be evaluated in this article or claim that may be made by its manufacturer is not guaranteed or endorsed by the publisher.
Research integrity at Frontiers
Learn more about the work of our research integrity team to safeguard the quality of each article we publish.