 Huiquan Sun
 Feiran Jia1
 Wenxia Zhao
 Yanxia Yao
- 1Key Laboratory of Forest Protection of National Forestry and Grassland Administration, Ecology and Nature Conservation Institute, Chinese Academy of Forestry, Beijing, China
- 2Liaoning Academy of Forest Science, Shenyang, China
Agrilus mali Matsumura is a wood-boring beetle that aggressively attacks species of the genus Malus, that has recently caused serious damage to the wild apple tree M. sieversii (Lebed.) in the western Tianshan Mountains in Xinjiang. It was first detected there in the early 1990s and spread rapidly, being thus considered a regional invasive pest. To explore the possible outbreak mechanism of the local population and characterize the genetic differentiation of A. mali across different regions of China, we used three mitochondrial genes (COI, COII, and CytB) to investigate the genetic diversity and genetic structure of 17 A. mali populations containing 205 individuals collected from five Chinese provinces. Among them, nine populations were from the western Tianshan Mountains. Ultimately, of the 136 pairwise Fst comparisons, 99 showed high genetic differentiation among overall populations, and Tianshan populations exhibited significant differentiation with most of the non-Tianshan populations. Furthermore, A. mali populations represented relatively abundant haplotypes (54 haplotypes). Nine populations from the Tianshan Mountains showed 32 haplotypes (26 of which were unique), displaying relatively high genetic diversity. Additionally, the Mantel test revealed population genetic differentiation among either overall populations or the Tianshan Mountains populations, likely caused by geographical isolation. Phylogenic relationships showed that all populations clustered into three clades, and Tianshan Mountains populations, including CY, occupied one of the three clades. These results suggest that A. mali in the western Tianshan region has possibly been present in the area for a long period, and may not have been introduced recently. Highly frequent gene flows within Tianshan populations are possibly caused by human activities and may enhance the adaptability of A. mali along the western Tianshan Mountains, leading to periodic outbreaks. These findings enhance our understanding of jewel beetle population genetics and provide valuable information for pest management.
Introduction
Agrilus mali Matsumura (Coleoptera: Buprestidae) is a serious wood-boring beetle and considered to originate in Northeast Asia, including North Korea, the Russian Far East, and Eastern China (Chebanov, 1977; Nikritin, 1994; EPPO, 2021). In recent decades, the beetle has severely endangered the wild apple Malus sieversii (Lebed.), in the wild fruit forests of the Tianshan Mountains, Xinjiang, Western China (Cui et al., 2018). The host apple is an important germplasm gene resource and an ancestor of cultivated apples (Richards et al., 2009). In the early 1990s, this beetle broke out in the wild fruit forests of the western Tianshan Mountains. It was thought that the introduction of apple seedlings from Northeast China or the Shandong Province caused the invasion of A. mali (Ji et al., 2004; Bozorov et al., 2019; Zhang et al., 2021). As the beginning of the invasion was overlooked, the population source and the exact spreading mechanisms remain unclear. However, studying its population genetics can provide definite insights into its origin and subsequent spread.
Populations are basic units of biological evolution, and the study of population genetics is key in understanding biological genetic diversity and species evolution (Frankham et al., 2004). Population genetics can provide evidence of historical biogeographic events (Avise, 2000) and reveal significant information on population dynamics (Gupta and Preet, 2014). Population genetics can also help reconstruct the demographic history and understand whether a population is native or invasive (Zheng et al., 2013; Men et al., 2017). Population genetics also helps determine whether an invasion was the result of multiple independent introduction events or a long-term spread from a single source population (Xun et al., 2016; Zhang et al., 2020; Du et al., 2021). In this case, genetic polymorphisms transmitted in a strictly Mendelian manner provide useful information. Thus, the use of available markers is crucial (Cavalli-Sforza, 1998). With the development of molecular biology techniques, an increasing number of molecular markers have been used in the study of population genetics, such as mitochondrial DNA, ribosomal DNA, and microsatellite sequences (Bray et al., 2011; Lopez et al., 2014; Zhang et al., 2015; Yao et al., 2020).
Previously, eight populations (seven from Tianshan and one from Liaoning) of this beetle were investigated genetically based on seven simple sequence repeat (SSR) markers, with the Tianshan populations revealing high genetic similarity and showing significant differentiation when compared with the Liaoning population (Fang et al., 2017). Owing to a lack of sufficient data, the genetic structure of this beetle population is still unclear.
mtDNA plays an important role as a basic tool in insect ecology and genetic studies (Dong et al., 2021). According to Zardoya and Meyer (1996), the mitochondrial DNA genes, cytochrome oxidase subunit I (COI), cytochrome oxidase subunit II (COII), and cytochrome b (CytB) are ideal molecular markers for evolutionary analysis. In the present study, the geographical pattern of genetic variation for this species was assessed using the above three mtDNA genes (COI, COII, and CytB) from 17 populations across China. The main purposes were to (i) analyze the genetic structure of A. mali, (ii) infer the demographic history of A. mali, and (iii) discuss the genetic status of populations in the western Tianshan Mountains. By comparing the genetic structure of populations from different habitats, we attempted to understand the relationships between populations and evaluate factors that may affect genetic variation. Information on the genetic diversity of A. mali populations may increase our knowledge of these beetle populations and enhance their effective control.
Materials and Methods
Specimen Collection and DNA Extraction
The damaged branches of host trees were collected in wild fruits forests and orchards from May to August 2018 to 2021. Branches were then cultured in vitro at room temperature. Once adult beetles emerged, they were placed into the centrifugal tubes and stored at −80°C prior to DNA extraction. Genomic DNA was extracted from an individual without the abdomen and elytra using a TIANamp Genomic DNA Kit (TIANGEN, Beijing, China) according to the manufacturer’s instructions. Voucher specimens were deposited at the insect museum of the Chinese Academy of Forestry, Beijing, China. Hundreds of A. mali adult individuals were obtained from 17 locations in China (Table 1; Figure 1).

TABLE 1. Sampling information of 17 geographical populations of A. mali in China.
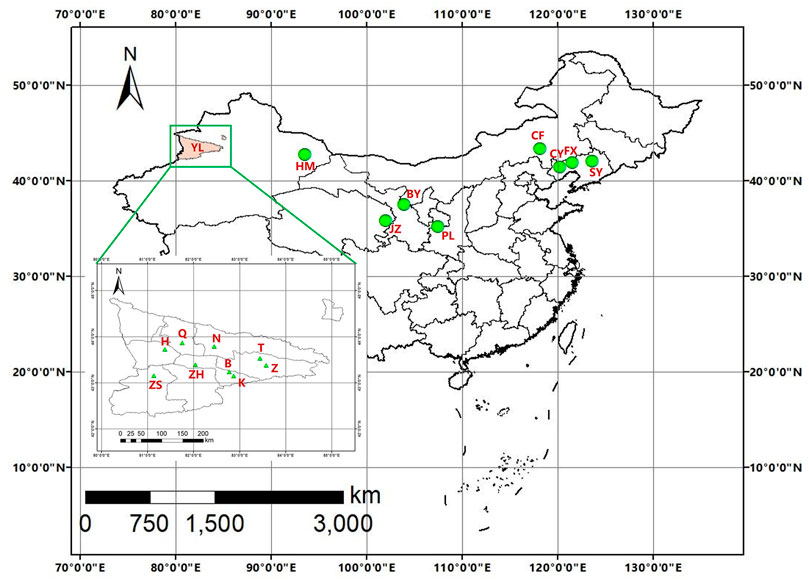
FIGURE 1. Geographical distribution of 17 sampling populations of A. mali.
PCR Amplification and Sequencing
Three mitochondrial protein-coding genes (COI, COII, and CytB) were utilized as molecular markers in the present study. Based on the published mitochondrial genome sequence of A. mali (Sun et al., 2020), we designed specific primers for the amplification of complete COI, COII, and CytB sequences using the software Primer Premier version 5 (Lalitha, 2000). Details of the primer sequences and product sizes are provided in Supplementary Table S1.
Polymerase Chain Reaction (PCR) amplification was conducted in a total volume of 25 μl containing 1.5 μl genomic DNA, 1 μl each of forward and reverse primers (10 μmol/L), 12.5 μl 2× Flash PCR MasterMix (CWBIO, China), and 9 μl ddH2O. PCR amplification was performed with an initial denaturation at 98°C for 1 min; 35 cycles of 10 s at 94°C, 15 s at a primer-specific annealing temperature (46°C for COI, 49°C for COII, and 53°C for CytB), and extension at 72°C for 30 s; and a final elongation at 72°C for 1 min. The PCR products were visualized on 1.0% agarose gels under UV light. The sequencing reaction was carried out using an ABI BigDye Terminator version 3.1 cycle sequencing kit on an ABI 3730XL (Tsingke Biotechnology Co., Ltd., Beijing, China) for Sanger sequencing in both directions.
Sequence Alignment and Genetic Diversity Inferences of the Data Sets
To confirm that the correct sequences were obtained, we compared each sequence with the non-redundant (nr) database of National Center for Biotechnology Information (NCBI) using BLASTN. Three mitochondrial gene sequences were analyzed and edited using Geneious R11.1.5 (https://www.geneious.com) (Kearse et al., 2012) and MEGA version 11 (Tamura et al., 2021). Deletions or insertions in the nucleotide sequences of mitochondrial protein-coding genes (COI, COII, and CytB) were inferred from the amino acid alignment. The sequence of each PCG (excluding stop codons) was then aligned individually as per codon-based multiple alignments using the MAFFT algorithm, which was implemented in the TranslatorX online platform (Abascal et al., 2010). Subsequently, the three genes of an individual were concatenated using MEGA version 11 to generate a combined sequence of 2,913 bp as a single locus because of the lack of recombination of mtDNA (Moraes et al., 2002). The nucleotide composition and the number of variable sites, conserved sites, parsimony informative sites, and singleton variable sites of the three single partial gene sequences, as well as of the combined sequences were analyzed using MEGA version 11.
Genetic diversity was estimated by the number of polymorphic sites (S), the number of haplotypes (h), haplotype diversity (Hd), average number of nucleotide differences (K), and nucleotide diversity (π) for concatenated genes, using DnaSP version 5.0 (Librado and Rozas, 2009) or Arlequin version 3.5 (Excoffier and Lischer, 2010). Besides the analysis of each Tianshan population alone, we combined the nine populations in these regions as a single group (YL) to examine their genetic diversity for comparison with non-Tianshan populations. For the comparisons, we additionally divided the Tianshan populations into natural forest populations (YLNA) and plantation populations (YLPL) (Table 3).
The haplotype sequences for each gene were exported by DnaSP version 5.0. The haplotype sequences were deposited in GenBank under the accession numbers OM177028–OM177057 for COI, and OM212329–OM212346 for COII. All CytB sequences were also deposited in GenBank under the accession numbers OM264916–OM265120, and haplotype sequences are available in the Zenodo database with a DOI of https://doi.org/10.5281/zenodo.6107571.
Genetic Differentiation and Genetic Flow
Based on combined genes sequences, pairwise fixation (Fst) and gene flow indices (Nm) were estimated using the DnaSP version 5.0 (Librado and Rozas, 2009). With the criterion for genetic differentiation set by Wright (1984), the genetic differentiation is low for Fst < 0.05, moderate for 0.05 < Fst < 0.15, high for 0.15 < Fst < 0.25, and very high for Fst > 0.25 (Govindaraju, 1989). Similarly, genetic flow was low for Nm < 1, high for 1 < Nm < 4, and very high for Nm > 4 (Boivin et al., 2004).
The analysis of molecular variance (AMOVA) based on Fst (using haplotype frequencies) was performed using 10,000 permutations to estimate the hierarchical genetic structure using Arlequin version 3.5 (Excoffier and Lischer, 2010). Two hierarchical levels, among populations and within populations, were defined.
To test isolation by distance (IBD), the pairwise genetic distance and geographical distance (km) matrices between all 17 sampled populations were compared using the Mantel test with 9,999 permutations (Mantel, 1967). Pairwise average genetic distances between different populations were calculated using the Kimura-2-parameter model in MEGA version 11 (Tamura et al., 2021). Geographical distances were calculated from longitude and latitude data using the Geographic Distance Matrix Generator version 1.2.3 (Ersts, 2018). Mantel analysis was performed using GenAleX version 6.5 (Peakall and Smouse, 2012).
Phylogenetic Analysis and Network Construction
The dataset of mitochondrial haplotypes was analyzed under Bayesian inference (BI) using MrBayes version 3.2.5 (Ronquist and Huelsenbeck, 2003). The congeneric species of Agrilus planipennis were used as an outgroup. For Bayesian analyses, we analyzed the combined genes based on the GTR + I + G model, which was selected using jModelTest version 2.1.7 (Posada, 2008). Then, two simultaneous runs of 10,000,000 generations were conducted for the matrix, each of which was sampled every 1,000 generations with a burn-in of 25%. Trees inferred prior to stationarity were discarded as burn-in, and the remaining trees were used to construct a 50% majority-rule consensus tree. The relationships among haplotypes were further tested by creating a median-joining algorithm using PopART version 1.7 (Leigh and Bryant, 2015).
Demographic History
To explore the demographic history of different lineages, neutral tests using Tajima’s D (Tajima, 1989) and Fu’s Fs (Fu, 1997) for the defined populations were performed using DnaSP version 5.0 (Librado and Rozas, 2009), with significantly negative values indicating population expansion and significantly positive values indicating processes such as population subdivision or recent population bottlenecks (Kimura, 1983; Tajima, 1989).
Additionally, the distribution of pairwise differences (mismatch distributions) between each pair of sequences was analyzed using DnaSP version 5.0 (Librado and Rozas, 2009) with default parameters to detect population expansion through a linear fitting relationship between the observed and simulated curves and infer demographic equilibrium or expansion according to Rogers and Harpending (1992).
Results
Sequence Analyses and Genetic Diversity
The final combined mitochondrial dataset included 2,913 bp of protein-coding regions (COI:1,395 bp, COII:582 bp, CytB:936 bp). No insertions or deletions were detected in these fragments. To ensure the credibility of the data, we deleted a 186 bp sequence containing the poly-T base in the CytB gene. The nucleotide compositions of the 17 geographical populations were consistent. The obtained combined sequences showed base compositions similar to those reported previously in mitochondrial sequences for other insects, with a heavy bias towards A/T (68.7%), which was in accordance with the mitochondrial nucleotide composition (Jermiin and Crozier, 1994).
Every mitochondrial gene displayed several haplotypes, with a total of 30 for COI, 18 for COII, and 37 for CytB, among which 7, 5, and 24 were shared, respectively. Details of the haplotype distribution of mitochondrial COI, COII, CytB, and their combined genes in each A. mali population are shown in Supplementary Tables S3–S6. Among the combined genes, 151 polymorphic sites (including 134 parsimony sites and 17 singleton sites) and 54 haplotypes (including 37 unique haplotypes) were found among all samples (Tables 2, 3). For a single population, the average number of haplotypes (h) ranged from 2 (HM) to 13 (YLK); the average number of nucleotide differences (K) ranged from 0.667 (HM) to 28.974 (CY), with an average of 10.933 (Table 3); haplotype diversity (Hd) within populations ranged from 0.590 (PL) to 0.963 (YLK), with an average of 0.793; and nucleotide diversity (π) ranged from 0.00023 (HM) to 0.00955 (CY). The whole Chinese population exhibited high haplotype diversity and high nucleotide diversity (Hd = 0.924; π = 0.00752).
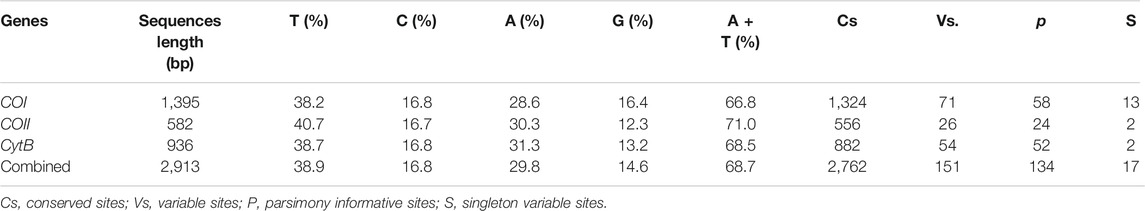
TABLE 2. Variation of COI, COII, CytB and combined genes of 17 populations of A. mali.
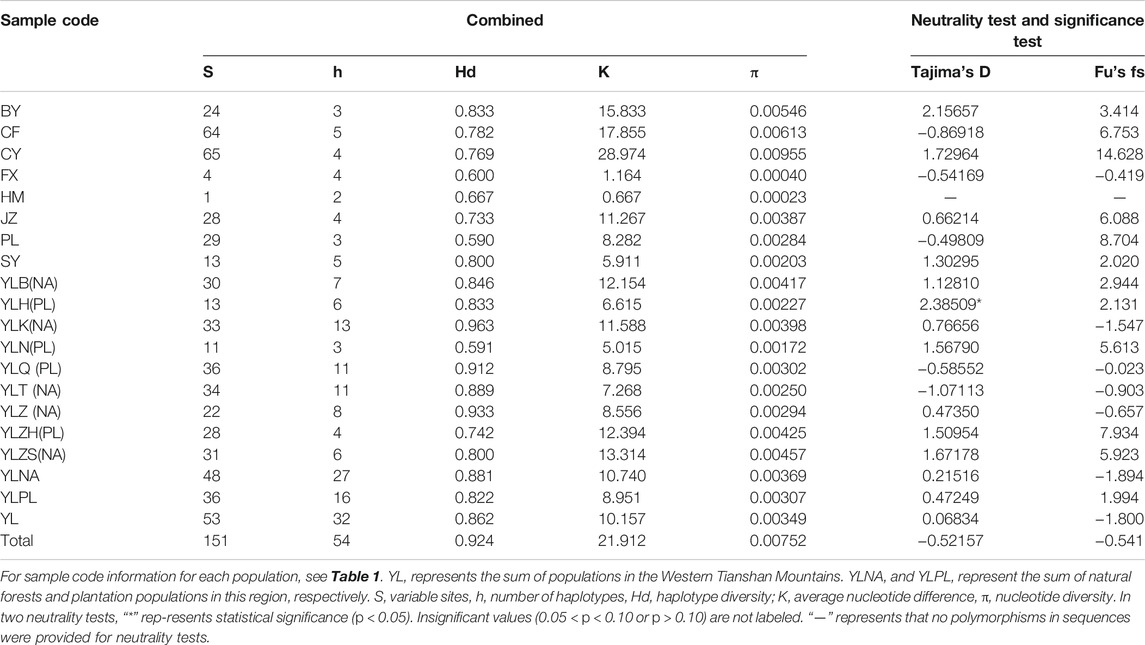
TABLE 3. Genetic diversity parameters and neutrality tests among 17 populations of A. mali based on combined genes.
For the western Tianshan Mountains population, the highest genetic diversity was found in the YLK population (Hd = 0.963, π = 0.00398) from the natural forests, while the lowest (Hd = 0.591, π = 0.00172) was found in the YLN population from plantations. Overall, the genetic diversity of natural forest populations is slightly higher than that of plantation populations (Table 3).
Genetic Differentiation and Genetic Flow
The pairwise Fst values for genetic differentiation varied from −0.0866 to 0.9428, based on the genes combined. The maximum value was detected between the HM and FX populations, and the minimum value was detected between the JZ and YLB populations. Five populations (CF, CY, FX, HM, and PL) exhibited significant genetic differentiation from other populations. The SY population showed higher genetic differences with other populations, whereas there was a certain gene flow between the BY population and the JZ, YLB, YLK, and YLZS populations, respectively. Additionally, no genetic differentiation was observed between the JZ population and the YL group. The Nm values indicated that frequent genetic flow occurred between the YL group and the JZ population (Table 4).
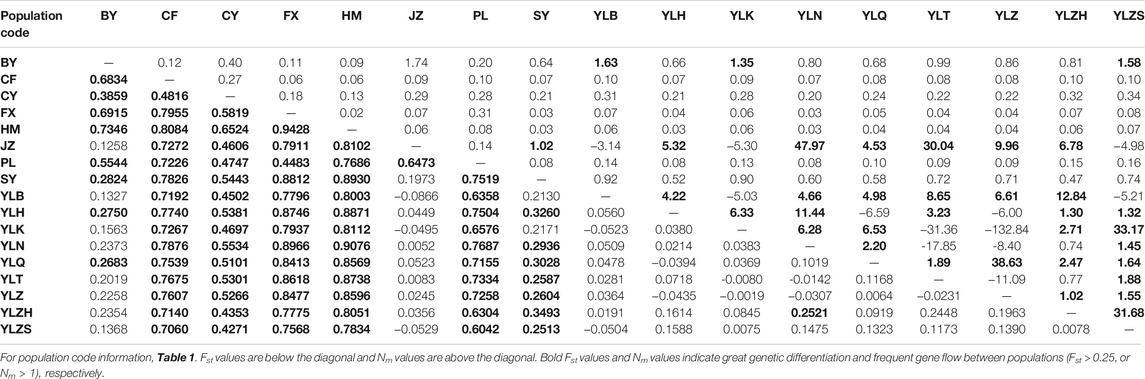
TABLE 4. Genetic differentiation (Fst) and gene flow (Nm) among 17 populations of A. mali based on combined genes.
AMOVA showed that overall variation mainly derived from variation among populations (53.25% among 17 populations and 63.09% among nine groups), and genetic variation within populations was slightly lower (Table 5). The Mantel test revealed a significant positive relationship for all populations (R = 0.5590 and p = 0.0001) (Figure 2A) while no significant correlation for the western Tianshan Mountains populations (R = 0.6377, p = 0.952) (Figure 2B) between the average pairwise genetic distance and geographic distance, indicating that genetic differentiation in populations is probably caused by geographical isolation.

TABLE 5. Analysis of molecular variance (AMOVA) based on combined genes.
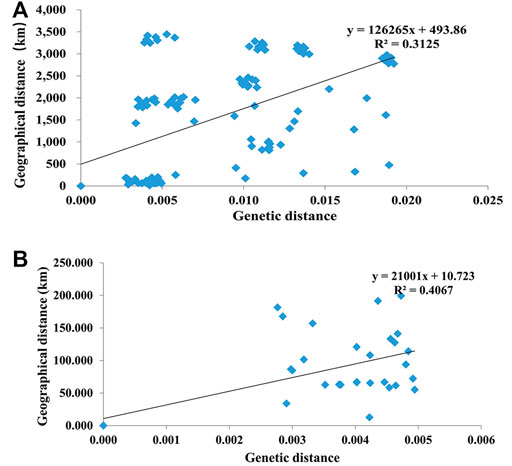
FIGURE 2. The correlation between genetic distance and geographical distance among 17 populations in China (A) and nine populations in the Western Tianshan Mountains (B) of A. mali.
Phylogenetic Analysis and Network Construction
Based on the combined genes, the BI phylogenetic trees displayed three parallel clades: Clade 1 containing YL, JZ, SY, BY (these four populations formed the biggest subdivision), and CY populations (another subdivision); Clade 2 containing CF; Clade 3 containing CF, FX, HM, and PL (Figure 3). Within Clade 1, the biggest subdivision was divided into three clusters. Two of them contained pure YL haplotypes despite sharing several haplotypes with other populations, while the other was mixed with SY population.
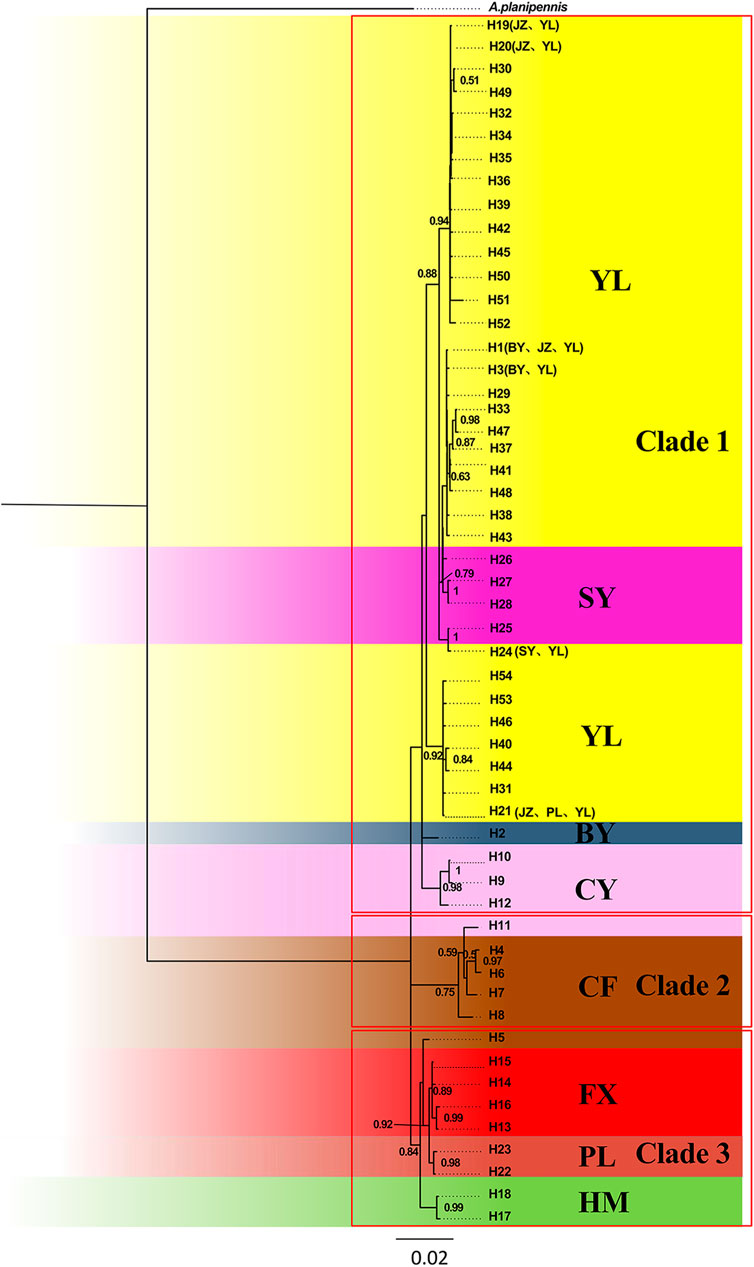
FIGURE 3. Bayesian inference (BI) phylogenetic tree inferred from haplotypes based on combined genes.
Median-joining networks inferred from the combined genes also supported similar phylogenetic relationships. Based on combined genes, the median-joining haplotype network for all populations did not exhibit the ancestral haplotype of A. mali across overall populations (Figure 4A), whereas three ancestral haplotypes (H1, H19, and H21) for the network of the YL group were found (Figure 4B). These three ancestral haplotypes accounted for more than half (73/129) of the individuals in the YL group. Furthermore, the ancestral haplotypes of the YL group were more apparent in single genes, namely H1, H16, and H18 in COI; H1, H13, and H14 in COII; and H1, H14, and H15 in CytB. In contrast, the median-joining network of the haplotypes based on a single gene of COII was different from the results obtained using COI, CytB, and combined genes (Figure 4; Supplementary Figure S1), which resulted from a lower nucleotide diversity and less genetic variation caused by the shorter COII sequence.
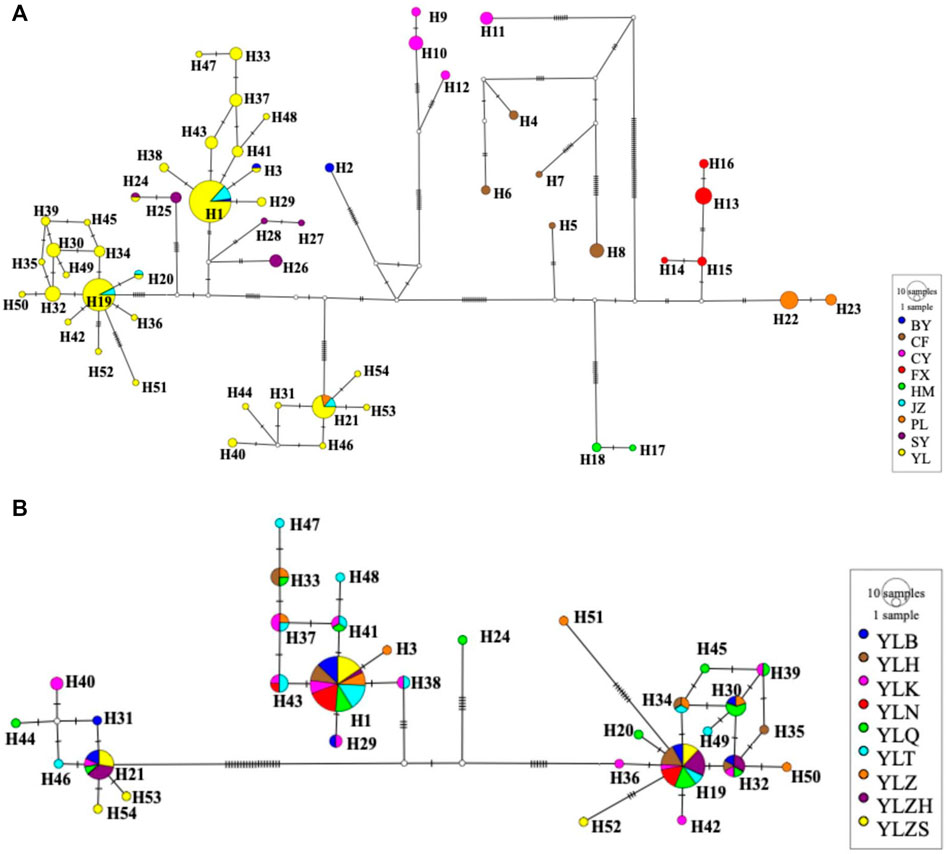
FIGURE 4. Median-joining haplotype networks of 17 different populations (A) and the YL group (B) of A. mali based on concatenated genes. Colored circles represent different haplotypes, solid lines between haplotypes represent mutation steps. The area of the circle is proportional to the number of haplotypes.
Demographic History
For the neutral test, despite one significantly positive Tajima’s D value in the YLH population (2.38509, p < 0.05), most Tajima’s D and Fu’s Fs values (Table 3) in the overall population displayed no significance, suggesting that the Chinese population, including the Tianshan population from natural forests, did not display population expansion (Rogers and Harpending, 1992; Harpending et al., 1998).
Distributions of pairwise differences obtained with either single or combined genetic data across populations exhibited declined simulated curves (Figure 5A; Supplementary Figure S2). This suggested that the demographic history of A. mali populations in China fitted equilibrium models and that these insects did not experience recent population expansion. The same result was also obtained among Tianshan populations (Figure 5B).
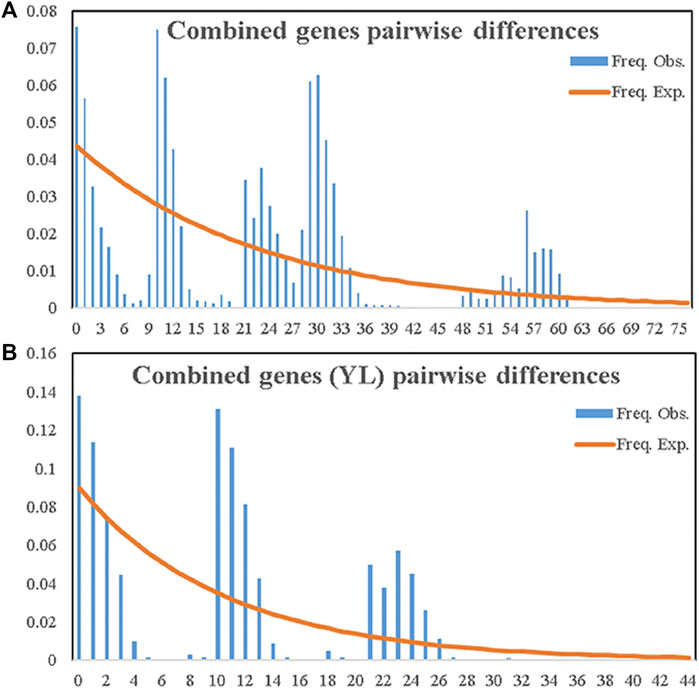
FIGURE 5. Observed and expected mismatch distribution analyses of entire samples of A. mali in China (A) and the YL group (B) based on combined genes.
Discussion
mtDNA has been widely employed to investigate intraspecific variation in invertebrates because of its lack of recombination, maternal inheritance, conserved structure, higher mutation rate, and relatively high evolutionary rate. In this study, we report the genetic diversity and structure of 205 individuals from 17 A. mali populations sampled throughout their main distribution areas in China. This study was based on the complete sequences of three mitochondrial genes, COI, COII, and CytB, in contrast to the commonly employed partial gene sequences. Our analysis of the three mitochondrial genes revealed considerably high genetic diversity in A. mali populations in the sampled areas.
The beetle was reported to invade the Tianshan Wild Fruits Forests when its host apple tree was introduced from the Shandong province (Ji et al., 2004; Bozorov et al., 2019). However, it was not been found within the province during our project, with a 5-years sampling period, neither by investigating nor through yellow sticky card traps in the fields of apple orchards in different seasons.
Furthermore, older research recorded the presence of this beetle with wider ranges of distribution in China (Chen and Yao, 1997; Xiang, 1997; Li, 1998; Qu et al., 1998; Wang et al., 1998). However, these distributions have not been corroborated. The reason for this may be that the old host apple trees were cut, and new seedlings were quarantined strictly, causing the disappearance of some populations.
Hd and π are important indicators of genetic diversity. Here, overall populations had high haplotype diversity (from 0.590 to 0.963); however, most of them displayed moderate or low nucleotide diversity (<0.005). Grant and Bowen (1998) defined the genetic variability of populations into four categories based on mtDNA markers: i) low Hd and low π, ii) high Hd and low π, iii) low Hd and high π, and iv) high Hd and high π. Most A. mali populations fitted the second category, excluding BY, CF, and CY. According to Grant and Bowen (1998), the situation was attributed to population expansion after a period of low effective population size. However, this explanation seemed incompletely suitable for A. mali. based on our distributions of pairwise differences and neutral test data, which supported that the YL population did not experience recent population expansion. The inference was also not seemly obtained in another previous study (Ingman et al., 2000), and many species fell into the second category (Grant and Bowen, 1998). Yet, for overall populations, the levels of haplotype diversity and nucleotide diversity fall into the fourth class (high Hd and high π), which was considered as secondary contacts between previously differentiated allopatric lineages, or attributable to a long evolutionary history in a large stable population (Grant and Bowen,1998).
For the western Tianshan populations, genetic diversity in plantations was slightly reduced compared to that in natural forests. Natural forest populations showed more haplotypes than those seen in plantation populations, even with a similar sampling size (Tables 1, 3). Considering low π in each population, the national Natural Reserve population YLK displayed the highest genetic diversity (Hd = 0.963, π = 0.00398), followed by another natural forest site population, YLZ (Hd = 0.933, π = 0.00294). Those two sites represented a typically dense growth region of the wild apple tree (Zhou et al., 2020), indicating that it is possible for the population to have shifted from natural forests to plantations, at least in Tianshan Mountains. This is seemingly suitable for the above hypothesis.
Phylogeny relationships revealed that the YL and CY populations occupied one of three clear clades, in which three subdivisions could identified, corresponding to three star-liking clusters caused by three ancestral haplotypes, suggesting that YL likely has a long population history. Additionally, although the SY population was included in this clade, we could identify, through haplotype networks, the presence of many mutation steps between the haplotypes of the SY population and the ancestral haplotypes H1 and H19 of the YL group. These occurred a certain degree of genetic differentiation, which was supported by Fst values (Table 4).
The high level of genetic differentiation among all populations of A. mali indicated that the geographic isolation of insects is one of the important factors for genetic differentiation in different populations (Forbes et al., 2017; Goodman et al., 2019), which was supported by the positive correlation between genetic distance and geographic distance (Figure 2), while the geographic isolation was hard to be observed for the recent invasive pests (Yao et al., 2020). Moreover, the major proportion of molecular genetic variation existed among populations (Table 5). Notably, a larger proportion of molecular genetic variation (63.09%) was present between the YL population and the other eight populations. Similar genetic differentiation results for A. mali were also reported in a study by Fang et al. (2017), which could also demonstrate that the beetle in Tianshan was not recently introduced.
The population genetic differentiation of a species is not only affected by distance and geographic isolation but also its own biological characteristics and environmental conditions, such as human factors, flight capacity, population size, and habitat specialization (Sumner et al., 2004; Fuentes-Contreras et al., 2008; Du et al., 2020). Species with high dispersal ability and a large number of individuals in the population can maintain gene flow and pan-mixing. In contrast, low dispersal ability and poor habitat availability cause species subgroups to become isolated, reducing gene flow (Louy et al., 2007; Dixo et al., 2009). A. mali is generally regarded as a sedentary species with a certain natural diffusion ability of up to 35 m (Ma et al., 2021). The weak flight capacity of A. mali can reduce gene flow among populations.
For sedentary insects such as A. mali, anthropic movement of infected wood or wood products provides routes for the hitchhiking of live adults and larvae, which may increase gene exchange between populations. The findings of this study also suggest that frequent gene flow between natural forests and plantation populations, which may be caused by human activities, possibly enhanced the adaptability of A. mali along the western Tianshan Mountains and resulted in frequent outbreaks (Chapuis et al., 2011; Xu et al., 2019). Therefore, we assume that human factors caused the continued outbreak of A. mali in the western Tianshan Mountains.
Considering the outbreaks of the beetle, present in both natural forests and in plantations the Tianshan Mountains, we think that the decline in host forests was the main factor causing the rapid growth in beetle population size, because A. mali is a secondary pest and attacks the weak host tree. In the last few decades, the wild fruit forest in the western Tianshan Mountains gradually declined, probably caused by climatic and environmental factors, which provided a chance for the beetle outbreak. Subsequently, low plant diversity in the undergrowth made the natural enemies of the beetle lose their substitute host, leading to a reduction in population size. For the feeding of livestock, local people had to mow the grass growing in the wild fruit forest. Finally, poor orchard management also facilitated the rapid growth of the beetle population.
Data Availability Statement
The datasets presented in this study can be found in online repositories. The names of the repository/repositories and accession number(s) can be found in the article/Supplementary Material.
Author Contributions
Conceptualization, HS, WZ, and YY; methodology, HS and YY; software, HS, FJ and YY; validation, HS and YY; formal analysis, HS, CL and YY; investigation, HS, FJ, ZZ, JW and YY; resources, HS, FJ, ZZ, JW and YY; data curation, HS; writing—original draft preparation, HS.; writing—review and editing, HS, WZ, CL and YY; visualization, HS, FJ and YY; supervision, WZ; project administration, WZ and YY; funding acquisition, WZ and YY. All authors have read and agreed to the published version of the manuscript.
Funding
This research was funded by the Fundamental Research Funds for the Central Non-profit Research Institute of Chinese Academy of Forestry (Grant No. CAFYBB2017SZ003) and National Key R&D Program of China (2016YFC0501503).
Conflict of Interest
The authors declare that the research was conducted in the absence of any commercial or financial relationships that could be construed as a potential conflict of interest.
Publisher’s Note
All claims expressed in this article are solely those of the authors and do not necessarily represent those of their affiliated organizations, or those of the publisher, the editors and the reviewers. Any product that may be evaluated in this article, or claim that may be made by its manufacturer, is not guaranteed or endorsed by the publisher.
Acknowledgments
We thank Shengzhen Xiao from the garden administration of Jingtai County, Gansu Province, China, Youqi Guo from Hualong County Agricultural Technology Promotion Center, Qinghai Province, China, Wenhui Li from the agricultural technology promotion center of Qingza County, Qinghai Province, China and Jinhu Gao from the forestry and grassland administration of Linxi County, Inner Mongolia, China for assistance with specimen collection. We also thank Wen Nie, Xiaoxue Xu, Lan Huang, and Duanchong Liu from the Ecology and Nature Conservation Institute of the Chinese Academy of Forestry for their assistance in this research.
Supplementary Material
The Supplementary Material for this article can be found online at: https://www.frontiersin.org/articles/10.3389/fgene.2022.857866/full#supplementary-material
Supplementary Figure S1 | Median-joining haplotype networks of 17 different populations of A. mali based on COI (A), COII (B) and CytB (C). Colored circles represent different haplotypes, solid lines between haplotypes represent mutation steps. The area of the circle is proportional to the number of haplotypes.
Supplementary Figure S2 | Observed and expected mismatch distribution analyses of entire samples of A. mali in China based on COI, COII and CytB genes.
Supplementary Table S1 | PCR primers designed for the COI, COII, and CytB genes of A. mali.
Supplementary Table S2 | Genetic diversity parameters among 17 populations of A. mali based on COI, COII, and CytB genes.
Supplementary Table S3 | Haplotype distribution of mitochondrial the COI gene of A. mali in each population.
Supplementary Table S4 | Haplotype distribution of mitochondrial the COII gene of A. mali in each population.
Supplementary Table S5 | Haplotype distribution of mitochondrial the CytB gene of A. mali in each population.
Supplementary Table S6 | Haplotype distribution of combined mitochondrial genes of A. mali in each population.
References
Abascal, F., Zardoya, R., and Telford, M. J. (2010). TranslatorX: Multiple Alignment of Nucleotide Sequences Guided by Amino Acid Translations. Nucleic Acids Res. 38 (Suppl. l_2), W7–W13. doi:10.1093/nar/gkq291
Avise, J. C. (2000). Phylogeography: The History and Formation of Species. Cambridge, MA: Harvard University Press.
Boivin, T., Bouvier, J. C., Beslay, D., and Sauphanor, B. (2004). Variability in Diapause Propensity within Populations of a Temperate Insect Species: Interactions between Insecticide Resistance Genes and Photoperiodism. Biol. J. Linn. Soc. 83 (3), 341–351. doi:10.1111/j.1095-8312.2004.00392.x
Bozorov, T. A., Luo, Z., Li, X., and Zhang, D. (2019). Agrilus mali Matsumara (Coleoptera: Buprestidae), a New Invasive Pest of Wild Apple in Western China: DNA Barcoding and Life Cycle. Ecol. Evol. 9 (3), 1160–1172. doi:10.1002/ece3.4804
Bray, A. M., Bauer, L. S., Poland, T. M., Haack, R. A., Cognato, A. I., and Smith, J. J. (2011). Genetic Analysis of Emerald Ash Borer (Agrilus Planipennis Fairmaire) Populations in Asia and North America. Biol. Invasions 13 (12), 2869–2887. doi:10.1007/s10530-011-9970-5
Cavalli-Sforza, L. L. (1998). The DNA Revolution in Population Genetics. Trends Genet. 14 (2), 60–65. doi:10.1016/S0168-9525(97)01327-9
Chapuis, M. P., Popple, J. A. M., Berthier, K., Simpson, S. J., Deveson, E., Spurgin, P., et al. (2011). Challenges to Assessing Connectivity between Massive Populations of the Australian Plague Locust. Proc. R. Soc. B. 278 (1721), 3152–3160. doi:10.1098/rspb.2010.2605
Chen, G., and Yao, X. (1997). Occurrence of Agrilus mali Matsumura and its Control. Qinghai Agro-Technology Extension 4, 45.
Cui, Z., Zhang, Y., Luo, Z., Ma, H., and Lu, Z. (2018). Damage of Agrilus mali Matsumura in Wild Apple Forest and its Assessment. Arid Zone Res. 5, 1153–1159. doi:10.13866/j.azr.2018.05.19
Dixo, M., Metzger, J. P., Morgante, J. S., and Zamudio, K. R. (2009). Habitat Fragmentation Reduces Genetic Diversity and Connectivity Among Toad Populations in the Brazilian Atlantic Coastal Forest. Biol. Conservation 142 (8), 1560–1569. doi:10.1016/j.biocon.2008.11.016
Dong, Z., Wang, Y., Li, C., Li, L., and Men, X. (2021). Mitochondrial DNA as a Molecular Marker in Insect Ecology: Current Status and Future Prospects. Ann. Entomol. Soc. America 114, 470–476. doi:10.1093/aesa/saab020
Du, H., Liu, M., Zhang, S., Liu, F., Zhang, Z., and Kong, X. (2020). Lineage Divergence of Dendrolimus Punctatus in Southern China Based on Mitochondrial Genome. Front. Genet. 11, 65. doi:10.3389/fgene.2020.00065
Du, Z., Wu, Y., Chen, Z., Cao, L., Ishikawa, T., Kamitani, S., et al. (2021). Global Phylogeography and Invasion History of the Spotted Lanternfly Revealed by Mitochondrial Phylogenomics. Evol. Appl. 14 (4), 915–930. doi:10.1111/eva.13170
EPPO (2021). EPPO Website. Available at: https://gd.eppo.int/taxon/AGRLMA/distribution (Accessed January 4, 2021).
Ersts, P. J. (2018). Geographic Distance Matrix Generator(version 1.2.3). American Museum of Natural History, Center for Biodiversity and Conservation. Available at: http://biodiversityinformatics.amnh.org/open_source/gdmg.
Excoffier, L., and Lischer, H. E. L. (2010). Arlequin Suite Ver 3.5: a New Series of Programs to Perform Population Genetics Analyses under Linux and Windows. Mol. Ecol. Resour. 10 (3), 564–567. doi:10.1111/j.1755-0998.2010.02847.x
Fang, B., Duan, X., Zhang, Y., Yang, Z., and Chen, M. (2017). Microsatellite Development and Genetic Diversity Analysis of Apple Buprestid Agrilus mali Matsumura. J. Plant Prot. 44 (4), 559–566. doi:10.13802/j.cnki.zwbhxb.2017.2016008
Forbes, A. A., Devine, S. N., Hippee, A. C., Tvedte, E. S., Ward, A. K. G., Widmayer, H. A., et al. (2017). Revisiting the Particular Role of Host Shifts in Initiating Insect Speciation. Evolution 71 (5), 1126–1137. doi:10.1111/evo.13164
Frankham, R., Ballou, J. D., and Briscoe, D. A. (2004). A Primer of Conservation Genetics. Cambridge, United Kingdom: Cambridge University Press.
Fu, Y. X. (1977). Statistical Tests of Neutrality of Mutations against Population Growth, Hitchhiking and Background Selection. Genetics 147 (2), 915–925. doi:10.1017/S0016672397002966
Fuentes-Contreras, E., Espinoza, J. L., Lavandero, B., and Ramírez, C. C. (2008). Population Genetic Structure of Codling Moth (Lepidoptera: Tortricidae) from Apple Orchards in central Chile. J. Econ. Entomol. 101 (1), 190–198. doi:10.1093/jee/101.1.190
Goodman, K. R., Prost, S., Bi, K., Brewer, M. S., and Gillespie, R. G. (2019). Host and Geography Together Drive Early Adaptive Radiation of Hawaiian Planthoppers. Mol. Ecol. 28 (19), 4513–4528. doi:10.1111/mec.15231
Govindaraju, D. R. (1989). Variation in Gene Flow Levels Among Predominantly Self-Pollinated Plants. J. Evol. Biol 2 (3), 173–181. doi:10.1046/j.1420-9101.1989.2030173.x
Grant, W., and Bowen, B. W. (1998). Shallow Population Histories in Deep Evolutionary Lineages of marine Fishes: Insights from Sardines and Anchovies and Lessons for Conservation. J. Hered. 89 (5), 415–426. doi:10.1093/jhered/89.5.415
Gupta, S., and Preet, S. (2014). Genetic Differentiation of Invasive Aedes albopictus by RAPD-PCR: Implications for Effective Vector Control. Parasitol. Res. 113 (6), 2137–2142. doi:10.1007/s00436-014-3864-2
Harpending, H. C., Batzer, M. A., Gurven, M., Jorde, L. B., Rogers, A. R., and Sherry, S. T. (1998). Genetic Traces of Ancient Demography. Proc. Natl. Acad. Sci. 95 (4), 1961–1967. doi:10.1073/pnas.95.4.1961
Ingman, M., Kaessmann, H., Pääbo, S., and Gyllensten, U. (2000). Mitochondrial Genome Variation and the Origin of Modern Humans. Nature 408 (6813), 708–713. doi:10.1038/35047064
Jermiin, L., and Crozier, R. (1994). The Cytochrome B Region in the Mitochondrial DNA of the Ant Tetraponera Rufoniger: Sequence Divergence in Hymenoptera May Be Associated with Nucleotide Content. J. Mol. Evol. 38 (3), 282–294. doi:10.1007/bf00176090
Ji, Y., Ji, R., and Huang, R. (2004). Invasive Species--Agrilus mali Matsumura and Damage in Xinjiang. Xinjiang Agric. Sci. 41, 31–33. CNKI:SUN:XJNK.0.2004-02-01.
Kearse, M., Moir, R., Wilson, A., Stones-Havas, S., Cheung, M., Sturrock, S., et al. (2012). Geneious Basic: an Integrated and Extendable Desktop Software Platform for the Organization and Analysis of Sequence Data. Bioinformatics 28 (12), 1647–1649. doi:10.1093/bioinformatics/bts199
Kimura, M. (1983). The Neutral Theory of Molecular Evolution. Cambridge, United Kingdom: Cambridge University Press.
Lalitha, S. (2000). Primer Premier 5. Biotech. Softw. Internet Rep. 1 (6), 270–272. doi:10.1089/152791600459894
Leigh, J. W., and Bryant, D. (2015). Popart : Full‐feature Software for Haplotype Network Construction. Methods Ecol. Evol. 6 (9), 1110–1116. doi:10.1111/2041-210X.12410
Librado, P., and Rozas, J. (2009). DnaSP V5: a Software for Comprehensive Analysis of DNA Polymorphism Data. Bioinformatics 25 (11), 1451–1452. doi:10.1093/bioinformatics/btp187
Lopez, V. M., Rugman-Jones, P. F., Coleman, T. W., Hoddle, M. S., and Stouthamer, R. (2014). Population Genetics of Goldspotted Oak Borer, Agrilus Auroguttatus Schaeffer (Coleoptera: Buprestidae): Investigating the Origin of an Invasive Pest of Native oaks in California. Biol. Invasions 16 (11), 2393–2402. doi:10.1007/s10530-014-0672-7
Louy, D., Habel, J. C., Schmitt, T., Assmann, T., Meyer, M., and Müller, P. (2007). Strongly Diverging Population Genetic Patterns of Three Skipper Species: the Role of Habitat Fragmentation and Dispersal Ability. Conserv Genet. 8 (3), 671–681. doi:10.1007/s10592-006-9213-y
Ma, Z., Yao, Y., and Adili, S. (2021). A Preliminary Study on the Field-Diffusion Behavior of Agrilus mali Matsumura (Coleoptera: Bupresidea). For. Res. 34 (1), 173–180. doi:10.13275/j.cnki.lykxyj.2021.01.021
Mantel, N. (1967). The Detection of Disease Clustering and a Generalized Regression Approach. Cancer Res. 27 (21), 209–220. doi:10.1007/s00253-002-1013-9
Men, Q., Xue, G., Mu, D., Hu, Q., and Huang, M. (2017). Mitochondrial DNA Markers Reveal High Genetic Diversity and strong Genetic Differentiation in Populations of Dendrolimus Kikuchii Matsumura (Lepidoptera: Lasiocampidae). PloS one 12 (6), e0179706. doi:10.1371/journal.pone.0179706
Moraes, C. T., Srivastava, S., Kirkinezos, I., Oca-Cossio, J., vanWaveren, C., Woischnick, M., et al. (2002). Mitochondrial DNA Structure and Function. Int. Rev. Neurobiol. 53, 3–23. doi:10.1016/S0074-7742(02)53002-6
Peakall, R., and Smouse, P. E. (2012). GenAlEx 6.5: Genetic Analysis in Excel. Population Genetic Software for Teaching and Research-Aan Update. Bioinformatics 28 (19), 2537–2539. doi:10.1093/bioinformatics/bts460
Posada, D. (2008). jModelTest: Phylogenetic Model Averaging. Mol. Biol. Evol. 25 (7), 1253–1256. doi:10.1093/molbev/msn083
Qu, Q., Zhang, Q., Zeng, Z., Guo, Y., and Chang, Z. (1998). Occurrence Regularity and Control of Agrilus mali Matsumura. Inner Mongolia Agric. Sci. Tech. (6), 30–31.
Richards, C. M., Volk, G. M., Reilley, A. A., Henk, A. D., Lockwood, D. R., Reeves, P. A., et al. (2009). Genetic Diversity and Population Structure in Malus Sieversii, a Wild Progenitor Species of Domesticated Apple. Tree Genet. Genomes 5 (2), 339–347. doi:10.1007/s11295-008-0190-9
Rogers, A. R., and Harpending, H. (1992). Population Growth Makes Waves in the Distribution of Pairwise Genetic Differences. Mol. Biol. Evol. 9 (3), 552–569. doi:10.1093/oxfordjournals.molbev.a040727
Ronquist, F., and Huelsenbeck, J. P. (2003). MrBayes 3: Bayesian Phylogenetic Inference under Mixed Models. Bioinformatics 19 (12), 1572–1574. doi:10.1093/bioinformatics/btg180
Sumner, J., Jessop, T., Paetkau, D., and Moritz, C. (2004). Limited Effect of Anthropogenic Habitat Fragmentation on Molecular Diversity in a Rain forest Skink, Gnypetoscincus Queenslandiae. Mol. Ecol. 13 (2), 259–269. doi:10.1046/j.1365-294x.2003.02056.x
Sun, H., Zhao, W., Lin, R., Zhou, Z., Huai, W., and Yao, Y. (2020). The Conserved Mitochondrial Genome of the Jewel Beetle (Coleoptera: Buprestidae) and its Phylogenetic Implications for the Suborder Polyphaga. Genomics 112 (5), 3713–3721. doi:10.1016/j.ygeno.2020.04.026
Tajima, F. (1989). Statistical Method for Testing the Neutral Mutation Hypothesis by DNA Polymorphism. Genetics 123(3), 585–595. doi:10.1093/genetics/123.3.585
Tamura, K., Stecher, G., and Kumar, S. (2021). MEGA11: Molecular Evolutionary Genetics Analysis Version 11. Mol. Biol. Evol. 38 (7), 3022–3027. doi:10.1093/molbev/msab120
Wang, H., Gao, Y., and Xu, S. (1998). Occurrence Characteristics and Control Methods of Apple Diseases and Insect Pests in Luanping County. Hebei Fruits A1, 82.[in Chinese]
Wright, S. (1984). Evolution and the Genetics of Populations, Volume 4: Variability within and Among Natural Populations. Chicago: University of Chicago press.
Xiang, S. (1997). Biology of Agrilus mali Matsumura and its Control. South China Fruits 26 (2), 41. doi:10.13938/j.issn.1007-1431.1997.02.043
Xu, Y., Mai, J. W., Yu, B. J., Hu, H. X., Yuan, L., Jashenko, R., et al. (2019). Study on the Genetic Differentiation of Geographic Populations of Calliptamus Italicus (Orthoptera: Acrididae) in Sino-Kazakh Border Areas Based on Mitochondrial COI and COII Genes. J. Econ. Entomol. 112 (4), 1912–1919. doi:10.1093/jee/toz112
Xun, H., Li, H., Li, S., Wei, S., Zhang, L., Song, F., et al. (2016). Population Genetic Structure and post-LGM Expansion of the Plant Bug Nesidiocoris Tenuis (Hemiptera: Miridae) in China. Sci. Rep. 6 (1), 1–11. doi:10.1038/srep26755
Yao, Y. X., Shang, X. P., Yang, J., Lin, R. Z., Huai, W. X., and Zhao, W. X. (2020). Genetic Variation May Have Promoted the Successful Colonization of the Invasive Gall Midge, Obolodiplosis Robiniae, in China. Front. Genet. 11, 387. doi:10.3389/fgene.2020.00387
Zardoya, R., and Meyer, A. (1996). Phylogenetic Performance of Mitochondrial Protein-Coding Genes in Resolving Relationships Among Vertebrates. Mol. Biol. Evol. 13 (7), 933–942. doi:10.1093/oxfordjournals.molbev.a025661
Zhang, L., Li, H., Li, S., Zhang, A., Kou, F., Xun, H., et al. (2015). Phylogeographic Structure of Cotton Pest Adelphocoris Suturalis (Hemiptera: Miridae): strong Subdivision in China Inferred from mtDNA and rDNA ITS Markers. Sci. Rep. 5 (1), 1–13. doi:10.1038/srep14009
Zhang, X., Zhang, Y. L., Zhang, P., Cui, Z. J., Han, P., Gao, G. Z., et al. (2021). Agrilus mali Matsumura (Coleoptera: Buprestidae) Density and Damage in Wild Apple Malus Sieversii (Rosales: Rosaceae) Forests in Central Eurasia under Four Different Management Strategies. Entomologia Generalis 41 (3), 257–266. doi:10.1127/entomologia/2021/0974
Zhang, Y., Manzoor, A., and Wang, X. (2020). Mitochondrial DNA Analysis Reveals Spatial Genetic Structure and High Genetic Diversity of Massicus Raddei (Blessig) (Coleoptera: Cerambycidae) in China. Ecol. Evol. 10 (20), 11657–11670. doi:10.1002/ece3.6799
Zheng, Y., Peng, X., Liu, G., Pan, H., Dorn, S., and Chen, M. (2013). High Genetic Diversity and Structured Populations of the oriental Fruit Moth in its Range of Origin. PLoS One 8 (11), e78476. doi:10.1371/journal.pone.0078476
Keywords: buprestidae, mitochondrial DNA, genetic differentiation, genetic structure, geographical population
Citation: Sun H, Jia F, Zhao W, Zhou Z, Li C, Wang J and Yao Y (2022) Population Genetics Reveals That the Western Tianshan Mountains Populations of Agrilus mali (Coleoptera: Buprestidae) May Have Not been Recently Introduced. Front. Genet. 13:857866. doi: 10.3389/fgene.2022.857866
Received: 19 January 2022; Accepted: 28 February 2022;
Published: 24 March 2022.
Edited by:
Wei Guo, Institute of Zoology (CAS), ChinaReviewed by:
Chuan Ma, Institute of Apiculture Research, ChinaCarlos Lopez Vaamonde, Institut National de la Recherche Agronomique (INRA), France
Copyright © 2022 Sun, Jia, Zhao, Zhou, Li, Wang and Yao. This is an open-access article distributed under the terms of the Creative Commons Attribution License (CC BY). The use, distribution or reproduction in other forums is permitted, provided the original author(s) and the copyright owner(s) are credited and that the original publication in this journal is cited, in accordance with accepted academic practice. No use, distribution or reproduction is permitted which does not comply with these terms.
*Correspondence: Yanxia Yao, eWFveXhAY2FmLmFjLmNu