
94% of researchers rate our articles as excellent or good
Learn more about the work of our research integrity team to safeguard the quality of each article we publish.
Find out more
ORIGINAL RESEARCH article
Front. Genet., 14 June 2022
Sec. RNA
Volume 13 - 2022 | https://doi.org/10.3389/fgene.2022.857507
 Tong Liu1
 Jing Tang1
 Xiaoyu Li1
 Yuan Lin1
 Yuma Yang1
 Kai Ma1
 Zhaoyuan Hui1
 Hong Ma1
 Yanyan Qin1
 Hetian Lei2*
 Yanhui Yang1*
Purpose: Hypoxia plays an essential role in the progression of hepatocellular carcinoma (HCC), whereas hypoxia inducible factor-1 (HIF-1) is the key transcription factor allowing HCC to survive hypoxia. The aim of this study was to define the essential mRNAs and miRNAs regulated by HIF1A and dissect their functions, interactions, and tumor-infiltrating immune cells in HCC.
Methods: A human HCC cell line HepG2 was used as a cell model of HCC. The CRISPR/Cas9 system was used to knock out HIF1A in HepG2 cells, and RNA sequencing was utilized to characterize differentially expressed mRNAs and miRNAs in the HIF1A-knockout HepG2 cells; the identified candidates were then analyzed by GO annotation and KEGG pathway enrichment to study their function and establish a PPI network. Quantitative (q) PCR was used to verify if there were significant differences in the expression of mRNAs, and the association of the selected mRNAs expression with immune cell infiltration levels was further analyzed using The Cancer Genome Atlas (TCGA) pan-cancer data.
Results: Using RNA-sequencing, we discovered that there were 1535 mRNAs differentially expressed (adjusted p < 0.05, |fold change|>1.5) in the HIF1A-knockout HepG2 cells, among which there were 644 mRNAs upregulated and 891 mRNAs downregulated. GO annotation and KEGG pathway enrichment showed that these mRNAs were involved in glycolysis/gluconeogenesis, PI3K-Akt signaling pathways, and HIF-1 signaling pathways. In addition, we found that there were 309 miRNAs differentially expressed (adjusted p < 0.05, |fold change|>1.5) in the HIF1A-knockout HepG2 cells, of which there were 213 miRNAs upregulated and 96 miRNAs downregulated. Our further analyses uncovered that these miRNA putative targets were involved in the hippo signaling pathway, axon guidance, and tight junction. Moreover, the construction and analysis of the PPI network showed that OASL, IL6, and TAF1 were recognized as hub genes with the highest connectivity degrees. Importantly, in the HIF1A-knockout HepG2 cells, our qRT-PCR data confirmed the selected mRNA changes revealed by RNA-sequencing, and with TCGA pan-cancer data, we revealed that the expressional levels of these three genes, LUM, SCOC, and CCL2, were associated with immune cell infiltration levels.
Conclusion: The identified potential key network of mRNAs and miRNAs regulated by HIF1A in the HCC cells suggests a key role of HIF1A in the tumorigenesis of HCC.
Hepatocellular carcinoma (HCC) is a common cancer worldwide, with a global incidence of more than 600,000 new cases per year (Bray et al., 2018), and ranks the fifth in incidence and third in mortality worldwide. In addition, more than 60% of patients are diagnosed at advanced stages with a 5-year survival rate of less than 10% (Cai and Liu, 2021).
The initiation and progression of HCC is not fully understood so far, while hypoxia is known to contribute to the development of HCC (Parks et al., 2016). The hypoxic microenvironment regulates tumor angiogenesis and energy metabolism (Gao et al., 2007), and it is linked to treatment resistance of cancer and poor prognosis of patients (Tsai and Wu, 2012; Ramapriyan et al., 2019).
HIF1A is a transcription factor that is required for a tumor to adapt to hypoxia (Cheng et al., 2007; Semenza, 2012a). It can decrease the maturation of dendritic cells (DCs) by promoting the production of vascular endothelial growth factor (VEGF) (Lin et al., 2004; Zhang et al., 2005), and it can also regulate tumor cell energy metabolism programs and regulate cell cycle checkpoint proteins (Semenza, 2012b; Hu et al., 2019). Tumors can adapt to the hypoxic environment, while the relevant immune cells cannot survive in the hypoxic environment, making the tumor escape the immune system and promoting the growth of tumor tissues (Noman et al., 2014; Xu et al., 2016).
The CRISPR system is a special family of DNA repeats that are widely distributed in bacterial and archaeal genomes (Wu et al., 2019), and it is a simple and powerful gene editing tool (Yang et al., 2021). MicroRNA (miRNA) is a small noncoding single-stranded RNA molecule with a length of approximately 22 nucleotides (Bartel, 2004). Through directly binding to the 3′ untranslated region (UTR) of target gene mRNA, miRNAs induce degradation of mRNA or inhibit mRNA translation, resulting in downregulation of target gene expression. A miRNA can regulate the expression of multiple genes, and a gene can be regulated by multiple miRNAs, making the regulatory network complicated (Tiwari et al., 2018; Chen et al., 2019). It has been shown that aberrant miRNA expression is associated with cancer, including HCC. However, the major network of mRNA and miRNA mediated by HIF1A in HCC remains to be explored.
In order to acquire comprehensive knowledge of HIF1A-regulated genes in HCC, in this study, we constructed an HIF1A knockout cell model using the CRISPR/Cas9 system. RNA-seq identified differently expressed mRNAs and miRNAs when HIF1A expression was knocked out. We further analyzed the function of HIF1A-regulated mRNA and miRNA.
The liver cancer cell lines HepG2 were purchased from the Cancer Institute of the Chinese Academy of Medical Science. HEK293T cells were purchased from ATCC. LentiCRISPRv2 (plasmid ID: #52961, 52961V2 in short.), psPAX2 (plasmid ID: #12260), and pCMV-VSV-G (plasmid ID: #8454) vectors were retrieved from Addgene (Cambridge, MA). The BsmBI restriction enzyme was purchased from New England Biolabs (Boston, MA). Genomic extraction kits and total RNA extraction kits were purchased from Omega (Norcross, GA). The reverse transcription kit and qPCR fluorescence MIX were purchased from TAKARA (Dalian, China). The transfection reagent Lipofectamine® 3000 was purchased from Thermo Fisher (Waltham, MA). The antibodies used were HIF-1A (D1S7W, product number: 36169, lot: 2, 1:1000) rabbit monoclonal antibodies (Cell Signaling, United States), beta-actin (13E5, product number: 8457, lot: 7, 1:1000) rabbit monoclonal antibodies (Cell Signaling, United States), and HIF2A (D9E3, product number: 7096, lot: 6, 1:1000) rabbit monoclonal antibodies (Cell Signaling, United States).
sgRNAs for HIF1A and LacZ were designed using CHOPCHOP (http://chopchop.cbu.uib.no). Based on the characteristics of the restriction sites, we added CACCG to the 5′ end and AAAC to the 3′ end (Table 1). After oligo-pairing and annealing, the double-stranded DNA were digested with BsmbI and inserted into the 52961V2 plasmid.
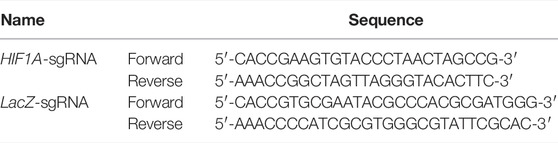
TABLE 1. Oligo-sequencing used to construct the CRISPR/Cas9-HIF1A and LacZ plasmid.
HEK293T cells were transfected with the vector (52961V2--HIF1A) and lentiviral packaging vectors (12260; 8454). Supernatants were collected and the lentiviral viruses were concentrated using PEG-it Virus Precipitation Solution (SBI Biosciences).
HepG2 cells were incubated with HEK293 supernatants containing virus plus polybrene at 4 mg/ml at 37°C for 24 h followed by selection with puromycin (for HepG2 cells, 2 μg/ml puromycin).
To stabilize HIF1A protein, HepG2 cells were treated with 0, 50, 100, 150, 200, and 300 μmol/L CoCl2 for 24 h. After measurement of cell viability by the MTT kit (Keygen Biotech, China), the expression of HIF1A protein in CoCl2-treated cells was examined by Western blot to determine the suitable concentration of CoCl2 that can stabilize HIF1A.
The target of the wild-type, LacZ control, and HIF1A knockout HepG2 cells was amplified by PCR and analyzed by Sanger sequencing (Table 2). Knockdown efficiencies were analyzed by comparing treated and control samples with the TIDE webtool (https://tide.nki.nl/). HIF1A knockout cell lines with stable expressions were selected. Then, to analyze the protein expression of HIF1A in HepG2 cells transfected with HIF1A gRNA, cells were collected and lysed in RIPA lysis buffer containing proteinase inhibitor, followed by separation by SDS-PAGE, and transferred onto PVDF membranes. After blocking with 5% skim milk in TBST for 2 h, the membrane was incubated with the primary antibody overnight at 4°C followed by washing and incubation with the secondary antibody at room temperature for 60 min. After washing, the membrane was developed with chemiluminescent solution, and the signal was detected by Amersham Imager 600 (General Electric Company, United States). The signal intensity of interest was analyzed using ImageJ software.
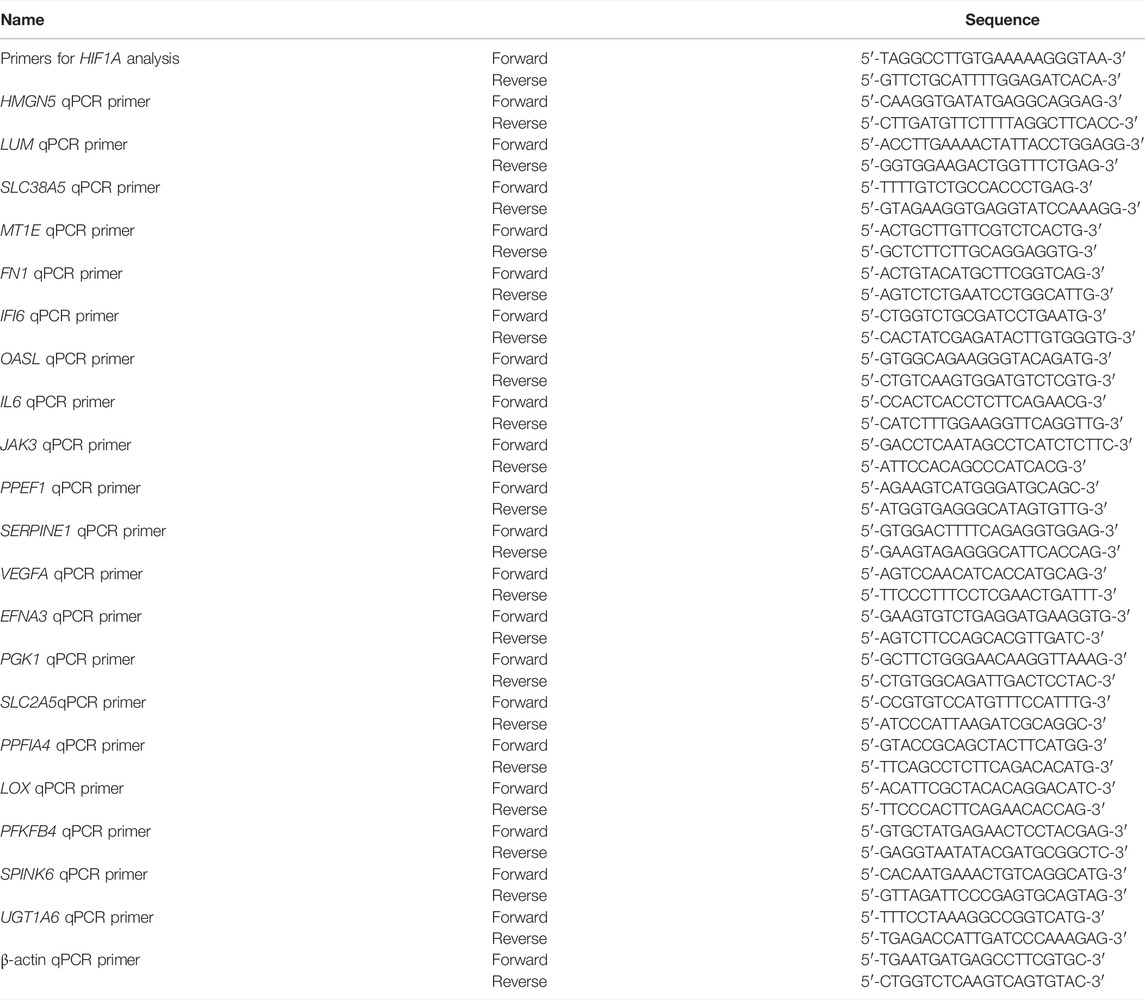
TABLE 2. Primer list.
Total RNA was extracted from the LacZ control and HIF1A knockout HepG2 cells according to the instruction manual of the TRlzol reagent (Life Technologies, California, United States). RNA integrity was assessed using the RNA Nano 6000 Assay Kit of the Agilent Bioanalyzer 2100 system (Agilent Technologies, CA, United States).
The mRNA was isolated from total RNA by the NEBNext Poly(A) mRNA Magnetic Isolation Module (NEB, E7490). The cDNA library was constructed following the manufacturer’s instructions of the NEBNext Ultra RNA Library Prep Kit for Illumina (NEB, E7530) and NEBNext Multiplex Oligos for Illumina (NEB, E7500). In brief, the isolated mRNA was fragmented into approximately 200-nt RNA inserts and used for the synthesis of the first-strand cDNA and the second cDNA. The double-stranded cDNAs were subjected to end-repair/dA-tail and adapter ligation. The suitable fragments were isolated by Agencourt AMPure XP beads (Beckman Coulter, Inc.) and amplified by PCR. Finally, the constructed cDNA libraries of the HepG2 cells were sequenced on a flow cell using an Illumina HiSeq™ sequencing platform.
A small RNA Sample Library Prep Kit for Illumina (NEB, United States) following the manufacturer’s recommendations and index codes was added to attribute sequences to each sample. Briefly, first of all, the 3′ SR adapter was ligated. The 3′ SR adapter for Illumina, RNA, and nuclease-free water is mixed in a mixture system after incubation for 2 min at 70° in a preheated thermal cycle. The tube was transferred to ice. Then, 3′ ligation reaction buffer (2X) and 3′ ligation enzyme mix were added to ligate the 3′ SR adapter and incubated for 1 h at 25°C in a thermal cycler. To prevent adapter-dimer formation, the SR RT primer hybridizes the excess of 3′ SR adapter (that remains free after the 3′ ligation reaction) and transforms the single-stranded DNA adapter into a double-stranded DNA molecule. dsDNAs are not substrates for ligation mediation. Second, the 5′ SR adapter was ligated. Then, reverse transcription synthetic first-chain PCR amplification and size selection were performed. PAGE gel was used for electrophoresis fragment screening purposes, rubber cutting, and recycling as the pieces get small RNA libraries. Last, PCR products were purified (AMPure XP system) and library quality was assessed on the Agilent Bioanalyzer 2100 system. Raw reads in FASTQ format were first processed through in-house Perl scripts.
Finally, clean reads were obtained by removing reads containing adapters, reads containing ploy-N, and low-quality reads from raw data. Then, Q20, Q30, GC-content, and sequence duplication levels of the clean data were calculated. At the same time, miRNAs of reads were trimmed and cleaned by removing the sequences smaller than 18 nt or longer than 30 nt. All the downstream analyses were based on clean data with high quality.
The clustering of the index-coded samples was performed on a cBot Cluster Generation System using TruSeq PE Cluster Kit v4-cBot-HS (Illumina) according to the manufacturer’s instructions. After cluster generation, the library preparations were sequenced on an Illumina platform and paired-end reads were generated. FPKM data were generated using the fpkm function in DESeq2. Differential expression analysis of two conditions/groups was performed using the DESeq2 R package (1.10.1). DESeq2 provides statistical routines for determining differential expressions in digital miRNA expression data using a model based on the negative binomial distribution. Fold change >1.5 and p < 0.05 were considered differentially expressed. The target genes of miRNA were predicted by TargetScan and miRanda.
There are two enrichment analyses used in the current study, Gene Oncology (GO) enrichment and KEGG pathway enrichment. For GO enrichment analysis of the differentially expressed genes (DEGs), the GOseq R package, which is based on Wallenius noncentral hyper-genomic distribution, was used (Young et al., 2010). KEGG is a database resource and can be traced on the website: https://www.genome.jp/kegg/(Kanehisa et al., 2016). Cytoscape software was used for Gene Oncology (GO) enrichment and KEGG pathway enrichment.
The sequences of the DEGs were blasted to the genome of a related species (the protein–protein interaction of which exists in the STRING database: http://string-db.org/) to predict the interaction of these DEGs which were visualized in Cytoscape.
In order to identify potential targets of miRNAs, the R package Hmisc v4.2.0 was used for paired miRNA and mRNA correlation analysis to examine the correlation between miRNA and the predicted target from TargetScan databases. The fsva function in the sva R package was used for frozen surrogate variable analysis to remove nuisance batch effects from both miRNA and mRNA datasets, and the adjusted version of the datasets was used for correlation analysis.
Real-time qPCR was run as described. Briefly, LacZ control or HIF1A knockout HepG2 cells were treated with 100 μmol/L CoCl2 for 24 h. Total RNA was extracted using the phenol/chloroform method as described, followed by treatment with DNase I to eliminate residual DNA. cDNA was synthesized using PrimeScript RT Master Mix (Takara Bio) from 2 µg of total RNA according to the manufacturer’s instructions. For miRNA analysis, cDNAs were synthesized using the miRNA First-Strand cDNA Synthesis kit (Sangon Biotech, China) from 2 µg of total RNA. The real-time qPCR using SYBR pre-mix EX Taq (Takara Bio) on qTOWER2.0 (Analytic Jena, Germany) quantified the expression of significantly DEGs according to the manufacturer’s instructions. The thermal cycling procedure started with an initial denaturation at 95°C for 10 min, followed by 45 cycles of denaturation for 10 s at 95°C, primer binding for 20 s at 60°C, and elongation for 20 s at 72°C. The procedure ended with a final amplification at 95°C for 5 s, 65°C for 1 min, the addition of a dissociation curve step, and a cooling step. Primers were purchased from Sangon Biotech (Shanghai, China), and information on primers is shown in Table 2.
The expression of significantly DEGs in liver cancer and adjacent tissues was analyzed in the TCGA database, and the association between the related DEGs and the level of immune cell infiltration in liver cancer tissues was analyzed.
In order to enhance HIF1A expression, we treated HepG2 cells with a series of concentrations (0, 50, 100, 150, 200, and 300 μmol/L) for 24 h; in the meantime, we used an MTT assay to monitor the CoCl2 toxicity to HepG2 cells. As shown in Figure 1A, cell growth was dramatically inhibited when CoCl2 reached 200 μmol/L or higher; we also found that both 100 and 150 μmol/L CoCl2 for 24 h could induce HIF1A expression (Figure 1B). Therefore, we selected 100 μmol/L CoCl2 to enhance HIF1A expression in the following experiments, and the sequencing results of plasmids 52961-HIF1A and 52961-LacZ showed the same sequences as those of designed sgRNAs, indicating that both plasmids carry the right target sequences (Figure 1C).
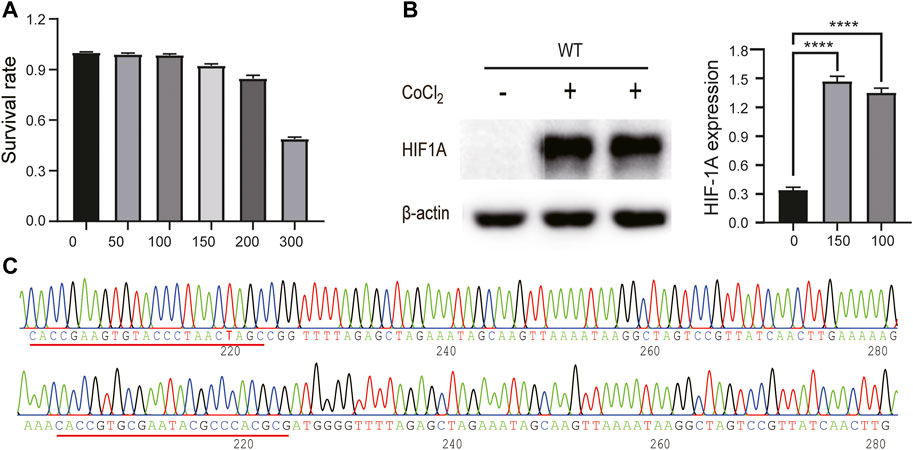
FIGURE 1. CoCl2-induced conditions and plasmid construct. (A) Cytotoxicity of CoCl2 to HepG2 cells was measured by MTT assay. (B) Comparison of HIF1A protein expression between control cells and CoCl2-treated cells (****p < 0.0001). (C) Sequencing results of 52961V2 plasmid.
We next made an effort on knocking out HIF1A expression in HepG2 cells using the CRISPR/Cas9 technology so as to investigate the downstream targets it potentially impacted in the hypoxic condition. To this end, the sequencing-confirmed vectors were used to produce lentiviruses, which were utilized to infect HepG2 cells. Sanger DNA sequencing results showed that there were indels in those transduced cells resulting from those Cas9 cleavage–induced mutations (Figure 2A), leading to incorrect transcripts of HIF1A and subsequent protein depletion, which was confirmed by Western blot (Figure 2B). The results showed that the knockdown efficiency of HIF1AKO-3 was the highest, which was used for subsequent experiments.
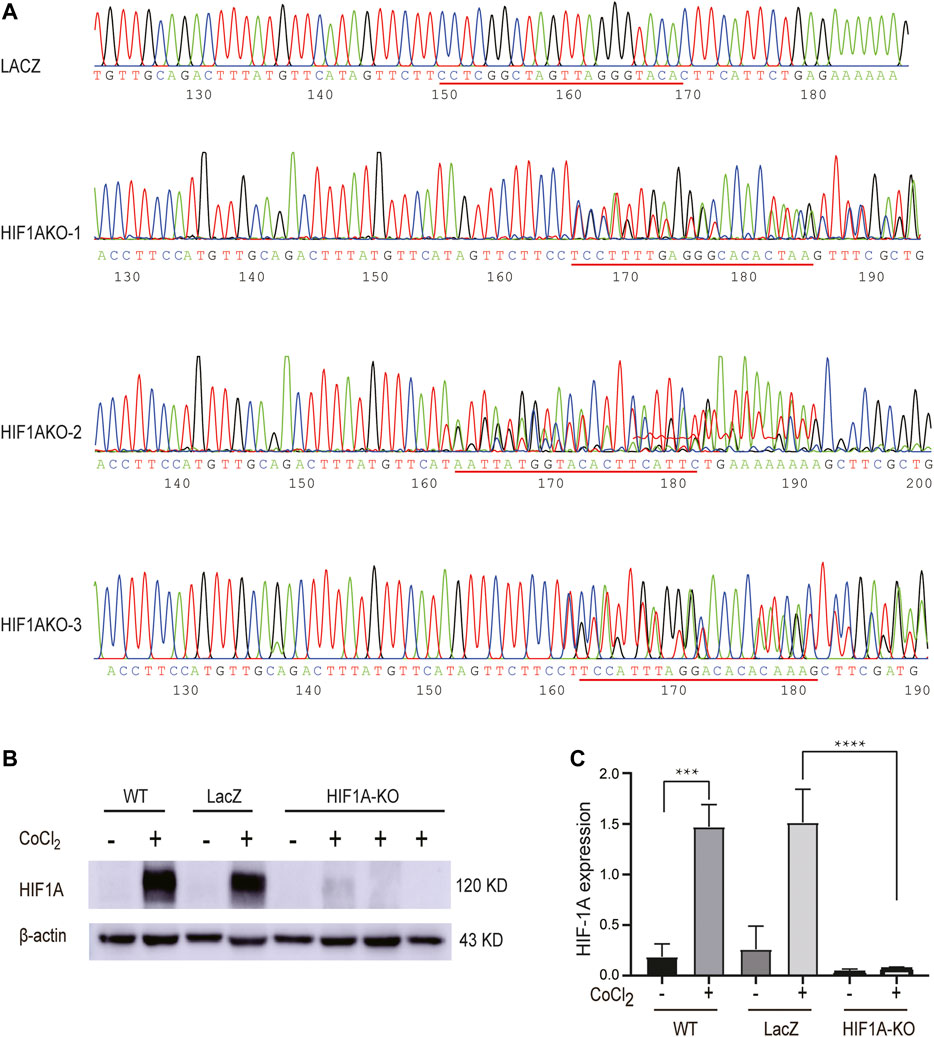
FIGURE 2. Establishment of HIF1A-KO and LACZ-control HepG2 cells. (A) Stable expression cell lines of 52961V2-HIF1A and 52961V2-LacZ were sequenced. (B) Examination of HIF1A protein expression in control cells and HIF1A-KO cells by Western blot. (C) HIF1A expression was significantly reduced in the HIF1A knockout group (***p < 0.001, ****p < 0.0001).
The RNA-sequencing results showed that in the HIF1A knockout group, there were 21,490,942, 24,564,111, and 26,423,022 clean reads; in the LacZ control group, there were 33,738,934, 39,383,712, and 21,954,987 clean reads. Information on sequencing quality is shown in Table 3. Using the HISAT2 system to compare the clean reads with reference genes (GRCh38/hg38), the LacZ control group had a comparison efficiency of 84.65%, and the HIF1A knockout had a comparison efficiency of 87.00%.
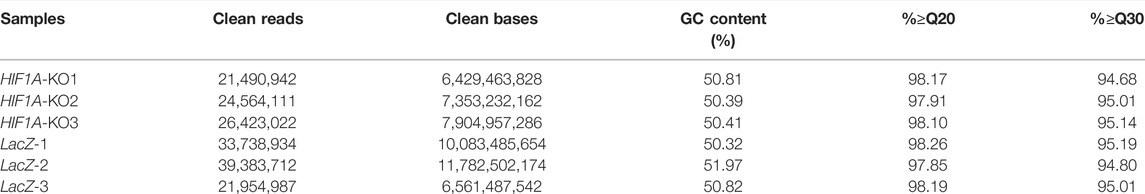
TABLE 3. RNA-seq data statistics.
Gene expression quantification and differential gene analysis showed that in HIF1A knockout cells and control cells, there were 1535 DEGs regulated by HIF1A, of which there were 644 upregulated and 891 downregulated in the HIF1A-knockout HepG2 cells. Figure 3A shows the top six genes with 10-fold differences, and Table 4 listed the top 10 genes whose expressions were found with most differences.
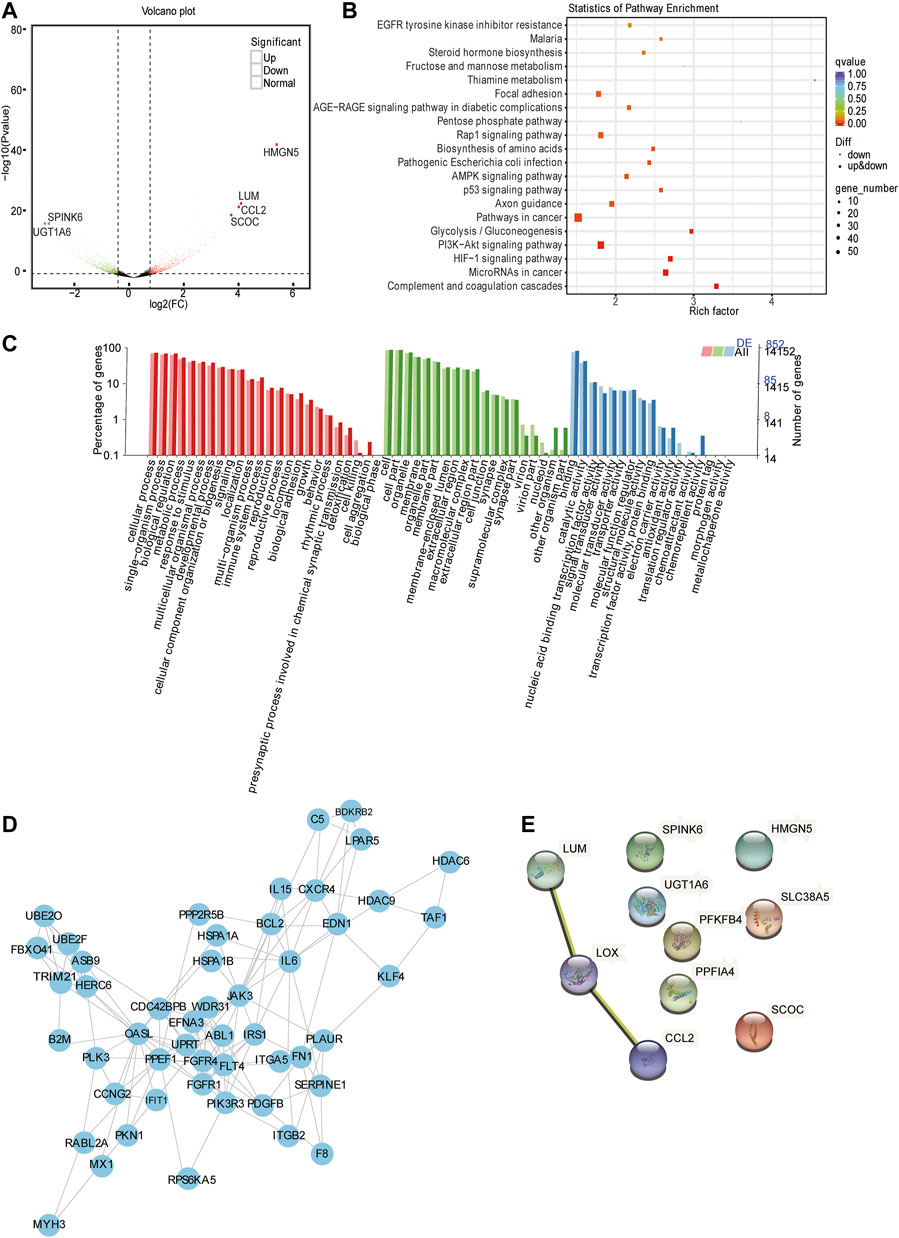
FIGURE 3. Analysis of mRNA-seq. (A) Volcano plot displaying gene expression alterations in HIF1A-KO cells compared to those of the control. The red points represent upregulated DEGs and the blue points represent downregulated DEGs. Black points represent RNAs with no difference in expression. (B) Top 20 KEGG pathway enrichment of DEGs. The x-axis indicates the rich factor and the y-axis indicates the pathway names. (C) GO analysis of DEGs through diverse GO categories. The red column represents the biological process; the green column represents the cellular component; the blue column represents the molecular function. (D) Protein–protein interaction network based on STRING database analysis and Cytoscape. (E) PPI analysis of top 10 regulated DEGs.
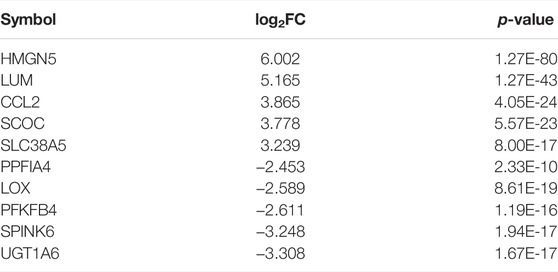
TABLE 4. DEGs with most difference in expression when HIF1A was knocked out.
In order to know the function of HIF1A regulated genes, we next ran GO and KEGG pathway analysis of DEGs. The results showed that there were the top 20 pathways by KEGG metabolic pathway annotation (Figure 3B). In addition, KEGG enrichment uncovered that HIF1A-regulated genes were involved in the “cancer pathway,” “HIF1 signaling pathway,” “PI3K-Akt signaling pathway,” “cancer,” “microRNAs in cancer,” and “P53 signaling pathway.” Furthermore, GO analysis revealed that HIF1A-regulated DEGs were mainly enriched in biological metabolic processes, cell membrane components, catalytic factor activity, transcription factor activity, and other cellular and biological functions (Figure 3C). Notably, HIF1A knockout led to a sudden increase in the expression of CCL2 (immune chemokine) and HMGN5 (transcription activator protein) and UGT1A6 and SPINK6 (these genes involved in fat-soluble substance conversion and amino acid degradation). Based on these function assays, we assume that HIF1A can regulate the immune regulation, apoptosis, and inflammatory process of liver cancer cells, and it plays an important role in regulating the energy metabolism of liver cancer cells, such as fatty acids, sterols, and carbohydrates.
To further explore the function of HIF1A-regulated DEGs and their biological roles, we analyzed the DEGs using the STRING database (a database that searches for protein interactions). We obtained a huge network of 587 nodes. K-core is often used as an index in the evaluation of protein correlation. We selected genes from the core node for display (Figure 3D), which contained 50 nodes and a degree of 136. Among these, the five highest connectivity genes were OASL, IL6, TAF1, JAK3, and PPEF1. We further analyzed 10 DEGs using the STRING database and found genes of LUM, LOX, and CCL2 with interaction relationship.
We also isolated small RNAs from the HIF1A-knockout HepG2 cells and measured their relative abundance using Illumina HiSeq2500 (Biomarker technologies Co, Ltd., Beijing, China). As shown in Table 5, there were clean reads of six samples generated after removing contaminant reads, and it also showed an overview of reads for small RNA sequencing from raw data to high quality and with quality filtering. The lengths of small RNAs were similar among libraries, and there were 21–25 nt RNAs most abundant (Figure 4A).
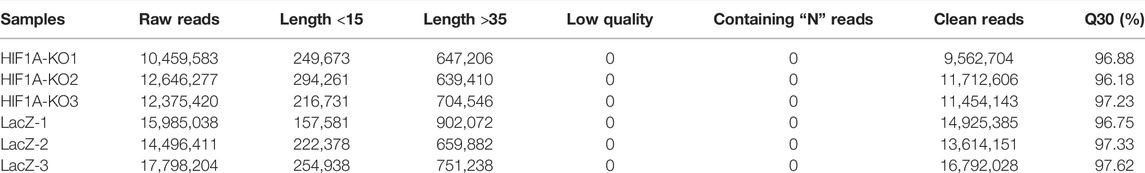
TABLE 5. Summary of sequence data generated of small RNA and quality filtering.
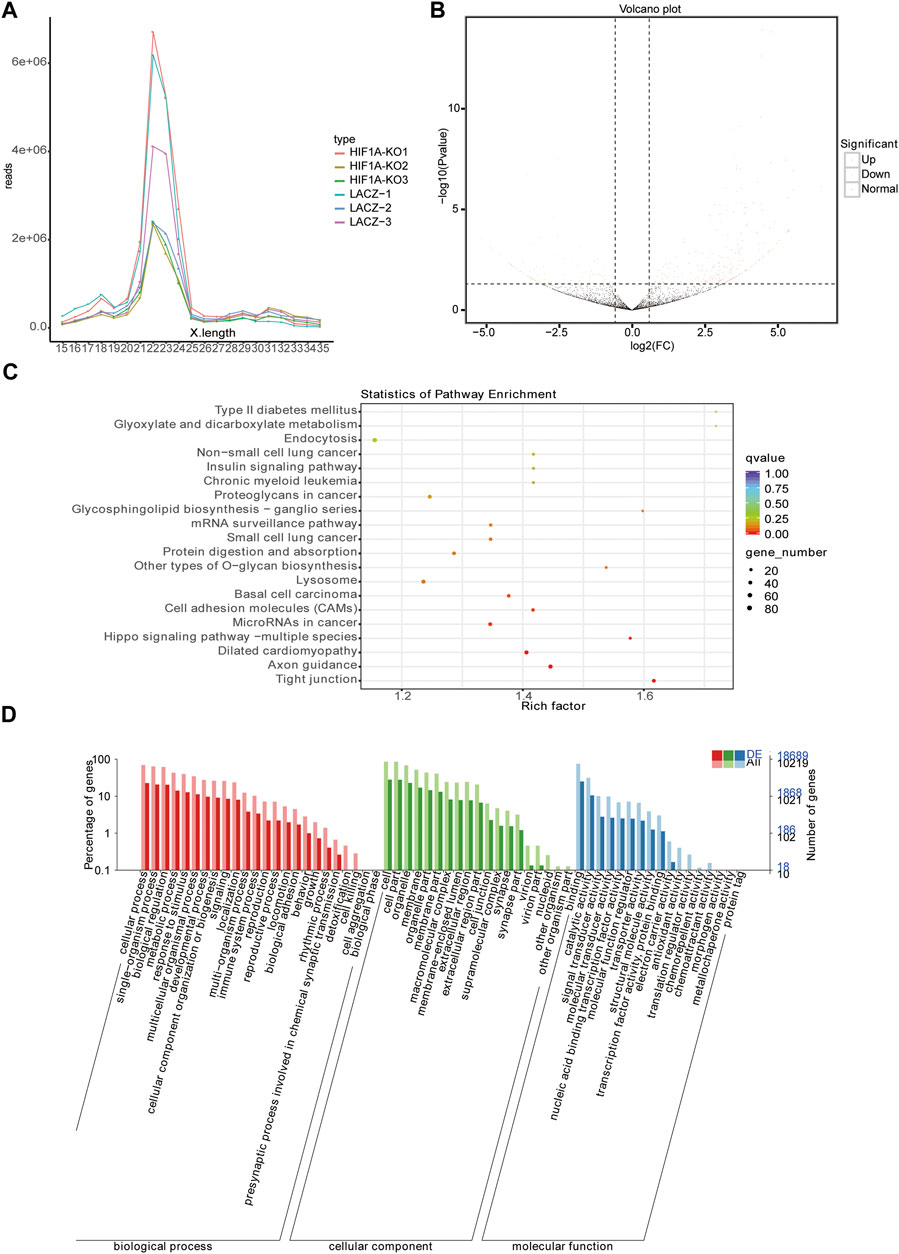
FIGURE 4. Analysis of miRNA-seq. (A) Length distribution of miRNAs in the six libraries. (B) Volcano plot displaying miRNA expression alterations in HIF1A-KO cells compared to those of the control. (C) Top 20 KEGG pathways enrichment of DEMs. (D) GO analysis of DEMs through diverse GO categories.
Using miRNA sequencing, we identified 65 known miRNAs and 244 novel miRNAs in total as HIF1A-regulated miRNAs in the HIF1A-knockout HepG2 cells (Figure 4B). Of these 309 DEMs (differentially expressed miRNAs), the expressions of 213 miRNAs were upregulated (expression of 100 miRNAs increased more than 10-fold) and those of 96 miRNA decreased (expression of 38 miRNAs decreased more than 10-fold) in the HIF1A-knockout HepG2 cells. Notably, the top 12 DEMs (including six known miRNAs and six novel miRNAs) are listed in Table 6.
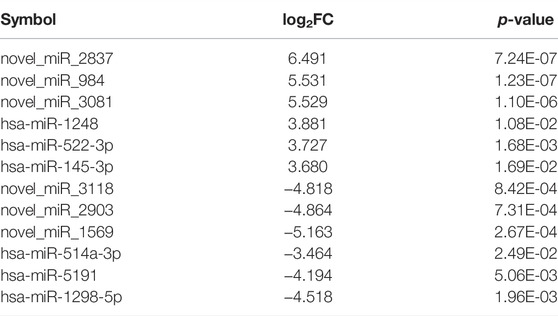
TABLE 6. DEMs whose expressions are regulated when HIF1A expression was knocked out.
To elucidate the biological functions of the identified DEMs, we used miRmap and TargetScan to predict their target genes and found there were 11,889 genes as the potential miRNA targets. KEGG pathway analysis and GO function annotations of the 11,889 genes showed that they were enriched in the ferroptosis pathway. KEGG enrichment analysis discovered the first five pathways as “tight junction,” “axon guidance,” “dilated cardiomyopathy,” “hippo signaling pathway-multiple species,” and “microRNAs in cancer” (Figure 4C). GO analysis further showed that they were involved in the single-organism process, cell part, and catalytic activity (Figure 4D).
To clarify the regulatory relationship between miRNAs and mRNAs, we identified the potential miRNA–mRNA pairs based on gene expression profiles obtained earlier. Usually, miRNAs negatively regulate the expression of their target genes, that is, increased miRNA expression leads to downregulation of target genes and vice versa. As shown in Figure 5A, we identified 425 genes by the intersection of downregulated DEGs and target genes of upregulated DEMs. KEGG pathway analysis and GO function annotations of these genes revealed that they were enriched in the HIF-1 signaling pathway, carbon metabolism, and glycolysis/gluconeogenesis (Figure 5B). In GO analysis, these genes were mainly enriched in biological regulation, cell part, and catalytic activity (Figure 5C). Furthermore, through the intersection of upregulated DEGs and target genes of downregulated DEMs, we identified 201 genes (Figure 5D), of which KEGG enrichment analysis showed their enrichment in the first three pathways, “PI3K-Akt signaling pathway,” “Rap1 signaling pathway,” and “Oxytocin signaling pathway” (Figure 5E), and GO analysis showed their enrichment in the single-organism process, cell part, and catalytic activity (Figure 5F).
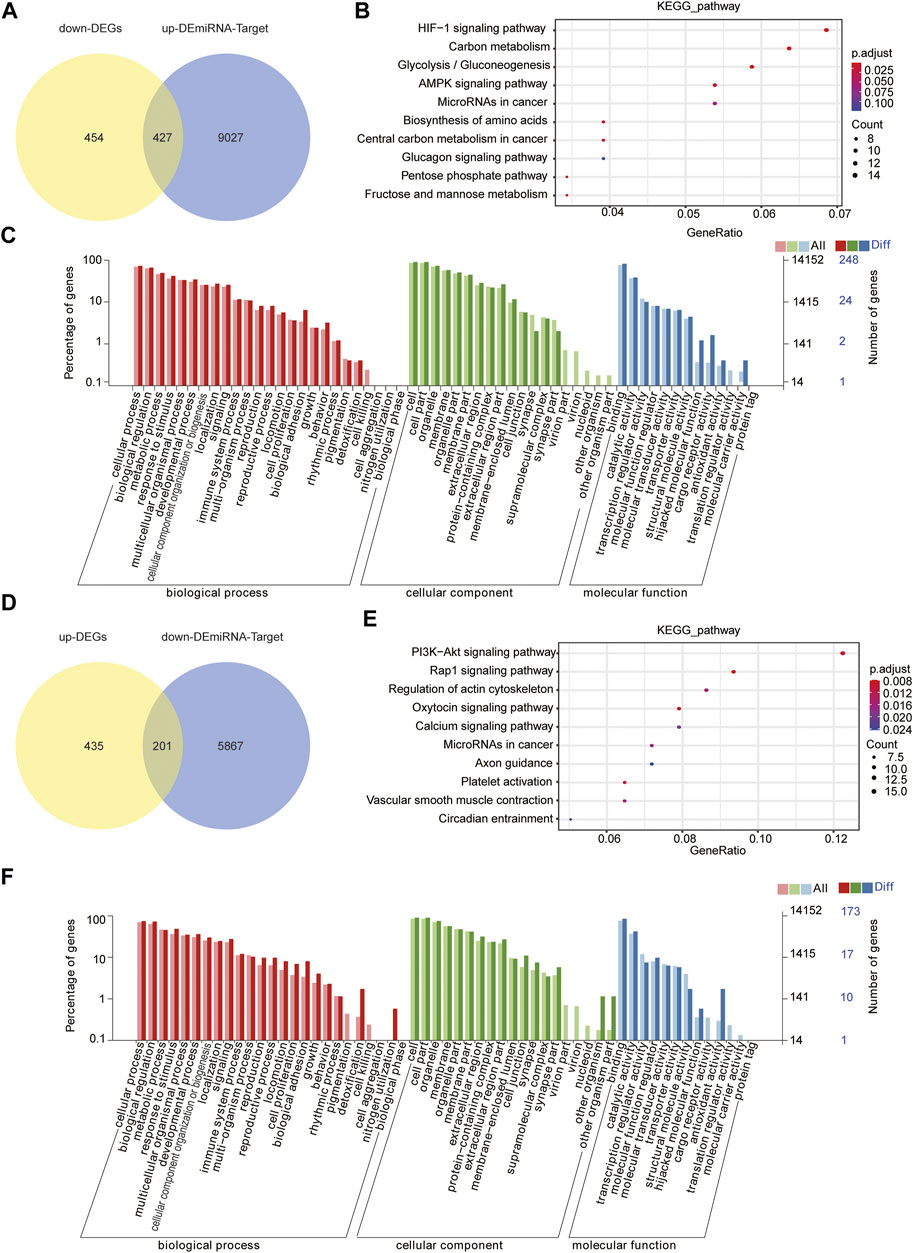
FIGURE 5. Joint analysis of miRNA and mRNA. (A) Intersection of target genes of upregulated DEMs and downregulated DEGs. (B) Top 10 KEGG pathways the target genes are enriched in. (C) GO analysis of target genes. (D) Intersection of target genes of downregulated DEMs and upregulated DEGs. (E) Top 10 KEGG pathways enrichment of D (F) GO analysis of D through diverse GO categories.
To verify the RNA-seq results, we examined 21 representative genes by qPCR, and the results showed that the overall trend of qPCR and RNA-seq follows approximately the same pattern (Figure 6A), indicating that the sequencing results were credible. We further examined the DEGs (fold change >10) in 50 adjacent normal tissues and 371 HCC samples from TCGA. The analysis revealed that the expression of UGT1A6, SPINK6, and SCOC was stronger in HCC than in adjacent normal tissues, while the expression of HMGN5, LUM, and CCL2 was weaker in HCC than in adjacent normal tissues (Figure 6B). To this end, we used the R software package to display the multi-gene correlation map and discovered that LUM, SCOC, and CCL2 were significantly associated with immune cell infiltration levels.
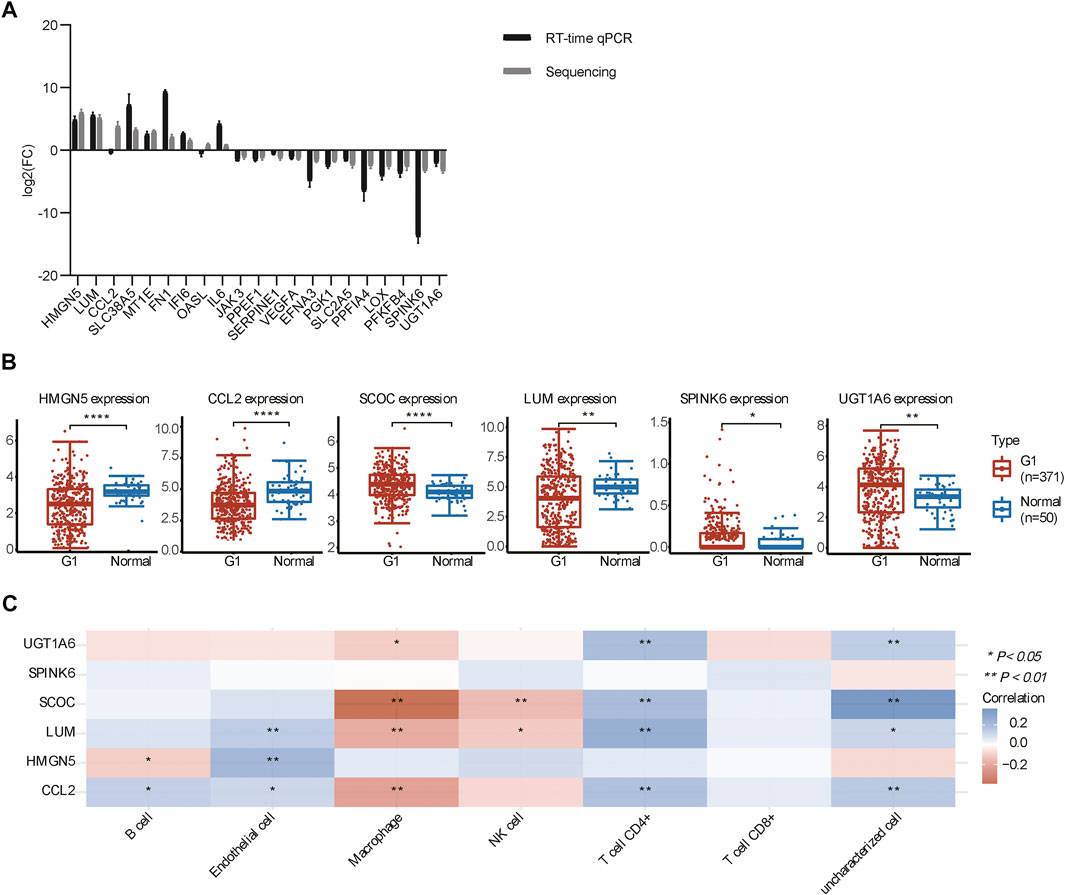
FIGURE 6. DEG expression analysis by RT-qPCR and in TCGA. (A) Expression of DEGs in the HIF1A-KO and LACZ-control HepG2 cells. (B) Expression of DEGs in tumor and normal tissues in TCGA (*p < 0.05, **p < 0.01, and ****p < 0.0001). (C) Heat map of the correlation between multiple genes and immune cells in HCC. The horizontal and vertical coordinates represent genes, different colors represent correlation coefficients (blue represents positive correlation and red represents negative correlation), and the darker color represents the two stronger correlations (*p < 0.05 and **p < 0.01).
HCC is the fifth most common malignancy with high mortality worldwide, accounting for approximately 90% of primary liver cancers, and the five-year survival rate is less than 10% (Anwanwan et al., 2020). It is known that hypoxia is a common characteristic of solid tumors including HCC, and hypoxia is essential for cancer initiation, progression, metastasis, and drug resistance (Gonzalez et al., 2018; Mendez-Blanco et al., 2018; Feng et al., 2020). HIF1A is a key regulator of the hypoxia responses (Song et al., 2018), regulating the expression of target genes and miRNAs that play an important role in angiogenesis, erythropoiesis, energy metabolism, and cell survival (Ampuja et al., 2017). In particular, ADM, VEGF, P53, miR-18a, miR-199a, and miRNA-376b-5p are regulated by HIF1A (Loboda et al., 2010; Dai et al., 2015; Serocki et al., 2018; Yang et al., 2019).
The regulation of HIF1A is a complex network. So far, a comprehensive miRNA–mRNA regulatory network of HIF1A in HCC has not been reported yet. In this present study, we established a HIF1A knockout and LacZ control model using the CRISPR/Cas9 technology in HepG2 cells. Using RNA-seq, we screened the mRNAs and miRNAs with differential expressions. Then, 1535 DE-mRNAs and 309 DE-miRNAs (65 known miRNAs and 244 novel miRNAs) were identified. According to the gene function annotations, HIF1A-related pathways were identified. In particular, the cancer pathway, microRNAs in cancer, PI3K-Akt signaling pathway, and HIF1A signaling pathway were enriched in the analysis of transcriptome sequencing. In addition, the hippo signaling pathway, axon guidance, and tight junction were enriched in miRNA transcript levels. In the integration analysis of miRNA–mRNA expression profiles, we constructed a miRNA–mRNA regulatory network according to the DEM and DEG datasets and miRNA-targeting information. We found that the HIF-1 signaling pathway, carbon metabolism, and glycolysis/gluconeogenesis were enriched in the integration analysis of downregulated DEGs and target genes of upregulated DEMs and the PI3K-Akt signaling pathway,” “Rap1 signaling pathway,” and “oxytocin signaling pathway” were enriched in the integration analysis of upregulated DEGs and target genes of downregulated DE-miRNAs. These data confirm the important role of HIF1A in tumor cell proliferation and apoptosis.
Our further analysis uncovered that both UGT1A6 involved in lipolysis SPINK6 that involved in amino acid degradation were decreased significantly (Kobayashi et al., 2006; Ge et al., 2017), suggesting that HIF1A is involved not only in the glycolytic pathway (Hu et al., 2006) but also in the other energy metabolism processes. Furthermore, the chemokine CCL2 and nucleosome-binding protein HMGN5 were increased significantly since CCL2 plays a key role in tumor inflammation and HMGN5 might be the important regulators of gene expression in cells (Tang et al., 2012; Lin et al., 2013; Gonzalez-Romero et al., 2015; Liu et al., 2020). These data suggest that immune responses in cancer are also regulated by HIF1A. It is intriguing that the expressions of HMGN5 and CCL2 are greatly influenced by HIF1A, but how these two genes are regulated by HIF1A still remains to be clarified.
The identified PPI network and top 50 hub genes included angiogenesis-related genes, such as FGFR1, FGFR4, FDGFB, and EDN1 ; immune-related genes such as IL6, JAK3, and IL15 ; and some associated with apoptosis and drug resistance such as ABL1, BCL2, PLK3, and PAF1. Among the 10 most regulated DEGs analyzed by PPI analysis, these three genes, LUM, LOX, and CCL2, have interaction effects. After comprehensive analysis, we established a staggered network (Figure 7A), suggesting that HIF1A has great association with the pathway, and this pathway might prove to be useful in the diagnosis, treatment, and prognosis of HCC patients. In addition, by integrated analysis of mRNA and miRNA, we have also established a potential network, which shows some networks of node genes (Figure 7B). In this network, PFKFB4, HMGN5, FGFR1, BCL2, JAK3, LOX, ITGA5, miR-296, and miR-145 have been demonstrated to associate with HIF1A (Minchenko et al., 2004; Preusser et al., 2014; Sun et al., 2018; Zhao et al., 2018; Gentile et al., 2019; Xu et al., 2019; Saatci et al., 2020; Li and Li, 2022), these molecules are closely related to inflammation, tumor metastasis, apoptosis, and drug resistance; however, the mechanism of action whereby these regulatory factors act on the HCC remains to be elucidated. In conclusion, we have discovered many more putative HIF1A target mimics, important for exploring novel mechanisms and therapeutic targets.
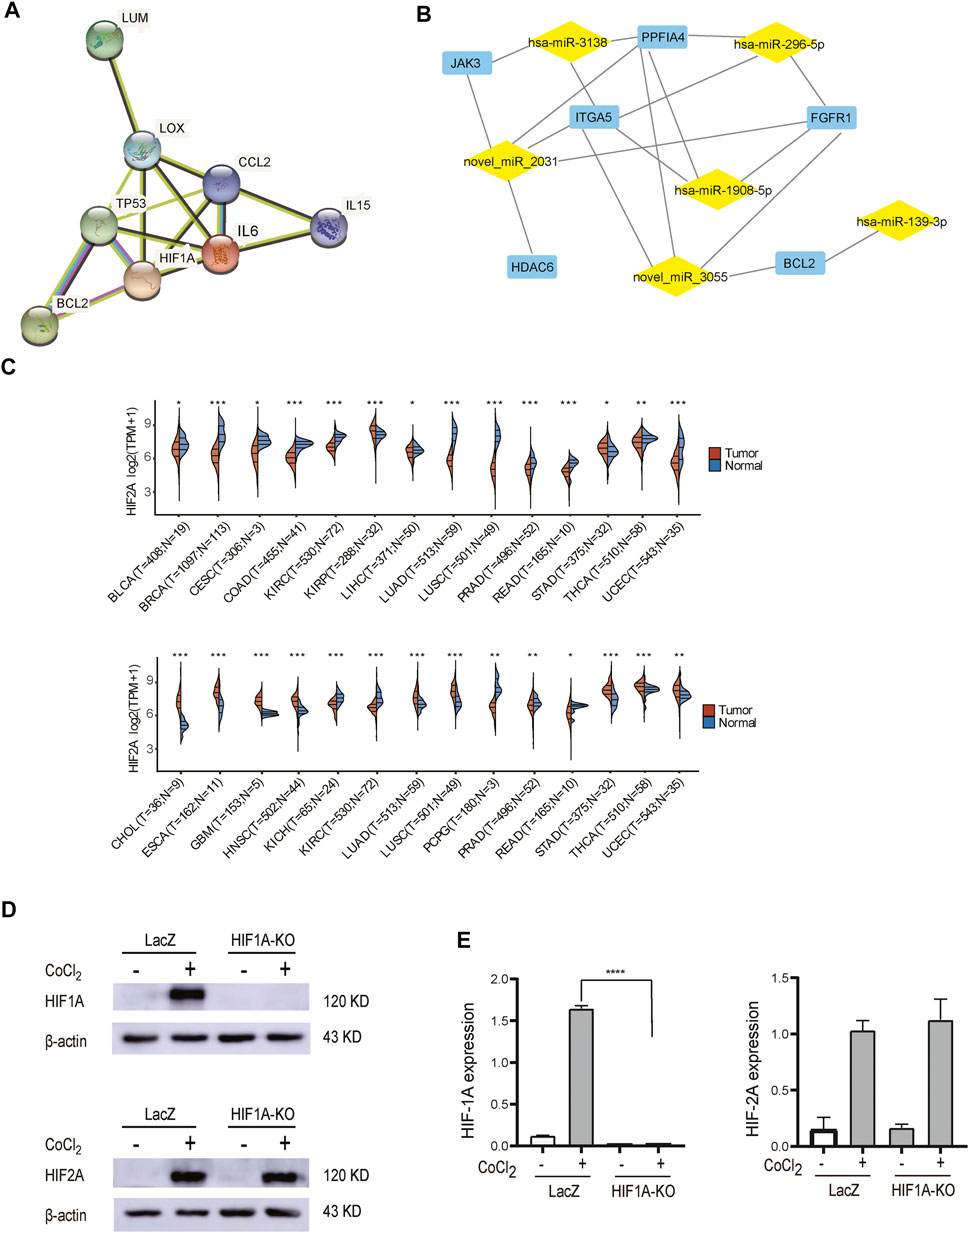
FIGURE 7. Potential mechanistic. (A) PPI of hub genes. (B) Putative miRNA–mRNA correlation network. Expression of HIF1A and HIF2A in pan-carcinomatissues (*p < 0.05, **p < 0.01, ***p < 0.001). (D) Examination of HIF2A protein expression in control cells and HIF1A-KO cells by Western blot. (E) The HIF2A expression of HIF1A-KO and LACZ-control HepG2 cells was not changed significantly (****p < 0.0001).
Some studies show that HIF2A was also particularly important under hypoxia, and there is expression crosstalk between HIF2A and HIF1A (Branco-Price et al., 2012; Kocabas et al., 2012; Krzywinska et al., 2017; Hsu et al., 2020). We performed a pan-cancer search for HIF1A and HIF2A through TCGA databases, and HIF1A and HIF2A were found to be differentially expressed in many same or different cancers (Figure 7C). The expression of HIF2A was confirmed in HIF1A-KO and LACZ-control HepG2 cells by WB analysis. The results showed that HIF2A was not changed significantly (Figure 7E). This suggests that the functions of HIF1A and HIF2A may be relatively independent in HepG2 cells. Therefore, in the follow-up study, we plan to obtain HIF2A knockout cell lines for RNA-seq sequencing and compare them with this experimental result.
Finally, there are some limitations in this study, namely, the results we obtained need to be verified by other experimental methods, and novel miRNAs identified need to be further explored to understand the underlying molecular mechanism. In summary, the present study delineates a network that may help explore the molecular mechanisms of HIF1A in HCC, providing clues for the novel therapeutic targets for HCC treatment.
The original contributions presented in the study are publicly available. This data can be found here: PRJNA79920.
TL, JT, XL, YL, YY, and HL designed and wrote the manuscript. TL, JT, XL, YY, KM, HM, and YQ performed research. All authors have read and approved the final manuscript.
This work was supported by the Ningxia Natural Science Foundation (Grant No.2020AAC03161 to YY).
The authors declare that the research was conducted in the absence of any commercial or financial relationships that could be construed as a potential conflict of interest.
All claims expressed in this article are solely those of the authors and do not necessarily represent those of their affiliated organizations, or those of the publisher, the editors, and the reviewers. Any product that may be evaluated in this article, or claim that may be made by its manufacturer, is not guaranteed or endorsed by the publisher.
Ampuja, M., Rantapero, T., Rodriguez-Martinez, A., Palmroth, M., Alarmo, E. L., Nykter, M., et al. (2017). Integrated RNA-Seq and DNase-Seq Analyses Identify Phenotype-specific BMP4 Signaling in Breast Cancer. BMC Genomics 18 (1), 68. doi:10.1186/s12864-016-3428-1
Anwanwan, D., Singh, S. K., Singh, S., Saikam, V., and Singh, R. (2020). Challenges in Liver Cancer and Possible Treatment Approaches. Biochimica Biophysica Acta (BBA) - Rev. Cancer 1873 (1), 188314. doi:10.1016/j.bbcan.2019.188314
Branco-Price, C., Zhang, N., Schnelle, M., Evans, C., Katschinski, D. M., Liao, D., et al. (2012). Endothelial Cell HIF-1α and HIF-2α Differentially Regulate Metastatic Success. Cancer Cell 21 (1), 52–65. doi:10.1016/j.ccr.2011.11.017
Bray, F., Ferlay, J., Soerjomataram, I., Siegel, R. L., Torre, L. A., and Jemal, A. (2018). Global Cancer Statistics 2018: GLOBOCAN Estimates of Incidence and Mortality Worldwide for 36 Cancers in 185 Countries. CA A Cancer J. Clin. 68 (6), 394–424. doi:10.3322/caac.21492
Cai, Z., and Liu, Q. (2021). Understanding the Global Cancer Statistics 2018: Implications for Cancer Control. Sci. China Life Sci. 64 (6), 1017–1020. doi:10.1007/s11427-019-9816-1
Chen, L., Heikkinen, L., Wang, C., Yang, Y., Sun, H., and Wong, G. (2019). Trends in the Development of miRNA Bioinformatics Tools. Brief. Bioinform. 20 (5), 1836–1852. doi:10.1093/bib/bby054
Cheng, J., Kang, X., Zhang, S., and Yeh, E. T. H. (2007). SUMO-specific Protease 1 Is Essential for Stabilization of HIF1α during Hypoxia. Cell 131 (3), 584–595. doi:10.1016/j.cell.2007.08.045
Dai, L., Lou, W., Zhu, J., Zhou, X., and Di, W. (2015). MiR-199a Inhibits the Angiogenic Potential of Endometrial Stromal Cells under Hypoxia by Targeting HIF-1α/VEGF Pathway. Int. J. Clin. Exp. Pathol. 8 (5), 4735–4744.
Feng, J., Li, J., Wu, L., Yu, Q., Ji, J., Wu, J., et al. (2020). Emerging Roles and the Regulation of Aerobic Glycolysis in Hepatocellular Carcinoma. J. Exp. Clin. Cancer Res. 39 (1), 126. doi:10.1186/s13046-020-01629-4
Gao, P., Zhang, H., Dinavahi, R., Li, F., Xiang, Y., Raman, V., et al. (2007). HIF-dependent Antitumorigenic Effect of Antioxidants In Vivo. Cancer Cell 12 (3), 230–238. doi:10.1016/j.ccr.2007.08.004
Ge, K., Huang, J., Wang, W., Gu, M., Dai, X., Xu, Y., et al. (2017). Serine Protease Inhibitor Kazal-type 6 Inhibits Tumorigenesis of Human Hepatocellular Carcinoma Cells via its Extracellular Action. Oncotarget 8 (4), 5965–5975. doi:10.18632/oncotarget.13983
Gentile, A. M., Lhamyani, S., Coín‐Aragüez, L., Clemente‐Postigo, M., Oliva Olivera, W., Romero‐Zerbo, S. Y., et al. (2019). miR‐20b, miR‐296, and Let‐7f Expression in Human Adipose Tissue Is Related to Obesity and Type 2 Diabetes. Obesity 27 (2), 245–254. doi:10.1002/oby.22363
Gonzalez, F. J., Xie, C., and Jiang, C. (2018). The Role of Hypoxia-Inducible Factors in Metabolic Diseases. Nat. Rev. Endocrinol. 15 (1), 21–32. doi:10.1038/s41574-018-0096-z
González-Romero, R., Eirín-López, J. M., and Ausió, J. (2015). Evolution of High Mobility Group Nucleosome-Binding Proteins and its Implications for Vertebrate Chromatin Specialization. Mol. Biol. Evol. 32 (1), 121–131. doi:10.1093/molbev/msu280
Hsu, T.-S., Lin, Y.-L., Wang, Y.-A., Mo, S.-T., Chi, P.-Y., Lai, A. C.-Y., et al. (2020). HIF-2α Is Indispensable for Regulatory T Cell Function. Nat. Commun. 11 (1), 5005. doi:10.1038/s41467-020-18731-y
Hu, C.-J., Iyer, S., Sataur, A., Covello, K. L., Chodosh, L. A., and Simon, M. C. (2006). Differential Regulation of the Transcriptional Activities of Hypoxia-Inducible Factor 1 Alpha (HIF-1α) and HIF-2α in Stem Cells. Mol. Cell. Biol. 26 (9), 3514–3526. doi:10.1128/MCB.26.9.3514-3526.2006
Hu, L.-P., Zhang, X.-X., Jiang, S.-H., Tao, L.-Y., Li, Q., Zhu, L.-L., et al. (2019). Targeting Purinergic Receptor P2Y2 Prevents the Growth of Pancreatic Ductal Adenocarcinoma by Inhibiting Cancer Cell Glycolysis. Clin. Cancer Res. 25 (4), 1318–1330. doi:10.1158/1078-0432.CCR-18-2297
Kanehisa, M., Sato, Y., Kawashima, M., Furumichi, M., and Tanabe, M. (2016). KEGG as a Reference Resource for Gene and Protein Annotation. Nucleic Acids Res. 44 (D1), D457–D462. doi:10.1093/nar/gkv1070
Kobayashi, T., Sleeman, J. E., Coughtrie, M. W. H., and Burchell, B. (2006). Molecular and Functional Characterization of Microsomal UDP-Glucuronic Acid Uptake by Members of the Nucleotide Sugar Transporter (NST) Family. Biochem. J. 400 (2), 281–289. doi:10.1042/BJ20060429
Kocabas, F., Zheng, J., Thet, S., Copeland, N. G., Jenkins, N. A., DeBerardinis, R. J., et al. (2012). Meis1 Regulates the Metabolic Phenotype and Oxidant Defense of Hematopoietic Stem Cells. Blood 120 (25), 4963–4972. doi:10.1182/blood-2012-05-432260
Krzywinska, E., Kantari-Mimoun, C., Kerdiles, Y., Sobecki, M., Isagawa, T., Gotthardt, D., et al. (2017). Loss of HIF-1α in Natural Killer Cells Inhibits Tumour Growth by Stimulating Non-productive Angiogenesis. Nat. Commun. 8 (1), 1597. doi:10.1038/s41467-017-01599-w
Li, H., and Li, Y. (2022). Network Pharmacology Analysis of Molecular Mechanism of Curcuma Longa L. Extracts Regulating Glioma Immune Inflammatory Factors: Implications for Precise Cancer Treatment. Ctmc 22 (4), 259–267. doi:10.2174/1568026621666210910123749
Lin, C., McGough, R., Aswad, B., Block, J. A., and Terek, R. (2004). Hypoxia Induces HIF-1Œ± and VEGF Expression in Chondrosarcoma Cells and Chondrocytes. J. Orthop. Res. 22 (6), 1175–1181. doi:10.1016/j.orthres.2004.03.002
Lin, T.-H., Liu, H.-H., Tsai, T.-H., Chen, C.-C., Hsieh, T.-F., Lee, S.-S., et al. (2013). CCL2 Increases αvβ3 Integrin Expression and Subsequently Promotes Prostate Cancer Migration. Biochimica Biophysica Acta (BBA) - General Subj. 1830 (10), 4917–4927. doi:10.1016/j.bbagen.2013.06.033
Liu, X., Guo, A., Tu, Y., Li, W., Li, L., Liu, W., et al. (2020). Fruquintinib Inhibits VEGF/VEGFR2 axis of Choroidal Endothelial Cells and M1-type Macrophages to Protect against Mouse Laser-Induced Choroidal Neovascularization. Cell Death Dis. 11 (11), 1016. doi:10.1038/s41419-020-03222-1
Loboda, A., Jozkowicz, A., and Dulak, J. (2010). HIF-1 and HIF-2 Transcription Factors - Similar but Not Identical. Mol. Cells 29 (5), 435–442. doi:10.1007/s10059-010-0067-2
Méndez-Blanco, C., Fondevila, F., García-Palomo, A., González-Gallego, J., and Mauriz, J. L. (2018). Sorafenib Resistance in Hepatocarcinoma: Role of Hypoxia-Inducible Factors. Exp. Mol. Med. 50 (10), 1–9. doi:10.1038/s12276-018-0159-1
Minchenko, O., Opentanova, I., Minchenko, D., Ogura, T., and Esumi, H. (2004). Hypoxia Induces Transcription of 6-Phosphofructo-2-Kinase/fructose-2,6-Biphosphatase-4 Gene via Hypoxia-Inducible Factor-1α Activation. FEBS Lett. 576 (1-2), 14–20. doi:10.1016/j.febslet.2004.08.053
Noman, M. Z., Desantis, G., Janji, B., Hasmim, M., Karray, S., Dessen, P., et al. (2014). PD-L1 Is a Novel Direct Target of HIF-1α, and its Blockade under Hypoxia Enhanced MDSC-Mediated T Cell Activation. J. Exp. Med. 211 (5), 781–790. doi:10.1084/jem.20131916
Parks, S. K., Cormerais, Y., Marchiq, I., and Pouyssegur, J. (2016). Hypoxia Optimises Tumour Growth by Controlling Nutrient Import and Acidic Metabolite Export. Mol. Aspects Med. 47-48, 3–14. doi:10.1016/j.mam.2015.12.001
Preusser, M., Berghoff, A. S., Berger, W., Ilhan-Mutlu, A., Dinhof, C., Widhalm, G., et al. (2014). High Rate of FGFR1 Amplifications in Brain Metastases of Squamous and Non-squamous Lung Cancer. Lung Cancer 83 (1), 83–89. doi:10.1016/j.lungcan.2013.10.004
Ramapriyan, R., Caetano, M. S., Barsoumian, H. B., Mafra, A. C. P., Zambalde, E. P., Menon, H., et al. (2019). Altered Cancer Metabolism in Mechanisms of Immunotherapy Resistance. Pharmacol. Ther. 195, 162–171. doi:10.1016/j.pharmthera.2018.11.004
Saatci, O., Kaymak, A., Raza, U., Ersan, P. G., Akbulut, O., Banister, C. E., et al. (2020). Targeting Lysyl Oxidase (LOX) Overcomes Chemotherapy Resistance in Triple Negative Breast Cancer. Nat. Commun. 11 (1), 2416. doi:10.1038/s41467-020-16199-4
Semenza, G. L. (2012b). Hypoxia-inducible Factors in Physiology and Medicine. Cell 148 (3), 399–408. doi:10.1016/j.cell.2012.01.021
Semenza, G. L. (2012a). Hypoxia-inducible Factors: Mediators of Cancer Progression and Targets for Cancer Therapy. Trends Pharmacol. Sci. 33 (4), 207–214. doi:10.1016/j.tips.2012.01.005
Serocki, M., Bartoszewska, S., Janaszak-Jasiecka, A., Ochocka, R. J., Collawn, J. F., and Bartoszewski, R. (2018). MiRNAs Regulate the HIF Switch during Hypoxia: A Novel Therapeutic Target. Angiogenesis 21 (2), 183–202. doi:10.1007/s10456-018-9600-2
Song, J., Miermont, A., Lim, C. T., and Kamm, R. D. (2018). A 3D Microvascular Network Model to Study the Impact of Hypoxia on the Extravasation Potential of Breast Cell Lines. Sci. Rep. 8 (1), 17949. doi:10.1038/s41598-018-36381-5
Sun, N., Meng, F., Xue, N., Pang, G., Wang, Q., and Ma, H. (2018). Inducible miR-145 Expression by HIF-1α Protects Cardiomyocytes against Apoptosis via Regulating SGK1 in Simulated Myocardial Infarction Hypoxic Microenvironment. Cardiol. J. 25 (2), 268–278. doi:10.5603/CJ.a2017.0105
Tang, X., Asano, M., O’Reilly, A., Farquhar, A., Yang, Y., and Amar, S. (2012). P53 Is an Important Regulator of CCL2 Gene Expression. Cmm 12 (8), 929–943. doi:10.2174/156652412802480844
Tiwari, A., Mukherjee, B., and Dixit, M. (2018). MicroRNA Key to Angiogenesis Regulation: MiRNA Biology and Therapy. Ccdt 18 (3), 266–277. doi:10.2174/1568009617666170630142725
Tsai, Y.-P., and Wu, K.-J. (2012). Hypoxia-regulated Target Genes Implicated in Tumor Metastasis. J. Biomed. Sci. 19, 102. doi:10.1186/1423-0127-19-102
Wu, W., Yang, Y., and Lei, H. (2019). Progress in the Application of CRISPR: From Gene to Base Editing. Med. Res. Rev. 39 (2), 665–683. doi:10.1002/med.21537
Xu, E., Ji, Z., Jiang, H., Lin, T., Ma, J., and Zhou, X. (2019). Hypoxia-Inducible Factor 1A Upregulates HMGN5 by Increasing the Expression of GATA1 and Plays a Role in Osteosarcoma Metastasis. BioMed Res. Int. 2019, 1–8. doi:10.1155/2019/5630124
Xu, T. X., Zhao, S. Z., Dong, M., and Yu, X. R. (2016). Hypoxia Responsive miR-210 Promotes Cell Survival and Autophagy of Endometriotic Cells in Hypoxia. Eur. Rev. Med. Pharmacol. Sci. 20 (3), 399–406.
Yang, C., Liu, X., Zhao, K., Zhu, Y., Hu, B., Zhou, Y., et al. (2019). miRNA-21 Promotes Osteogenesis via the PTEN/PI3K/Akt/HIF-1α Pathway and Enhances Bone Regeneration in Critical Size Defects. Stem Cell Res. Ther. 10 (1), 65. doi:10.1186/s13287-019-1168-2
Yang, L., Tang, J., Ma, X., Lin, Y., Ma, G., Shan, M., et al. (2021). Progression and Application of CRISPR-Cas Genomic Editors. Methods 194, 65–74. doi:10.1016/j.ymeth.2021.03.013
Young, M. D., Wakefield, M. J., Smyth, G. K., and Oshlack, A. (2010). Gene Ontology Analysis for RNA-Seq: Accounting for Selection Bias. Genome Biol. 11 (2), R14. doi:10.1186/gb-2010-11-2-r14
Zhang, Q., Tang, X., Lu, Q. Y., Zhang, Z. F., Brown, J., and Le, A. D. (2005). Resveratrol Inhibits Hypoxia-Induced Accumulation of Hypoxia-Inducible Factor-1α and VEGF Expression in Human Tongue Squamous Cell Carcinoma and Hepatoma Cells. Mol. Cancer Ther. 4 (10), 1465–1474. doi:10.1158/1535-7163.MCT-05-0198
Keywords: HIF1A, CRISPR/Cas9, HepG2, mRNA-seq, miRNA-seq
Citation: Liu T, Tang J, Li X, Lin Y, Yang Y, Ma K, Hui Z, Ma H, Qin Y, Lei H and Yang Y (2022) The Key Network of mRNAs and miRNAs Regulated by HIF1A in Hypoxic Hepatocellular Carcinoma Cells. Front. Genet. 13:857507. doi: 10.3389/fgene.2022.857507
Received: 18 January 2022; Accepted: 03 May 2022;
Published: 14 June 2022.
Edited by:
Thamil Selvee Ramasamy, University of Malaya, MalaysiaReviewed by:
Min Zhang, Huazhong Agricultural University, ChinaCopyright © 2022 Liu, Tang, Li, Lin, Yang, Ma, Hui, Ma, Qin, Lei and Yang. This is an open-access article distributed under the terms of the Creative Commons Attribution License (CC BY). The use, distribution or reproduction in other forums is permitted, provided the original author(s) and the copyright owner(s) are credited and that the original publication in this journal is cited, in accordance with accepted academic practice. No use, distribution or reproduction is permitted which does not comply with these terms.
*Correspondence: Yanhui Yang, eXloeXNmQDE2My5jb20=; Hetian Lei, bGVpaGV0aWFuQGhvdG1haWwuY29t
Disclaimer: All claims expressed in this article are solely those of the authors and do not necessarily represent those of their affiliated organizations, or those of the publisher, the editors and the reviewers. Any product that may be evaluated in this article or claim that may be made by its manufacturer is not guaranteed or endorsed by the publisher.
Research integrity at Frontiers
Learn more about the work of our research integrity team to safeguard the quality of each article we publish.