 Yanhao Huo
 Xianbin Li
 Peng Xu
 Zhenshen Bao
 Wenbin Liu
95% of researchers rate our articles as excellent or good
Learn more about the work of our research integrity team to safeguard the quality of each article we publish.
Find out more
ORIGINAL RESEARCH article
Front. Genet. , 15 February 2022
Sec. Computational Genomics
Volume 13 - 2022 | https://doi.org/10.3389/fgene.2022.856075
This article is part of the Research Topic Machine Learning Techniques on Gene Function Prediction Volume II View all 25 articles
Breast cancer is a heterogeneous disease, and its development is closely associated with the underlying molecular regulatory network. In this paper, we propose a new way to measure the regulation strength between genes based on their expression values, and construct the dysregulated networks (DNs) for the four subtypes of breast cancer. Our results show that the key dysregulated networks (KDNs) are significantly enriched in critical breast cancer-related pathways and driver genes; closely related to drug targets; and have significant differences in survival analysis. Moreover, the key dysregulated genes could serve as potential driver genes, drug targets, and prognostic markers for each breast cancer subtype. Therefore, the KDN is expected to be an effective and novel way to understand the mechanisms of breast cancer.
According to global cancer statistics in 2020, Breast cancer has become the most common cancer, with 2.3 million new cases (Sung et al., 2021). As a heterogenetic malignancy, breast cancer can be classified into four subtypes: Luminal A, Luminal B, Basal-like, and Her2-enriched (Cheang et al., 2009; Inic et al., 2014). Although significant improvements have been achieved, a better understanding of genetic changes will lead to better diagnosis and treatment of this disease (Liang et al., 2021).
The genetic variation of driver genes has been considered as one of cancer’s most critical intrinsic factors (Akhavan-Safar et al., 2021). Thus, many computational tools have been developed to identify potential driver genes. For example, MaxDriver developed by Chen et al. detect driver genes based on the maximum information flow in the heterogeneous network (Chen et al., 2013). DawnRank can directly prioritize the driver genes at the individual patient level (Hou and Jian, 2014). And Shi et al. proposed a network diffusion method to identify driver genes (Shi et al., 2016). Among these tools, DriverNet is probably the most competitive tool which considers both gene mutation and abnormal expressions of downstream genes (Bashashati et al., 2012).
Differentially expressed genes (DEGs) analysis is used to identify potential biomarkers or prognostic markers for breast cancer (Yang et al., 2019). Based on DEGs and the survival analysis of hub genes in protein-protein interaction network (PPI), Wu et al. identified that ESR1 and PGR may be potential prognostic markers of ER-positive breast cancer (Wu et al., 2020). Huan et al. found that estradiol (E2) is a biomarker of breast cancer based on the analysis of DEGs in the PPI network (Huan et al., 2014). Furthermore, Eskandari et al. constructed a gene regulatory network by common DEGs to identify the key therapeutic targets for each subtype of breast cancer (Eskandari and Motalebzadeh, 2019).
In summary, previous works have started from the single and independent abnormal expression of genes, but ignored the importance of changes in the interactions between genes. Actually, cancer occurs because of abnormal interactions between genes that lead to their abnormal expressions (Peng et al., 2012; Gao et al., 2013; Bao et al., 2016; Bao et al., 2020; Chai et al., 2022). In this paper, we propose a new way to measure the regulation strength between genes based on their relative expression values. Then the dysregulated network (DN) can be determined by the dysregulated interactions between normal and disease samples. Results show that not only is the key dysregulated network (KDN) enriched in many potential breast cancer related-pathways and important driver genes, but is also closely related to drug targets. Therefore, the proposed KDN provides a new tool for elucidating the underlying mechanism and potential drug repurposing for breast cancer.
Both the gene expression dataset and genomic aberration dataset are downloaded from https://xenabrowser.net/datapages/. Gene expression dataset includes Luminal A, Luminal B, Basal-like, and HER2-enriched subtypes. Genomic aberration dataset includes gene-level copy number alteration and somatic mutation (SNP and INDEL). The somatic mutation dataset is a binary matrix containing the gene-level non-silent mutation. The influence network includes directed gene interactions from KEGG, Reactome, Panther, CellMap, and NCI Pathway Interaction Databases (Wu et al., 2010). The 29 targeted drugs are downloaded from https://www.cancer.gov/about-cancer/treatment/drugs/breast (National Cancer Institute), and their corresponding targets are obtained from https://clue.io/repurposing-app. Table 1 presents the details of the datasets and network including the number of genes, the number of samples, and the number of interactions.
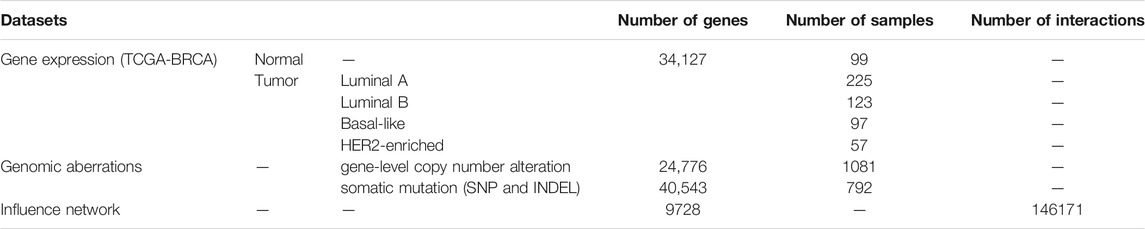
TABLE 1. The details of datasets and network.
From the perspective of gene regulatory network, it is the significantly abnormal interaction between genes that pushes cells operating from normal state to disease state. Therefore, analysis of dysregulation may help to reveal more biological insights than traditional differentially expressed genes (DEGs). Our motivation is that an upstream gene will have more influence on its downstream genes if the expression of the former is larger than that of the latter, and vice versa. Therefore, we define the regulation strength of gene
where
Then, the average absolute difference of the dysregulated strength
where
where
Figure 1 shows an overview of the analysis workflow for this study. First, we construct the DN based on gene expression data and influence network. Then, we identify the KDN of each subtype. Finally, we conduct pathway enrichment analysis, driver genes analysis, drug targets enrichment analysis, and survival analysis for the obtained KDN.
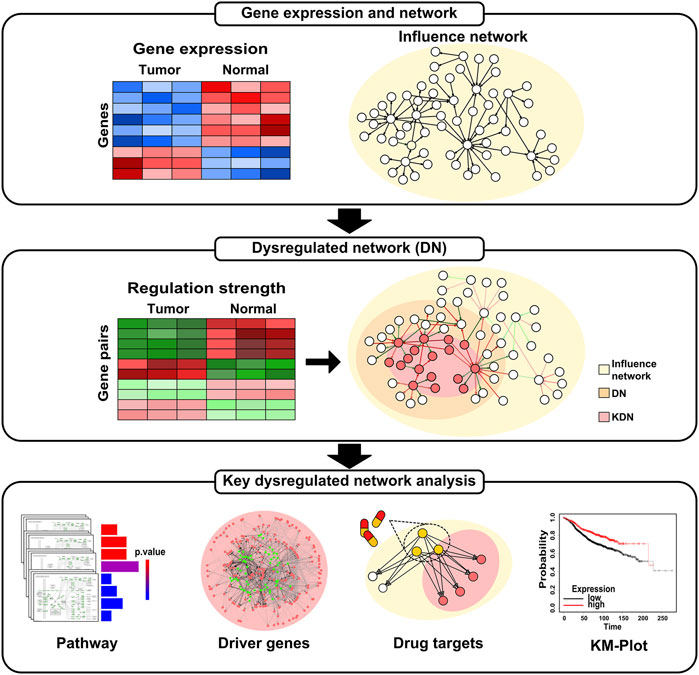
FIGURE 1. Overview of the analysis workflow.
Driver genes can be manifested through the outlying expression of genes in influence network. So, Bashashati et al. (Bashashati et al., 2012) developed a computational framework called DriverNet to identify the potential driver genes effectively. In DriverNet, a bipartite graph is constructed through genomic aberrations matrix, outlier matrix, and influence network. And, based on the bipartite graph, DriverNet could rank the genes according to the number of events (outliers). Then, a set of potential driver genes is obtained.
For each subtype, the dysregulated interactions are determined with
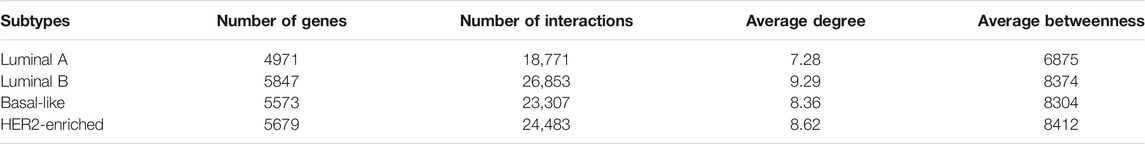
TABLE 2. Overview of the DNs.
Figure 2A shows the heatmap of the dysregulated interactions in the four breast cancer subtypes. The interactions are ordered according to their observed frequency in subtypes. We color the interaction red when the disease state has a higher average regulation strength of interactions, and green otherwise. Black at the bottom represents that the interactions are not significantly dysregulated in the corresponding subtype. About 50% of the dysregulated interactions are shared by the four subtypes, and the overlapped interactions have the same dysregulation pattern. The abnormal regulation in these gene pairs may form the common mechanisms of the four subtypes. On the other hand, about 10% of the dysregulated interactions appear in only one subtype which may characterize the different phenotypes of the four subtypes at network level. Therefore, the corresponding DN may contribute to the development of the four subtypes of breast cancer.
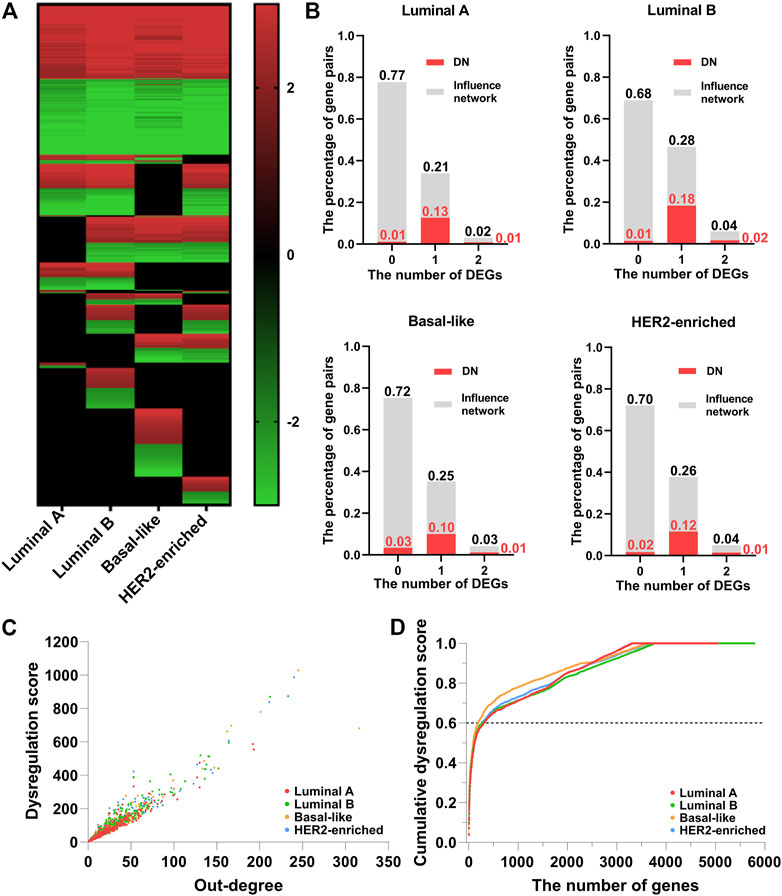
FIGURE 2. The dysregulated network (DN) of breast cancer. (A) The heatmap of the dysregulated interactions in the four breast cancer subtypes. (B) The percentage of interactions with 0, 1, and 2 DEGs (gray color) and dysregulated interactions (red color) in the background influence network. (C) The scatter plot of the dysregulation score and out-degree of genes in the DN. (D) The relationship between the cumulative dysregulation score and the number of genes in the DN.
As the regulation strength measures the dysregulated interactions, it is natural to ask if the dysregulated interactions are essentially caused by differentially expressed genes (DEGs). To examine the impact of DEGs (
Figure 2C shows the scatter plot of the dysregulation score
To investigate the biological functions of the KDN, we conduct a pathway enrichment analysis on key dysregulated genes with
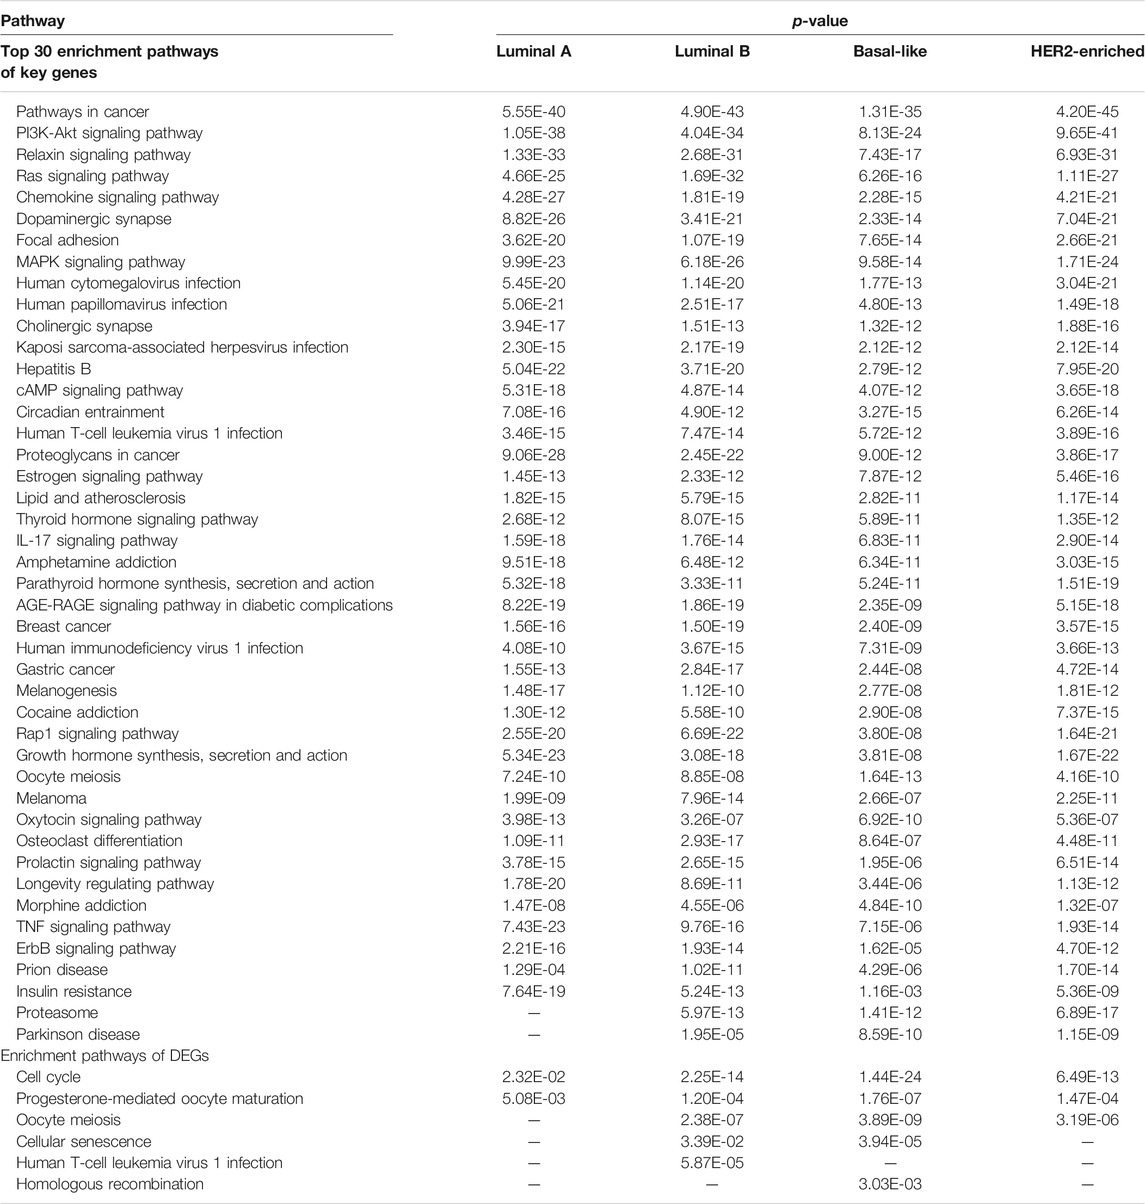
TABLE 3. Top 30 enrichment pathways of key genes and enrichment pathways of DEGs.
Furthermore, we take an enrichment analysis of the top 20 genes in the KDN. Figure 3 shows the relation of the top 20 key genes and their enriched pathways by
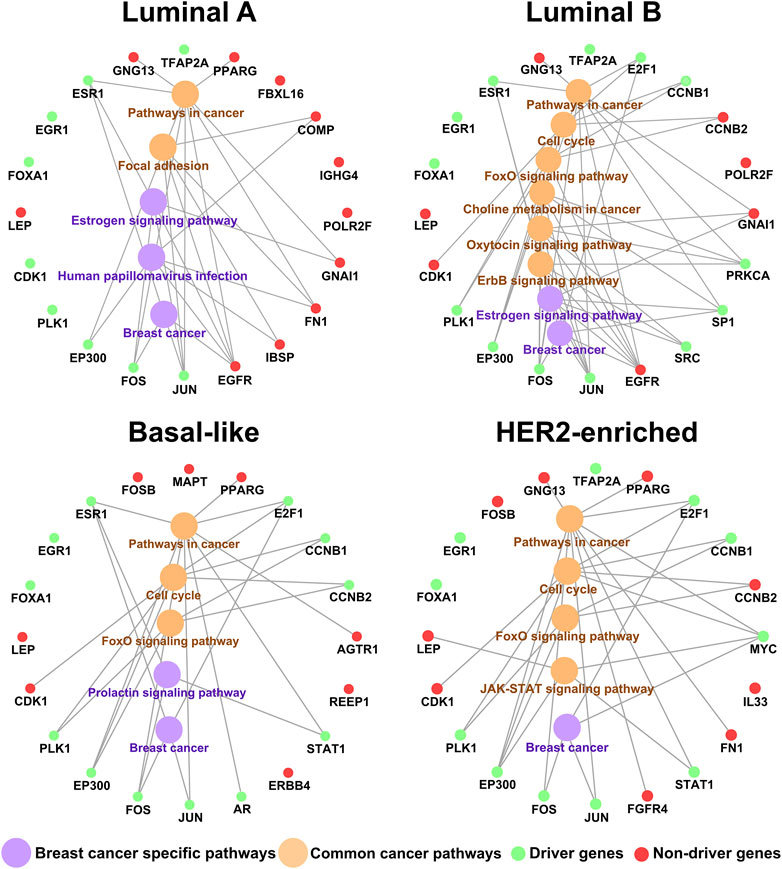
FIGURE 3. The relation of the top 20 key genes and their enriched pathways.
Based on the biological functions, the driver genes (Bashashati et al., 2012) in common top 20 key genes are highly associated with breast cancer subtypes. As shown in Figure 3, EGR1, EP300, FOS, JUN, FOXA1, PLK1, ESR1, and E2F1 are the driver genes for corresponding subtype. As a tumor-suppressor gene in breast cancer, overexpression of EGR1 in breast tumor cells markedly reduces transformed growth and tumorigenicity (Huang et al., 1997; Ronski et al., 2010). EP300 is recruited by the estrogen receptor alpha, a hormone inducible transcription factor, to mediate the mitogen effect of the ovarian steroid estrogen, which is a strong risk factor for breast cancer development (Wirtenberger et al., 2006). The FOS family is one of the AP-1 transcription factors, which regulated many proteins involved in breast cancer invasion (Milde-Langosch et al., 2004). Activated JUN is predominantly expressed at the invasive front in breast cancer and is associated with proliferation and angiogenesis (Vleugel et al., 2006). FOXA1 can influence the expression of a large number of genes in breast cancer associated with metabolic processes, regulation of signaling, and the cell cycle (Wolf et al., 2005). PLK1 mediates estrogen receptor (ER)-regulated gene transcription in human breast cancer cells. And PLK1-coactivated genes include classical ER target genes such as Ps2, Wisp2, and Serpina3 and are enriched in developmental and tumor-suppressive functions (Wierer et al., 2013). ESR1 encodes estrogen receptor-α, which is a major biomarker in the development of breast cancer (Yang et al., 2021). E2F1 expression is regulated by the estrogen receptor α (ERα) to mediate tamoxifen resistance in ERα-positive breast cancer cells (Montenegro and Cancer, 2014). And E2F1 can drive the metastasis of breast cancer (Hollern et al., 2019).
At the genomic level, driver genes are considered to be one of the most important factors in cancer initiation and progression. The driven mutations in the genome provoke abnormal function at protein level and impact the expression of the downstream genes. Therefore, driver genes, as an intrinsic driven regulation mechanism, should also play a critical role in the obtained DN. We apply DriverNet to identify driver genes, and it identifies 205, 154, 249, and 147 driver genes for Luminal A, Luminal B, Basal-like, and HER2-enriched subtypes respectively. We find that about 90% of the determined driver genes are observed in the dysregulation network.
As the key genes in DN constitute most of the dysregulation consequences, we are interested in the driver genes in the KDN. Figure 4A shows the Venn diagrams of the key genes and the identified driver genes in the four subtypes. In the KDN, about 20–30% of the genes are driver genes. That is, the KDN is enriched with a larger portion of driver genes. Furthermore, Figure 4B shows the driver genes’ average number of events as defined by DriverNet (Bashashati et al., 2012), whether they are in the KDN or not. The former’s average number of events is obviously higher than that of the latter, which demonstrates that key driver genes explain more abnormal expressed genes in the patient group than the latter.
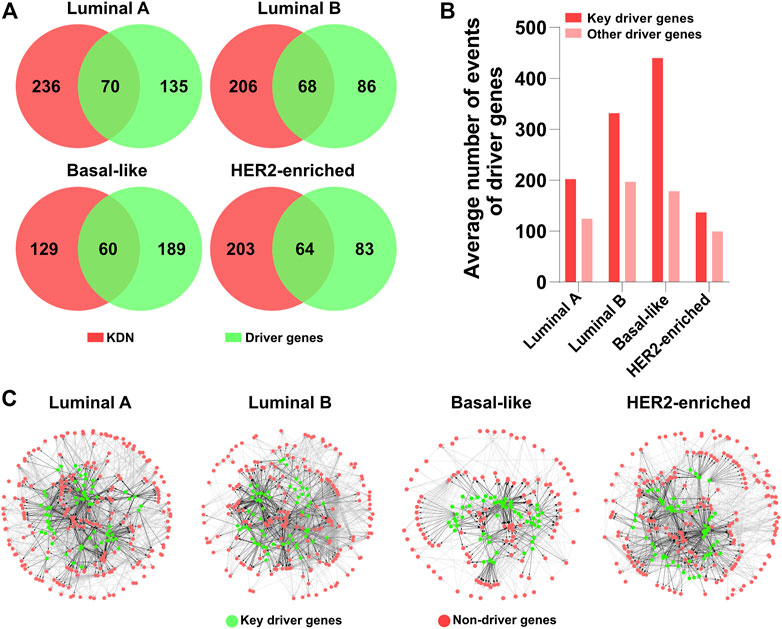
FIGURE 4. Driver gene analysis. (A) Venn diagrams of the key genes and driver genes. (B) The average number of events of key driver genes and other driver genes. (C) KDN with driver genes in green color.
In Figure 4C, green and red denote whether they are driver genes; black and gray denote whether the interactions originate from driver genes. The KDNs are highly connected in the central part which include some driver genes and their downstream genes, while the peripheral part is relatively sparsely connected which includes only non-driver genes. Therefore, we may hypothesize that these driver genes in the central part constitute the core tumorigenesis genes. Their mutations are the major causal factors to the corresponding subtypes. These driver genes first exert their abnormal effects on their direct downstream genes. And the downstream genes propagate the abnormal signals to other peripheral genes. Finally, the interactions between genes in the KDN contribute to the initiation and development of different breast cancer subtypes.
From the perspective of the targeted therapy, the targets of drugs for breast cancer should be closely related to the KDN. Figure 5A shows the Venn graph of the targets of 29 breast cancer targeted drugs and the key genes. Only a few targets, such as ESR1, ESR2, EGFR, ERBB2, etc. are observed in the KDN. Table 4 lists these targets which are targeted by 10 drugs. As most drugs’ number of targets ranges between 2 and 3, we use their first order neighboring genes to determine the enrichment score. The enrichment score is defined as the negative logarithm of the p-value of the hypergeometric test. Figure 5B shows the enrichment scores of the 29 drugs. Drugs solely for breast cancer are on the left, while those that can also treat other cancers are on the right. Obviously, most of the drugs are significantly enriched in the DN. In each DN, these enrichment scores are greater than 2. This demonstrates that the targets of these 29 drugs are closely related to the KDN.
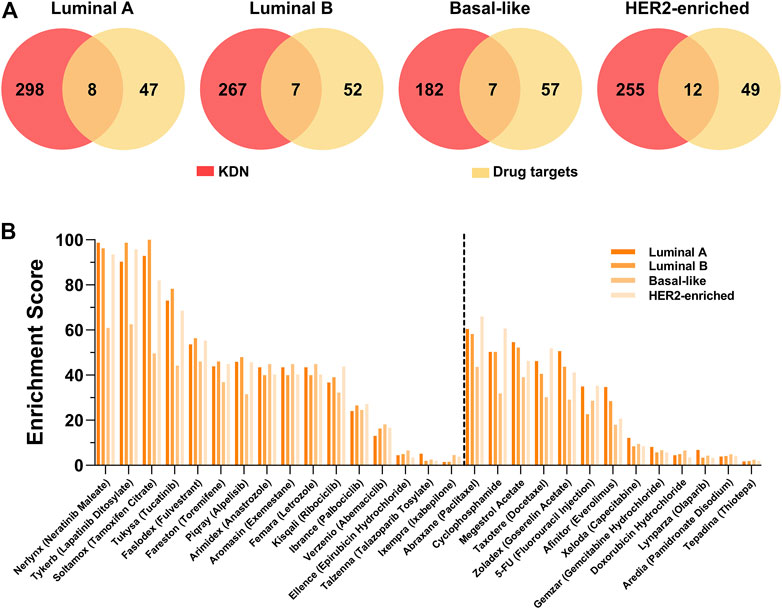
FIGURE 5. Drug target analysis. (A) The Venn graph of the targets of 29 breast cancer drugs and genes in the KDN. (B) The enrichment scores of 29 breast cancer targeted drugs.

TABLE 4. The drug targets in key genes.
To take a further look at the neighbors of targets not observed in the KDN, we find that some neighbors are the targets of other drugs in the KDN. For example, ESR1 and ESR2, targets of Soltamox (Tamoxifen Citrate) and Faslodex (Fulvestrant), are both neighbors of the other six drug targets, such as Nerlynx (Neratinib Maleate), Tykerb (Lapatinib Ditosylate), Abraxane (Paclitaxel), Cyclophosphamide, Megestrol Acetate, and Taxotere (Docetaxel). ESR1 is also a neighbor of CYP19A, which is the target of Arimidex (Anastrozole), Aromasin (Exemestane), and Femara (Letrozole). That is, most drug targets, even if not observed in the KDN, are closely associated with it. Thus, we may hypothesize that the KDN may serve as a critical level point for drugs to exert their effect and to intervene in the abnormal state of the cellular system.
We apply KM-plotter to conduct the survival analysis of the top 10 dysregulated genes (http://kmplot.com/analysis/index.php?p=service&cancer=breast). For Luminal A, Luminal B, Basal-like, and HER2-enriched subtypes, 2277, 465, 846, and 315 samples are used respectively. Figure 6 shows the results of the survival analysis with the smallest log-rank p-value of gene for each subtype. All p-values are less than 0.05. This indicates that these dysregulated genes can be used as potential prognostic markers of breast cancer subtypes.
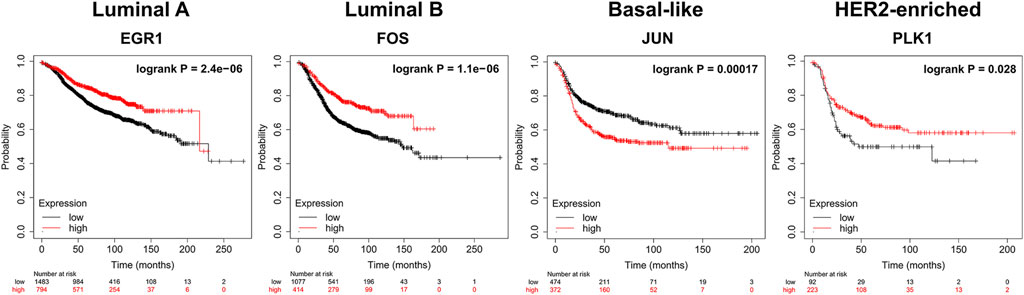
FIGURE 6. Survival analysis (Kaplan-Meier plots) of dysregulated biomarkers. biomarkers High values are shown in red and low values are shown in black.
From the perspective of biological networks, cancer is a result of the abnormal interactions between genes. In this paper, we propose a simple way to measure the regulation strength of genes based on their relative expression values. And then we construct the key dysregulated network (KDN) for the four subtypes of breast cancer. Our results show that the KDN is significantly enriched in critical breast cancer-related pathways as well as driver genes; closely associated with drug targets; and have significant differences in survival analysis. The key dysregulated genes can also serve as potential driver genes, drug targets, and prognostic markers for subtype identification. In addition, our results indicate that the key dysregulation analysis is more powerful than the traditional DEG analysis. Therefore, the KDN can be applied to other cancer studies, such as the identification of driver genes, drug repurposing, and so on.
The original contributions presented in the study are included in the article/Supplementary Material, further inquiries can be directed to the corresponding authors.
YH and WL designed the project. YH and ZB drafted codes and conducted primary Computations. YH, XL, PX, ZB, and WL analyzed data. YH, ZB, and WL interpreted results. YH, XL, PX, ZB, and WL wrote manuscript. All authors approved the final manuscript.
This work was supported by the National Natural Science Foundation of China (Grant Nos. 62072128, 62002079, and 62102104).
The authors declare that the research was conducted in the absence of any commercial or financial relationships that could be construed as a potential conflict of interest.
All claims expressed in this article are solely those of the authors and do not necessarily represent those of their affiliated organizations, or those of the publisher, the editors and the reviewers. Any product that may be evaluated in this article, or claim that may be made by its manufacturer, is not guaranteed or endorsed by the publisher.
We sincerely thank numerous students and teachers at Guangzhou University for their kind consultations on clinical cases of multiple types of cancer under study.
Akhavan-Safar, M., Teimourpour, B., and Kargari, M. (2021). GenHITS: A Network Science Approach to Driver Gene Detection in Human Regulatory Network Using Gene's Influence Evaluation. J. Biomed. Inform. 114, 103661. doi:10.1016/j.jbi.2020.103661
Aline, A. C., Pierre, H., Gérard, C., and Amar, B. J. F. I. P. (2015). Role of ErbB Receptors in Cancer Cell Migration and Invasion, Front. Pharmacol., 6. 283. doi:10.3389/fphar.2015.00283
Bao, Z., Li, X., Zan, X., Shen, L., Ma, R., and Liu, W. (2016). Signalling Pathway Impact Analysis Based on the Strength of Interaction between Genes. IET Syst. Biol. 10, 147–152. doi:10.1049/iet-syb.2015.0089
Bao, Z., Zhu, Y., Ge, Q., Gu, W., and Bai, Y. J. I. A. (2020). Signaling Pathway Analysis Combined with the Strength Variations of Interactions between Genes under Different Conditions, 1.
Bashashati, A., Haffari, G., Ding, J., Ha, G., Lui, K., Rosner, J., et al. (2012). DriverNet: Uncovering the Impact of Somatic Driver Mutations on Transcriptional Networks in Cancer. Genome Biol. 13, R124. doi:10.1186/gb-2012-13-12-r124
Cassoni, P., Sapino, A., Negro, F., and Bussolati, G. (1994). Oxytocin Inhibits Proliferation of Human Breast Cancer Cell Lines. Virchows Arch. 425, 467–472. doi:10.1007/BF00197549
Chai, C., Wu, H. H., Abuetabh, Y., Sergi, C., and Leng, R. (2022). Regulation of the Tumor Suppressor PTEN in Triple-Negative Breast Cancer. Cancer Lett. 527, 41–48. doi:10.1016/j.canlet.2021.12.003
Cheang, M. C. U., Chia, S. K., Voduc, D., Gao, D., Leung, S., Snider, J., et al. (2009). Ki67 index, HER2 Status, and Prognosis of Patients with Luminal B Breast Cancer. J. Natl. Cancer Inst. 101, 736–750. doi:10.1093/jnci/djp082
Chen, Y., Hao, J., Jiang, W., He, T., Zhang, X., Jiang, T., et al. (2013). Identifying Potential Cancer Driver Genes by Genomic Data Integration. Sci. Rep. 3, 3538. doi:10.1038/srep03538
Eskandari, E., and Motalebzadeh, J. J. C. G. (2019). Transcriptomics-based Screening of Molecular Signatures Associated with Patients Overall Survival and Their Key Regulators in Subtypes of Breast Cancer, 239.
Gao, Y.-m., Xu, P., Wang, X.-h., and Liu, W.-b. (2013). The Complex Fluctuations of Probabilistic Boolean Networks. Biosystems 114, 78–84. doi:10.1016/j.biosystems.2013.07.008
Gari, H. H., Degala, G. D., Ray, R., Lucia, M. S., and Lambert, J. R. (2016). PRL-3 Engages the Focal Adhesion Pathway in Triple-Negative Breast Cancer Cells to Alter Actin Structure and Substrate Adhesion Properties Critical for Cell Migration and Invasion. Cancer Lett. 380, 505–512. doi:10.1016/j.canlet.2016.07.017
Gong, J., Lu, X., Xu, J., Xiong, W., Zhang, H., and Yu, X. J. J. O. C. P. (2019). Coexpression of UCA1 and ITGA2 in Pancreatic Cancer Cells Target the Expression of miR‐107 through Focal Adhesion Pathway, 234.
Gong, L., Tang, H., Luo, Z., Sun, X., Tan, X., Xie, L., et al. (2020). Tamoxifen Induces Fatty Liver Disease in Breast Cancer through the MAPK8/FoxO Pathway. Clin. Translational Med. 10, 137–150. doi:10.1002/ctm2.5
Gu, C., Wang, X., Long, T., Wang, X., Zhong, Y., Ma, Y., et al. (2018). FSTL1 Interacts with VIM and Promotes Colorectal Cancer Metastasis via Activating the Focal Adhesion Signalling Pathway. Cell Death Dis 9, 654. doi:10.1038/s41419-018-0695-6
Hernández-Vargas, H., Ouzounova, M., Calvez-Kelm, F. L., Lambert, M. P., Mckay-Chopin, S., Tavtigian, S. V., et al. (2011). Methylome Analysis Reveals Jak-STAT Pathway Deregulation in Putative Breast Cancer Stem Cells. Epigenetics 6, 428–439. doi:10.4161/epi.6.4.14515
Hollern, D. P., Swiatnicki, M. R., Rennhack, J. P., Misek, S. A., and Andrechek, E. R. (2019). E2F1 Drives Breast Cancer Metastasis by Regulating the Target Gene FGF13 and Altering Cell Migration. Sci. Rep. 9, 10718. doi:10.1038/s41598-019-47218-0
Hou, J. P., and Jian, M. J. G. M. (2014). DawnRank: Discovering Personalized Driver Genes in Cancer. Genome Medicine. 6, 56.doi:10.1186/s13073-014-0056-8
Huan, J., Wang, L., Xing, L., Qin, X., Feng, L., Pan, X., et al. (2014). Insights into Significant Pathways and Gene Interaction Networks Underlying Breast Cancer Cell Line MCF-7 Treated with 17β-Estradiol (E2). Gene 533, 346–355. doi:10.1016/j.gene.2013.08.027
Huang, R.-P., Fan, Y., De Belle, I., Niemeyer, C., Gottardis, M. M., Mercola, D., et al. (1997). Decreased Egr-1 Expression in Human, Mouse and Rat Mammary Cells and Tissues Correlates with Tumor Formation. Int. J. Cancer 72, 102–109. doi:10.1002/(sici)1097-0215(19970703)72:1<102:aid-ijc15>3.0.co;2-l
Inic, Z., Zegarac, M., Inic, M., Kozomara, Z., Djurisic, I., Inic, I., et al. (2014). Difference between Luminal A and Luminal B Subtypes According to Ki-67, Tumor Size, and Progesterone Receptor Negativity Providing Prognostic Information. Clin. Med. Insights Oncol. 8, 107–111. doi:10.4137/CMO.S18006
Liang, Y., Ye, F., Wang, Y., Li, Y., Li, Y., Song, X., et al. (2021). DGUOK-AS1 Acts as a Tumor Promoter through Regulating miR-204-5p/IL-11 axis in Breast Cancer. Mol. Ther. - Nucleic Acids 26, 1079–1091. doi:10.1016/j.omtn.2021.10.018
Liu, N., Zhang, J., Zhang, J., Liu, S., Liu, Y., and Zheng, D. (2008). Erbin-regulated Sensitivity of MCF-7 Breast Cancer Cells to TRAIL via ErbB2/AKT/NF-kappaB Pathway. J. Biochem. 143, 793–801. doi:10.1093/jb/mvn032
Milde-Langosch, K., Röder, H., Andritzky, B., Aslan, B., Hemminger, G., Brinkmann, A., et al. (2004). The Role of the AP-1 Transcription Factors C-Fos, FosB, Fra-1 and Fra-2 in the Invasion Process of Mammary Carcinomas. Breast Cancer Res. Treat. 86, 139–152. doi:10.1023/b:brea.0000032982.49024.71
Mohd, F., Wang, H., Uma, G., Little, P. J., Xu, J., and Zheng, W. J. I. J. O. B. S. (2017). FOXO Signaling Pathways as Therapeutic Targets in Cancer. Int. J. Biol. Sci. 13, 815–827.
Montenegro, M. F., and Cancer, M. C.-G. J. B. (2014). Promoting E2F1-Mediated Apoptosis in Oestrogen Receptor-α-Negative Breast Cancer Cells. BMC Cancer 14, 539. doi:10.1186/1471-2407-14-539
Na, L., and Balko, J. M. (2019). Role of JAK-STAT Pathway in Cancer Signaling: Applications in Precision Medicine. doi:10.1007/978-3-319-95228-4_26
Ocak, S., Yamashita, H., Udyavar, A. R., Miller, A. N., Gonzalez, A. L., Zou, Y., et al. (2010). DNA Copy Number Aberrations in Small-Cell Lung Cancer Reveal Activation of the Focal Adhesion Pathway. Oncogene 29, 6331–6342. doi:10.1038/onc.2010.362
Peng, X., Wang, X., and Liu, W. 2012). "The Influence of the basin Structure of Boolean Networks on Their Long Range Correlated Dynamics", in: IEEE International Conference on Systems Biology.
Pequeux, C. (2002). Membrane Conformation and Transduction Pathway of Oxytocin and Vasopressin in Small Cell Lung Cancer.
Ronski, K., Sanders, M., Burleson, J. A., Moyo, V., Benn, P., and Min, F. J. C. (2010). Early Growth Response Gene 1 (EGR1) Is Deleted in Estrogen Receptor-Negative Human Breast Carcinoma. Cancer 104, 925–930. doi:10.1002/cncr.21262
Sato, T. (2013). Prolactin-Jak-Stat Signaling Pathways in Breast Cancer. Thomas Jefferson University.
Shi, K., Gao, L., and Wang, B. (2016). Discovering Potential Cancer Driver Genes by an Integrated Network-Based Approach. Mol. Biosyst. 12, 2921–2931. doi:10.1039/c6mb00274a
Shin-Ichi, H., Niwa, T., and Yamaguchi, Y. J. C. S. (2010). Estrogen Signaling Pathway and its Imaging in Human Breast Cancer. 100, 1773–1778.
Song, R. X.-D., and Santen, R. J. (2006). Membrane Initiated Estrogen Signaling in Breast Cancer1. 75, 9–16.doi:10.1095/biolreprod.105.050070
Sung, H., Ferlay, J., Siegel, R. L., Laversanne, M., Soerjomataram, I., Jemal, A., et al. (2021). Global Cancer Statistics 2020: GLOBOCAN Estimates of Incidence and Mortality Worldwide for 36 Cancers in 185 Countries. CA A. Cancer J. Clin. 71, 209–249. doi:10.3322/caac.21660
Tworoger, S., and Hankinson, S. (2006). Prolactin and Breast Cancer Risk. Cancer Lett. 243, 160–169. doi:10.1016/j.canlet.2006.01.032
Tworoger, S. S., Eliassen, A. H., Zhang, X., Qian, J., Sluss, P. M., Rosner, B. A., et al. (2013). A 20-year Prospective Study of Plasma Prolactin as a Risk Marker of Breast Cancer Development. Cancer Res. 73, 4810–4819. doi:10.1158/0008-5472.can-13-0665
Vleugel, M. M., Greijer, A. E., Bos, R., van der Wall, E., and van Diest, P. J. (2006). c-Jun Activation Is Associated with Proliferation and Angiogenesis in Invasive Breast Cancer. Hum. Pathol. 37, 668–674. doi:10.1016/j.humpath.2006.01.022
Wang, C. J., Gao, H. D., and Wang, L. Y. J. C. J. O. P. S. (2009). Clinical Research of High Risk Human Papillomavirus Infection in Breast Cancer.
Wang, S., Yao, Y., Yao, M., Fu, P., Wang, W., and Communications, B. R. (2018). Interleukin-22 Promotes Triple Negative Breast Cancer Cells Migration and Paclitaxel Resistance through JAK-STAT3/MAPKs/AKT Signaling Pathways. Biochem. Biophysical Res. Commun. 503, 1605–1609. doi:10.1016/j.bbrc.2018.07.088
Wang, Y., Jiang, X.-Y., and Yu, X.-Y. (2020). BRD9 Controls the Oxytocin Signaling Pathway in Gastric Cancer via CANA2D4, CALML6, GNAO1, and KCNJ5. Transl Cancer Res. TCR 9, 3354–3366. doi:10.21037/tcr.2020.03.67
Wierer, M., Verde, G., Pisano, P., Molina, H., Font-Mateu, J., Di croce, L., et al. (2013). PLK1 Signaling in Breast Cancer Cells Cooperates with Estrogen Receptor-dependent Gene Transcription. Cell Rep 3, 2021–2032. doi:10.1016/j.celrep.2013.05.024
Wirtenberger, M., Tchatchou, S., Hemminki, K., Schmutzhard, J., Sutter, C., Schmutzler, R. K., et al. (2006). Associations of Genetic Variants in the Estrogen Receptor Coactivators PPARGC1A, PPARGC1B and EP300 with Familial Breast Cancer. Carcinogenesis 27, 2201–2208. doi:10.1093/carcin/bgl067
Wolf, I., Bose, S., Williamson, E., Miller, C. W., and Koeffler, H. P. J. C. R. (2005). FOXA1 Expression and Activities in Breast Cancer, 65.
Wu, G., Feng, X., and Stein, L. (2010). A Human Functional Protein Interaction Network and its Application to Cancer Data Analysis. Genome Biol. 11, R53–R23. doi:10.1186/gb-2010-11-5-r53
Wu, J.-R., Zhao, Y., Zhou, X.-P., and Qin, X. (2020). Estrogen Receptor 1 and Progesterone Receptor Are Distinct Biomarkers and Prognostic Factors in Estrogen Receptor-Positive Breast Cancer: Evidence from a Bioinformatic Analysis. Biomed. Pharmacother. 121, 109647. doi:10.1016/j.biopha.2019.109647
Yang, K., Gao, J., and Luo, M. (2019). Identification of Key Pathways and Hub Genes in Basal-like Breast Cancer Using Bioinformatics Analysis. Ott 12, 1319–1331. doi:10.2147/ott.s158619
Keywords: breast cancer, dysregulated network, cancer-related pathways, driver genes, drug targets, survival analysis
Citation: Huo Y, Li X, Xu P, Bao Z and Liu W (2022) Analysis of Breast Cancer Based on the Dysregulated Network. Front. Genet. 13:856075. doi: 10.3389/fgene.2022.856075
Received: 16 January 2022; Accepted: 28 January 2022;
Published: 15 February 2022.
Edited by:
Quan Zou, University of Electronic Science and Technology of China, ChinaReviewed by:
Cheng Zhang, Peking University, ChinaCopyright © 2022 Huo, Li, Xu, Bao and Liu. This is an open-access article distributed under the terms of the Creative Commons Attribution License (CC BY). The use, distribution or reproduction in other forums is permitted, provided the original author(s) and the copyright owner(s) are credited and that the original publication in this journal is cited, in accordance with accepted academic practice. No use, distribution or reproduction is permitted which does not comply with these terms.
*Correspondence: Wenbin Liu, d2JsaXU2OTEwQGd6aHUuZWR1LmNu; Zhenshen Bao, YnpzYmFvQDE2My5jb20=
Disclaimer: All claims expressed in this article are solely those of the authors and do not necessarily represent those of their affiliated organizations, or those of the publisher, the editors and the reviewers. Any product that may be evaluated in this article or claim that may be made by its manufacturer is not guaranteed or endorsed by the publisher.
Research integrity at Frontiers
Learn more about the work of our research integrity team to safeguard the quality of each article we publish.