
94% of researchers rate our articles as excellent or good
Learn more about the work of our research integrity team to safeguard the quality of each article we publish.
Find out more
ORIGINAL RESEARCH article
Front. Genet. , 29 April 2022
Sec. RNA
Volume 13 - 2022 | https://doi.org/10.3389/fgene.2022.854211
This article is part of the Research Topic 10 Years of Frontiers in Genetics: past discoveries, current challenges and future perspectives View all 31 articles
Background: This study aimed to confirm the role of enhancer RNAs (eRNAs) in gastric cancer and their clinical utility.
Methods: We used Cox survival and relevance analysis to identify the candidate eRNAs in gastric cancer and performed Gene Ontology and Reactome pathway enrichment to determine the potential functions of eRNAs. Correlation between eRNA, tumor-infiltrating immune cells, and drug sensitivity was then analyzed.
Results: CDK6-AS1, a long non-coding RNA cyclin-dependent kinase 6, may serve as a poor potential prognostic biomarker candidate in gastric cancer with a positive correlation with its target gene CDK6. The low CDK6-AS1 expression group showed more frequent mutated driver genes than the high expression group. Moreover, CDK6-AS1 is involved in a key oncogenic pathway of the cell cycle and RNA transcription. CDK6-AS1 also shows dysregulations and associations with prognosis at the pan-cancer level. This eRNA may also be associated with immune cell infiltration and drug sensitivity.
Conclusion: CDK6-AS1 may be a potential prognostic biomarker and chemotherapeutic drug sensitivity predictor in gastric cancer.
Gastric cancer was the world’s fifth most commonly diagnosed cancer type and the sixth cause of cancer mortality in 2018, responsible for 1,033,701 newly diagnosed cases and 782,685 deaths worldwide (Bray et al., 2018). During the past few decades, gastric cancer has maintained a high case fatality rate of 75% throughout most of the world and is the main contributor to the global disability-adjusted life-year burden (Soerjomataram et al., 2012; Thrift and El-Serag, 2020). Recently, the prognosis of gastric cancer has improved and its treatment technology has significantly improved (The Cancer Genome Atlas Research Network, 2014; Digklia and Wagner, 2016).
The past few decades have witnessed the rapid progress of knowledge about the role noncoding RNAs play in a wide range of cancers (Martens-Uzunova et al., 2014). An increasing number of researchers have paid attention to eRNAs in the mediation of gene transcription (Natoli and Andrau, 2012; Andersson et al., 2014). Enhancer RNAs can independently activate enhancer activity, and cooperate with other transcription-related factors to initiate the formation of the enhancer-promoter loop, thereby activating the expression of downstream genes and pathways (Kaikkonen et al., 2013; Kim and Shiekhattar, 2015). Dysregulation of eRNAs, specifically in the oncogenic signaling pathway, could result in the formation of a wide range of human cancers (Zhang et al., 2019). For instance, Kallikrein-related peptidase 3 eRNA in prostate cancer was found to promote the transcription of the downstream androgen receptor gene and promote cancer cell proliferation (Hsieh et al., 2014). Recent studies have also shown that the dysregulation of some eRNAs could serve as prognostic biomarkers in a range of cancers such as head and neck squamous cell carcinoma and lung and colon adenocarcinoma (Gu et al., 2019; Miracco et al., 2021; Xiao et al., 2021). The predictive factors of gastric cancer have not been fully identified, and the underlying functions associated with the tumor microenvironment (TME) cells and chemosensitivity.
In this study, we aim to identify potential prognostic eRNAs in gastric cancer, specifically focusing on cyclin-dependent kinase 6 (CDK6)-AS1 and its target gene. We performed pathway enrichment analyses to explore the potential function CDK6-AS1 may have on tumorigenesis. Furthermore, we validated CDK6-AS1 expression and the overall survival at a pan-cancer level and analyzed the correlation between eRNA, tumor-infiltrating immune cells, and drug sensitivity.
Information from 33 datasets was downloaded from the University of California, Santa Cruz (UCSC) Xena The Cancer Genome Atlas (TCGA) hub (https://xena.ucsc.edu) (Goldman et al., 2020). The dataset included 407 gastric cancer tissues, 32 normal tissues, and 9951 other tumors from different types of cancers, and the RNA expression matrix was transformed to log2 (FPKM+1). Ensemble transcript IDs were converted to their corresponding GENCODE v19 using the Gene Transfer Format (GTF) annotation files from humans. The enhancer RNAs and target gene information were obtained from the putative literature, which was previously identified by the PreSTIGE method (Corradin et al., 2014).
To avoid bias, patients with a survival time of less than 1 month were excluded. A total of 375 patients passed the quality control and were used in the following analysis as shown in Table 1. The survival-associated eRNAs were screened using the Cox regression model, with age, sex, and tumor stage adjusted as covariates. We set p < 0.05 as the significance cut-off value.
The R package maftools were used to compare the mutant frequencies of significantly mutated genes between CDK6-AS1 as high- and low-expression groups. Mutant types including frame shift, deletion, splice site, frameshift insertion, missense mutation, nonsense mutation, multiple hist, and in-frame deletion were considered in the analysis.
Gene Ontology (GO) functional analysis was performed using the clusterProfiler package in R software, and a Reactome pathway analysis of eRNA-related coding genes was performed based on co-expression analysis. Specifically, the GO analysis revealed the function of the biology process (BP), cell component (CC), and molecular function (MF). To avoid accumulation of type-I errors, enrichment items meeting the false discovery rate (FDR) < 0.05 were considered significant.
The expression data of CDK6-AS1 and its target gene CDK6 were obtained at the pan-cancer level as previously described, and patients were classified into low- and high-expression groups according to the median value of CDK6-AS1 expression. The Cox regression method was used to compare the overall survival difference between the two groups. Covariates of sex, age, and tumor stage were adjusted in the Cox model, and Spearman’s coefficient was applied to the correlation analysis.
Univariate Cox regression analysis and Kaplan-Meier analysis were used to screen 6 genes co-expressed with CDK6-AS1. Gastric cancer patients in the TCGA data set were randomly divided into the training set and internal test set. The aforementioned six genes were used for the LASSOCox regression analysis. By using the cross-verification error curve, the best tuning parameter λ is selected through the minimum 10-fold cross-verification in the training set. Based on these six genes, a risk-scoring model is established. Risk score = 0.2637*CTHRC1 + 0.0132*PFN2 + 0.1384*PRSS35 + 0.0355*RTN4 - 0.072*SMPD3 + 0.5459*SYCP2L.
GC Patients in the internal test set and an external cohort were divided into a high-risk group and a low-risk group by the optimal cut-off value of the risk score. The overall survival (OS) rates between the high-risk and the low-risk groups were analyzed by the Kaplan–Meier OS analysis. A two-sided log-rank p < 0.05 was considered significant. The time-dependent prognostic value of the prognostic signature was evaluated using the R package“survival ROC.” Area under the curve (AUC) values were used to evaluate the time-dependent prognostic values of the prognostic signature. An AUC >0.60 was considered to be acceptable.
To evaluate the relationship between tumor-infiltrating lymphocytes (TIL) and the expression of CDK6-AS1 in gastric cancer, we estimated the expressed fraction of TIL cells using the ssGSEA algorithm by comparing the gastric cancer gene expression matrix with those of the signatures from nine reported TIL cell types (Li et al., 2016). The relationship of the proportion matrix for the nine TIL cells with CDK6-AS1 was calculated by Spearman’s correlation analysis.
The R package pRRophetic (Geeleher et al., 2017), based on the pharmacogenomics database of the Cancer Genome Project (CGP) cell line data and the Cancer Cell Line Encyclopedia (CCLE), was used to predict chemotherapeutic sensitivity for gastric cancer by an estimation of IC50 (the maximal inhibitory concentration). Default settings were used for the prediction model, including “stomach cancer” for reference tissue type and “cvFold = 10” for ridge regression model training.
R software (Version 3.6.2) was used to perform analyses in this study. The statistical results are expressed as mean ± standard deviation (M ± SD), and the data comparison of the two groups was analyzed with the Wilcoxon rank-sum test. A value of p < 0.05 was used to determine the statistical significance.
Twenty-three eRNAs were identified, eight of which met the criteria (Spearman r ≥ 0.3 and FDR < 0.05) and were included (Supplementary Table S1). Of these, CDK6-AS1 exhibited the lowest Cox model p-value and was therefore considered a candidate marker. Patients in the CDK6-AS1 high-expression group had a shorter survival than those in the low-expression group (3-year OS:HR = 1.68, p = 3.84 × 10⁻³; 5-year OS:HR = 1.62, p = 5.64 × 10⁻³, Figures 1A,B). In addition, CDK6-AS1 shows a higher expression in unpaired and paired tumor tissues compared to normal tissues (unpaired: p = 8.00 × 10⁻³, paired: p = 0.046, Figures 1C,D). A positive correlation between CDK6-AS1 and its target gene CDK6 was observed (Spearman r = 0.38, p = 1.68 × 10⁻¹⁴). The connections between the clinical features of gastric cancer patients and the CDK6-AS1 expression were further investigated. It was found that CDK6-AS1 had a higher expression in patients aged <60 years (p = 0.022, Figure 2A). CDK6-AS1 was significantly linked to the clinical stage (III vs. II, p = 0.048, Figure 2C). Other clinical characteristics were not clearly correlated with the CDK6-AS1 expression (p > 0.05, Figures 2B, D–H). As driver gene mutations are crucial to tumor growth, the frequencies of significantly mutated genes were compared between the high- and low-CDK6-AS1 expression groups. It was noted that several classic gastric cancer driver genes were more frequently mutated in the low-CDK6-AS1 expression group than in the high-expression group, such as ARID1A and PIK3CA (Figures 3A,B, Supplementary Table S2).
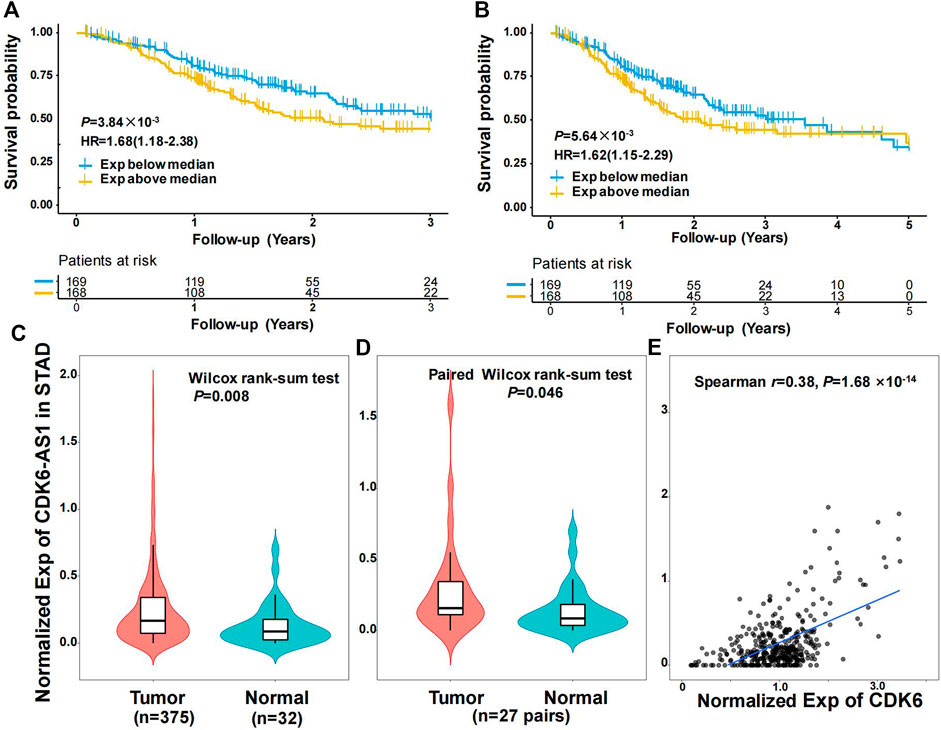
FIGURE 1. Characteristics of eRNA CDK6-AS1 in gastric cancer. (A) Kaplan–Meier 3-year overall survival curve for gastric cancer patients with CDK6-AS1 low and high expression. (B) Kaplan–Meier 5-year overall survival curve for gastric cancer patients with CDK6-AS1 low and high expression. (C) Differential expression of CDK6-AS1 between unpaired tumor and adjacent normal tissues. (D) Differential expression of CDK6-AS1 between paired tumor and adjacent normal tissues. (E) The correlation between the CDK6-AS1 and its target gene, CDK6 expression levels.
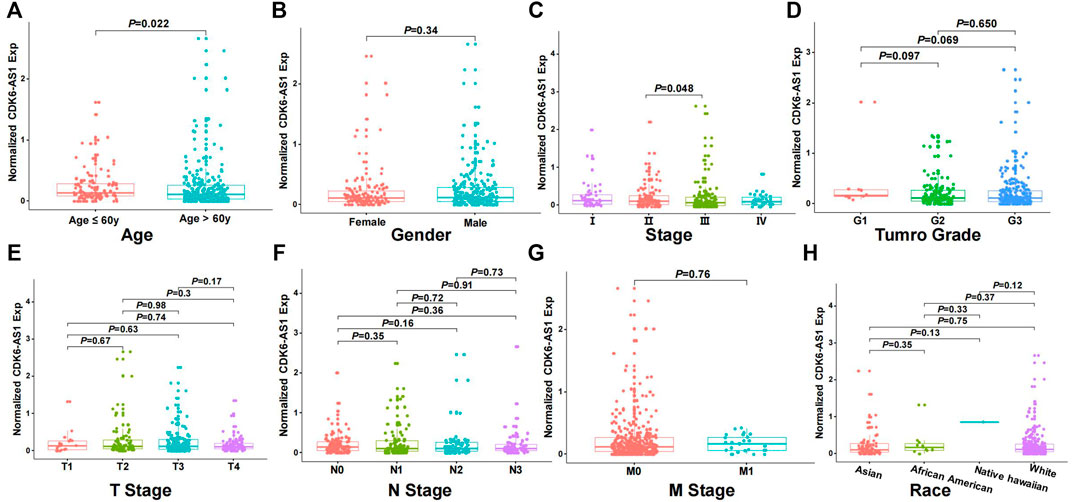
FIGURE 2. The relationship between CDK6-AS1 expression and clinical features. (A–H) The expression of CDK6-AS1 among patients with age ≥60 years and <60 years, male and female, I–IV clinical stages, G 1–3 grades, T 1–4 stages, N 0–3 stages, M 0–1 stages, and different races.
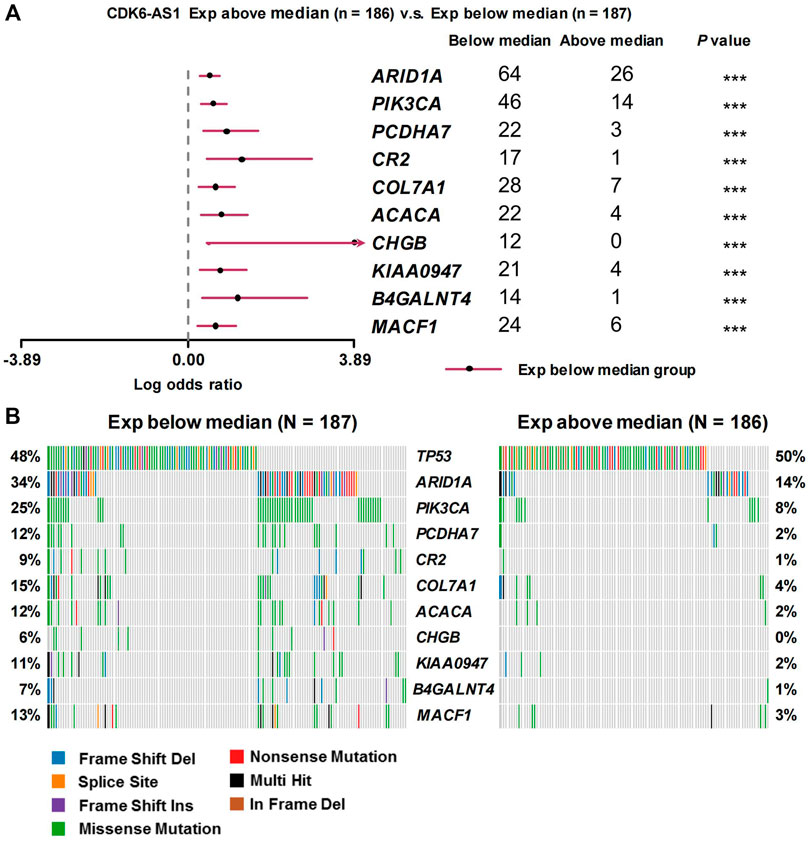
FIGURE 3. Frequencies of mutated genes between different CDK6-AS1 expression group. (A) Forest plot showing the top frequencies of mutated genes in the high- and low-CDK6-AS1 expression groups. (B) Waterfall plot side by side for comparison of different mutated genes and mutated types between the high- and low-CDK6-AS1 expression groups.
To further explore the function and related pathways CDK6-AS1 involved in gastric cancer, a co-expression analysis between CDK6-AS1 and other protein-coding genes in 375 TCGA gastric cancer cases was performed. It was found that 595 transcripts presented a significant correlation with CDK6-AS1 (Spearman r > 0.30 & FDR <0.05). GO and Reactome enrichment analyses were performed. Results from TOP10GO pathways in BP, MF, and CC are shown in Figure 4A, Supplementary Table S3. In BP, the terms were mainly related to RNA transportation. In MF, the terms were related to exoribonuclease activity. In CC, the term is involved in the nuclear chromosomal region. Enrichment from the Reactome pathway database indicated that CDK6-AS1 related co-expressed genes were mainly involved in the cell cycle and mitosis (Figure 4B, Supplementary Table S5), and key signals, in tumor cell proliferation, as shown by Spearman’s correlation (r > 0.3 are showed in Supplementary Table S5). Taken together, CDK6-AS1 and its related genes may be involved in gene transcription and cell cycle processes that are essential for malignant progression.
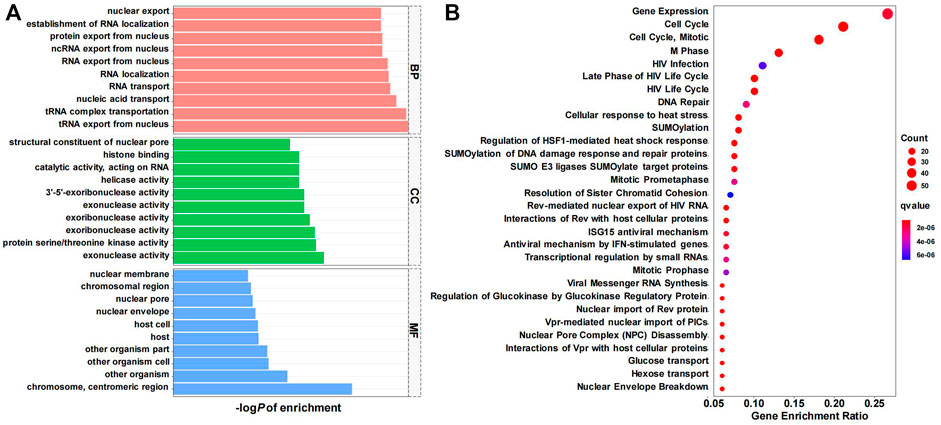
FIGURE 4. Pathway enrichment analysis of CDK6-AS1 co-expressed genes. (A) GO (Gene Ontology) enrichment result in biological process (BP), cellular component (CC), and molecular function (MF) categories. (B) Reactome enrichment result. Top 30 items were shown.
To determine CDK6-AS1 expression, prognosis, and correlation with its target gene at the pan-cancer level, we analyzed 33 tumor cohorts from the TCGA database. CDK6-AS1 displayed higher expression in tumor tissues than in adjacent normal tissues in 16 tumor types: COAD, DLBC, ESCA, GBM, HNSC, KIRP, LAML, LIHC, LUSC, OV, PAAD, PCPG, READ, SARC, THYM, and UCS. Meanwhile, six types showed higher expression in normal tissues than in malignant ones: ACC, BRCA, KICH, PCPG, and TGCT (Figure 5A). In terms of survival analysis, high expression of CDK6-AS1 was related to poor prognosis in BLCA, HNSC, KIRC, LGG, LUAD, MESO, and THCA (Figures 5B–H), while showing better prognosis in UVM (Figure 5I). Further analysis was performed to determine the correlation between CDK6-AS1 expression and its target gene, CDK6. We found that CDK6-AS1 was correlated with its target in 29 tumor types (Supplementary Table S6). Taken together, when CDK6-AS1 is dysregulated it could influence the prognosis in a range of different cancer types. Representative immunohistochemical staining was used for gastric cancer tumor-infiltrating target gene CDK6. Scale bar, 50 mm (Figure 5J). Western blot results showed that CDK6 was significantly expressed in metastatic gastric cancer cells MKN-45 and in the in situ gastric cancer cell line HGC-27, while GES-1 was not significantly expressed in normal gastric mucosa epithelial cells (Figure 5K).
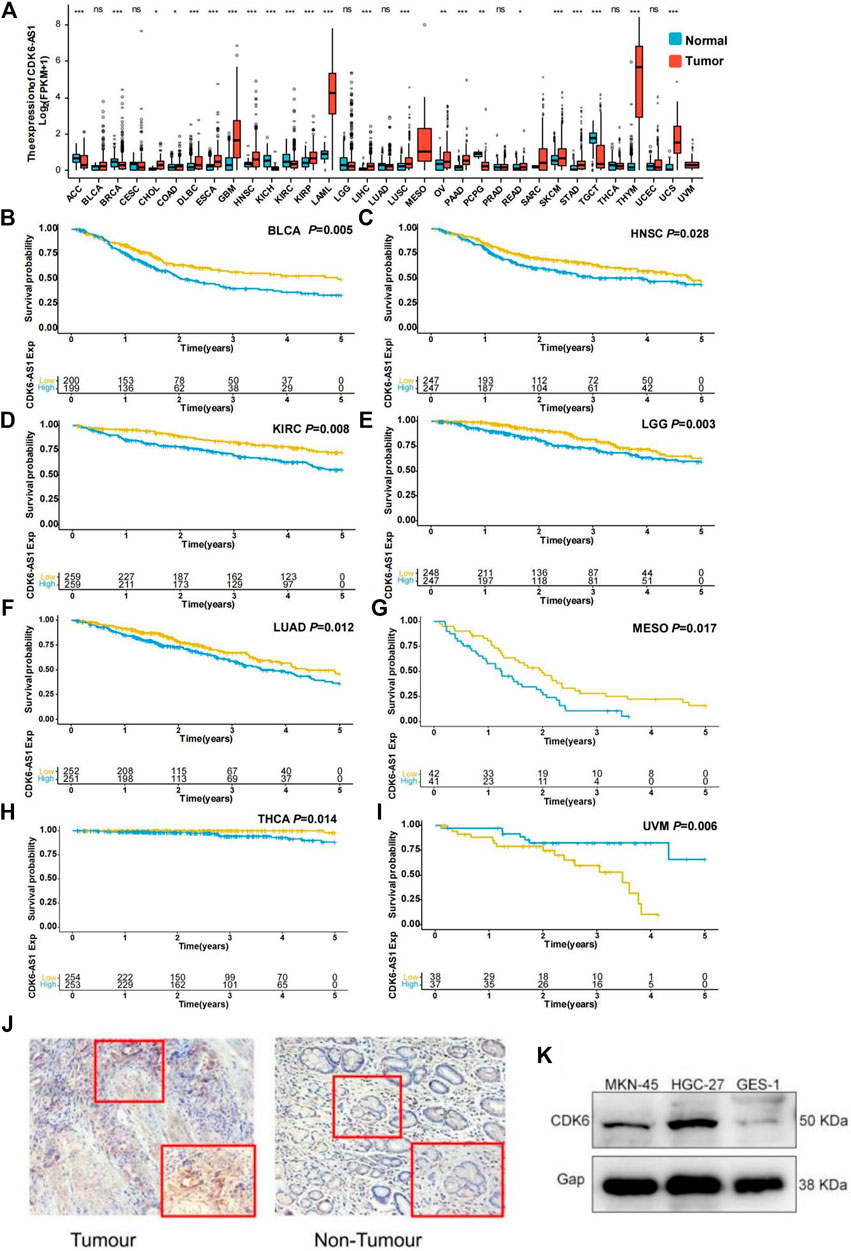
FIGURE 5. Expression and survival validation in TCGA pan-cancer cohort. (A) Differential expression validation of CDK6-AS1 in TCGA pan-cancer cohort. *p e 0.05; **p < 0.01; ***p < 0.001; ns: not significant with p > 0.05. (B–I) The prognostic effect of CDK6-AS1 in other TCGA cancer types. Types with Cox p > 0.05 are shown. (J) Representative immunohistochemical staining for gastric cancer tumor-infiltrating target gene CDK6. (K) The CDK6 was expressed in gastric cancer cells MKN-45, HGC-27, and gastric mucosa epithelial cells GES- 1.
In order to identify predictive genes and construct a prognostic model, six genes related to DEG and OS co-expressed with CDK6-AS1 were crossed to obtain 6 differentially expressed genes related to CDK6-AS1 and OS. Then the six genes were analyzed by LASSOCox regression and the tuning parameter lambda (λ) was selected by using the cross-validation error curve. The prognostic models were constructed when the λ value was minimum (Figure 6A) (Risk score = 0.2637*CTHRC1 + 0.0132*PFN2 + 0.1384*PRSS35 + 0.0355*RTN4 - 0.072*SMPD3 + 0.5459*SYCP2L, and their LASSO coefficient curves are shown in Figure 6B. The relationship between survival status/risk score, mRNA expression heat map of 6 genes, and survival time (days)/risk score showed that the prognostic model had a good prognostic effect, and the OS of gastric cancer patients in the high-risk group was worse than that in the low-risk group (p < 0.001) (Figures 6C–F).
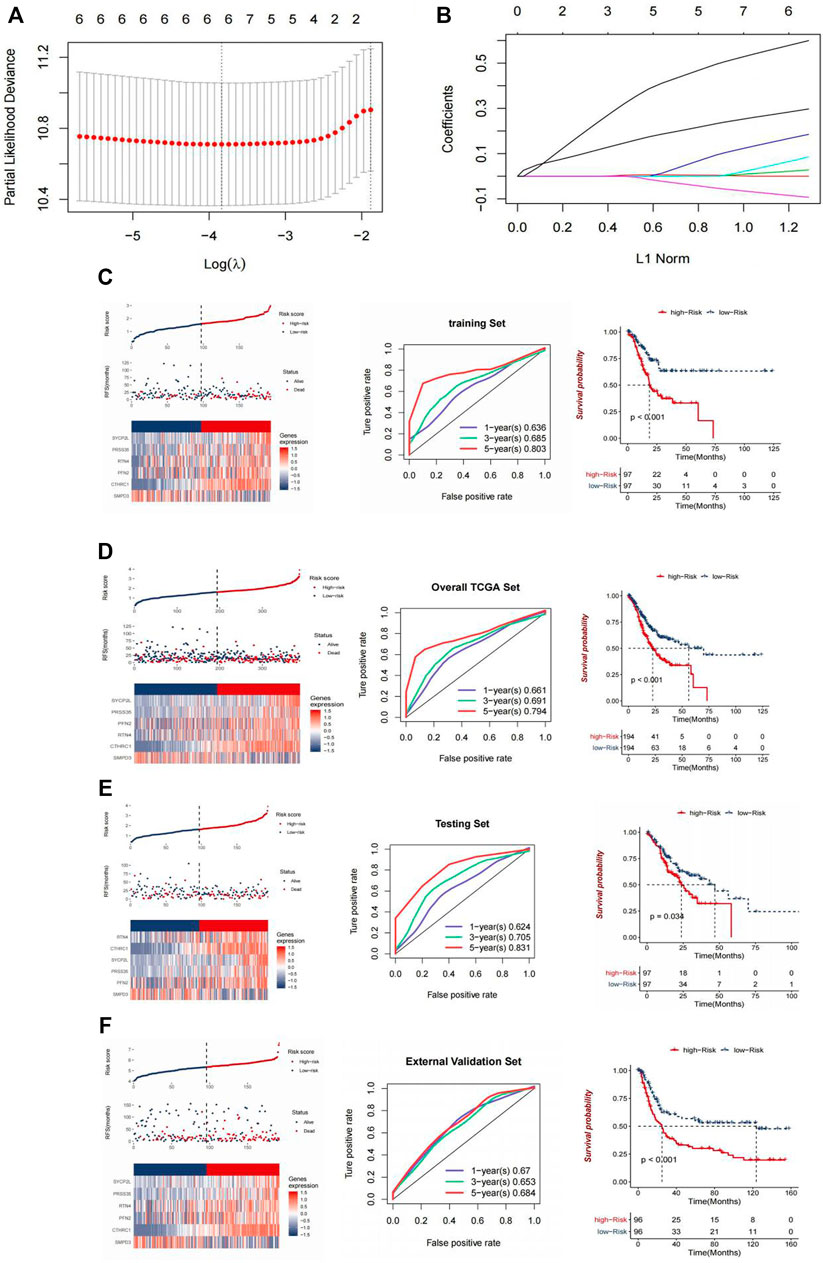
FIGURE 6. Construction and validation of CDK6-AS1. (A) Tuning parameter lambda (λ) selected by cross-validation error curve. (B) LASSO coefficient profiles of six genes. (C,D) Relationship between the survival status/risk score rank, mRNA expression heat map of 6 genes and survival time (days)/risk score rank. Left: survival status/risk score rank, mRNA expression heat map of 6 genes. Middle: Time-dependent ROC curves for OS of the TCGA-LAML training data set. The AUC was assessed at 1, 3, and 5 years. Right: Kaplan-Meier OS analysis of gastric cancer patients in low-risk and high-risk groups. p value was calculated using the log-rank test. p < 0.001. (E,F) Validation using an internal set (E) and an external set (F).
TIL are important players in the TME and have been reported to influence gastric cancer survival rates. Therefore, the association between CDK6-AS1 expression and the proportion of infiltrating lymphocytes was analyzed. Higher CDK6-AS1 expression showed negative tendencies with almost all inferred immune cell enrichment scores (Figures 7A–I) and was among Thelper (Spearman r = −0.20, e < 0.001, Figure 7C), Treg (Spearman r = −0.10, e = 0.044, Figure 7D), and neutrophil cell clusters (Spearman’s r = −0.14, p = 0.008, Figure 7I). Taken together, it appears that high-CDK6-AS1 expression may hamper immune TME cell infiltration, both in innate and adaptive cell clusters, which may have an effect on anti-tumor immunity.
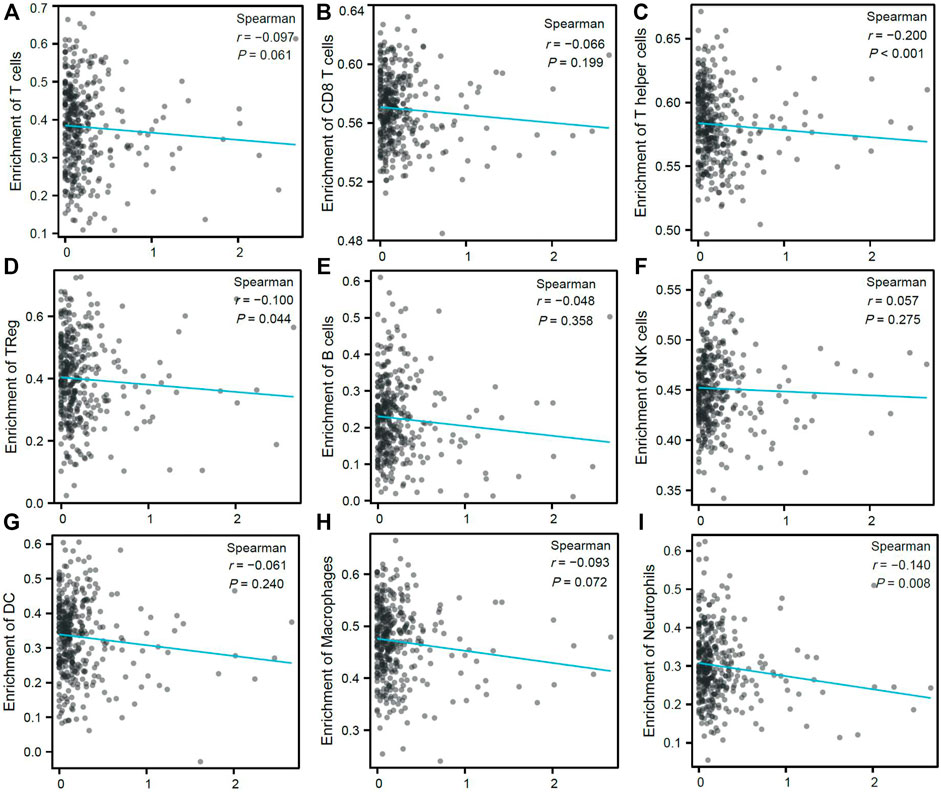
FIGURE 7. Correlation between expression of CDK6-AS1 and immune cell infiltration proportion. (A–I) Correlation between expression of CDK6-AS1 and ssGSEA inferred immune cell infiltration of T, CD8+T, T helper, Treg, B, NK, DC, macrophage, and neutrophil cells.
Since chemo-sensitivity or -resistance is related to the clinical prognosis of gastric cancer, we explored the chemosensitivity of the high- and low-CDK6-AS1 expression groups. The ridge regression model was used to predict individual drug sensitivities. A commonly used chemotherapy drug in gastric cancer therapy, cisplatin, showed greater sensitivity in the high-CDK6-AS1 expression group than in the low-expression group (p = 0.024, Figure 8A). Conversely, paclitaxel showed higher sensitivity in the low-expression group (p = 0.040). We also explored the expression of immunotherapy and targeted therapeutic markers. PD-L1 expression was higher in the low-CDK6-AS1 expression group, which may indicate anti-PD-L1 therapy (Figure 8B). We can also prove that CDK6-AS1 is related to immunotherapy by TMB analysis, and the results show that the immunotherapy effect is better in the group with low expression of CDK6-AS1 (Figure 8C).
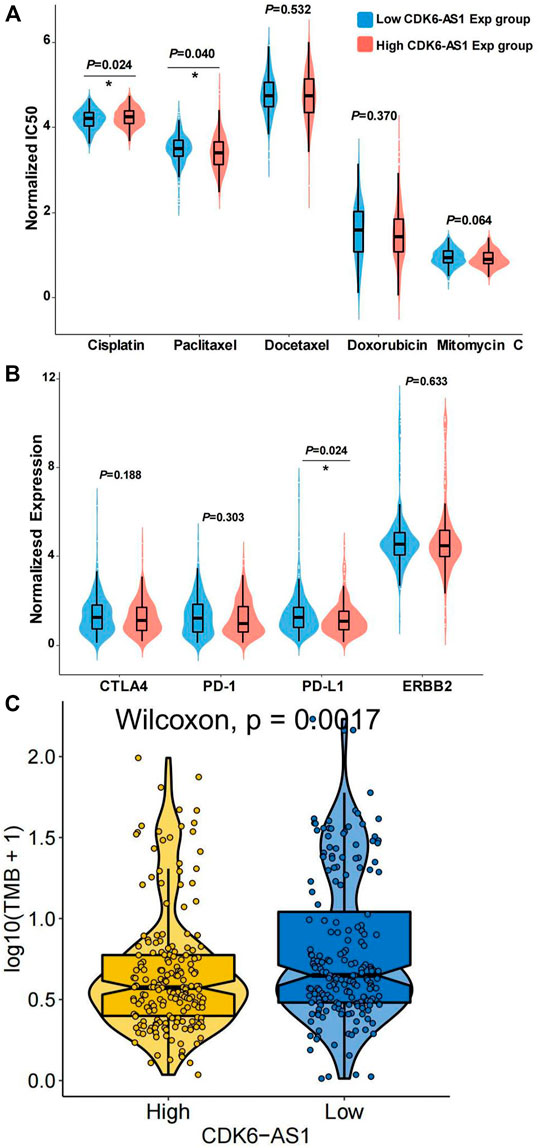
FIGURE 8. Drug sensitivity prediction in low- and high-CDK6-AS1 expression group. (A) Chemosensitivity prediction of five commonly used drugs in antineoplastic therapy in the low- and high-CDK6-AS1 expression groups. IC50: Half-maximum inhibitory concentration. (B) Expression of immunotherapy and HER2-targeted therapy markers in the low and high CDK6-AS1 expression groups. (C) TMB analysis showed that the immunotherapy effect is better in the group with low expression of CDK6-AS1.
In our study, we found that CDK6-AS1 may serve as an independent poor prognostic biomarker candidate in gastric cancer, with a positive correlation to its target gene, CDK6. The low-CDK6-AS1 expression group showed more frequently mutated driver genes than the high-expression group. Moreover, CDK6-AS1 is involved in key oncogenic pathways such as the cell cycle and RNA transcription. CDK6-AS1 also shows dysregulation and is associated with prognosis at the pan-cancer level. We also verified by constructing a prognostic model and found that the model had a good prognostic effect, and the OS of patients with gastric cancer in the high-risk group was worse than that in the low-risk group.
Some researchers had demonstrated that eRNAs worked by regulating target genes to form a chromatin loop (Natoli and Andrau, 2012; Bresnick and Johnson, 2019). Research has shown that the eRNA of ACTRT1 can lower the expression of target genes and promote the development of cancer (Bal et al., 2017).
In our study, it was also confirmed that CDK6-AS1 was associated with survival in eight types of tumors (BLCA, HNSC, KIRC, LGG, LUAD, MESO, THCA, and UVM), and moreover, CDK6-AS1 expression was correlated with that of its target gene, CDK6, in 29 tumor types. Thus, we suggest that CDK6-AS1 acts as an independent predictor of gastric cancer.
CDK6 can form complex D-type cyclins (D1, D2, and D3) and progresses to the early G1 phase (Nebenfuehr et al., 2020). CDK4/6-cyclin D-complexes are regulated by Cip/Kip proteins, which affect the nuclear translocation of complexes (Song et al., 2020; Nardone et al., 2021). Some studies have reported that CDK6 overexpression could affect lymphoma, leukemia, and other malignancies. Although there is no relationship between mutations in CDK6 and diseases, CDK6 has served as a hub gene in acute myeloid leukemia (Malumbres and Barbacid, 2009; Scheicher et al., 2015). The cyclin D-CDK4/6 axis is commonly expressed in breast cancer. Another effect of CDK4/6 inhibitors is anti-tumor immunity. Zhang et al. suggested that CDK4 negatively regulates programmed cell death ligand 1 (PD-L1) protein stability; moreover, CDK4 and PD-L1 levels negatively correlate with tumor treatment (Scheicher et al., 2015; Goel et al., 2017).
Since TME is important during tumor progress, we studied CDK6-AS1 expression in infiltrating immune cell fractions. Intriguingly, we found that lower CDK6-AS1 expression was positively correlated with the proportion of antitumor immune cells, such as Thelper cells. This could be partially explained by the finding that the low-CDK6-AS1 expression group had more mutated genes than the high-expression group. More frequently mutated genes indicate an increased mutational burden and cancer neoantigens (Xu et al., 2020). Neoantigens can serve as targets for immune recognition and recruitment (Garcia-Garijo et al., 2019). The relationship between CDK6-AS1 and neoantigens warrants further study.
Our study had some limitations. First, the sample size of this research was small, and more clinical research and data are needed. Second, further research and greater detailing is required on the function and role of CDK6-AS1 in gastric cancer.
CDK6-AS1 may serve as a poor independent prognostic biomarker candidate for gastric cancer, demonstrating a positive correlation with its target gene, CDK6. Moreover, CDK6-AS1 is involved in key oncogenic pathways such as the cell cycle and RNA transcription. CDK6-AS1 also shows dysregulation and is associated with prognosis at the pan-cancer level. These eRNAs may also be associated with immune cell infiltration and drug sensitivity.
The original contributions presented in the study are included in the article/Supplementary Material, further inquiries can be directed to the corresponding author.
The studies involving human participants were reviewed and approved by the Ethics Committee of the Second Affiliated Hospital of Harbin Medical University. The patients/participants provided their written informed consent to participate in this study. The patients/participants provided their written informed consent to participate in this study.
SY and XZ designed the study. HY, JL and AZ performed the experiment. LEZ, and ZM analyzed the data. SY and LIZ wrote the manuscript. All authors reviewed the manuscript.
This project was supported by the National Natural Science Foundation of China (81672355).
The authors declare that the research was conducted in the absence of any commercial or financial relationships that could be construed as a potential conflict of interest.
All claims expressed in this article are solely those of the authors and do not necessarily represent those of their affiliated organizations, or those of the publisher, the editors, and the reviewers. Any product that may be evaluated in this article, or claim that may be made by its manufacturer, is not guaranteed or endorsed by the publisher.
The authors want to thank all the participants in the research.
The Supplementary Material for this article can be found online at: https://www.frontiersin.org/articles/10.3389/fgene.2022.854211/full#supplementary-material
Andersson, R., Gebhard, C., Gebhard, C., Miguel-Escalada, I., Hoof, I., Bornholdt, J., et al. (2014). An Atlas of Active Enhancers across Human Cell Types and Tissues. Nature 507 (7493), 455–461. doi:10.10.1038/nature12787
Bal, E., Park, H.-S., Belaid-Choucair, Z., Kayserili, H., Naville, M., Madrange, M., et al. (2017). Mutations in ACTRT1 and its Enhancer RNA Elements lead to Aberrant Activation of Hedgehog Signaling in Inherited and Sporadic Basal Cell Carcinomas. Nat. Med. 23 (10), 1226–1233. doi:10.1038/nm.4368
Bray, F., Ferlay, J., Soerjomataram, I., Siegel, R. L., Torre, L. A., and Jemal, A. (2018). Global Cancer Statistics 2018: GLOBOCAN Estimates of Incidence and Mortality Worldwide for 36 Cancers in 185 Countries. CA: A Cancer J. Clinicians 68 (6), 394–424. doi:10.3322/caac.21492
Bresnick, E. H., and Johnson, K. D. (2019). Blood Disease-Causing and -suppressing Transcriptional Enhancers: General Principles and GATA2 Mechanisms. Nat. Commun. 3 (13), 2045–2056. doi:10.1182/bloodadvances.2019000378
Corradin, O., Saiakhova, A., Akhtar-Zaidi, B., Myeroff, L., Willis, J., Cowper-Sal·lari, R., et al. (2014). Combinatorial Effects of Multiple Enhancer Variants in Linkage Disequilibrium Dictate Levels of Gene Expression to Confer Susceptibility to Common Traits. Genome Res. 24 (1), 1–13. doi:10.1101/gr.164079.113
Digklia, A., and Wagner, A. D. (2016). Advanced Gastric Cancer: Current Treatment Landscape and Future Perspectives. Wjg 22 (8), 2403–2414. doi:10.3748/wjg.v22.i8.2403
Garcia-Garijo, A., Fajardo, C. A., and Gros, A. (2019). Determinants for Neoantigen Identification. Front. Immunol. 10, 1392. doi:10.3389/fimmu.2019.01392
Geeleher, P., Zhang, Z., Wang, F., Gruener, R. F., Nath, A., Morrison, G., et al. (2017). Discovering Novel Pharmacogenomic Biomarkers by Imputing Drug Response in Cancer Patients from Large Genomics Studies. Genome Res. 27 (10), 1743–1751. doi:10.1101/gr.221077.117
Goel, S., DeCristo, M. J., Watt, A. C., BrinJones, H., Sceneay, J., Li, B. B., et al. (2017). CDK4/6 Inhibition Triggers Anti-tumour Immunity. Nature 548 (7668), 471–475. doi:10.1038/nature23465
Goldman, M. J., Craft, B., Hastie, M., Repečka, K., McDade, F., Kamath, A., et al. (2020). Visualizing and Interpreting Cancer Genomics Data via the Xena Platform. Nat. Biotechnol. 38 (6), 675–678. doi:10.1038/s41587-020-0546-8
Gu, X., Wang, L., Boldrup, L., Coates, P. J., Fahraeus, R., Sgaramella, N., et al. (2019). AP001056. 1, A Prognosis-Related Enhancer RNA in Squamous Cell Carcinoma of the Head and Neck. Cancers (Basel) 11 (3), 347. doi:10.3390/cancers11030347
Hsieh, C.-L., Fei, T., Chen, Y., Li, T., Gao, Y., Wang, X., et al. (2014). Enhancer RNAs Participate in Androgen Receptor-Driven Looping that Selectively Enhances Gene Activation. Proc. Natl. Acad. Sci. U.S.A. 111 (20), 7319–7324. doi:10.1073/pnas.1324151111
Kaikkonen, M. U., Spann, N. J., Heinz, S., Romanoski, C. E., Allison, K. A., Stender, J. D., et al. (2013). Remodeling of the Enhancer Landscape during Macrophage Activation Is Coupled to Enhancer Transcription. Mol. Cel. 51 (3), 310–325. doi:10.1016/j.molcel.2013.07.010
Kim, T.-K., and Shiekhattar, R. (2015). Architectural and Functional Commonalities between Enhancers and Promoters. Cell 162 (5), 948–959. doi:10.10.1016/j.cell.2015.08.008
Li, B., Severson, E., Pignon, J.-C., Zhao, H., Li, T., Novak, J., et al. (2016). Comprehensive Analyses of Tumor Immunity: Implications for Cancer Immunotherapy. Genome Biol. 17 (1), 174. doi:10.1186/s13059-016-1028-7
Malumbres, M., and Barbacid, M. (2009). Cell Cycle, CDKs and Cancer: a Changing Paradigm. Nat. Rev. Cancer 9 (3), 153–166. doi:10.1038/nrc2602
Martens-Uzunova, E. S., Böttcher, R., Croce, C. M., Jenster, G., Visakorpi, T., and Calin, G. A. (2014). Long Noncoding RNA in Prostate, Bladder, and Kidney Cancer. Eur. Urol. 65 (6), 1140–1151. doi:10.1016/j.eururo.2013.12.003
Miracco, C., Giannicola, R., Giordano, A., Pirtoli, L., Cheng, L., Han, T., et al. (2021). TBX5-AS1, an Enhancer RNA, Is a Potential Novel Prognostic Biomarker for Lung Adenocarcinoma. Int. J. ofmolecular Sci. 21 (1), 794. doi:10.1186/s12885-021-08517-w
Nardone, V., Barbarino, M., Angrisani, A., Correale, P., Pastina, P., Cappabianca, S., et al. (2021). CDK4, CDK6/cyclin-D1 Complex Inhibition and Radiotherapy for Cancer Control: A Role for Autophagy. Ijms 22 (16), 8391. doi:10.3390/ijms22168391
Natoli, G., and Andrau, J.-C. (2012). Noncoding Transcription at Enhancers: General Principles and Functional Models. Annu. Rev. Genet. 46, 1–19. doi:10.1146/annurev-genet-110711-155459
Nebenfuehr, S., Kollmann, K., and Sexl, V. (2020). The Role of CDK6 in Cancer. Int. J. Cancer 147 (11), 2988–2995. doi:10.1002/ijc.33054
Scheicher, R., Hoelbl-Kovacic, A., Bellutti, F., Tigan, A.-S., Prchal-Murphy, M., Heller, G., et al. (2015). CDK6 as a Key Regulator of Hematopoietic and Leukemic Stem Cell Activation. Blood 125 (1), 90–101. doi:10.1182/blood-2014-06-584417
Soerjomataram, I., Lortet-Tieulent, J., Parkin, D. M., Ferlay, J., Mathers, C., Forman, D., et al. (2012). Global burden of Cancer in 2008: a Systematic Analysis of Disability-Adjusted Life-Years in 12 World Regions. The Lancet 380 (9856), 1840–1850. doi:10.1016/s0140-6736(12)60919-2
Song, Z., Wei, Z., Wang, Q., Zhang, X., Tao, X., Wu, N., et al. (2020). The Role of DOT1L in the Proliferation and Prognosis of Gastric Cancer. Biosci. Rep. 40 (1), 40. doi:10.1042/BSR20193515
The Cancer Genome Atlas Research Network (2014). Comprehensive Molecular Characterization of Gastric Adenocarcinoma. Nature 513 (7517), 202–209. doi:10.1038/nature13480
Thrift, A. P., and El-Serag, H. B. (2020). Burden of Gastric Cancer. Clin. Gastroenterol. Hepatol. 18 (3), 534–542. doi:10.1016/j.cgh.2019.07.045
Xiao, J., Liu, Y., Yi, J., and Liu, X. (2021). LINC02257, an Enhancer RNA of Prognostic Value in Colon Adenocarcinoma, Correlates with Multi-Omics Immunotherapy-Related Analysis in 33 Cancers. Front. Mol. Biosci. 8, 646786. doi:10.3389/fmolb.2021.646786
Xu, P., Luo, H., Kong, Y., Lai, W.-F., Cui, L., and Zhu, X. (2020). Cancer Neoantigen: Boosting Immunotherapy. Biomed. Pharmacother. 131, 110640. doi:10.1016/j.biopha.2020.110640
Keywords: CDK6-AS1, CDK6, enhancer RNA, gastric cancer, prognostic biomarker
Citation: Yang S, Zou X, Yang H, Li J, Zhang A, Zhang L, Li C, Zhu L and Ma Z (2022) Identification of Enhancer RNA CDK6-AS1 as a Potential Novel Prognostic Biomarker in Gastric Cancer. Front. Genet. 13:854211. doi: 10.3389/fgene.2022.854211
Received: 13 January 2022; Accepted: 01 April 2022;
Published: 29 April 2022.
Edited by:
Wei-Lin Jin, First Hospital of Lanzhou University, ChinaReviewed by:
Atrayee Bhattacharya, Dana–Farber Cancer Institute, United StatesCopyright © 2022 Yang, Zou, Yang, Li, Zhang, Zhang, Li, Zhu and Ma. This is an open-access article distributed under the terms of the Creative Commons Attribution License (CC BY). The use, distribution or reproduction in other forums is permitted, provided the original author(s) and the copyright owner(s) are credited and that the original publication in this journal is cited, in accordance with accepted academic practice. No use, distribution or reproduction is permitted which does not comply with these terms.
*Correspondence: Xiaoming Zou, em91NDkzMEAxNjMuY29t
Disclaimer: All claims expressed in this article are solely those of the authors and do not necessarily represent those of their affiliated organizations, or those of the publisher, the editors and the reviewers. Any product that may be evaluated in this article or claim that may be made by its manufacturer is not guaranteed or endorsed by the publisher.
Research integrity at Frontiers

Learn more about the work of our research integrity team to safeguard the quality of each article we publish.