 Chen Qian1†Wu Xiufu1†Tang Jianxun1
 Chen Zihao2
 Shi Wenjie2,3Tang Jingfeng1
 Ulf D. Kahlert3*
 Du Renfei4,5*
- 1Department of Cerebrovascular Diseases, The Second Affiliated Hospital of Guilin Medical University, Guilin, China
- 2University Hospital for Gynecology, Pius-Hospital, University Medicine Oldenburg, Oldenburg, Germany
- 3Molecular and Experimental Surgery, Medical Faculty University Hospital Magdeburg, University Clinic for General-, Visceral-, Vascular- and Trans-Plantation Surgery, Otto-von Guericke University, Magdeburg, Germany
- 4Clinic of Neurosurgery, Medical Faculty, Heinrich-Heine University Düsseldorf, Düsseldorf, Germany
- 5Chifeng Municipal Hospital, Inner Mongolia, Chifeng, China
Background: Glioblastoma (GBM), one of the most prevalent brain tumor types, is correlated with an extremely poor prognosis. The extracellular matrix (ECM) genes could activate many crucial pathways that facilitate tumor development. This study aims to provide online models to predict GBM survival by ECM genes.
Methods: The associations of ECM genes with the prognosis of GBM were analyzed, and the significant prognosis-related genes were used to develop the ECM index in the CGGA dataset. Furthermore, the ECM index was then validated on three datasets, namely, GSE16011, TCGA-GBM, and GSE83300. The prognosis difference, differentially expressed genes, and potential drugs were obtained. Multiple machine learning methods were selected to construct the model to predict the survival status of GBM patients at 6, 12, 18, 24, 30, and 36 months after diagnosis.
Results: Five ECM gene signatures (AEBP1, F3, FLNC, IGFBP2, and LDHA) were recognized to be associated with the prognosis. GBM patients were divided into high– and low–ECM index groups with significantly different overall survival rates in four datasets. High–ECM index patients exhibited a worse prognosis than low–ECM index patients. Four small molecules (podophyllotoxin, lasalocid, MG-262, and nystatin) that might reduce GBM development were predicted by the Cmap dataset. In the independent dataset (GSE83300), the maximum values of prediction accuracy at 6, 12, 18, 24, 30, and 36 months were 0.878, 0.769, 0.748, 0.720, 0.705, and 0.868, respectively. These machine learning models were provided on a publicly accessible, open-source website (https://ospg.shinyapps.io/OSPG/).
Conclusion: In summary, our findings indicated that ECM genes were prognostic indicators for patient survival. This study provided an online server for the prediction of survival curves of GBM patients.
Introduction
Glioblastoma (GBM), grade IV glioma, accounts for around 40–50 percent of brain tumors in America (Ostrom et al., 2017). There is an extremely unfavorable prognosis for GBM. Only about 5% of GBM patients will survive more than 5 years after diagnosis (Delgado-Lopez and Corrales-Garcia, 2016; Monteiro et al., 2017). Radiation exposure, particularly during childhood, is a risk factor for developing GBM (Roviello et al., 2013). The combination of surgery and temozolomide (TMZ) has been shown to prolong survival times. However, an increasing number of patients with GBM will develop resistance to TMZ after treatment (Dai et al., 2017). Consequently, it is critical to find novel biomarkers capable of accurately predicting prognosis and select appropriate individualized treatment strategies for patients with GBM.
The extracellular matrix (ECM) is mainly produced by fibroblasts and can be classified into two groups: fibrous proteins (collagen and fibronectin) and glycosaminoglycan (hyaluronic acid and chondroitin sulfate) (Brassart-Pasco et al., 2020; Huang et al., 2021). As a result of the strong crosslinking between these molecules, the ECM forms a dense mesh structure within the tissues. The interaction between cancer cells and ECM molecules activates many crucial pathways that facilitate the development of cancer. The presence of ECM components may represent a measure of tumor activity and invasiveness and could be used as a biomarker of disease (Brassart-Pasco et al., 2020). Therefore, a comprehensive understanding of ECM dysregulation in the tumor microenvironment (TME) will help identify potential GBM treatments.
This study is aimed at examining the association of ECM genes with GBM survival and providing models to predict survival. A total of five ECM genes were selected using bioinformatics analysis to build an ECM index model. A high ECM index was found to be associated with poorer overall survival. Potential drugs were predicted to reverse the negative prognosis of high–ECM index patients. More importantly, machine learning models were constructed to predict the survival status of 6, 12, 18, 24, 30, and 36 months. A free and user-friendly web server based on these machine learning models was provided in this study.
Methods and Materials
Data Curation Process
The available transcriptome and clinical data of GBM patients from the Chinese Glioma Genome Atlas (CGGA), Gene Expression Omnibus (GEO), and The Cancer Genome Atlas (TCGA) were used as the datasets for finding prognostic biomarkers and constructing prediction models. The samples, whose histology grade was grade IV or diagnosed with GBM, were downloaded and kept for analysis. There were 237 GBM samples from the CGGA dataset (Zhao et al., 2021), 150 GBM samples from GSE16011 (Gravendeel et al., 2009), and 159 GBM samples from the TCGA-GBM project. Another independent GBM dataset (GSE83300) that contained 50 GBM patients was used as the validation dataset for evaluating the performance of prediction models (Feng et al., 2017). There was a median survival time of 12, 8.7, 9, and 16.8 months in the CGGA, GSE16011, TCGA-GBM, and GSE83300 datasets, respectively. All the accession IDs of used samples from the four datasets are displayed in the Supplementary Table S1.
Construction and Validation of the ECM Index
The expression values of genes in each dataset were normalized by a min–max normalization method using the following formula: zi = (xi–min(x))/(max(x)—min(x)). Here, zi is the normalized value of the gene expression, xi is the expression value before normalization, min(x) is the minimum value of the gene expression in the dataset, and max(x) is the maximum value of the gene expression in the dataset. After normalization, the gene values range from 0 to 1. We used a univariate Cox regression analysis in CGGA, GSE16011, and TCGA-GBM to examine the links between ECM gene (1,936 unique ECM-related genes from 47 ECM gene sets) expression and overall survival (OS). The prognostic ECM genes were defined as the genes with p-value<0.05 in the univariate Cox regression analysis. The prognostic ECM genes were overlapped among the three datasets. Then, CGGA was set as the training dataset, GSE16011 and TCGA-GBM were set as the internal testing dataset, and GSE83300 was set as the independent validation dataset. The LASSO method from the “glmnet” package was adopted in CGGA to select the prognostic genes with a high importance value (Friedman et al., 2010). The ECM index was calculated by applying a multivariate Cox regression analysis to calculate the regression coefficient of genes.
The ECM index was calculated using the following formula: ECM index = β1* Gene_1 +…+ βn*Gene_n. In the formula, β is the regression coefficient and Gene_n is the expression value of genes. In the training, testing, and validation datasets, the patients were classified as high or low index based on the median value of the ECM index. Subsequently, we calculated the log-rank test and plotted the Kaplan–Meier curve to evaluate the difference in OS between the high– and low–ECM index groups. Then, the OS prediction ability of the ECM index was assessed by the area under the curve (AUC) at 12, 18, 24, and 36 months.
Comparison of Expression Values Among Normal Brain, Low-Grade Glioma, and GBM Samples
The expression values of the selected genes were compared between the GBM and normal brain samples from the GEPIA web server (Tang et al., 2017). The GEPIA web server contains 163 GBM from the TCGA-GBM project and 207 normal brain samples from the GTEx project. For comparison of LGG and GBM, we downloaded and used the expression profiles of 159 GBM samples and 500 LGG samples from the TCGA-GBM and TCGA-LGG projects, respectively.
Correlation Analysis of the ECM Index With Immune and Stromal Cell Populations
The MCP-counter which is capable of estimating the absolute abundance of eight immune and two stromal cell populations in the tumor samples by the expression data was used in this study (Becht et al., 2016). The differences in the immune and stromal cell populations were compared between the high– and low–ECM index groups using t-test analysis.
Differential Gene Expression Analysis and the Identification of Potential Drugs
In CGGA, GSE16011, and TCGA-GBM, the differences in the expression levels of protein coding genes between the high–ECM index group samples and low–ECM index group samples for each ECM gene were analyzed using the linear models from the “limma” R package (Ritchie et al., 2015). We defined the cutoff criteria as p-value<0.05 and log2 fold change>0.5 to filter the statistically significant differentially expressed genes (DEGs) in each dataset. The DEGs were overlapped among the three datasets to obtain the robust DEGs. By using the Connectivity Map (CMap) database, we were able to examine the potential drugs with a close correlation to the diseases. The robust DEGs between the low– and high–ECM index groups were submitted to the Cmap database. The connectivity value from the Cmap represents the ability of the drug to reduce ECM formation, and the optimal connectivity value should be −1.
Construction of Machine Learning Models and Web-Based Survival Rate Calculator
Machine learning methods were used in the construction of models to predict the survival rates of GBM patients at 6, 12, 18, 24, 30, and 36 months after diagnosis. Four machine learning algorithms, including support vector machine (SVM), random forest (RF), generalized linear models (GLM), and artificial neural network (ANN) from the caret R package were considered. To identify the best parameters for model creation, five-fold cross-validation and grid search were utilized. Data merging was performed on the CGGA, GSE16011, and TCGA-GBM datasets, and the samples were separated into the training dataset (60%) and the testing dataset (40%). GSE83300 was set as the independent validation dataset. After setting the best parameters, the models were trained on the training dataset and evaluated on the testing dataset and an independent validation dataset. The receiver operating characteristic (ROC) curve, a plot of sensitivity versus (1–specificity), was used to estimate the performance of models. We used the R package “shiny” to develop a web-based survival rate calculator and survival curve predictor using these machine learning models.
Results
Determination of Prognostic ECM Genes
In this study, 47 ECM gene sets containing 1,936 unique ECM-related genes were obtained (Supplementary Table S2). Among these 1,936 ECM-related genes, by the univariate Cox regression analyses, 134 genes were found to be positively correlated with prognosis in CGGA, 118 genes were found to be positively correlated with prognosis in GSE16011, and 74 genes were found to be positively correlated with prognosis in TCGA-GBM. These genes were identified as protective genes. Similarly, 223 genes were negatively correlated with prognosis in the CGGA dataset, 205 genes were negatively correlated with prognosis in the GSE16011 dataset, and 211 genes were negatively correlated with prognosis in the TCGA-GBM dataset. These genes were selected as risky genes. The intersection of the results showed that there were two common protective genes and 37 common risky genes (Figures 1A,B).
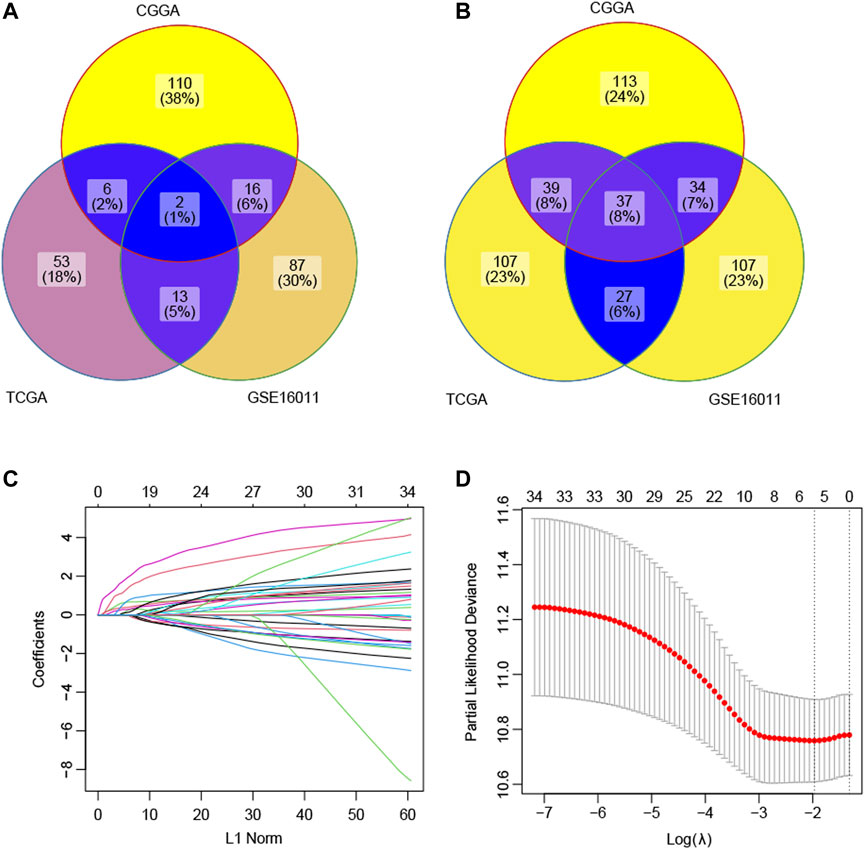
FIGURE 1. Selection of the prognostic ECM genes by the lasso method. (A) Intersection of the candidate protective genes. (B) Intersection of the candidate risky genes. (C) Lasso coefficient profiles of 39 genes were generated by comparing with the λ. Following the change of λ, the coefficients of the unimportant genes against the L1-norm (regularization term) in the model will be reduced to zero. The number of curves is the number of genes with non-zero coefficients at the current λ. (D) This plot is to show the cross-validation curve along with upper and lower standard deviation. The left vertical line indicates the gene number when the value of λ gives a minimal mean squared error (MSE). The right vertical line indicates the gene number when the cross-validated error is within one standard error of the minimum. Based on the first vertical line, the model included five genes with a non-zero prediction value.
Construction of the ECM Index
The LASSO technique was used on these 39 prognostic ECM genes in the CGGA, and the results indicated that AEBP1, F3, FLNC, IGFBP2, and LDHA were the best combination of genes to construct the model (Figures 1C,D). A multivariate Cox regression analysis calculated the regression coefficient. The ECM index was obtained by the following formula: [1.0391×AEBP1] + [0.6346×F3] + [0.5396×FLNC] + [2.1276×IGFBP2] + [2.7396×LDHA]. All the five selected genes (AEBP1, F3, FLNC, IGFBP2, and LDHA) were the risky genes since their regression coefficients were positive. The median value of the ECM index was selected to divide the patients into high– and–low ECM index groups. In Figure 2A, the ECM index distribution and overall survival data in the CGGA dataset were displayed and ranked according to the index value. The survival analysis indicated that the low–ECM index group had an apparent better prognosis than the high–ECM index group (p-value<0.05; Figure 2B). In Figure 2C, gene expression profiles of the high and low index groups were illustrated. The AUC values for 12-, 18-, 24-, and 36-month OS predictions were 0.63, 0.67, 0.69, and 0.66, respectively, which indicate its high ability to predict the prognosis of GBM (Figure 2D).
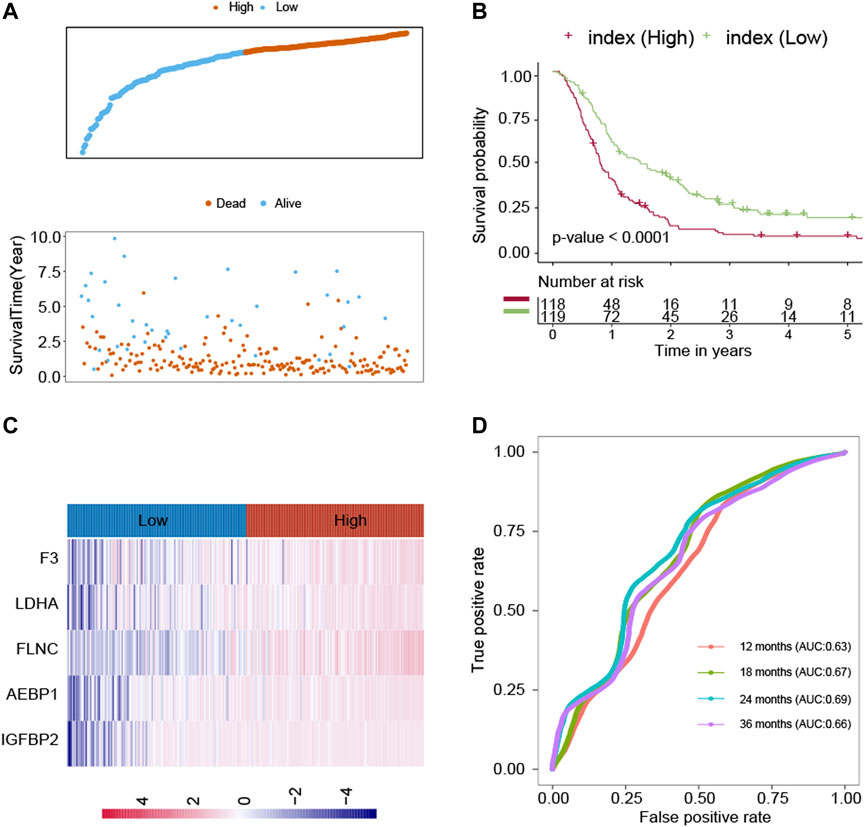
FIGURE 2. Construction of the ECM index in the CGGA dataset. (A) ECM index distribution and overall survival status of the GBM patients. (B) Kaplan–Meier survival curves of the high– and low–ECM index groups. (C) Gene expression profiles of ECM genes in the high– and low–ECM index groups. (D) AUC values for 12-, 18-, 24-, and 36-month overall survival predictions for the ECM index. Extracellular Matrix (ECM); Glioblastomas (GBM); area under the curve (AUC).
Survival Analysis
In CGGA, GSE16011, and TCGA-GBM, the GBM patients were classified into two groups by the median gene expression of the five selected genes (AEBP1, F3, FLNC, IGFBP2, and LDHA). Then, survival analysis was used to assess the relationship between the gene expression value and OS. There were significant negative correlations between the expression levels of AEBP1, F3, FLNC, and LDHA in CGGA (p-value<0.05; Supplementary Figure S1). The findings were then validated in the GSE16011 and TCGA-GBM datasets. In GSE16011, the gene expression levels of AEBP1, FLNC, and LDHA were negatively correlated with OS (Supplementary Figure S2). In TCGA-GBM, there were significant negative correlations between the expression levels of AEBP1 and FLNC with OS (p-value<0.05; Supplementary Figure S3).
The expression values of AEBP1, F3, FLNC, IGFBP2, and LDHA were compared among normal brain tissue, low-grade gliomas (LGG), and GBM. The results from the GEPIA dataset showed that the expression values of these genes were higher in the GBM samples than in the normal brain samples (p-value<0.0001; Supplementary Figure S4). The expression values of these genes were also significantly higher in the GBM samples than in the LGG samples (p-value<0.0001; Supplementary Figure S5).
Evaluation of the ECM Index Model
To further evaluate the robustness of the ECM index, the ECM index of the samples in the GSE16011 and TCGA-GBM datasets was obtained using the same formula. The median value of the ECM index was also used to stratify the samples into the high– and low–ECM index groups. The ECM index distribution, overall survival, and ECM gene expression profiles in these two validation sets are plotted in Figure 3A, D. The ROC analysis results in the GSE16011 and TCGA-GBM datasets suggested that the ECM index had a powerful ability to predict GBM survival (Figures 3B,E). Compared to the high–ECM index patients, the low–ECM index patients had better overall survival prognosis (GSE16011: p-value<0.0001; TCGA-GBM: p-value = 0.0048; Figures 3C,F).
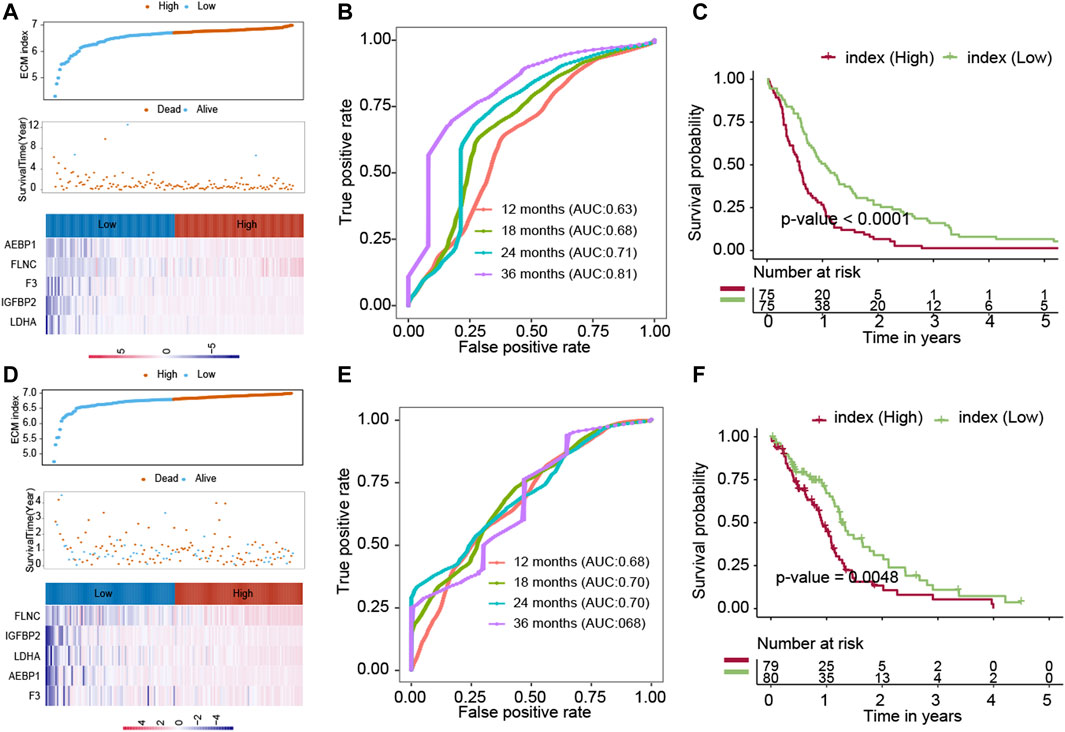
FIGURE 3. Evaluation of the ECM index in the internal validation datasets (GSE16011 and TCGA-GBM). The ECM indexes of all patients in the GSE16011 dataset (A–C) and the TCGA-GBM (D–F) dataset were calculated by the same formula and were divided into a high- and a low-index group.
Another independent dataset (GSE83300), which contains 50 GBM patients, was used to validate the results. The ECM index distribution, overall survival, and ECM gene expression profiles in GSE83300 are plotted in Figure 4A. The ROC analysis results suggested that the ECM index had a powerful ability to predict GBM survival (Figure 4B). Compared to high–ECM index patients, the low–ECM index patients had better overall survival prognosis (p-value = 0.046; Figure 4C), which is in concordance with the results from the CGGA, GSE16011, and TCGA-GBM datasets.
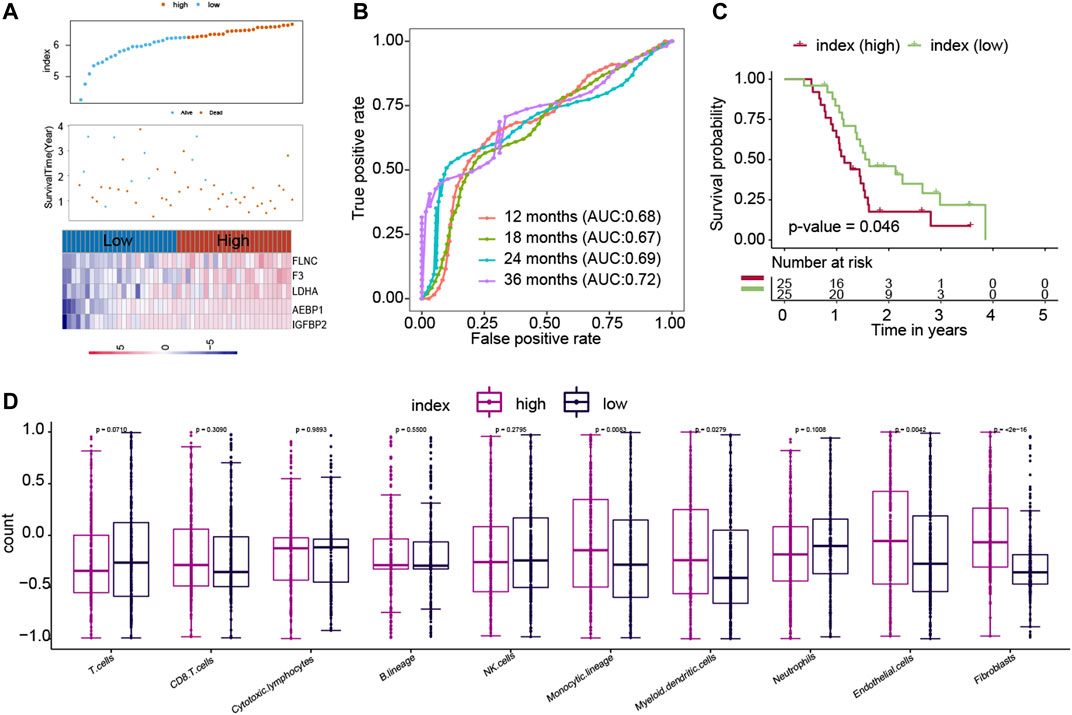
FIGURE 4. Evaluation of the ECM index in the independent dataset (GSE83300). The ECM index of all patients in the GSE83300 dataset (A–C) was calculated by the same formula and was divided into a high- and a low-index group. (D) Comparison of immune cells and stromal cells between than the low– and high–ECM index patients.
Endothelial Cells and Fibroblasts Were Higher in the High–ECM Index Group Samples
We calculated the association between the ECM index and population abundances of the immune and stromal cells in the combined CGGA, GSE16011, and TCGA-GBM datasets. As shown in Figure 4D, the high index group samples were found to comprise higher endothelial cells and fibroblast.
Identifying DEGs and Screening Potential Drugs
Data profiles from CGGA, GSE16011, and TCGA-GBM were used to find the DEGs between the high– and low–ECM index groups. DEGs calculated from the three datasets were overlapped to obtain the robust DEGs, and a total of 286 robust DEGs were identified. To predict the potential drugs for GBM, CMap was implemented on the robust DEGs between the low– and high–ECM index groups. The 20 drugs with high and significant associations with robust DEGs are listed in Supplementary Table S3. Among these drugs, podophyllotoxin, lasalocid, MG-262, and nystatin revealed higher negative correlations and the potential to reverse the high ECM index tumor status.
Development of Machine Learning Models to Predict GBM Patient Survival
The combination of genes, age, and gender was used to predict the survival status of GBM patients. The survival status of 6, 12, 18, 24, and 30 months was predicted by the machine learning methods. First, CGGA, GSE16011, and TCGA-GBM were combined into one dataset. Then, the combined dataset was randomly divided into training (60%) and testing (40%) datasets. The commonly used machine learning classifiers, including GLM, ANN, SVM, KNN, and RF, were constructed to predict the survival status of patients at 6, 12, 18, 24, 30, and 36 months after the treatment, respectively. After setting the best parameter via a five-fold cross-validation strategy, we calculated the AUC value in the testing dataset to characterize the ability of the model to distinguish between the dead and alive. KNN, RF, ANN, ANN, RF, and RF demonstrated the highest AUC values in predicting the survival status at 6, 12, 18, 24, 30, and 36 months (Figures 5A–E, F), respectively. Then, these constructed machine learning models were also validated by an independent dataset (GSE83300). RF, SVM, GLM, GLM, ANN, and GLM demonstrated the highest AUC values in predicting the survival status at 6, 12, 18, 24, 30, and 36 months (Figures 6A–F), respectively.
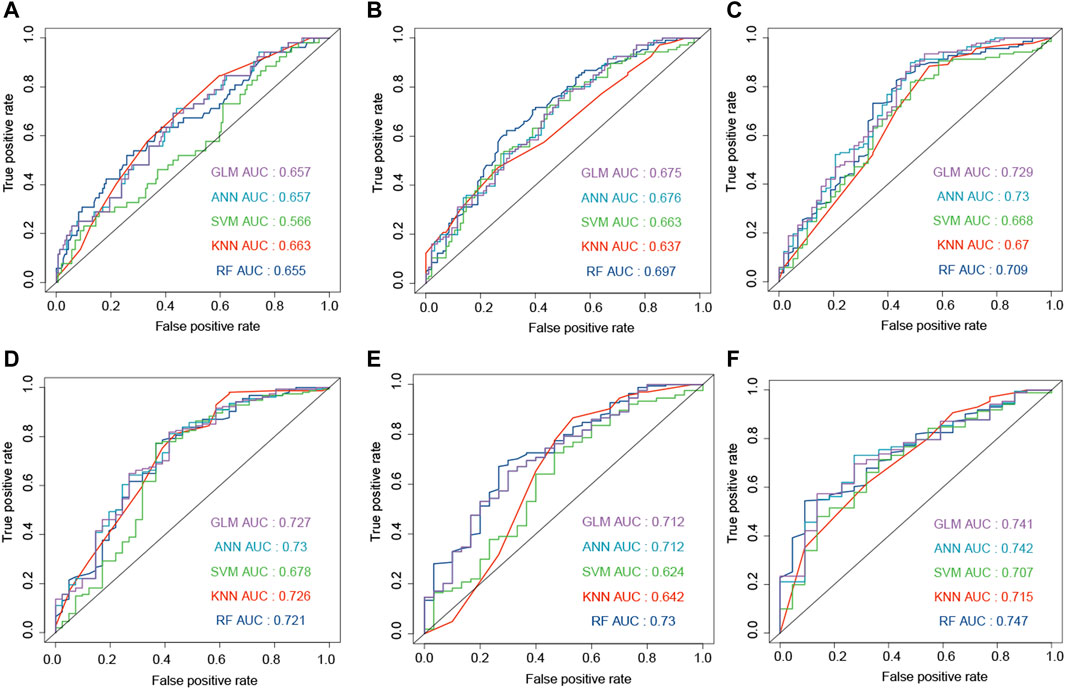
FIGURE 5. Development of the machine learning models to predict the survival status at 6 (A), 12 (B), 18 (C), 24 (D), 30 (E), and 36 (F) months based on gender, age, and ECM genes (AEBP1, F3, FLNC, IGFBP2, and LDHA). The models were trained on the training dataset, and these AUC results were calculated on the testing dataset.
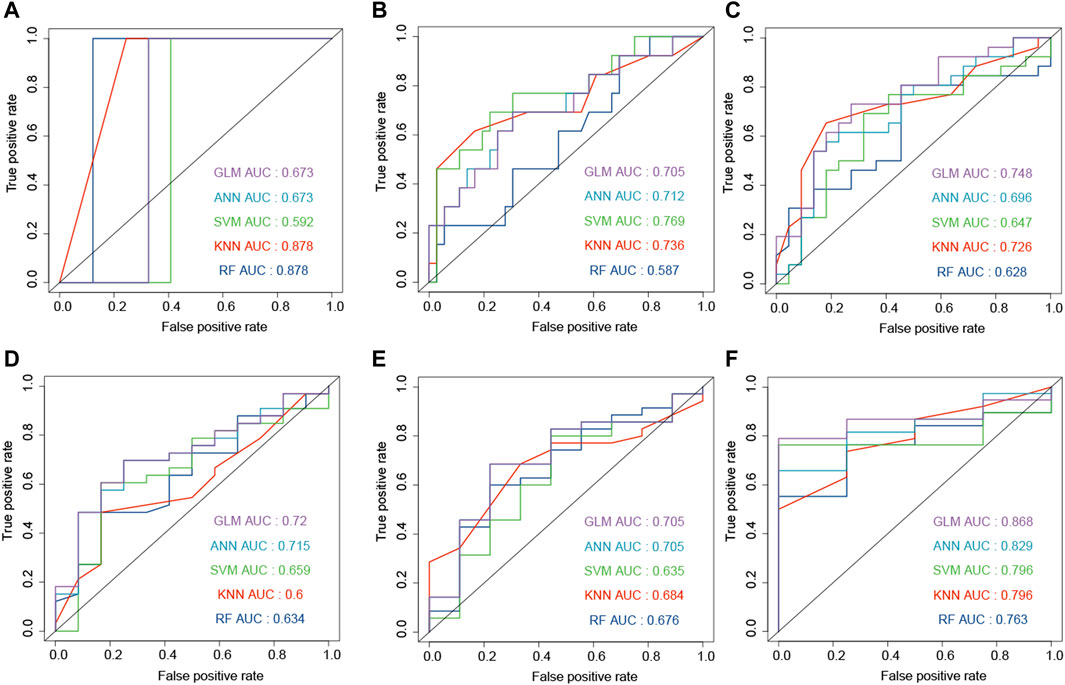
FIGURE 6. Development and evaluation of the machine learning models to predict the survival status at 6 (A), 12 (B), 18 (C), 24 (D), 30 (E), and 36 (F) months based on gender, age, and ECM genes (AEBP1, F3, FLNC, IGFBP2, and LDHA). These AUC results were calculated on the independent dataset (GSE83300).
A Web-Based Interactive Tool for Predicting Survival Probability and Plotting the Survival Curve
To make these constructed machine learning models accessible to GBM researchers, we developed a web tool to predict the survival probability of GBM patients called OSPG. OSPG can be used in five steps 1) visiting the website https://ospg.shinyapps.io/OSPG/;(2) inputting the values of five genes, including AEBP1, F3, FLNC, IGFBP2, and LDHA (gene expression values range 0–1); 3) inputting the values of age and gender (male or female); 4) selecting the machine learning models for each time point (6, 12, 18, 24, 30, and 36 months), and 5) clicking the “submit” button. An example is illustrated in Figure 7.
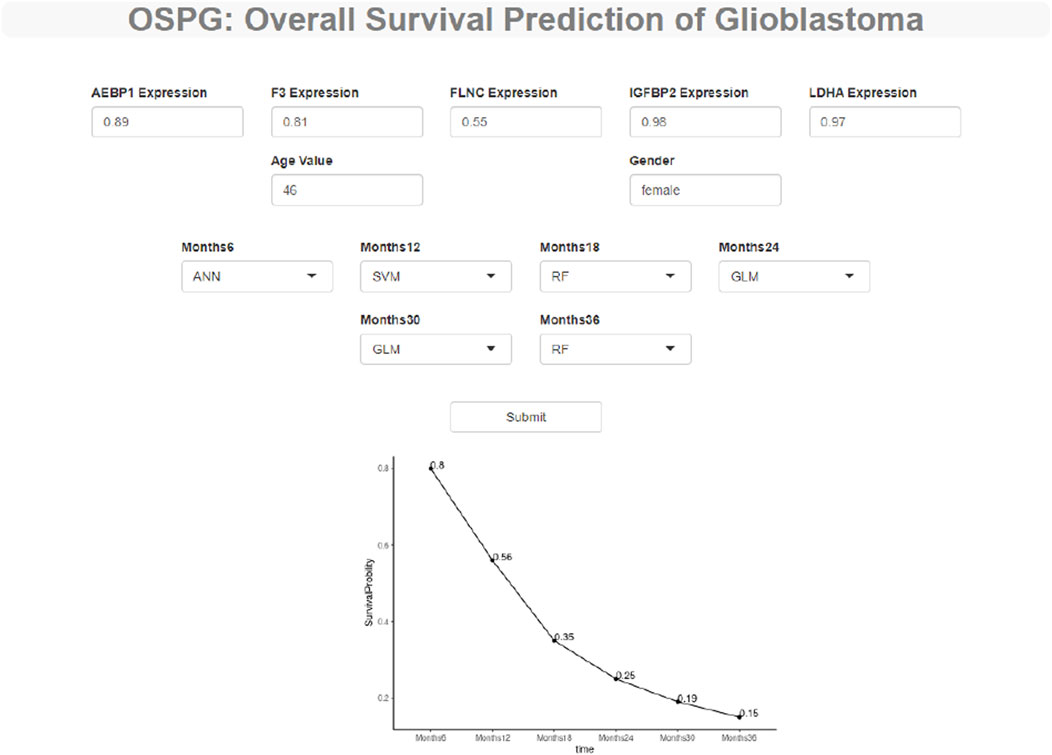
FIGURE 7. OSPG: a web tool to explore and predict the overall survival status of the glioblastoma patients. OSPG can be used in four steps: (1) via the website https://ospg.shinyapps.io/OSPG/, (2) inputting the values of five genes including AEBP1, F3, FLNC, IGFBP2, and LDHA (gene expression values range 0 to 1), (3) inputting the values of age and gender (male or female) including AEBP1, F3, FLNC, IGFBP2, and LDHA (gene expression values range 0 to 1), (4) selecting the machine learning models for each time point (6, 12, 18, 24, 30, 36 months), and (5) clicking the “submit” button.
Discussion
The prognosis of GBM is very poor; only about 5 percent GBM patients could survive more than 5 years (Delgado-Lopez and Corrales-Garcia, 2016). Currently, therapeutic options for GBM include surgery alone or adjuvant radio/chemotherapy in combination with surgical resection (Chen et al., 2020). Surgical resection is ineffective because cancer cells may have infiltrated the surrounding tissues or metastasized. In addition, it is still debatable whether systemic adjuvant medication can be administered following surgery due to the possibility of adverse effects (Abdul et al., 2018). As a result, it is critical to identify possible biomarkers for predicting GBM prognosis. The key findings of this study are as follows: 1). we identified five ECM genes associated with prognosis, and these five genes were used to calculate the ECM index. 2). We constructed the machine learning models to predict the survival status of the GBM patients at 6, 12, 18, 24, 30, and 36 months after treatment. 3). We provided a web server to predict the survival curves of GBM patients by these machine learning models.
ECM is one of the major components of the TME, and its interaction with the tumor cells promotes tumor growth and migration (Klank et al., 2017). Thus, computing the ECM scores in diverse cancers is critical for comprehending and potentially addressing various tumors thoroughly. In this study, we identified five ECM genes that are associated with prognosis and used their expression values to calculate the ECM index. The high ECM index was correlated with a negative prognosis. The predicted drugs, including podophyllotoxin, lasalocid, MG-262, and nystatin, might contribute to reversing the oncogenic roles of the ECM in GBM tumor development. Podophyllotoxin, a natural product, and its derivatives have the potential to inhibit cell growth by tubulin polymerization (Ardalani et al., 2017). Semisynthetic derivatives of podophyllotoxin have been used as therapies for cancers including leukemia, lymphoma, and GBM (Ardalani et al., 2017; Chen et al., 2013). Lasalocid could work against tumor cells by cell cycle arrest (Kim et al., 2017). MG-262 is a potent proteasome inhibitor, and more studies are needed to clarify the effect of MG-262 on tumor growth, especially GBM. Nystatin is a cholesterol-sequestering antifungal drug and could further prolong animal survival and significantly suppress tumor growth (Chen et al., 2015).
AEBP1 has the potential to bind with collagen and then contribute to collagen polymerization, which is critical for several biological processes such as tissue repair and fibrosis (Blackburn et al., 2018). The high levels of AEBP1 were found in collagen-rich tissues, including the dermal layer of the skin, the medial layer of blood vessels, and the basement membrane. Recent research has established that AEBP1 plays a critical function in carcinogenesis and progression. For example, the expression value of AEBP1 is higher in the glioma cells, and inhibition of AEBP1 could induce apoptosis of GBM cell lines (Ladha et al., 2012). F3 is the gene for encoding tissue factor (TF), and the proinvasive activity of F3 is positively correlated with the ECM–receptor interactions and the invasiveness of GBM cells (Unruh et al., 2019). FLNC is a cytoskeletal protein and could contribute to GBM metastasis by promoting ECM degradation (Kamil et al., 2019). The survival analysis results also found that the high FLNC expression was linked with a negative GBM prognosis. IGFBP2 is positively correlated with tumor grades and negatively associated with the prognosis of glioma patients (Lin et al., 2009). Similarly, LDHA expression levels and stage of the tumor are positively correlated (Di et al., 2018). The knockdown of LDHA decreased the cell growth by impairing cell cycle progression and triggering apoptosis in glioma cell lines. The cellular distribution of these selected genes was different. For AEBP1 (Layne et al., 2001), F3 (Indira et al., 2019), IGFBP2 (Gyuris et al., 2019), and LDHA (Lin et al., 2018), they are abundantly expressed in the extracellular components. However, the expression of FLNC results in cytoplasmic distribution mainly associated with actin fibers (Valdes-Mas et al., 2014).
Recently, a systematic review summarized the available models for the survival prediction of GBM (Tewarie et al., 2021). It is a challenging field since there are several problems: 1) GBM patients have a very poor prognosis. For example, in the current study, the median survival time of patients from CGGA, GSE16011, and TCGA-GBM datasets is 12, 8.7, and 9 months, respectively. The short survival time limits the ability of models to predict the prognosis. 2) Machine learning methods can only predict binary or continuous targets and are not accessible to the censored survival data, which contains survival time and survival status. In the article by Ishaan (Tewarie et al., 2021), according to the AUC (0.58–0.98), accuracy (0.69–0.98), and C-index (0.66–0.70), the prediction performance of 59 models differed greatly. For most of these models, it is hard to reach a strong sensitivity or specificity (AUC>0.8). Only seven of these models have been independently evaluated, and only three studies have converted their models into an online prediction tool. For example, a prediction model constructed by clinical information achieved a maximum C-index value of 0.66 (Gorlia et al., 2008). Another online survival probability and survival curve predictor for the patients with GBM that uses patient demographics and clinical characteristics was provided (C-index = 0.70) (Senders et al., 2020).
The advantages of this study were that it provided accurate models and constructed the web server. In the independent dataset, the machine learning models reached the AUC values of 0.878 and 0.868 in predicting the survival status at 6 and 36 months (Figure 6), respectively. In order to predict the survival curve of GBM, we constructed models to predict the survival probability of time points such as 6, 12, 18, 24, 30, and 36 months. Then, the survival curve was generated and plotted by the survival probability values.
Nevertheless, the present study has several limitations. First, although validation datasets were used in this study, the models need to be carefully assessed and validated by future prospective studies. For example, the survival status of GBM patients could be predicted by the machine learning models and expression profiles of these five genes. Then, the accuracy of our models could be validated by comparing the predicted and real survival status. Second, the roles of the selected genes in GBM also need to be tested by experiments.
Conclusion
We identified the ECM genes with prognostic power and offered potential small-molecule drugs for the treatment of GBM. The online web server based on the five ECM genes could accurately predict the survival curves of GBM patients after the diagnosis, which could be particularly useful for tailoring clinical care to the needs of the individual GBM patient.
Data Availability Statement
The original contributions presented in the study are included in the article/Supplementary Material, further inquiries can be directed to the corresponding authors.
Author Contributions
CQ and WX contributed equally to this work. All authors have helped in performing this research. CQ, UK, and DR contributed to conception and design. CQ, UK, and WX contributed to collection and assembly of data. CQ, WX, TJa, CZ, UK, SW, TJn, and DR contributed to data analysis and interpretation. All authors contributed to the writing and final approval of the manuscript.
Conflict of Interest
The authors declare that the research was conducted in the absence of any commercial or financial relationships that could be construed as a potential conflict of interest.
Publisher’s Note
All claims expressed in this article are solely those of the authors and do not necessarily represent those of their affiliated organizations, or those of the publisher, the editors, and the reviewers. Any product that may be evaluated in this article, or claim that may be made by its manufacturer, is not guaranteed or endorsed by the publisher.
Supplementary Material
The Supplementary Material for this article can be found online at: https://www.frontiersin.org/articles/10.3389/fgene.2022.851427/full#supplementary-material
References
Abdul, K. U., Houweling, M., Svensson, F., Narayan, R. S., Cornelissen, F. M. G., Küçükosmanoglu, A., et al. (2018). WINDOW Consortium: A Path Towards Increased Therapy Efficacy Against Glioblastoma. Drug Resist. Updates 40, 17–24. doi:10.1016/j.drup.2018.10.001
Ardalani, H., Avan, A., and Ghayour-Mobarhan, M. (2017). Podophyllotoxin: A Novel Potential Natural Anticancer Agent. Avicenna J. Phytomed. 7 (4), 285–294.
Becht, E., Giraldo, N. A., Lacroix, L., Buttard, B., Elarouci, N., Petitprez, F., et al. (2016). Estimating the Population Abundance of Tissue-Infiltrating Immune and Stromal Cell Populations Using Gene Expression. Genome Biol. 17 (1), 218. doi:10.1186/s13059-016-1070-5
Blackburn, P. R., Xu, Z., Tumelty, K. E., Zhao, R. W., Monis, W. J., Harris, K. G., et al. (2018). Bi-Allelic Alterations in AEBP1 lead to Defective Collagen Assembly and Connective Tissue Structure Resulting in a Variant of Ehlers-Danlos Syndrome. Am. J. Hum. Genet. 102 (4), 696–705. doi:10.1016/j.ajhg.2018.02.018
Brassart-Pasco, S., Brézillon, S., Brassart, B., Ramont, L., Oudart, J.-B., and Monboisse, J. C. (2020). Tumor Microenvironment: Extracellular Matrix Alterations Influence Tumor Progression. Front. Oncol. 10, 397. doi:10.3389/fonc.2020.00397
Chen, J.-Y., Tang, Y.-A., Li, W.-S., Chiou, Y.-C., Shieh, J.-M., and Wang, Y.-C. (2013). A Synthetic Podophyllotoxin Derivative Exerts Anti-Cancer Effects by Inducing Mitotic Arrest and Pro-Apoptotic ER Stress in Lung Cancer Preclinical Models. PLoS One 8 (4), e62082. doi:10.1371/journal.pone.0062082
Chen, X., Fan, X., Zhao, C., Zhao, Z., Hu, L., Wang, D., et al. (2020). Molecular Subtyping of Glioblastoma Based on Immune-Related Genes for Prognosis. Sci. Rep. 10 (1), 15495. doi:10.1038/s41598-020-72488-4
Chen, Y., Liu, G., Guo, L., Wang, H., Fu, Y., and Luo, Y. (2015). Enhancement of Tumor Uptake and Therapeutic Efficacy of EGFR-Targeted Antibody Cetuximab and Antibody-Drug Conjugates by Cholesterol Sequestration. Int. J. Cancer 136 (1), 182–194. doi:10.1002/ijc.28950
Dai, S., Yan, Y., Xu, Z., Zeng, S., Qian, L., Huo, L., et al. (2017). SCD1 Confers Temozolomide Resistance to Human Glioma Cells via the Akt/GSK3β/β-Catenin Signaling Axis. Front. Pharmacol. 8, 960. doi:10.3389/fphar.2017.00960
Delgado-López, P. D., and Corrales-García, E. M. (2016). Survival in Glioblastoma: A Review on the Impact of Treatment Modalities. Clin. Transl. Oncol. 18 (11), 1062–1071. doi:10.1007/s12094-016-1497-x
Di, H., Zhang, X., Guo, Y., Shi, Y., Fang, C., Yuan, Y., et al. (2018). Silencing LDHA Inhibits Proliferation, Induces Apoptosis and Increases Chemosensitivity to Temozolomide in Glioma Cells. Oncol. Lett. 15 (4), 5131–5136. doi:10.3892/ol.2018.7932
Feng, L., Qian, H., Yu, X., Liu, K., Xiao, T., Zhang, C., et al. (2017). Heterogeneity of Tumor-Infiltrating Lymphocytes Ascribed to Local Immune Status Rather Than Neoantigens by Multi-Omics Analysis of Glioblastoma Multiforme. Sci. Rep. 7 (1), 6968. doi:10.1038/s41598-017-05538-z
Friedman, J., Hastie, T., and Tibshirani, R. (2010). Regularization Paths for Generalized Linear Models via Coordinate Descent. J. Stat. Softw. 33 (1), 1–22. doi:10.18637/jss.v033.i01
Gorlia, T., van den Bent, M. J., Hegi, M. E., Mirimanoff, R. O., Weller, M., Cairncross, J. G., et al. (2008). Nomograms for Predicting Survival of Patients with Newly Diagnosed Glioblastoma: Prognostic Factor Analysis of EORTC and NCIC Trial 26981-22981/CE.3 Multicenter Study; Randomized Controlled Trial; Research Support. Lancet Oncol. 9 (1), 29–38. doi:10.1016/S1470-2045(07)70384-4
Gravendeel, L. A. M., Kouwenhoven, M. C. M., Gevaert, O., de Rooi, J. J., Stubbs, A. P., Duijm, J. E., et al. (2009). Intrinsic Gene Expression Profiles of Gliomas Are a Better Predictor of Survival Than Histology. Cancer Res. 69 (23), 9065–9072. doi:10.1158/0008-5472.CAN-09-2307
Gyuris, A., Navarrete-Perea, J., Jo, A., Cristea, S., Zhou, S., Fraser, K., et al. (2019). Physical and Molecular Landscapes of Mouse Glioma Extracellular Vesicles Define Heterogeneity. Cel. Rep. 27 (13), 3972–3987. doi:10.1016/j.celrep.2019.05.089
Huang, J., Zhang, L., Wan, D., Zhou, L., Zheng, S., Lin, S., et al. (2021). Extracellular Matrix and Its Therapeutic Potential for Cancer Treatment. Sig. Transduct. Target. Ther. 6 (1), 153. doi:10.1038/s41392-021-00544-0
Indira Chandran, V., Welinder, C., Gonçalves de Oliveira, K., Cerezo-Magaña, M., Månsson, A.-S., Johansson, M. C., et al. (2019). Global Extracellular Vesicle Proteomic Signature Defines U87-MG Glioma Cell Hypoxic Status with Potential Implications for Non-Invasive Diagnostics. J. Neurooncol. 144 (3), 477–488. doi:10.1007/s11060-019-03262-4
Kamil, M., Shinsato, Y., Higa, N., Hirano, T., Idogawa, M., Takajo, T., et al. (2019). High Filamin-C Expression Predicts Enhanced Invasiveness and Poor Outcome in Glioblastoma Multiforme. Br. J. Cancer 120 (8), 819–826. doi:10.1038/s41416-019-0413-x
Kim, K.-Y., Kim, S.-H., Yu, S.-N., Park, S.-G., Kim, Y.-W., Nam, H.-W., et al. (2017). Lasalocid Induces Cytotoxic Apoptosis and Cytoprotective Autophagy Through Reactive Oxygen Species in Human Prostate Cancer PC-3 Cells. Biomed. Pharmacother. 88, 1016–1024. doi:10.1016/j.biopha.2017.01.140
Klank, R. L., Decker Grunke, S. A., Bangasser, B. L., Forster, C. L., Price, M. A., Odde, T. J., et al. (2017). Biphasic Dependence of Glioma Survival and Cell Migration on CD44 Expression Level. Cel. Rep. 18 (1), 23–31. doi:10.1016/j.celrep.2016.12.024
Ladha, J., Sinha, S., Bhat, V., Donakonda, S., and Rao, S. M. R. (2012). Identification of Genomic Targets of Transcription Factor AEBP1 and Its Role in Survival of Glioma Cells. Mol. Cancer Res. 10 (8), 1039–1051. doi:10.1158/1541-7786.MCR-11-0488
Layne, M. D., Yet, S.-F., Maemura, K., Hsieh, C.-M., Bernfield, M., Perrella, M. A., et al. (2001). Impaired Abdominal Wall Development and Deficient Wound Healing in Mice Lacking Aortic Carboxypeptidase-Like Protein. Mol. Cel. Biol. 21 (15), 5256–5261. doi:10.1128/MCB.21.15.5256-5261.2001
Lin, H., Muramatsu, R., Maedera, N., Tsunematsu, H., Hamaguchi, M., Koyama, Y., et al. (2018). Extracellular Lactate Dehydrogenase a Release from Damaged Neurons Drives Central Nervous System Angiogenesis. EBioMedicine 27, 71–85. doi:10.1016/j.ebiom.2017.10.033
Lin, Y., Jiang, T., Zhou, K., Xu, L., Chen, B., Li, G., et al. (2009). Plasma IGFBP-2 Levels Predict Clinical Outcomes of Patients with High-Grade Gliomas. Neuro Oncol. 11 (5), 468–476. doi:10.1215/15228517-2008-114
Monteiro, A., Hill, R., Pilkington, G., and Madureira, P. (2017). The Role of Hypoxia in Glioblastoma Invasion. Cells 6 (4), 45. doi:10.3390/cells6040045
Ostrom, Q. T., Gittleman, H., Liao, P., Vecchione-Koval, T., Wolinsky, Y., Kruchko, C., et al. (2017). CBTRUS Statistical Report: Primary Brain and Other Central Nervous System Tumors Diagnosed in the United States in 2010-2014. Neuro Oncol. 19, v1–v88. doi:10.1093/neuonc/nox158
Ritchie, M. E., Phipson, B., Wu, D., Hu, Y., Law, C. W., Shi, W., et al. (2015). Limma Powers Differential Expression Analyses for RNA-Sequencing and Microarray Studies. Nucleic Acids Res. 43 (7), e47. doi:10.1093/nar/gkv007
Roviello, G., Petrioli, R., Cerase, A., Marsili, S., Miracco, C., Rubino, G., et al. (2013). A Husband and a Wife with Simultaneous Presentation of Glioblastoma Multiforme: A Case Report. Case Rep. Oncol. 6 (3), 538–543. doi:10.1159/000356098
Senders, J. T., Staples, P., Mehrtash, A., Cote, D. J., Taphoorn, M. J. B., Reardon, D. A., et al. (2020). An Online Calculator for the Prediction of Survival in Glioblastoma Patients Using Classical Statistics and Machine Learning. Neurosurg. 86 (2), E184–E192. doi:10.1093/neuros/nyz403
Tang, Z., Li, C., Kang, B., Gao, G., Li, C., and Zhang, Z. (2017). GEPIA: A Web Server for Cancer and Normal Gene Expression Profiling and Interactive Analyses. Nucleic Acids Res. 45 (W1), W98–W102. doi:10.1093/nar/gkx247
Tewarie, I. A., Senders, J. T., Kremer, S., Devi, S., Gormley, W. B., Arnaout, O., et al. (2021). Survival Prediction of Glioblastoma Patients-Are We There Yet? A Systematic Review of Prognostic Modeling for Glioblastoma and Its Clinical Potential. Neurosurg. Rev. 44 (4), 2047–2057. doi:10.1007/s10143-020-01430-z
Unruh, D., Mirkov, S., Wray, B., Drumm, M., Lamano, J., Li, Y. D., et al. (2019). Methylation-Dependent Tissue Factor Suppression Contributes to the Reduced Malignancy of IDH1-Mutant Gliomas. Clin. Cancer Res. 25 (2), 747–759. doi:10.1158/1078-0432.CCR-18-1222
Valdés-Mas, R., Gutiérrez-Fernández, A., Gómez, J., Coto, E., Astudillo, A., Puente, D. A., et al. (2014). Mutations in Filamin C Cause a New Form of Familial Hypertrophic Cardiomyopathy. Nat. Commun. 5, 5326. doi:10.1038/ncomms6326
Keywords: Glioblastoma, machine learning, ECM, survival prediction, web server
Citation: Qian C, Xiufu W, Jianxun T, Zihao C, Wenjie S, Jingfeng T, Kahlert UD and Renfei D (2022) A Novel Extracellular Matrix Gene-Based Prognostic Model to Predict Overall Survive in Patients With Glioblastoma. Front. Genet. 13:851427. doi: 10.3389/fgene.2022.851427
Received: 09 January 2022; Accepted: 30 March 2022;
Published: 17 June 2022.
Edited by:
Maurice H. T. Ling, Temasek Polytechnic, SingaporeReviewed by:
Wanyan Wang, Foundation Medicine Inc., United StatesYu-Chan Chang, National Yang Ming Chiao Tung University, Taiwan
Copyright © 2022 Qian, Xiufu, Jianxun, Zihao, Wenjie, Jingfeng, Kahlert and Renfei. This is an open-access article distributed under the terms of the Creative Commons Attribution License (CC BY). The use, distribution or reproduction in other forums is permitted, provided the original author(s) and the copyright owner(s) are credited and that the original publication in this journal is cited, in accordance with accepted academic practice. No use, distribution or reproduction is permitted which does not comply with these terms.
*Correspondence: Ulf D. Kahlert, dWxmLmthaGxlcnRAbWVkLm92Z3UuZGU=; Du Renfei, cmVkdTEwMEB1bmktZHVlc3NlbGRvcmYuZGU=
†These authors have contributed equally to this work