 Lovejit Singh1†
 Guriqbal Singh Dhillon2†
 Sarabjit Kaur2†Sandeep Kaur Dhaliwal1
 Amandeep Kaur2†
 Palvi Malik2†
 Ashok Kumar3Ranjit Kaur Gill1
 Satinder Kaur2*†
- 1Department of Plant Breeding and Genetics, Punjab Agricultural University, Ludhiana, India
- 2School of Agricultural Biotechnology, Punjab Agricultural University, Ludhiana, India
- 3Regional Research Station, Punjab Agricultural University, Gurdaspur, India
Blackgram (Vigna mungo L. Hepper) is an important tropical and sub-tropical short-duration legume that is rich in dietary protein and micronutrients. Producing high-yielding blackgram varieties is hampered by insufficient genetic variability, absence of suitable ideotypes, low harvest index and susceptibility to biotic-abiotic stresses. Seed yield, a complex trait resulting from the expression and interaction of multiple genes, necessitates the evaluation of diverse germplasm for the identification of novel yield contributing traits. Henceforth, a panel of 100 blackgram genotypes was evaluated at two locations (Ludhiana and Gurdaspur) across two seasons (Spring 2019 and Spring 2020) for 14 different yield related traits. A wide range of variability, high broad-sense heritability and a high correlation of grain yield were observed for 12 out of 14 traits studied among all environments. Investigation of population structure in the panel using a set of 4,623 filtered SNPs led to identification of four sub-populations based on ad-hoc delta K and Cross entropy value. Using Farm CPU model and Mixed Linear Model algorithms, a total of 49 significant SNP associations representing 42 QTLs were identified. Allelic effects were found to be statistically significant at 37 out of 42 QTLs and 50 known candidate genes were identified in 24 of QTLs.
Introduction
Blackgram (Vigna mungo L. Hepper), a diploid (2n = 2X = 22), short duration legume crop of family Leguminaceae, was domesticated in Northern South Asia from progenitor Vigna mungo var. silvestris (Lukoki et al., 1980). It is cultivated throughout Southeast Asia because of its multiple benefits to soil and human health. It is nutritionally important crop with about 25% protein—nearly three times that of cereals, 60% carbohydrates, 1.3% fat (Das et al., 2021) as well as important vitamins and minerals (Ghafoor et al., 2001), making it a balanced vegan diet when supplemented with cereals. The ability of its roots to fix atmospheric nitrogen (42 kg/ha/year) (Dey et al., 2020) contribute towards soil health while deep-roots prevents soil erosion by binding soil particles. Short duration of blackgram makes it suitable for intercropping with corn or millet or rotation with cereals like rice or wheat (Muthusamy and Pandiyan, 2018), adding another benefit for farmer.
India is the largest producer and consumer of blackgram as it is colossally grown in almost every agro-climatic zone (Raizada and Souframanien, 2021). However, the crop accounts for only 13% of the total area (56.02 lakh hectares) and 10% of total pulses production (30.60 lakh tons) in India (Muthusamy and Pandiyan, 2018) with productivity of 5.46 quintals per hectare (Singh et al., 2020). Moreover, around 2-3 million tons of pulses are imported annually to fulfill the domestic consumption requirement. Despite the economic and nutritional value of black Gram, the sluggish growth in production is due to lack of commercialized market setup, multiple biotic stresses (mosaic, seedling blight, leaf blight, leaf crinkle virus, leaf folder, Bihar hairy caterpillar, whitefly) and abiotic stresses (drought, salinity, waterlogging). Photo- and thermo-sensitivity of crop with indeterminate habit of flowering and fruiting leads to competition of assimilates between vegetative and reproductive sinks throughout the growth period causing low harvest index and poor grain yield (Somta et al., 2019; Sahu et al., 2020).
The expansion of the crop is constrained by lack of genetic and genomic resources along with limited diversity (Chaitieng et al., 2006; Gupta et al., 2008; Somta et al., 2019 A systematic program of identification, genetic and genomic characterization and utilization of diverse germplasm is required for successfully decoding the genetic architecture of agronomically important traits for blackgram improvement. Genome and transcriptome sequencing (Pootakham et al., 2021; Raizada and Souframanien, 2021), developing dense molecular linkage maps, and using high-throughput genotyping techniques can widen the horizons improvement of this crop. Genotyping–by- sequencing (GBS) is one of the cost-efficient genomic techniques which includes multiplex sequencing of a subset of the genome and generates numerous SNP markers for linkage mapping (Varshney et al., 2009; Elshire et al., 2011; Noble et al., 2018). Genome wide association studies (GWAS) coupled with GBS have been promising tool for estimating the genetic diversity in different crops of soybean (Hwang et al., 2014), chickpea (Plekhanova et al., 2017), cowpea (Xu et al., 2017), pigeonpea (Varshney et al., 2009), and mungbean (Sokolkova et al., 2020) providing insights to underlying genetic architecture of complex traits (Lorenz et al., 2010; Scherer and Christensen, 2016).
In the present study we performed the GWAS on diverse blackgram germplasm panel to assess its genetic diversity and population structure, and to identify MTA (Marker trait associations) involved in yield and yield related traits using GBS. This study provides a unique genomic resource for the genetic dissection of important traits aimed at blackgram improvement.
Materials and Methods
Plant Material and Field Trials
A panel consisting of 100 blackgram (V. mungo) genotypes was used for the present study. These included 54 genotypes procured from National Bureau of Plant Genetic Resources (NBPGR), New Delhi, India, while, the remaining genotypes were from germplasm collection of Punjab Agricultural University (PAU), Ludhiana, India (Supplementary Table S1). The genotypes were evaluated using a simple lattice design (10 × 10), in two replications at two locations (Ludhiana and Gurdaspur) across two seasons (Spring 2019 and Spring 2020). The seeds were sown in a 2 m long row with 10 cm plant to plant spacing and 30 cm row to row spacing. Ludhiana (30.9°N, 75.85°E) lies in a sub-tropical zone characterized by relatively high temperatures and low precipitation while Gurdaspur region (32.02°N, 75.24°E) is characterized by lower temperature and high humidity coupled with abundant rainfall. The weekly mean temperature, relative humidity and rainfall for Ludhiana and Gurdaspur have been given in Supplementary Figure S1.
Phenotypic Evaluation and Statistical Analysis
Data was collected in three replicates from five randomly selected plants of each genotype in each replicate for plant height at 90% pod maturity (PHM), branches per plant (BpP), nodes per plant (NpP), internodal length (IL = PHM/NpP), clusters per plant (CpP), pods per plant (PpP), pod length (PL), seeds per pod (SpP), biological yield per plant (BYpP), yield per plant (YpP), harvest index (HI) and hundred seed weight (HSW). Days to 50% flowering (DtF) and days to 90% pod maturity (DtM) were recorded based on the entire plot. For phenotypic analysis, environments were designated as E1 (Ludhiana, year 2019), E2 (Ludhiana, year 2020), E3 (Ludhiana combined for years 2019 & 2020), E4 (Gurdaspur, year 2019), E5 (Gurdaspur, year 2020) and E6 (Gurdaspur combined for years 2019 & 2020). Due to the significant differences between two selected locations, combined analysis over two selected locations has not been done. Descriptive statistical analysis across all the environments was done using Meta-R v6.0 software (Alvarado et al., 2020). Statistical analysis for individual and multi-environment was performed using “lme4” (Bates et al., 2015) and “Residual Maximum Likelihood (REML)” (Laird and Ware, 1982) methods. The linear model for analyzing individual environments for simple lattice design was done using the formula:
where Yijk and Yijkl represent the trait of interest, μ is the overall mean effect, Repi is the effect of ith replicate, Blockj (Repi) is the effect of jth incomplete block within the ith replicate, Genk is the effect of the kth genotype and εijk is the error effect associated with the ith replication, jth incomplete block and kth genotype, assumed to be normally distributed with zero mean and variance σ2ε (Alvarado et al., 2020). Yearl and Genl x Yeari are the effects of the lth year and Genotype x Year (G x Y) interactions represented by effect on the ith genotype in the lth year in the linear model for integrated analysis for multi-environment (across the years). The resulting analysis produced the adjusted trait phenotypic values as BLUPs (Best linear unbiased predictions) within and across environments. The genotypes are considered random effects in the BLUPs model, minimizing/eliminating the effect of the environment from phenotypic effects. The broad-sense heritability of trait at individual environment and across environments was calculated as
Where
where t is the cumulative Student’s t-distribution, 0.05 is the selected α level (5%), dfErr is the degrees of freedom for error in the linear mixed model, and ASED is the average standard error of the differences of the means. The coefficient of variation (%) was calculated as:
where MSE is the mean squared error, and Grand mean is the mean of the trait. BLUPs for recorded traits in all environments were plotted using the ggplot2 v3.3.2 package (Wickham, 2016) in R v4.0.3 (Core R Team 2019).
DNA Isolation and Genotyping
Total genomic DNA was isolated from fresh leaves of single plant of each genotype using modified cetyl trimethyl ammonium bromide (CTAB) method (Saghai-Maroof et al., 1984). Genotyping-by-sequencing (GBS) of DNA samples was outsourced to Novogene Co. Ltd., China. The GBS library was prepared using double digest restriction enzyme DNA (ddRAD) and sequencing was done with Illumina HiSeq 2000. The raw FASTQ files (obtained from Illumina pipeline CASAVA v1.8.2) were processed for quality control and filtered using Trimmomaticv0.39 software (Bolger et al., 2014) Reads with no matching barcode or cut sites overhangs, having more than 10% unidentified bases (N), with adapter dimers, with lower quality reads, and with Qphred score less than 34, were excluded from further analysis. High-quality paired end reads were aligned using Burrows-Wheeler Aligner (BWA) (Li et al., 2009) to Vigna radiata reference genome (ftp://ftp.ncbi.nlm.nih.gov/genomes/all/GCF/000/741/045/GCF_000741045.1_Vradiata ver6). A quality threshold score of 10 was applied to validate SNP loci (Wu et al., 2020). Sorted binary alignment map (BAM) files were converted to variant caller format (vcf) files using mpileup function of bcftools v1.10.2 in samtools v1.10 software package (Li et al., 2009) with minimum read depth ≥4. Haplotype map (hapmap) format files were generated from vcf files using Tassel v5.0 software (Bradbury et al., 2007). After SNP calling, raw hapmap file was filtered by removing indels, minor allele frequency (maf) > 0.05, genotype missing data less than 10% and heterozygosity less than 30% (Torkamaneh et al., 2020). The generated raw reads were submitted to the NCBI sequence read archives (SRA) with accession number PRJNA802066.
Population Structure and Phylogeny Analysis
Bayesian-based approach in STRUCTURE v2.3.4 software (Pritchard et al., 2000) using a burn-in period of 10,000 and Markov chain Monte Carlo iterations of 100,000 for k ranging from 1 to 8 was done to investigate the population structure of germplasm. Evanno’s method (Evanno et al., 2005) and cross-entropy method (Chan and Kroese, 2012) were used to obtain an optimum number of sub-populations. Filtered SNPs were used to calculate genetic distance among genotypes and the phylogenetic tree was constructed using neighbour-joining tree in TASSEL v5.0 (Bradbury et al., 2007) and visualized in iTOL v5 (Letunic and Bork, 2016).
Genome-Wide Association Analysis
Filtered SNPs and BLUPs were used to perform association analysis using the Mixed Linear Model (MLM) (Zhang et al., 2010) and FarmCPU algorithms (Liu X. et al., 2016) with GAPIT v3 (Lipka et al., 2012) in R v4.0.3 (Core R Team 2019). The FarmCPU method was used to control false positives and false negatives by iteratively using a fixed-effect model (FEM) and random effect model (REM), testing marker associations from FEM as covariates in REM. p-value of 0.001 or -log10 p-value of 3.00 was used as a threshold to determine the significance of association (Ikram et al., 2020). The marker-trait associations (MTAs) identified for the same trait within a region of 100bp was considered as part of one QTL. The phenotypic variation explained (PVE) by each significant SNP was calculated as the squared correlation between the phenotype and genotype of the associated SNP (Bhandari et al., 2020). MTAs were considered stable QTLs if they were identified across all the environments of the respective locations with -log10 p-value ≥ 3 and PVEW ≥10%. t-test based determination of significance based on phenotypic data in two allelic groups was estimated at p-value ≤ 0.05 (Xiong et al., 2019).
Postulation of Candidate Genes and KEGG Pathway Analysis
Candidate genes were postulated using the functional gene annotations of Vigna radiata reference genome (www.ncbi.nlm.nih.gov/assembly/GCF_000741045.1). A window of 200-kb region, upstream and downstream of the associated SNPs was searched to identify already reported candidate genes related to different traits studied (Park et al., 2019). Selected candidate genes were subjected to Kyoto Encyclopedia of Genes and Genomes (KEGG) analysis using Omics box 2.0.36 combined pathway analysis plugin.
Results
Phenotypic Evaluation
All the recorded traits showed high variability across the six given environments (Figure 1). All the traits followed normal distribution if considered in environments of each location however if compared across the two locations, the distribution of traits showed skewness. All the genotypes performed better in Gurdaspur than in Ludhiana. The negative skewness of trait data for the Gurdaspur location indicated an overall better performance of genotypes there, as compared to Ludhiana (Figure 1; Table 1). Since BLUPs accounted for the variation across the years for individual locations, the phenotypic evaluation is explained only for E3 and E6 to explain the overall variation at a particular location, for ease of understanding the variations (Table 1; Supplementary Table S2). DtM, and PL at Gurdaspur, and HI at Ludhiana were negatively skewed while all the other traits were either positively skewed or normally distributed (Figure 1). Genotypes sown in Gurdaspur showed delayed flowering (E6: 40.65–49.27 days) as compared to Ludhiana (E3: 39.42–47.08 days). The variation in DtM at Gurdaspur (E6: 68.88–90.73 days) were higher than at Ludhiana (E3:63.62–73.33 ± 2.3 days) with delayed maturation at Gurdaspur. The observed range of CpP and PpP was 5.59–17.08, and 12.07–40.43, respectively, at Ludhiana (E3) whereas 7.62–23.35, and 17–50.28, respectively, at Gurdaspur (E6), indicating better plant phenology at Gurdaspur. The range of PL was slightly more in Gurdaspur (E6: 03.85–05.16 cm) than Ludhiana (E3: 03.66–04.46 cm), eventually leading to higher SpP in Gurdaspur (E6: 05.63–07.68) than Ludhiana (E3: 05.45–07.08). Larger variability along with higher values were observed for BYpP at Gurdaspur (E6: 14.94–45.85 g) relative to Ludhiana (E3: 13.57–30.83 g). At Ludhiana (E3), YpP ranged from 2.45 to 8.44 g whereas it varied from 2.83 to 9.83 g at Gurdaspur (E6). HSW ranged from 3.71 to 5.26 g at Ludhiana (E3) and 4.12–5.33 g at Gurdaspur (E6). The five best performing genotypes representing best of all the traits at Ludhiana and Gurdaspur are presented in Supplementary Table S3.
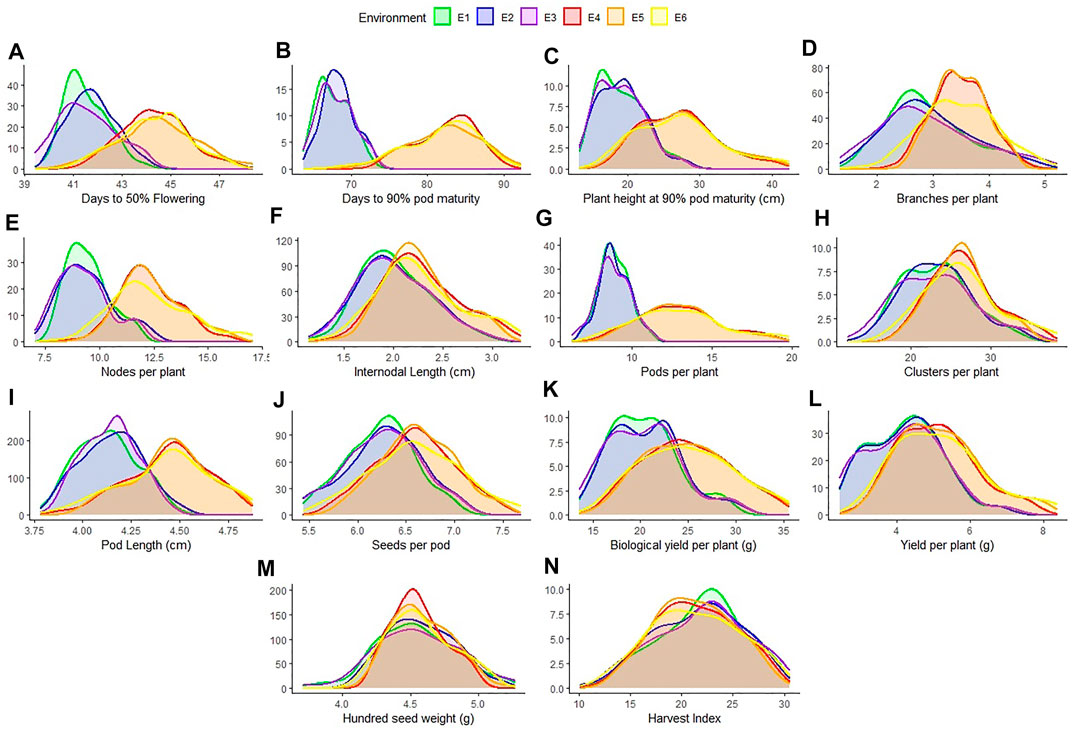
FIGURE 1. Distribution of 14 characters measured for 100 blackgram germplasm lines across all environments- Ludhiana 2019 (E1); Ludhiana 2020 (E2); Ludhiana combined across years (E3); Gurdaspur 2019 (E4); Gurdaspur 2020 (E5) and Gurdaspur combined across years (E6).
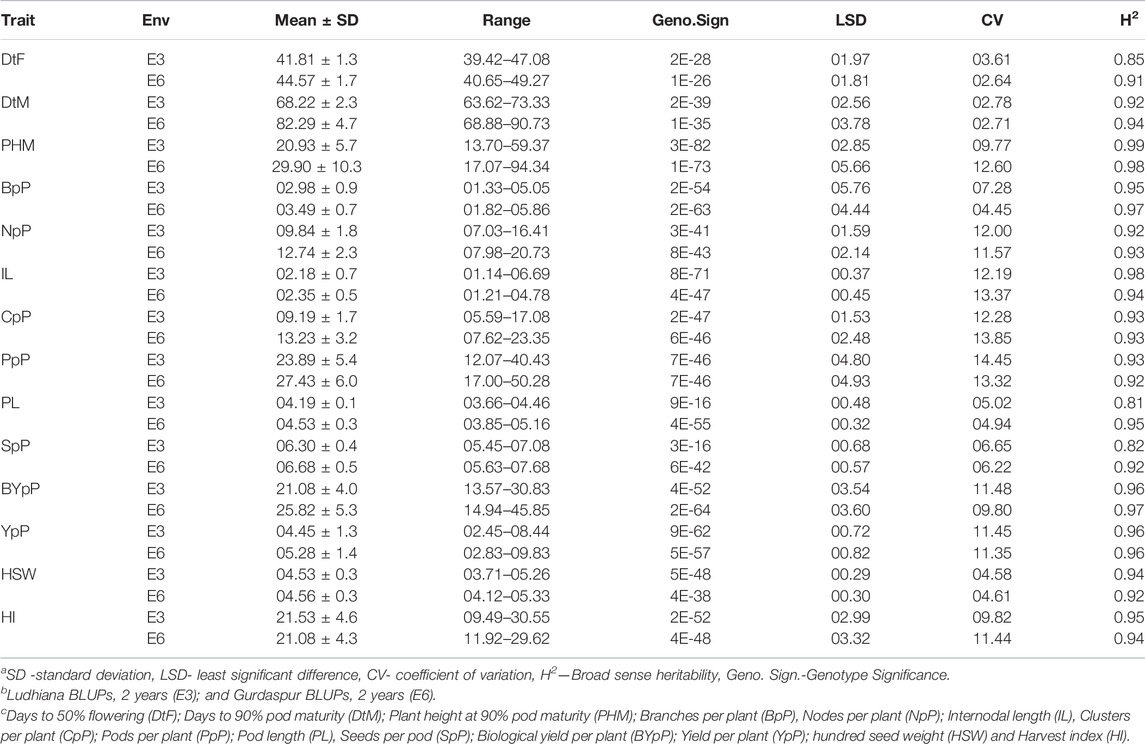
TABLE 1. Phenotypic evaluation of 100 V. mungo genotypes for 14 traits recorded at two locations of Ludhiana and Gurdaspur as BLUPs of 2 years.
Higher broad sense heritability (H2) for all traits under all environments suggested strong genetic control (Table 1). Highest H2 was observed for PHM (0.99 and 0.98), whereas lowest for DtF (0.61 and 0.91) both at Ludhiana and Gurdaspur. CpP (E3—0.93; E6—0.93), PpP (E3—0.93; E6—0.92), PL (E3—0.81; E6—0.95), SpP (E3—0.82; E6—0.92), BYpP (E3—0.96; E6—0.97), YpP (E3—0.96; E6—0.96), HSW (E3—0.94; E6—0.92) and HI (E3—0.95; E4 - 0.94) also recorded high H2.
SNP Calling
A total of 35, 49,948 raw physically mapped SNPs were obtained through GBS using the genome sequence of Vigna radiata as reference (Kang et al., 2014). Of these SNPs, 26, 39,464 were mapped onto 11 chromosomes while 9, 10,484 were mapped to non - chromosomal contigs. After filtering only 6,967 SNPs were retained of which 2,344 SNPs mapped to non-chromosomal contigs were removed and 4,623 on chromosomal regions used for further analysis (Supplementary Table S4, Figure 2). The highest density of SNPs was observed in Chr 4 (18.60 markers per Mb), whereas the lowest density was observed in Chr 3 (4.86) with an average density of 15.23 markers per Mb.
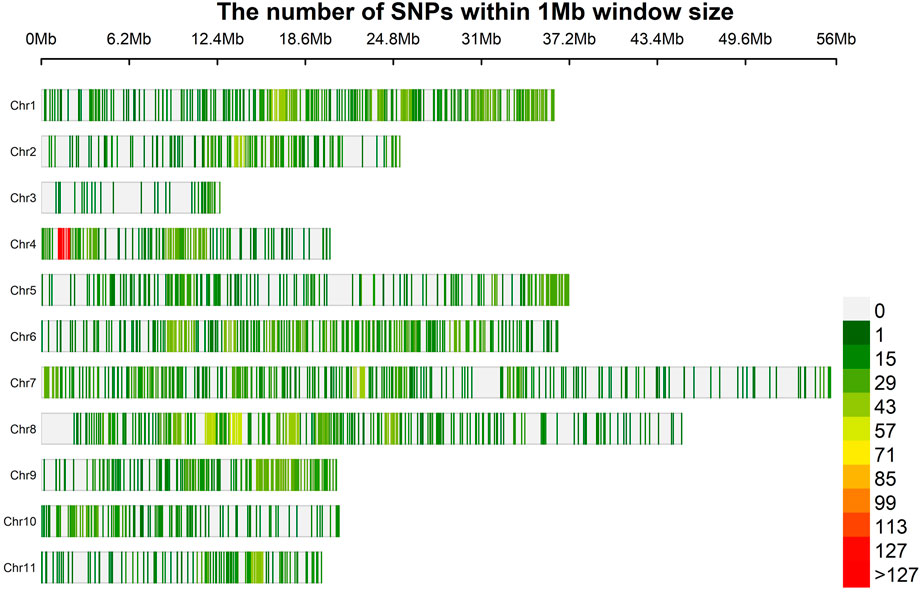
FIGURE 2. Physical map of 4,623 SNPs identified by GBS of 100 blackgram germplasm lines showing all the 11 chromosomes. Physical position is also shown in million of base pairs (Mb) based. SNP density is also provided in colours Dark Green (1) to Red (127) to reveal the distribution among chromosomes.
Population Structure and Phylogenetic Analysis
Four sub-populations (K = 4) were depicted by both the methods of second-order rate of change of the likelihood (Figure 3A) as well as cross-entropy value (Figure 3B). The graphical representation of four sub-populations against the admixture coefficient showed that more than 50% of the genotypes contributed to one sub population (Figure 3C). The allele frequency divergence was highest between sub-population two and four and the lowest between 3 and 4 (Supplementary Table S5). Average distances or expected heterozygosity of individuals within the same cluster were 0.3780 (sub-population 1), 0.2719 (sub-population 2), 0.0551 (sub-population 3) and 0.0250 (sub-population 4) (Supplementary Table S5). The mean Fst value of sub-populations 1, 2, 3 and four were 0.0203, 0.4537, 0.8040 and 0.9098, respectively (Supplementary Table S5). Multivariate analysis also classified the germplasm into four clusters affirming the results of structure analysis. The germplasm’s phylogenetic structure using an unweighted neighbour-joining tree showed the distribution of the different genotypes among the sub-populations (Figure 3D).
FIGURE 3. Population structure of 100 blackgram germplasm lines using 4623 SNP markers (A) determination of number of sub-populations by DeltaK method by Evanno et al., 2005 (B) determination of number of sub-populations using cross entropy value method by Chan and Kroese, 2012 (C) population structure at k = 4 (D) phylogenetic analysis of 100 blackgram germplasm lines depicting four sub-populations.
Genome Wide Association Study
A total of 49 stable MTAs contributing to 42 QTLs were found to be significantly associated (-log10 p-value ≥ 3, PVE >10%) with 12 of the 14 traits studied, across the three environments of the each locations (Figure 4; Table 2; Supplementary Table S6). GWAS conducted using FarmCPU and MLM algorithms identified 31 and 27 QTLs, respectively of which 16 QTLs were common between two methods. However, only two MTAs Q. PHM.4 & Q. PHM.8 were significantly associated with PHM across both the locations. The negative log10 p-value of QTLs ranged from 3.009 to 5.112, whereas the PVE ranged from 10.06–24.26%. Among 42 QTLs identified in the study, four QTLs were associated with YpP, eight with PHM, one with BpP, two with NpP, four with IL, five with CpP, one with PL, four with SpP two with BYpP, seven with HI and three with HSW. However, no significant associations were obtained for DtM and PpP. SNPs S8.1.13991269 and S8.1.19533014, on chromosome 8, were found to be associated with two traits each i.e., PHM, IL (Q. PHM.8 and Q. IL.8) and YpP, HI (Q.YpP.8 and Q. HI.8.2), respectively (Figure 5).
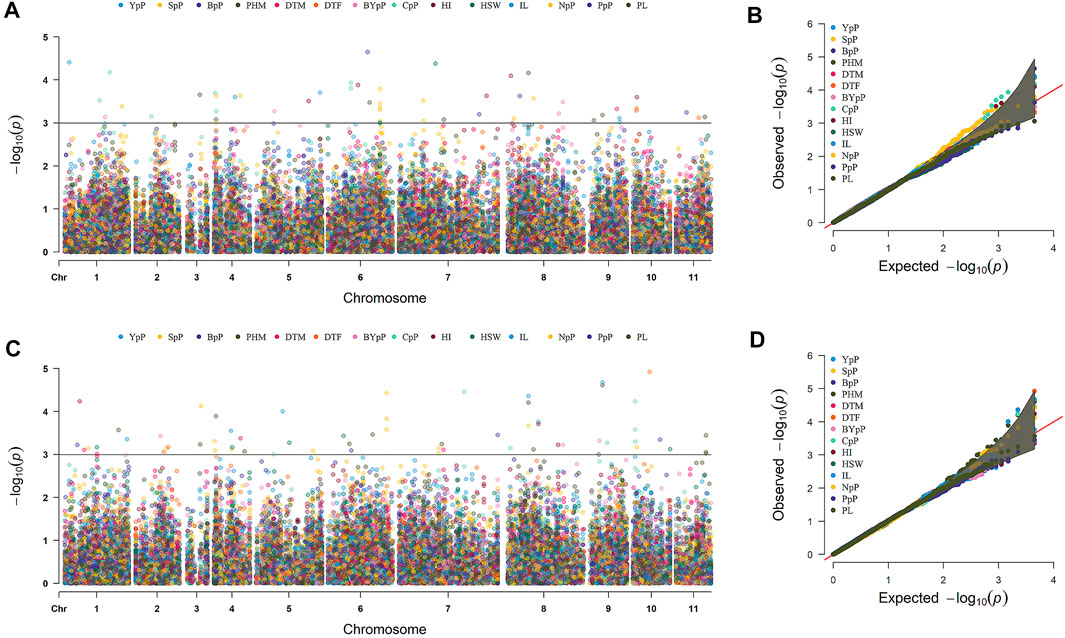
FIGURE 4. Marker trait associations for different traits detected by genome wide association study across two different locations Ludhiana (A,B) and Gurdaspur (C,D) as manhattan plots and QQ-plots using 4623 SNP markers. #Days to 50% flowering (DtF); Days to 90% pod maturity (DtM); Plant height at 90% pod maturity (PHM); Nodes per plant (NpP); Internodal length (IL), Clusters per plant (CpP); Pods per plant (PpP); Seeds per pod (SpP); Biological yield per plant (BYpP); Yield per plant (YpP); hundred seed weight (HSW) and Harvest index (HI).
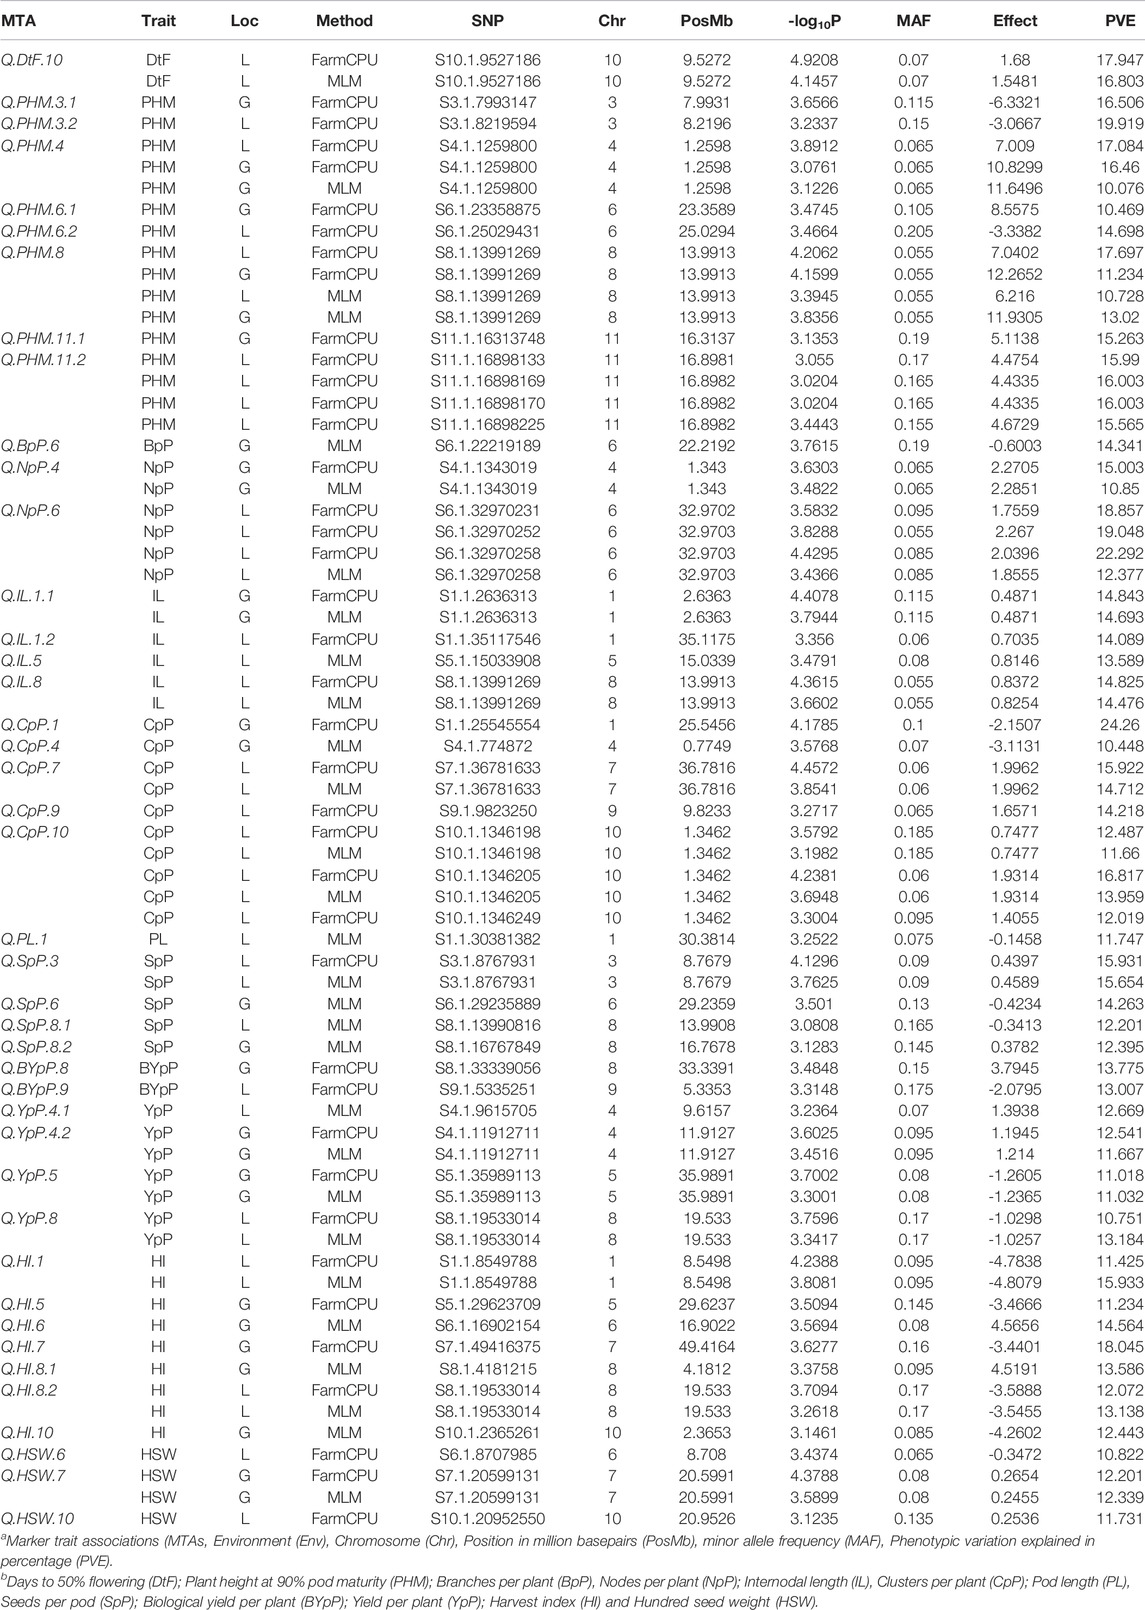
TABLE 2. MTAs identified through Genome wide association study for 100 Vigna mungo germplasm lines in all the enviornments of two locations Ludhiana (L) or Gurdaspur (G) using FarmCPU and MLM algorithms.
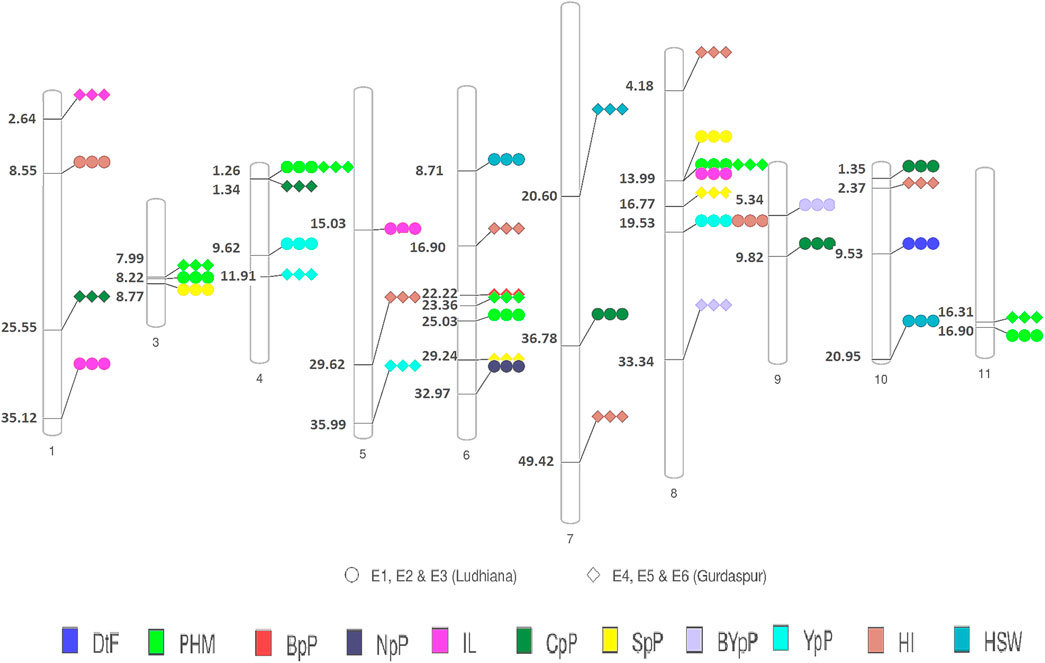
FIGURE 5. Physical map of QTLs of different traits detected by GWAS in the present study. Circles represent detection of across different environments at Ludhiana and diamonds represent detection of across different environments at Gurdaspur ##Days to 50% flowering (DtF); Days to 90% pod maturity (DtM); Plant height at 90% pod maturity (PHM); Nodes per plant (NpP); Internodal length (IL), Clusters per plant (CpP); Pods per plant (PpP); Seeds per pod (SpP); Biological yield per plant (BYpP); Yield per plant (YpP); hundred seed weight (HSW) and Harvest index (HI).
A few genomic regions harbored multiple significantly associated SNPs, as Q. PHM.11.2 had four SNPs (-log10 p-value 3.0114–3.5826 and PVE 15.193–16.439%), Q. NpP.6 (-log10 p-value 3.15–4.77, PVE 15.69–23.89) and Q. CpP.10 both had three SNPs (-log10 p-value 3.11–4.66 and PVE 11.29–18.07%), whereas other QTLs were defined by a single SNP. Two QTLs for plant height at 90% pod maturity Q. PHM.4 and Q. PHM.8 showed consistent effect across all environments of both the locations. Among four QTLs identified for YpP, two (QTLs Q. YpP.4.1 and Q. YpP.8) were detected at Ludhiana, whereas Q. YpP.4.2 and Q. YpP.5 were detected at Gurdaspur. Three QTLs for HSW were detected, two for Ludhiana and one for Gurdaspur (Q.HSW.7) which was detected by both the FarmCPU (-log10 p-value 4.38 and PVE 12.2%) and MLM (-log10 p-value 3.59 and PVE 12.34%) algorithms. Out of seven QTLs for HI, two were detected for Ludhiana (Q. HI.1 and Q. HI.8.2) and five were detected for Gurdaspur (Q. HI.5, Q. HI.6, Q. HI.7, Q. HI.8.1 and Q. HI.10). The phenotypic variation explained (PVE) by significant SNPs under FarmCPU method ranged from 10.751% (Q.YpP.8) to 22.292% (Q.NpP.6) at Ludhiana and 10.47% (Q. PHM.6.1) to 24.26% (Q. CpP.1) at Gurdaspur, whereas under MLM method, it ranged from 10.73% (Q.SpP.8.1) to 16.80% (Q.PHM.8) at Ludhiana and 10.08% (Q.PHM.4) to 14.69% (Q.CpP.4) at Gurdaspur.
Allelic Effects
Out of 49 SNPs/MTAs, 44 SNPs representing 37 QTLs showed significant difference, whereas five SNPs representing five QTLs were found to be non-significant (using the t-test statistic) for the respective traits (Supplementary Table S7, Supplementary Figures S2A–I. A total of 32, 32, 32, 28, 28 and 28 SNPs were statistically and significantly different for respective traits under E1, E2, E3, E4, E5 and E6, respectively. A total of 15 SNPs associated with 12 QTLs namely, Q. IL.1.1, Q. IL.8, Q. NpP.6, Q. PHM.11.1, Q. PHM.11.2, Q. PHM.3.1, Q. PHM.3.2, Q. PHM.4, Q. PHM.6.1, Q. PHM.6.2, Q. PHM.8, and Q. SpP.8.2 were found to be significantly different in all of the six environments studied. The 28 SNP associations were significant in three of the six environments. The superior and inferior alleles along with allele count (%) and significantly different mean values observed at Ludhiana (E3) and Gurdaspur (E6) and are presented in Supplementary Table S8. The allele with SNP GG associated with Q. SpP.8.2 was found to be superior at Ludhiana, whereas alternative allele was found to be superior at Gurdaspur. Allelic effects of YpP, HI and HSW are presented in Figure 6. The significant phenotypic differences produced by superior and inferior alleles for YpP were 1.3 g at Ludhiana (E3) by Q. YpP.4.1; 1.38 g at Gurdaspur (E6) by Q. YpP.4.2; 1.26 g at Gurdaspur (E6) by Q. YpP.5 and 0.94 g at Ludhiana (E3) by Q. YpP.8; whereas significant phenotypic differences produced by superior and inferior alleles for HI were 3.91% at Ludhiana (E3) by Q. HI.1; 3.19% at Gurdaspur (E6) by Q. HI.5; 3.89% at Gurdaspur (E6) by Q. HI.6; 4.38% at Gurdaspur (E6) by Q. HI.7.1; 3.26% at Gurdaspur (E6) by Q. HI.8.1; 3.43% at Ludhiana (E3) by Q. HI.8.2 and 3.66% at Gurdaspur (E6) by Q. HI.10. Likewise, significant phenotypic differences produced by superior and inferior alleles for HSW were 0.32 g at Ludhiana (E3) by Q. HSW.6, 0.25 g at Gurdaspur (E6) by Q. HSW.7 and 0.24 g at Ludhiana (E3) by Q. HSW.10. A total of six genotypes (MASH218, IC274597, IC370938, IC557431, KUG673 and IC328783) were selected carrying superior alleles for all the traits under study and respective QTLs presented in Supplementary Table S9.
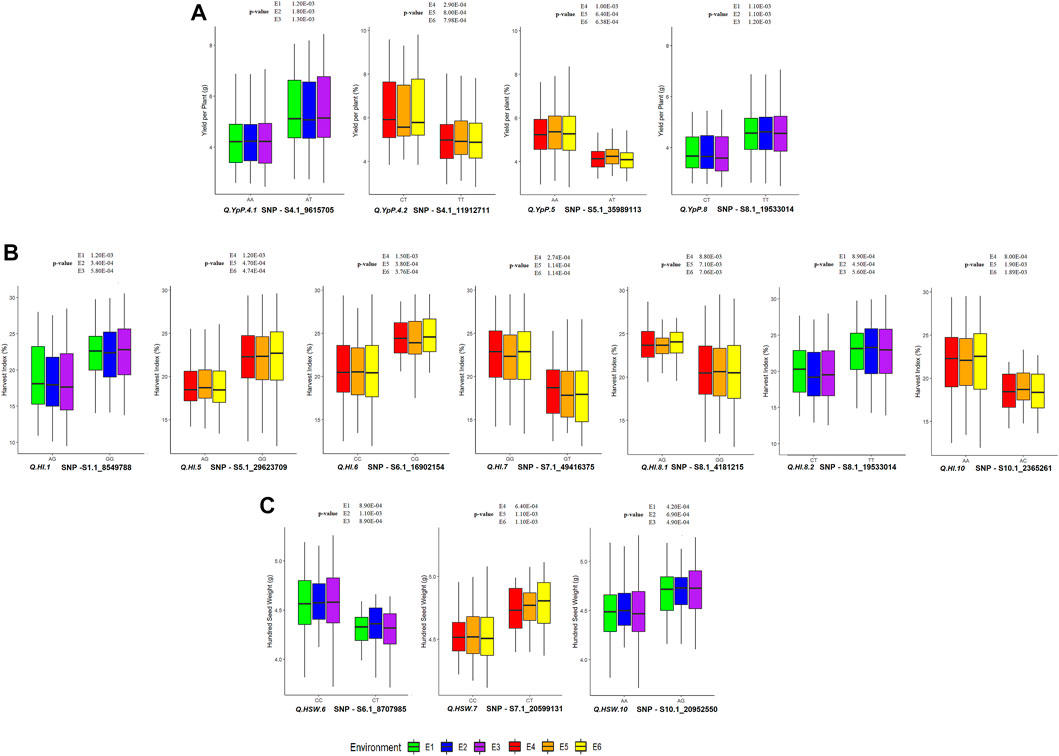
FIGURE 6. Allelic effect of QTLs associated with (A) YpP (Yield per Plant); (B) HI (Harvest Index) and (C) HSW (Hundred Seed Weight) at Ludhiana and Gurdaspur. p-value is provided from t-test for the respective environment.
Postulation of Candidate Genes
A total of 50 genes for 24 QTLs were identified with different functions for different traits, whereas no known gene was found for the remaining 18 QTLs (Table 3). Maximum genes with known function linked to the trait were identified for PHM 15) followed by CpP (9), YpP (7), SpP (5), IL (5), HI (5), HSW (3), and DtF (1), whereas no genes with known function for BpP, NpP, PL and BYpP were identified.
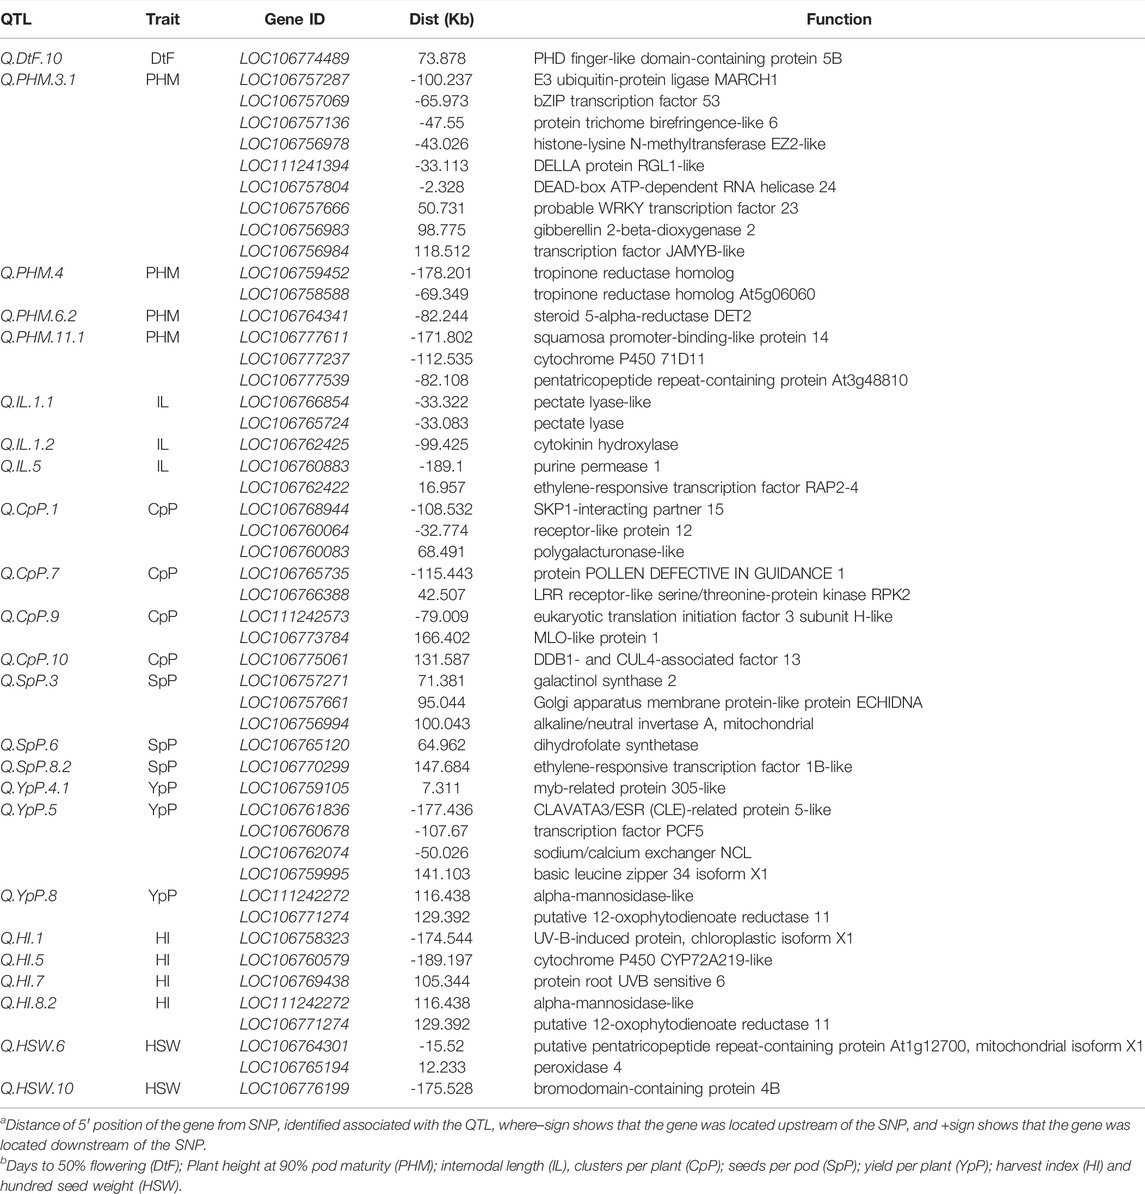
TABLE 3. List of candidate genes with their previously reported biological pathway function obtained in the putative QTL regions.
The gene LOC106774489 was found 73 kb upstream of the Q. DtF.10 coding PHD finger-like domain-containing enzyme 5B. Nine genes LOC106757287 (-100.237 kb), LOC106757069 (-65.973 kb), LOC106757136 (-47.55 kb), LOC106756978 (-43.026 kb), LOC111241394 (-33.113 kb), LOC106757804 (-2.328 kb), LOC106757666 (50.731 kb), LOC106756983 (98.775 kb), LOC106756984 (118.512 kb) coding for already known enzyme E3 ubiquitin-enzyme ligase MARCH1, bZIP transcription factor 53, enzyme trichome birefringence-like 6, histone-lysine N-methyltransferase EZ2-like, DELLA enzyme RGL1-like, DEAD-box ATP-dependent RNA helicase 24, probable WRKY transcription factor 23, gibberellin 2-beta-dioxygenase two and transcription factor JAMYB-like for plant height were located near Q. PHM.3.1.
For internodal length, two genes LOC106766854 (-33.322 kb) and LOC106765724 (-33.083 kb), were found close to the Q. IL.1.1 coding for pectate lyase-like and pectate lyase enzymes, respectively. Another gene LOC106762425 (-99.425 kb-), with enzyme cytokinin hydroxylase, was found in proximity with Q. IL.1.2. The QTL Q. IL.5 was near the genes LOC106760883 (-189.1 kb) and LOC106762422 (16.957 kb) coding for purine permease 1 and ethylene-responsive transcription factor RAP2-4 enzymes. For clusters per plant, three genes LOC106768944, LOC106760064 and LOC106760083 were in proximity of Q. CpP.1 (-108.532kb, -32.774 and 68.491 kb) coding SKP1-interacting partner 15, receptor-like protein 12 and polygalacturonase-like enzyme, respectively.
For seeds per pod, three genes LOC106757271 (71.381 kb), LOC106757661 (95.044 kb) and LOC106756994 (100.043 kb) were found close to the Q. SpP.3 with enzyme galactinol synthase 2, Golgi apparatus membrane enzyme-like enzyme ECHIDNA and alkaline/neutral invertase A respectively. A gene LOC106765120 (64.962 kb) with enzyme dihydrofolate synthetase, was found in the vicinity of Q. SpP.6. Another ethylene-responsive transcription factor 1B-like enzyme coding gene LOC106770299 (147.684 kb) was found close to the Q. SpP.8.2. For yield per plant, a gene LOC106759105 (7.311kb) with MYB-related protein 305-like enzyme was close to the QTL: Q. YpP.4.1. Four genes LOC106761836 (-177.436 kb), LOC106760678 (-107.67 kb), LOC106762074 (-50.026 kb) and LOC106759995 (141.103 kb) coding CLAVATA3/ESR (CLE)-related protein 5-like, transcription factor PCF5, sodium/calcium exchanger NCL and basic leucine zipper 34 isoform X1 enzymes were in vicinity of Q. YpP.5.
Two genes LOC111242272 (116.438 kb) and LOC106771274 (129.392 kb) with alpha-mannosidase-like and putative 12-oxophytodienoate reductase 11 enzymes was close to Q. YpP.8. For harvest index, gene LOC106758323 (-174.544 kb) coding for UV-B-induced protein At3g17800, chloroplastic isoform X1 was related to Q. HI.1. The gene LOC106760579 (-189.197 kb) was found in the proximity of Q. HI.5 coding cytochrome P450 CYP72A219-like enzyme. The gene LOC106769438 with protein root UVB sensitive six enzyme function was lying 105.344 kb of Q. HI.7. Two genes LOC111242272 (116.438 kb) and LOC106771274 (129.392 kb), with enzymes alpha-mannosidase-like and putative 12-oxophytodienoate reductase 11 respectively, were close to the Q. HI.8.2. Two genes LOC106764301 (-15.52 kb) and LOC106765194 (12.233 kb) with enzymes putative pentatricopeptide repeat-containing protein At1g12700 and peroxidase four, respectively, were close to the Q. HSW.6. The gene LOC106776199 (-175.528 kb) encoding bromodomain-containing protein 4B enzyme was related to Q. HSW.10. The nodes per plant (NpP) had two QTLs, but no genes already known for nodes per plant around the vicinity of 200 kb of significant QTLs were found.
KEGG Pathway Analysis
Some of the genomic regions significantly associated with the trait loci (Supplementary Table S10) such as Gibberellin 2-beta-dioxygenase (LOC106756983), cytochrome P450 CYP72A219 (LOC106760579) are involved in Diterpenoid biosynthesis (ko00904) pathway (Supplementary Figure S3). PHD finger-like domain-containing protein 5B (LOC106774489), and DEAD-box ATP-dependent RNA helicase 24 (LOC106757804) play role in Spliceosome (ko03040) process. Moreover, histone-lysine N-methyltransferase EZ2 found to be involved in Lysine degradation (Amino acid metabolism) ko0310. Besides that, pectate lyase-like (LOC106766854), pectate lyase (LOC106765724), and polygalacturonase-like (LOC106760083) have been found to play important role in Pentose and glucuronate interconversions (ko00040). LRR receptor-like serine/threonine-protein kinase RPK2 (LOC106766388), alkaline/neutral invertase A (LOC106756994) participates in Starch and sucrose metabolism (k000500). Galactinol synthase 2 (LOC106757271), alkaline/neutral invertase A (LOC106756994) have been shown to play role in Galactose metabolism (ko00052). Peroxidase 4 (LOC106765194) was found to play role in Phenylpropanoid biosynthesis (ko00940) (Supplementary Figure S4).
Discussion
Blackgram is one of the most popular pulses in Southeast Asia, with India contributing 54% of world production (Singh et al., 2016). Inspite of having high nutritional value, short duration, and photo insensitivity the crop has not been exploited to its full potential. Multiple biotic and abiotic stresses and narrow genetic base of this crop is major hindrance in its expansion. Thus, a systematic approach is required to exploit untapped genetic diversity present within the country so that the germplasm could be exploited for improving breeding potential. . Present study is an effort to exploit the collection of diverse blackgram genotypes for important yield related component traits.
Phenotypic Evaluation
Environment factors highly influence the complex traits; therefore, the material was replicated both in time and space. Previous studies have also reported a wide range of phenotypic variability for traits such as PHM, BpP, IL, CpP, PpP and HI (Panigrahi et al., 2014; Panda et al., 2017; Senthamizhselvi et al., 2019). High heritability was observed for all the traits indicating high genetic control and an effective phenotypic selection for these traits. Different studies have reported high broad-sense heritability for traits, i.e., DtF, DtM, PHM, CpP, PL and YpP (Panigrahi et al., 2014; Kumar et al., 2015); BYpP, HI and HSW (Rolaniya al., 2017; Kuralarasan et al., 2018). High heritability with high selection intensity helps breeders to shorten the breeding cycles of the program leading to faster and higher genetic gains. Many genotypes harbored combination of superior alleles for different yield related traits. For instance, the genotype IC274597 for CpP, PpP, SpP and BYpP; IC370938 for PpP, YpP, HSW and HI; KUG673 for DtF, DtM and HI; IC328783 for PHM, NpP and BYpP; These genotypes can be used in further breeding programs to improve desirable characters.
Population Structure
Ad-hoc delta K and Cross entropy values suggested presence of four sub-populations in the blackgram germplasm which was further supported by phylogenetic analysis which in turn indicated significant diversity in the panel. High Fst values in 2, 3 and 4 sub-populations indicated them to be highly differentiated. A diverse germplasm panel can be a good source for a wide range of traits for breeding and research purpose (Govindaraj et al., 2015). Modelling of genetic structures as covariates helps in controlling the false positives while conducting GWAS. This is the first report on population structure analysis in blackgram; however, four sub-populations in mungbean germplasm have been reported earlier (Breria et al., 2020).
Genome Wide Association Studies (GWAS)
GWAS for 14 yield associated traits identified 49 SNPs contributing to 42 QTLs to be strongly associated with 12 traits except DtM and PpP. Among 42 significant genomic regions identified in the study, the number of QTLs for each trait were as YpP (4), DtF (1), PHM (8), BpP (1), NpP (2), IL (4), CpP (5), PL (1), SpP (4), BYpP (2), HI (7) and HSW (3). High -log10 p-value and PVE suggested presence of major QTLs i.e. Q. DtF.10, Q. PHM.3.2, Q. NpP.6, Q. IL.8, Q. CpP.10, Q. SpP.3, Q. BYpP.9, Q. YpP.8, and Q. HI.8.2 at Ludhiana, whereas Q. PHM.3.1, Q. PHM.6.1, Q. NpP.4, Q. IL.1.1, Q. CpP.4, Q. SpP.6, Q. BYpP.8, Q. YpP.4.2, and Q. HI.6 at Gurdaspur were found significant for trait regulation. QTLs Q. PHM.8, and Q. IL.8 were found to be located at same position on eighth chromosome controlling PHM and IL, respectively. The pleiotropy of increased PHM with increased IL has been earlier reported in faba bean (Hughes et al., 2020).
Allelic Effects
The significant allelic effects of MTAs suggested selection of superior alleles could substantially lead to significant improvement of crop. At Ludhiana, QTL Q. DtF.10 with superior allele TT resulted in earlier flowering with a mean of 41.42 days as compared to 43.05 with alternative allele. Q. PHM.3.1 with superior allele AA recorded higher mean plant height of 28.54 cm, and 43.23 cm as compared to 19.21 cm, and 27.21 cm with alternative allele GG at Ludhiana, and Gurdaspur respectively. Superior allele TT of QTL Q. IL.8 decreased internode length with mean value of 2.01 cm, whereas alternate allele observed higher internodal length with mean value of 2.83 cm. For clusters per plant, Q. CpP.1 with superior allele AA exhibited mean of 18.84 clusters, whereas alternate allele TT exhibited mean of 12.73 clusters with The SNP S6.1.29235837 of Q. SpP.6 having allele AA produced more average seeds per pod of 6.71 in contrast to 6.45 by alternate allele. Higher yield per plant with average of 5.47 g was observed by presence of AA allele of QTL Q. YpP.5 while 4.21 g yield was observed with alternate allele. Q. HI.1 with allele GG exhibited an increased mean value of harvest index (22.53%) as compared to a lower harvest index due to alternate allele (18.62%). Q. HI.8.2 with allele TT showed a higher harvest index (22.87%) as compared to alternate allele (19.44%). Allelic effects with superior alleles and alternative alleles have been reported for significantly associated markers for root, nutrient uptake and yield related traits in rice (Subedi et al., 2019), for spike ethylene and spike dry weight in wheat (Valluru et al., 2017), and for yield related and heat tolernce traits in wheat (Dhillon et., 2021).
Postulation of Genes
Blackgram is a highly self-pollinated crop and with the given narrow genetic base, is expected to have large LD blocks and large chunks of haplotypes being transferred over the generations without recombination. Keeping this in view, the SNPs identified for traits can be searched upstream and downstream for candidate genes governing those traits (Dhillon et al., 2020). A total of 50 genes for 24 QTLs were identified with different functions with respect to different traits. The QTL Q. DtF.10 identified for days to flowering was present in the vicinity of the gene coding plant homeodomain finger-like domain-containing enzyme 5B can be a putative gene as PHD finger-like genes are reported to delay flowering Arabidopsis (Greb et al., 2007).
The enzymes encoded by genes found for QTLs of PHM were involved in controlling the plant height as supported by earlier studies of enzyme E3 ubiquitin-enzyme ligase MARCH1 in rice (Hu et al., 2013), bZIP transcription factor 53 in soybean (Ali et al., 2016), enzyme trichome birefringence-like six in Rice (Gao et al., 2017), histone-lysine N-methyltransferase EZ2-like (https://www.uniprot.org/uniprot/O23372), DELLA enzyme RGL1-like in Arabidopsis (Serrano-Mislata et al., 2017), DEAD-box ATP-dependent RNA helicase 24 in rice (Wang et al., 2016), probable WRKY transcription factor 23 in rice (Cai et al., 2014), gibberellin 2-beta-dioxygenase two in Arabidopsis (Rosin et al., 2003), transcription factor JAMYB-like in rice (Zhang et al., 2017), acyl transferase four in rice (Basu et al., 2017), tropinone reductase homolog (Stead, 1989), in grapevine (Guillaumie et al., 2020), steroid 5-alpha-reductase DET2 in soybean (Huo et al., 2018), squamosa promoter-binding-like enzyme 14 in rice (Lu et al., 2013), cytochrome P450 71D11 in cucumber (Wang et al., 2017), pentatricopeptide repeat-containing enzyme At3g48810 in Arabidopsis (Lee et al., 2019), and pentatricopeptide repeat-containing enzyme At1g31430 in Arabidopsis (Lee et al., 2019).
For internodal length, genes coding for pectate lyase-like (PLL), and pectate lyase (PL) in rice (Leng et al., 2017), cytokinin hydroxylase in Arabidopsis (Kiba et al., 2013), purine permease 1 in cotton (Wang et al., 2020), ethylene-responsive transcription factor RAP2-4 enzymes Arabidopsis (Hinz et al., 2010) have been earlier reported. For clusters per plant, genes SKP1-interacting partner 15 (Lu et al., 2016), receptor-like protein 12 (Wang et al., 2008), polygalacturonase-like enzyme (Xiao et al., 2014) in Arabidopsis, probable trehalose-phosphate phosphatase C isoform X2 in Nelumbo nucifera (Jin et al., 2016), lysine-specific demethylase JMJ25 isoform X1 in Arabidopsis (Jiang et al., 2007), pollen defective in guidance 1 (Li et al., 2011), LRR receptor-like serine/threonine-protein kinase RPK2 enzymes in Arabidopsis (Mizuno et al., 2007), eukaryotic translation initiation factor 3 subunit H-like in Arabidopsis (Zhou et al., 2014), MLO-like protein 1 reported in peach (Ruperti et al., 2002), and DDB1- and CUL4-associated factor 13 enzyme (Bjerkan and Grini, 2013) has been earlier reported to be involved in controlling cell elongation and flower development.
For seeds per pod, galactinol synthase two in Chickpea (Salvi et al., 2016), Golgi apparatus membrane enzyme-like enzyme ECHIDNA in Arabidopsis (Jia et al., 2018), 60S ribosomal protein L28-2 in soybean (Jones et al., 2020), dihydrofolate synthetase in Arabidopsis (Corral et al., 2018), and ethylene-responsive transcription factor 1B-like enzyme in brassica (Kaur et al., 2020) were known to have a role in increasing number of seeds per pod/siliqua. For yield per plant, myb-related protein 305-like in Arabidopsis (Ambawat et al., 2013), CLAVATA3/ESR (CLE)-related protein 5-like in Arabidopsis (Fletcher, 2018), transcription factor PCF5 in wheat (Zhao et al., 2018), sodium/calcium exchanger NCL in soybean (Liu Y. et al., 2016), basic leucine zipper 34 isoform X1 enzymes in wheat (Sornaraj et al., 2016), alpha-mannosidase-like in wheat (Dal Cortivo et al., 2020), and putative 12-oxophytodienoate reductase 11 in wheat (Pigolev et al., 2018) were previously known for yield improvement. For harvest index, UV-B-induced protein At3g17800 in basil (Dou et al., 2019), cytochrome P450 CYP72A219-like enzyme in Arabidopsis (Bak et al., 2011), root UV-B sensitive in wheat (Agrawal et al., 2004), alpha-mannosidase-like in wheat (Dal Cortivo et al., 2020), and putative 12-oxophytodienoate reductase 11 in wheat (Pigolev et al., 2018) are known for triggering reductions in biomass, yield and harvest index.
The genes detected for HSW, pentatricopeptide repeat-containing protein At1g80550, have been earlier reported for kernel development in maize (Dai et al., 2018; Ren et al., 2019); peroxidase four in soybean (Zhang et al., 2015). The clusters per plant had several QTLs, but no known genes were identified in 200 kb genomic region.
KEGG Pathway Analysis
KEGG analysis revealed role of candidate genes in biological pathways related to respective traits. Gibberellins (GAs) are endogenous phytohormones that are involved in the regulation of the life cycle of plants. It has been identified that the locus encoding gibberellin 2-beta-dioxygenase/GA 2-oxidase present in vicinity of SNP S3.1.7993147 on chromosome 3 significantly associated with plant height at 90% pod maturity participates in Diterpenoid biosynthesis (ko00904) pathway. The role of this locus in the regulation of plant growth in rice has been demonstrated by Sakamoto et al., 2001. KEGG pathway established role of another gene coding for steroid 5-alpha-reductase DET2 with QTL associated with PHM on chromosome six to participate in Brassinosteroid biosynthesis. Ortholog of this gene in cotton (Gossypium hirsutum L.), GhDET2 along with BRs are known to play a crucial role in the initiation and elongation of cotton fiber cells (Luo et al., 2007). Similarly, DET2 steroid 5d-reductase in Arabidopsis catalyzes a major rate-limiting in brassinosteroid (BR) biosynthesis (Nakaya et al., 2002). Additionally, Cytochrome P450 CYP72A219-like has also been reported to participate in Diterpenoid biosynthesis pathway (Bathe and Tissier, 2019). Using KEGG pathway analysis, function of only two QTLs could be established with diterpenoid pathway and brassinosteroid biosynthesis pathway. However, the function of remaining significant genomic regions could not be established using this analysis.
Conclusion
GWAS analysis led to identification of novel MTA and few putative candidate genes. Though candidate genes need to be examined further and detailed investigations would validate their roles in governing agronomically important traits but the MTA will really help in selecting the genotypes with positive associations. The information derived from this study can be used in the generation of SNP based molecular markers to select traits of interest and accelerate blackgram breeding programme with a better ideotype. Since the blackgram is neglected crop in term of number of genetic and genomic resources, the current study, first of its kind in this crop will definitely open new avenues for broadening its base.
Data Availability Statement
The datasets presented in this study can be found in online repositories. The names of the repository/repositories and accession number(s) can be found below: NCBI Bioproject, accession number PRJNA802066.
Author Contributions
SdK concept design and coordination of research work and manuscript writing, LS, RG, SD, and AKu contributed to phenotyping; LS, GD, AKa, PM, and SbK contributed to data analysis; GD, PM, and SdK supervised and edited the manuscript; All authors read and approved the manuscript.
Conflict of Interest
The authors declare that the research was conducted in the absence of any commercial or financial relationships that could be construed as a potential conflict of interest.
Publisher’s Note
All claims expressed in this article are solely those of the authors and do not necessarily represent those of their affiliated organizations, or those of the publisher, the editors and the reviewers. Any product that may be evaluated in this article, or claim that may be made by its manufacturer, is not guaranteed or endorsed by the publisher.
Acknowledgments
Authors are thankful to Kuldeep Singh, Cluster Leader-Genebank, International Crops Research Institute for the Semi-Arid Tropics (ICRISAT) for useful guidance and support. This work was supported by the Department of Biotechnology (DBT) under the grant number BT/Ag/Network/Pulses-I/2017-18.
Supplementary Material
The Supplementary Material for this article can be found online at: https://www.frontiersin.org/articles/10.3389/fgene.2022.849016/full#supplementary-material
References
Agrawal, S. B., Rathore, D., and Singh, A. (2004). Effects of Supplemental Ultraviolet-B and Mineral Nutrients on Growth, Biomass Allocation and Yield of Wheat (Triticum aestivum L.). Trop. Ecol. 45, 315–325.
Ali, Z., Sarwat, S. S., Karim, I., Faridi, R., Jaskani, M. J., and Khan, A. A. (2016). Functions of Plant's Bzip Transcription Factors. Pakjas 53, 303–314. doi:10.21162/PAKJAS/16.2043
Alvarado, G., Rodríguez, F. M., Pacheco, A., Burgueño, J., Crossa, J., Vargas, M., et al. (2020). META-R: A Software to Analyze Data from Multi-Environment Plant Breeding Trials. Crop J. 8, 745–756. doi:10.1016/j.cj.2020.03.010
Ambawat, S., Sharma, P., Yadav, N. R., and Yadav, R. C. (2013). MYB Transcription Factor Genes as Regulators for Plant Responses: An Overview. Physiol. Mol. Biol. Plants 19, 307–321. doi:10.1007/s12298-013-0179-1
Bak, S., Beisson, F., Bishop, G., Hamberger, B., Höfer, R., Paquette, S., et al. (2011). Cytochromes P450. Arabidopsis Book 9, e0144. doi:10.1199/tab.0144
Basu, D., Majhi, B. B., Sripriya, R., and Veluthambi, K. (2017). Agrobacterium T-DNA Insertion in the Rice DWARF SHOOT and DEFECTIVE PANICLE1 (DSDP1) Gene Causes a Severe Dwarf Phenotype, Reduces Plant Vigour, and Affects Seed Germination. J. Plant Biochem. Biotechnol. 26, 395–405. doi:10.1007/s13562-017-0400-3
Bates, D., Mächler, M., Bolker, B., and Walker, S. (2015). Fitting Linear Mixed-Effects Models Usinglme4. J. Stat. Soft. 67, 1–48. doi:10.18637/jss.v067.i01
Bathe, U., and Tissier, A. (2019). Cytochrome P450 Enzymes: A Driving Force of Plant Diterpene Diversity. Phytochemistry 161, 149–162. doi:10.1016/j.phytochem.2018.12.003
Bhandari, A., Sandhu, N., Bartholome, J., Cao-Hamadoun, T.-V., Ahmadi, N., Kumari, N., et al. (2020). Genome-Wide Association Study for Yield and Yield Related Traits under Reproductive Stage Drought in a Diverse Indica-Aus Rice Panel. Rice 13. doi:10.1186/s12284-020-00406-3
Bjerkan, K. N., and Grini, P. E. (2013). TheArabidopsisDDB1 Interacting Protein WDR55 Is Required for Vegetative Development. Plant Signal. Behav. 8, e25347–6. doi:10.4161/psb.25347
Bolger, A. M., Lohse, M., and Usadel, B. (2014). Trimmomatic: A Flexible Trimmer for Illumina Sequence Data. Bioinformatics 30, 2114–2120. doi:10.1093/bioinformatics/btu170
Bradbury, P. J., Zhang, Z., Kroon, D. E., Casstevens, T. M., Ramdoss, Y., and Buckler, E. S. (2007). TASSEL: Software for Association Mapping of Complex Traits in Diverse Samples. Bioinformatics 23, 2633–2635. doi:10.1093/bioinformatics/btm308
Breria, C. M., Hsieh, C. H., Yen, J.-Y., Nair, R., Lin, C.-Y., Huang, S.-M., et al. (2020). Population Structure of the World Vegetable Center Mungbean Mini Core Collection and Genome-wide Association Mapping of Loci Associated with Variation of Seed Coat Luster. Trop. Plant Biol. 13, 1–12. doi:10.1007/s12042-019-09236-0
Cai, Y., Chen, X., Xie, K., Xing, Q., Wu, Y., Li, J., et al. (2014). Dlf1, a WRKY Transcription Factor, Is Involved in the Control of Flowering Time and Plant Height in Rice. PLoS One 9, e102529–13. doi:10.1371/journal.pone.0102529
Chaitieng, B., Kaga, A., Tomooka, N., Isemura, T., Kuroda, Y., and Vaughan, D. A. (2006). Development of a Black Gram [Vigna Mungo (L.) Hepper] Linkage Map and its Comparison with an Azuki Bean [Vigna Angularis (Willd.) Ohwi and Ohashi] Linkage Map. Theor. Appl. Genet. 113, 1261–1269. doi:10.1007/s00122-006-0380-5
Chan, J. C. C., and Kroese, D. P. (2012). Improved Cross-Entropy Method for Estimation. Stat. Comput. 22, 1031–1040. doi:10.1007/s11222-011-9275-7
Corral, M. G., Haywood, J., Stehl, L. H., Stubbs, K. A., Murcha, M. W., and Mylne, J. S. (2018). Targeting Plant DIHYDROFOLATE REDUCTASE with Antifolates and Mechanisms for Genetic Resistance. Plant J. 95, 727–742. doi:10.1111/tpj.13983
Dai, D., Luan, S., Chen, X., Wang, Q., Feng, Y., Zhu, C., et al. (2018). Maize Dek37 Encodes a P-type PPR Protein that Affects Cis-Splicing of Mitochondrial Nad2 Intron 1 and Seed Development. Genetics 208, 1069–1082. doi:10.1534/genetics.117.300602
Dal Cortivo, C., Ferrari, M., Visioli, G., Lauro, M., Fornasier, F., Barion, G., et al. (2020). Effects of Seed-Applied Biofertilizers on Rhizosphere Biodiversity and Growth of Common Wheat (Triticum aestivum L.) in the Field. Front. Plant Sci. 11, 1–14. doi:10.3389/fpls.2020.00072
Das, D., Baruah, I. K., Panda, D., Paswan, R. R., Acharjee, S., and Sarmah, B. K. (2021). Bruchid Beetle Ovipositioning Mediated Defense Responses in Black Gram Pods. BMC Plant Biol. 21, 1–22. doi:10.1186/s12870-020-02796-4
Dey, S., Chowardhara, B., Regon, P., Kar, S., Saha, B., and Panda, S. K. (2020). Iron Deficiency in Blackgram (Vigna Mungo L.): Redox Status and Antioxidant Activity. Plant Biosyst. - Int. J. Deal. all Aspects Plant Biol., 1, 16. doi:10.1080/11263504.2020.1866093
Dhillon, G. S., Das, N., Kaur, S., Srivastava, P., Bains, N. S., and Chhuneja, P. (2021). Marker Assisted Mobilization of Heat Tolerance QTLs from Triticum Durum-Aegilops Speltoides Introgression Lines to Hexaploid Wheat. Indian J. Genet. 81 (2), 186–198. doi:10.31742/IJGPB.81.2.2
Dhillon, G. S., Kaur, S., Das, N., Singh, R., Poland, J., Kaur, J., et al. (2020). QTL Mapping for Stripe Rust and Powdery Mildew Resistance in Triticum Durum-Aegilops Speltoides Backcross Introgression Lines. Plant Genet. Resour. 18, 211–221. doi:10.1017/S1479262120000222
Dou, H., Niu, G., and Gu, M. (2019). Pre-harvest UV-B Radiation and Photosynthetic Photon Flux Density Interactively Affect Plant Photosynthesis, Growth, and Secondary Metabolites Accumulation in Basil (Ocimum Basilicum) Plants. Agronomy 9, 434. doi:10.3390/agronomy9080434
Elshire, R. J., Glaubitz, J. C., Sun, Q., Poland, J. A., Kawamoto, K., Buckler, E. S., et al. (2011). A Robust, Simple Genotyping-By-Sequencing (GBS) Approach for High Diversity Species. PLoS One 6, e19379. doi:10.1371/journal.pone.0019379
Evanno, G., Regnaut, S., and Goudet, J. (2005). Detecting the Number of Clusters of Individuals Using the Software STRUCTURE: A Simulation Study. Mol. Ecol. 14, 2611–2620. doi:10.1111/j.1365-294X.2005.02553.x
Fletcher, J. (2018). The CLV-WUS Stem Cell Signaling Pathway: A Roadmap to Crop Yield Optimization. Plants 7, 87–11. doi:10.3390/plants7040087
Gao, Y., He, C., Zhang, D., Liu, X., Xu, Z., Tian, Y., et al. (2017). Two Trichome Birefringence-like Proteins Mediate Xylan Acetylation, Which Is Essential for Leaf Blight Resistance in Rice. Plant Physiol. 173, 470–481. doi:10.1104/pp.16.01618
Ghafoor, A., Sharif, A., Ahmad, Z., Zahid, M. A., and Rabbani, M. A. (2001). Genetic Diversity in Blackgram (Vigna Mungo L. Hepper). Field Crops Res. 69, 183–190. doi:10.1016/S0378-4290(00)00141-6
Govindaraj, M., Vetriventhan, M., and Srinivasan, M. (2015). Importance of Genetic Diversity Assessment in Crop Plants and its Recent Advances: An Overview of its Analytical Perspectives. Genet. Res. Int. 2015, 1–14. doi:10.1155/2015/431487
Greb, T., Mylne, J. S., Crevillen, P., Geraldo, N., An, H., Gendall, A. R., et al. (2007). The PHD Finger Protein VRN5 Functions in the Epigenetic Silencing of Arabidopsis FLC. Curr. Biol. 17, 73–78. doi:10.1016/j.cub.2006.11.052
Guillaumie, S., Decroocq, S., Ollat, N., Delrot, S., Gomès, E., and Cookson, S. J. (2020). Dissecting the Control of Shoot Development in Grapevine: Genetics and Genomics Identify Potential Regulators. BMC Plant Biol. 20, 1–15. doi:10.1186/s12870-020-2258-0
Gupta, S. K., Souframanien, J., and Gopalakrishna, T. (2008). Construction of a Genetic Linkage Map of Black gram,Vigna mungo(L.) Hepper, Based on Molecular Markers and Comparative Studies. Genome 51, 628–637. doi:10.1139/G08-050
Hinz, M., Wilson, I. W., Yang, J., Buerstenbinder, K., Llewellyn, D., Dennis, E. S., et al. (2010). ArabidopsisRAP2.2: An Ethylene Response Transcription Factor that Is Important for Hypoxia Survival. Plant Physiol. 153, 757–772. doi:10.1104/pp.110.155077
Hu, X., Qian, Q., Xu, T., Zhang, Y. e., Dong, G., Gao, T., et al. (2013). The U-Box E3 Ubiquitin Ligase TUD1 Functions with a Heterotrimeric G α Subunit to Regulate Brassinosteroid-Mediated Growth in Rice. PLoS Genet. 9, e1003391. doi:10.1371/journal.pgen.1003391
Hughes, J., Khazaei, H., and Vandenberg, A. (2020). Genetics of Height and Branching in Faba Bean (Vicia faba). Agronomy 10, 1191. doi:10.3390/agronomy10081191
Huo, W., Li, B., Kuang, J., He, P., Xu, Z., and Wang, J. (2018). Functional Characterization of the Steroid Reductase Genes GmDET2a and GmDET2b from Glycine Max. Ijms 19, 726–821. doi:10.3390/ijms19030726
Hwang, E.-Y., Song, Q., Jia, G., Specht, J. E., Hyten, D. L., Costa, J., et al. (2014). A Genome-wide Association Study of Seed Protein and Oil Content in Soybean. BMC Genomics 15, 1. doi:10.1186/1471-2164-15-1
Ikram, M., Han, X., Zuo, J.-F., Song, J., Han, C.-Y., Zhang, Y.-W., et al. (2020). Identification of QTNs and Their Candidate Genes for 100-seed Weight in Soybean (Glycine Max L.) Using Multi-Locus Genome-wide Association Studies. Genes 11, 714–722. doi:10.3390/genes11070714
Jia, P.-F., Xue, Y., Li, H.-J., and Yang, W.-C. (2018). Golgi-localized LOT Regulates Trans -Golgi Network Biogenesis and Pollen Tube Growth. Proc. Natl. Acad. Sci. U.S.A. 115, 12307–12312. doi:10.1073/pnas.1809206115
Jiang, D., Yang, W., He, Y., and Amasino, R. M. (2007). ArabidopsisRelatives of the Human Lysine-specific Demethylase1 Repress the Expression ofFWAandFLOWERING LOCUS Cand Thus Promote the Floral Transition. Plant Cell. 19, 2975–2987. doi:10.1105/tpc.107.052373
Jin, Q., Hu, X., Li, X., Wang, B., Wang, Y., Jiang, H., et al. (2016). Genome-wide Identification and Evolution Analysis of Trehalose-6-Phosphate Synthase Gene Family in Nelumbo nucifera. Front. Plant Sci. 7, 1–12. doi:10.3389/fpls.2016.01445
Jones, S. I., Hunt, M. R., and Vodkin, L. O. (2020). An Embryo Lethal Transgenic Line Manifests Global Expression Changes and Elevated Protein/oil Ratios in Heterozygous Soybean Plants. PLoS One 15, e0233721–23. doi:10.1371/journal.pone.0233721
Kang, Y., Kim, S., and Kim, M. (2014). Genome Sequence of Mungbean and Insights Into Evolution Within Vigna Species. Nat. Commun. 5 (5443), 1–9. doi:10.1038/ncomms6443
Kaur, J., Akhatar, J., Goyal, A., Kaur, N., Kaur, S., Mittal, M., et al. (2020). Genome Wide Association Mapping and Candidate Gene Analysis for Pod Shatter Resistance in Brassica Juncea and its Progenitor Species. Mol. Biol. Rep. 47, 2963–2974. doi:10.1007/s11033-020-05384-9
Kiba, T., Takei, K., Kojima, M., and Sakakibara, H. (2013). Side-Chain Modification of Cytokinins Controls Shoot Growth in Arabidopsis. Dev. Cell. 27, 452–461. doi:10.1016/j.devcel.2013.10.004
Kumar, G. V., Vanaja, M., Lakshmi, N. J., and Maheswari, M. (2015). Studies on Variability, Heritability and Genetic Advance for Quantitative Traits in Black Gram [Vigna mungo(L.) Hepper]. Agricul. Res. Jour. 52, 28. doi:10.5958/2395-146x.2015.00056.3
Kuralarasan, V., Vanniarajan, C., Kanchana, S., Veni, K., and Lavanya, A. (2018). Genetic Divergence, Heritability and Genetic Advance in Mutant Lines of Urdbean [Vigna Mungo (L.) Hepper. Lr 41, 833–836. doi:10.18805/LR-3794
Laird, N. M., and Ware, J. H. (1982). Random-Effects Models for Longitudinal Data. Biometrics. 38, 963–974. doi:10.2307/2529876
Lee, K., Park, S. J., Han, J. H., Jeon, Y., Pai, H.-S., and Kang, H. (2019). A Chloroplast-Targeted Pentatricopeptide Repeat Protein PPR287 Is Crucial for Chloroplast Function and Arabidopsis Development. BMC Plant Biol. 19, 1–10. doi:10.1186/s12870-019-1857-0
Leng, Y., Yang, Y., Ren, D., Huang, L., Dai, L., Wang, Y., et al. (2017). A Rice PECTATE LYASE-LIKE Gene Is Required for Plant Growth and Leaf Senescence. Plant Physiol. 174, 1151–1166. doi:10.1104/pp.16.01625
Letunic, I., and Bork, P. (2016). Interactive Tree of Life (iTOL) V3: an Online Tool for the Display and Annotation of Phylogenetic and Other Trees. Nucleic Acids Res. 44, W242–W245. doi:10.1093/nar/gkw290
Li, H.-J., Xue, Y., Jia, D.-J., Wang, T., hi, D.-Q., Liu, J., et al. (2011). POD1 Regulates Pollen Tube Guidance in Response to Micropylar Female Signaling and Acts in Early Embryo Patterning inArabidopsis. Plant Cell. 23, 3288–3302. doi:10.1105/tpc.111.088914
Li, H., Handsaker, B., Wysoker, A., Fennell, T., Ruan, J., Homer, N., et al. (2009). The Sequence Alignment/Map Format and SAMtools. Bioinformatics 25, 2078–2079. doi:10.1093/bioinformatics/btp352
Lipka, A. E., Tian, F., Wang, Q., Peiffer, J., Li, M., Bradbury, P. J., et al. (2012). GAPIT: Genome Association and Prediction Integrated Tool. Bioinformatics 28, 2397–2399. doi:10.1093/bioinformatics/bts444
Liu, X., Huang, M., Fan, B., Buckler, E. S., and Zhang, Z. (2016a). Iterative Usage of Fixed and Random Effect Models for Powerful and Efficient Genome-wide Association Studies. PLoS Genet. 12, e1005767. doi:10.1371/journal.pgen.1005767
Liu, Y., Yu, L., Qu, Y., Chen, J., Liu, X., Hong, H., et al. (2016b). GmSALT3, Which Confers Improved Soybean Salt Tolerance in the Field, Increases Leaf Cl- Exclusion Prior to Na+ Exclusion but Does Not Improve Early Vigor under Salinity. Front. Plant Sci. 7, 1–14. doi:10.3389/fpls.2016.01485
Lorenz, A. J., Hamblin, M. T., and Jannink, J.-L. (2010). Performance of Single Nucleotide Polymorphisms versus Haplotypes for Genome-wide Association Analysis in Barley. PLoS One 5, e14079. doi:10.1371/journal.pone.0014079
Lu, D., Ni, W., Stanley, B. A., and Ma, H. (2016). Proteomics and Transcriptomics Analyses of Arabidopsis Floral Buds Uncover Important Functions of ARABIDOPSIS SKP1-LIKE1. BMC Plant Biol. 16, 1–18. doi:10.1186/s12870-015-0571-9
Lu, Z., Yu, H., Xiong, G., Wang, J., Jiao, Y., Liu, G., et al. (2013). Genome-wide Binding Analysis of the Transcription Activator IDEAL PLANT ARCHITECTURE1 Reveals a Complex Network Regulating Rice Plant Architecture. Plant Cell. 25, 3743–3759. doi:10.1105/tpc.113.113639
Lukoki, L., Marechal, R., and Otoul, E. (1980). Les ancetres sauvages des haricots cultives: Vigna radiata (L.) Wilczek et V. mungo (L.) Hepper. Bull. Jard. Bot. Natl. Belg./Bull. Natl. Plantentuin Belg. 50, 385–391. doi:10.2307/3667837
Luo, M., Xiao, Y., Li, X., Lu, X., Deng, W., Li, D., et al. (2007). GhDET2, a Steroid 5α-Reductase, Plays an Important Role in Cotton Fiber Cell Initiation and Elongation. Plant J. 51, 419–430. doi:10.1111/j.1365-313X.2007.03144.x
Mizuno, S., Osakabe, Y., Maruyama, K., Ito, T., Osakabe, K., Sato, T., et al. (2007). Receptor-like Protein Kinase 2 (RPK 2) Is a Novel Factor Controlling Anther Development in Arabidopsis thaliana. Plant J. 50, 751–766. doi:10.1111/j.1365-313X.2007.03083.x
Muthusamy, S., and Pandiyan, M. (2018). Realization of Facts and Profiteering of Black Gram through Different Breeding Methods. Available at: https://www.researchgate.net/publication/327386671 (Accessed March 15, 2021).
Nakaya, M., Tsukaya, H., Murakami, N., and Kato, M. (2002). Brassinosteroids Control the Proliferation of Leaf Cells of Arabidopsis thaliana. Plant Cell. Physiol. 43, 239–244. doi:10.1093/pcp/pcf024
Noble, T. J., Tao, Y., Mace, E. S., Williams, B., Jordan, D. R., Douglas, C. A., et al. (2018). Characterization of Linkage Disequilibrium and Population Structure in a Mungbean Diversity Panel. Front. Plant Sci. 8, 2102. doi:10.3389/fpls.2017.02102
Panda, D. P., Lenka, D., Dash, A. P., Tripathy, S. K., Behera, C., and Baisakh, B. (2017). Genetic Variability and Heritability Studies in Relation to Seed Yield and its Component Traits in Black Gram (Vigna mungo L). Biosci. Trends, 10 (6), 1412–1414.
Panigrahi, K. K., Mohanty, A., and Baisakh, B. (2014). Genetic Divergence, Variability and Character Association in Landraces of Blackgram (Vigna Mungo [l.] Hepper) from Odisha. J. Crop Weed 10, 155–165.
Park, C., Dwiyanti, M. S., Nagano, A. J., Liu, B., Yamada, T., and Abe, J. (2019). Identification of Quantitative Trait Loci for Increased α-tocopherol Biosynthesis in Wild Soybean Using a High-Density Genetic Map. BMC Plant Biol. 19, 1–15. doi:10.1186/s12870-019-2117-z
Pigolev, A., Miroshnichenko, D., Pushin, A., Terentyev, V., Boutanayev, A., Dolgov, S., et al. (2018). Overexpression of Arabidopsis OPR3 in Hexaploid Wheat (Triticum aestivum L.) Alters Plant Development and Freezing Tolerance. Ijms 19, 3989. doi:10.3390/ijms19123989
Plekhanova, E., Vishnyakova, M. A., Bulyntsev, S., Chang, P. L., Carrasquilla-Garcia, N., Negash, K., et al. (2017). Genomic and Phenotypic Analysis of Vavilov's Historic Landraces Reveals the Impact of Environment and Genomic Islands of Agronomic Traits. Sci. Rep. 7. doi:10.1038/S41598-017-05087-5
Pootakham, W., Nawae, W., Naktang, C., Sonthirod, C., Yoocha, T., Kongkachana, W., et al. (2021). A Chromosome‐scale Assembly of the Black Gram ( Vigna Mungo ) Genome. Mol. Ecol. Resour. 21, 238–250. doi:10.1111/1755-0998.13243
Pritchard, J. K., Stephens, M., and Donnelly, P. (2000). Inference of Population Structure Using Multilocus Genotype Data. Genetics 155, 945–959. doi:10.1093/genetics/155.2.945
Raizada, A., and Souframanien, J. (2021). SNP Genotyping and Diversity Analysis Based on Genic-SNPs through High Resolution Melting (HRM) Analysis in Blackgram [Vigna Mungo (L.) Hepper]. Genet. Resour. Crop Evol. 68, 1331–1343. doi:10.1007/s10722-020-01064-6
Ren, R. C., Lu, X., Zhao, Y. J., Wei, Y. M., Wang, L. L., Zhang, L., et al. (2019). Pentatricopeptide Repeat Protein DEK40 Is Required for Mitochondrial Function and Kernel Development in Maize. J. Exp. Bot. 70, 6163–6179. doi:10.1093/jxb/erz391
Rolaniya, D. K., Jinjwadiya, M. K., Meghawal, D. R., and Lal, G. M. (2017). Studies on Genetic Variability in Blackgram (Vigna Mungo (L.) Hepper). J. Pharmacogn. Phytochem. 7, 1506–1508.
Rosin, F. M., Hart, J. K., Horner, H. T., Davies, P. J., and Hannapel, D. J. (2003). Overexpression of a Knotted-like Homeobox Gene of Potato Alters Vegetative Development by Decreasing Gibberellin Accumulation. Plant Physiol. 132, 106–117. doi:10.1104/pp.102.015560.ser
Ruperti, B., Bonghi, C., Ziliotto, F., Pagni, S., Rasori, A., Varotto, S., et al. (2002). Characterization of a Major Latex Protein (MLP) Gene Down-Regulated by Ethylene during Peach Fruitlet Abscission. Plant Sci. 163, 265–272. doi:10.1016/S0168-9452(02)00094-8
Saghai-Maroof, M. A., Soliman, K. M., Jorgensen, R. A., and Allard, R. W. (1984). Ribosomal DNA Spacer-Length Polymorphisms in Barley: Mendelian Inheritance, Chromosomal Location, and Population Dynamics. Proc. Natl. Acad. Sci. U.S.A. 81, 8014–8018. doi:10.1073/PNAS.81.24.8014
Sahu, B., Thakur, C. L., Markam, S. K., and Nag, U. K. (2020). Performance of Frontline Demonstrations on Productivity and Profitability of Black Gram (Vigna Mungo) in Rainfed Condition of Uttar-Bastar Kanker. Int. J. Curr. Microbiol. App. Sci. 9, 1898–1903. doi:10.20546/ijcmas.2020.904.224
Sakamoto, T., Kobayashi, M., Itoh, H., Tagiri, A., Kayano, T., Tanaka, H., et al. (2001). Expression of a Gibberellin 2-oxidase Gene Around the Shoot Apex Is Related to Phase Transition in Rice. Plant Physiol. 125, 1508–1516. doi:10.1104/pp.125.3.1508
Salvi, P., Saxena, S. C., Petla, B. P., Kamble, N. U., Kaur, H., Verma, P., et al. (2016). Differentially Expressed Galactinol Synthase(s) in Chickpea Are Implicated in Seed Vigor and Longevity by Limiting the Age Induced ROS Accumulation. Sci. Rep. 6, 1–15. doi:10.1038/srep35088
Scherer, A., and Christensen, G. B. (2016). Concepts and Relevance of Genome-wide Association Studies. Sci. Prog. 99, 59–67. doi:10.3184/003685016X14558068452913
Senthamizhselvi, S., Muthuswamy, A., and Shunmugavalli, N. (2019). Genetic Variability, Correlation and Path Coefficient Analysis for Yield and Yield Components in Blackgram (Vigna Mungo (L.) Hepper). Electron. Journ. Plan. Breed. 10, 1600–1605. doi:10.5958/0975-928X.2019.00206.0
Serrano-Mislata, A., Bencivenga, S., Bush, M., Schiessl, K., Boden, S., and Sablowski, R. (2017). DELLA Genes Restrict Inflorescence Meristem Function Independently of Plant Height. Nat. Plants 3, 749–754. doi:10.1038/s41477-017-0003-y
Singh, D. P., Singh, B. B., and Pratap, A. (2016). Genetic Improvement of Mungbean and Urdbean and Their Role in Enhancing Pulse Production in India. Ind. Jrnl. Gen. Plnt. Bree. 76, 550–567. doi:10.5958/0975-6906.2016.00072.9
Singh, L., Kumar, A., Kaur, S., and Gill, R. K. (2020). Multivariate Analysis of Yield Contributory Traits for Selection Criteria in Urdbean (V. Mungo L. Hepper). Ejpb 11, 1134–1142. doi:10.37992/2020.1104.183
Sokolkova, A., Burlyaeva, M., Valiannikova, T., Vishnyakova, M., Schafleitner, R., Lee, C.-R., et al. (2020). Genome-wide Association Study in Accessions of the Mini-Core Collection of Mungbean (Vigna Radiata) from the World Vegetable Gene Bank (Taiwan). BMC Plant Biol. 20, 363. doi:10.1186/S12870-020-02579-X
Somta, P., Chen, J., Yundaeng, C., Yuan, X., Yimram, T., Tomooka, N., et al. (2019). Development of an SNP-Based High-Density Linkage Map and QTL Analysis for Bruchid (Callosobruchus Maculatus F.) Resistance in Black Gram (Vigna Mungo (L.) Hepper). Sci. Rep. 9, 3930. doi:10.1038/s41598-019-40669-5
Sornaraj, P., Luang, S., Lopato, S., and Hrmova, M. (2016). Basic Leucine Zipper (bZIP) Transcription Factors Involved in Abiotic Stresses: A Molecular Model of a Wheat bZIP Factor and Implications of its Structure in Function. Biochimica Biophysica Acta (BBA) - General Subj. 1860, 46–56. doi:10.1016/j.bbagen.2015.10.014
Subedi, S. R., Sandhu, N., Singh, V. K., Sinha, P., Kumar, S., Singh, S. P., et al. (2019). Genome-wide Association Study Reveals Significant Genomic Regions for Improving Yield, Adaptability of Rice under Dry Direct Seeded Cultivation Condition. BMC Genomics 20, 471. doi:10.1186/s12864-019-5840-9
Torkamaneh, D., Chalifour, F.-P., Beauchamp, C. J., Agrama, H., Boahen, S., Maaroufi, H., et al. (2020). Genome-wide Association Analyses Reveal the Genetic Basis of Biomass Accumulation under Symbiotic Nitrogen Fixation in African Soybean. Theor. Appl. Genet. 133, 665–676. doi:10.1007/s00122-019-03499-7
Valluru, R., Reynolds, M. P., Davies, W. J., and Sukumaran, S. (2017). Phenotypic and Genome‐wide Association Analysis of Spike Ethylene in Diverse Wheat Genotypes under Heat Stress. New Phytol. 214, 271–283. doi:10.1111/nph.14367
Varshney, R. K., Nayak, S. N., May, G. D., and Jackson, S. A. (2009). Next-generation Sequencing Technologies and Their Implications for Crop Genetics and Breeding. Trends Biotechnol. 27, 522–530. doi:10.1016/J.TIBTECH.2009.05.006
Wang, D., Qin, B., Li, X., Tang, D., Zhang, Y. e., Cheng, Z., et al. (2016). Nucleolar DEAD-Box RNA Helicase TOGR1 Regulates Thermotolerant Growth as a Pre-rRNA Chaperone in Rice. PLoS Genet. 12, e1005844–23. doi:10.1371/journal.pgen.1005844
Wang, G., Ellendorff, U., Kemp, B., Mansfield, J. W., Forsyth, A., Mitchell, K., et al. (2008). A Genome-wide Functional Investigation into the Roles of Receptor-like Proteins in Arabidopsis. Plant Physiol. 147, 503–517. doi:10.1104/pp.108.119487
Wang, H., Li, W., Qin, Y., Pan, Y., Wang, X., Weng, Y., et al. (2017). The Cytochrome P450 Gene CsCYP85A1 Is a Putative Candidate for Super Compact-1 (Scp-1) Plant Architecture Mutation in Cucumber (Cucumis Sativus L.). Front. Plant Sci. 8, 1–13. doi:10.3389/fpls.2017.00266
Wang, L., Yin, Y., Wang, L.-F., Wang, M., Zhao, M., Tian, Y., et al. (2020). Transcriptome Profiling of the Elongating Internode of Cotton (Gossypium Hirsutum L.) Seedlings in Response to Mepiquat Chloride. Front. Plant Sci. 10, 1–18. doi:10.3389/fpls.2019.01751
Wickham, H. (2016). ggplot2: Elegant Graphics for Data Analysis. 2nd ed. New York: Springer-Verlag. AvailableAt: https://ggplot2.tidyverse.org (accessed January 05, 2021).
Wu, X., Islam, A. S. M. F., Limpot, N., Mackasmiel, L., Mierzwa, J., Cortés, A. J., et al. (2020). Genome-Wide SNP Identification and Association Mapping for Seed Mineral Concentration in Mung Bean (Vigna Radiata L.). Front. Genet. 11, 1–17. doi:10.3389/fgene.2020.00656
Xiao, C., Somerville, C., and Anderson, C. T. (2014). POLYGALACTURONASE INVOLVED IN EXPANSION1 Functions in Cell Elongation and Flower Development in Arabidopsis. Plant Cell. 26, 1018–1035. doi:10.1105/tpc.114.123968
Xiong, H., Guo, H., Zhou, C., Guo, X., Xie, Y., Zhao, L., et al. (2019). A Combined Association Mapping and T-Test Analysis of SNP Loci and Candidate Genes Involving in Resistance to Low Nitrogen Traits by a Wheat Mutant Population. PLoS One 14, e0211492–15. doi:10.1371/journal.pone.0211492
Xu, P., Wu, X., Muñoz-Amatriaín, M., Wang, B., Wu, X., Hu, Y., et al. (2017). Genomic Regions, Cellular Components and Gene Regulatory Basis Underlying Pod Length Variations in Cowpea (V. unguiculataL. Walp). Plant Biotechnol. J. 15, 547–557. doi:10.1111/PBI.12639
Zhang, Y., He, J., Wang, Y., Xing, G., Zhao, J., Li, Y., et al. (2015). Establishment of a 100-seed Weight Quantitative Trait Locus-Allele Matrix of the Germplasm Population for Optimal Recombination Design in Soybean Breeding Programmes. Exbotj 66, 6311–6325. doi:10.1093/jxb/erv342
Zhang, Y., Yu, C., Lin, J., Liu, J., Liu, B., Wang, J., et al. (2017). OsMPH1 Regulates Plant Height and Improves Grain Yield in Rice. PLoS One 12, e0180825–17. doi:10.1371/journal.pone.0180825
Zhang, Z., Ersoz, E., Lai, C.-Q., Todhunter, R. J., Tiwari, H. K., Gore, M. A., et al. (2010). Mixed Linear Model Approach Adapted for Genome-wide Association Studies. Nat. Genet. 42, 355–360. doi:10.1038/ng.546
Zhao, J., Zhai, Z., Li, Y., Geng, S., Song, G., Guan, J., et al. (2018). Genome-wide Identification and Expression Profiling of the Tcp Family Genes in Spike and Grain Development of Wheat (triticum Aestivum l.). Front. Plant Sci. 9, 1–23. doi:10.3389/fpls.2018.01282
Keywords: Vigna mungo, heritability, yield, GWAS, MTA, QTL, allelic effects
Citation: Singh L, Dhillon GS, Kaur S, Dhaliwal SK, Kaur A, Malik P, Kumar A, Gill RK and Kaur S (2022) Genome-wide Association Study for Yield and Yield-Related Traits in Diverse Blackgram Panel (Vigna mungo L. Hepper) Reveals Novel Putative Alleles for Future Breeding Programs. Front. Genet. 13:849016. doi: 10.3389/fgene.2022.849016
Received: 05 January 2022; Accepted: 20 June 2022;
Published: 11 July 2022.
Edited by:
Aamir Raina, Aligarh Muslim University, IndiaReviewed by:
Senthil Natesan, Tamil Nadu Agricultural University, IndiaAditya Pratap, Indian Institute of Pulses Research (ICAR), India
Copyright © 2022 Singh, Dhillon, Kaur, Dhaliwal, Kaur, Malik, Kumar, Gill and Kaur. This is an open-access article distributed under the terms of the Creative Commons Attribution License (CC BY). The use, distribution or reproduction in other forums is permitted, provided the original author(s) and the copyright owner(s) are credited and that the original publication in this journal is cited, in accordance with accepted academic practice. No use, distribution or reproduction is permitted which does not comply with these terms.
*Correspondence: Satinder Kaur, c2F0aW5kZXIuYmlvdGVjaEBwYXUuZWR1
†ORCID: Lovejit Singh, orcid.org/0000-0003-2804-0429; Guriqbal Singh Dhillon, orcid.org/0000-0001-6766-810X; Sarabjit Kaur, orcid.org/0000-0003-0672-9268; Amandeep Kaur, orcid.org/0000-0002-9140-3424; Palvi Malik, orcid.org/0000-0003-1215-7120; Satinder Kaur, orcid.org/0000-0003-3704-3074