- 1Department of Radiation and Medical Oncology, Zhongnan Hospital of Wuhan University, Wuhan, China
- 2Hubei Key Laboratory of Tumor Biological Behaviors, Zhongnan Hospital of Wuhan University, Wuhan, China
- 3Hubei Cancer Clinical Study Center, Zhongnan Hospital of Wuhan University, Wuhan, China
Background: Immunotherapy has become the new standard of care for recurrent and metastatic head and neck squamous cell carcinoma (HNSCC), and PD-L1 is a widely used biomarker for immunotherapeutic response. However, PD-L1 expression in most cancer patients is low, and alternative biomarkers used to screen the population benefiting from immunotherapy are still being explored. Tumor microenvironment (TME), especially tumor immune-infiltrating cells, regulates the body’s immunity, affects the tumor growth, and is expected to be a promising biomarker for immunotherapy.
Purpose: This article mainly discussed how the immune-infiltrating cell patterns impacted immunity, thereby affecting HNSCC patients’ prognosis.
Method: The immune-infiltrating cell profile was generated by the CIBERSORT algorithm based on the transcriptomic data of HNSCC. Consensus clustering was used to divide groups with different immune cell infiltration patterns. Differentially expressed genes (DEGs) obtained from the high and low immune cell infiltration (ICI) groups were subjected to Kaplan–Meier and univariate Cox analysis. Significant prognosis-related DEGs were involved in the construction of a prognostic signature using multivariate Cox analysis.
Results: In our study, 408 DEGs were obtained from high- and low-ICI groups, and 59 of them were significantly associated with overall survival (OS). Stepwise multivariate Cox analysis developed a 16-gene prognostic signature, which could distinguish favorable and poor prognosis of HNSCC patients. An ROC curve and nomogram verified the sensitivity and accuracy of the prognostic signature. The AUC values for 1 year, 2 years, and 3 years were 0.712, 0.703, and 0.700, respectively. TCGA-HNSCC cohort, GSE65858 cohort, and an independent GSE41613 cohort proved a similar prognostic significance. Notably, the prognostic signature distinguished the expression of promising immune inhibitory receptors (IRs) well and could predict the response to immunotherapy.
Conclusion: We established a tumor immune cell infiltration (TICI)-based 16-gene signature, which could distinguish patients with different prognosis and help predict the response to immunotherapy.
Introduction
Head and neck squamous cell carcinoma (HNSCC) is categorized into oral cavity, nasal cavity, nasopharynx, oropharynx, hypopharynx, larynx, and others. It ranks as the 10th most common malignancy with 600,000 new cases worldwide reported each year (Ferlay et al., 2015). Smoking and drinking are considered to be the two main causes of HNSCC. Recently, accumulating evidence has established a causal role of high-risk human papillomavirus (HPV) infections in the etiology of HNSCC (Castellsagué et al., 2016). HPV-related HNSCC displays significantly increased sensitivity to chemoradiotherapy and is associated with improved prognosis (Chaturvedi et al., 2011; Dok et al., 2020).
Conventional therapies such as surgery and radiotherapy form the basis of early-stage HNSCC treatment, with the 5-year OS reaching 80–90% for surgery and 65–80% for radiotherapy. Despite the extended screening and improvement in treatment in the past few years, more than 50% of HNSCC patients are at an advanced stage when diagnosed, and the 5-year survival rate is only 34.9% (Chauhan et al., 2015). More than 50% of locally advanced patients would develop recurrence or distant metastasis within 2 years, following radical treatment (Sacco and Cohen, 2015). For patients with the late stage, the treatment opportunity is limited after first-line treatment failure. The prognosis of these patients is extremely poor. The 5-year survival rate of these patients is only 3.6%, and the median survival time is less than half a year (Machiels et al., 2015).
In recent years, immunotherapy has achieved great success in a variety of tumors such as non–small cell lung cancer (NSCLC), triple-negative breast cancer (TNBC), melanoma, and other tumors (Luke et al., 2017; Migden et al., 2018; West et al., 2019; Mansfield et al., 2020; Schmid et al., 2020; Paz-Ares et al., 2021). The use of immune checkpoint inhibitors both as second-line and first-line treatments has also led to significant improvement in HNSCC patient prognosis (Ferris et al., 2016; Bauml et al., 2017; Burtness et al., 2019). However, only a part of HNSCC patients could benefit from immunotherapy; most patients have primary resistance or gradual resistance to immunotherapy. The exact mechanism remains incompletely illustrated. Recent studies suggested that the response to immunotherapy might rely on tumor microenvironment (TME). TME was composed of complex components such as extracellular matrix, stromal cells, endothelial cells, immune cells, and various soluble molecules (Wang et al., 2020). Among them, immune-infiltrating cells, including T cells, NK cells, B cells, and macrophages, were the most active and acted directly on tumors. The heterogeneity of tumor immune cell infiltration was another vital factor that determined the best response to the patient’s immunotherapy. Patients with enriched T-cell infiltration might respond better to immunotherapy. On the contrary, patients with poor T-cell infiltration might be resistant to immunotherapy, and additional intervention was needed for those patients (Gajewski et al., 2013; Srinivasan et al., 2018).
Moreover, immune-infiltrating cells proved to be an independent prognostic factor in cancers. For instance, increased infiltration of NK cells was correlated with an improved survival of melanoma, hematological malignancies, and other solid tumors (Fang et al., 2017). Tumor-infiltrating CD4+T cells and CD8+T cells were correlated with superior prognosis of breast cancer, colorectal cancer, glioblastoma, and cervical cancers (Saito et al., 2016; Maimela et al., 2019).
The TME analysis of HNSCC also proved that immune-infiltrating cells, cytokines, and immunomodulatory molecules determine the host’s antitumor immune response ability (Ferris, 2015; Chen and Mellman, 2017). Therefore, a better understanding of the TME, especially the tumor-infiltrating cells, is essential for improving response to immunotherapy and the prognosis of HNSCC patients. In this study, we used the CIBERSORT algorithm to generate a tumor immune cell infiltration profile of HNSCC and then explored the potential relationship between immune-infiltrating cells and patients’ prognosis and immunotherapeutic response. We hope this study will provide valuable insights into the complex tumor immune microenvironment and help us understand how immune status affects cancer cells and immunotherapy.
Materials and Methods
Data Acquisition and Processing
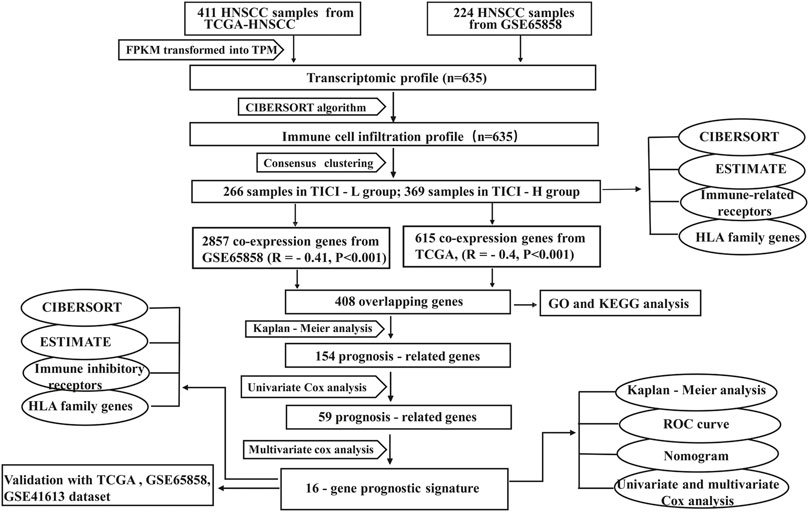
The HNSCC RNA-seq data and the corresponding clinical information were downloaded from The Cancer Genome Atlas database (TCGA, https://portal.gdc.cancer.gov/) and Gene Expression Omnibus database (GEO, https://www.ncbi.nlm.nih.gov/gds). The GSE65858 dataset generated by Illumina was processed using the lumi software package. The GSE41613 dataset from Affymetrix was processed using the RMA algorithm. As for TCGA-HNSCC microarray data, RNA-seq data in the form of fragments per kilobase of transcript per million mapped reads (FPKM) were adjusted to the form of transcripts per kilobase of transcript per million mapped reads (TPM) using the function tpm in the edge package. We presented the expression profile of TCGA cohort similar with the results from the GSE65858 cohort and GSE41613 cohort, so that the data were comparable among samples (Wagner et al., 2012; Zeng et al., 2019). The batch effects between different datasets within the same platform were adjusted by the ComBat method (Leek et al., 2012). The workflow of our study was shown in Figure 1.
Consensus Clustering for Immune-Infiltrating Cells
The CIBERSORT algorithm (Newman et al., 2015) was applied to generate the immune cell infiltration profiles. Then, consensus clustering was performed to determine different immune cell infiltration patterns using the ConsensusClusterPlus package (Wilkerson and Hayes, 2010). The ESTIMATE algorithm (Yoshihara et al., 2013) was used to generate immune score, estimate score, and stromal score using the “ESTIMATE” package of R.
Weighted Gene Co-expression Network Analysis
The weighted gene co-expression network analysis (WGCNA) was used to identify the co-expressed gene modules using the WGCNA package of R. A threshold was set to β = 0.5 to ensure a scale-free network. The dendrogram visually displayed the clustering of genes, and the heatmaps showed the correlation between co-expressed gene modules and TICI. In our study, positive correlation modules with high relevant coefficients from the GSE65858 cohort and TCGA cohort were identified. Finally, the overlapping co-expressed genes from these two cohorts were visualized as Venn diagram using the VennDiagram package of R and were used for stepwise prognosis-related gene identification.
Functional and Pathway Annotation
The gene ontology (GO) function and the Kyoto Encyclopedia of Genes and Genomes (KEGG) pathway enrichment analysis were performed for the overlapping co-expressed genes using the clusterProfiler package.
Establishment of the Prognostic Signature and Preliminary Exploration of the Genes of the Signature
Kaplan–Meier and univariate Cox regression analyses were performed to identify the prognosis-related genes. With multivariate Cox analysis, we developed a prognostic signature. The risk formula is as follows:
Coefi, expi, and n represented the multivariate Cox regression coefficient, the gene expression value, and the number of genes in the prognostic signature, respectively. Next, the roles of the genes in the prognostic signature were explored in mRNA and protein expression levels with the HPA database (https://www.proteinatlas.org/) (Uhlen et al., 2010).
Verification of the Prognostic Signature
The risk scores of the 635 HNSCC patients were calculated according to the risk formula, and the HNSCC patients were assigned into high- and low-risk groups according to the optimal cutoff value of the risk score based on the maximum value of (sensitivity + specificity-1) in the ROC curve (Youden index) using the surv_cutpoint function of the survminer R package. Kaplan–Meier analysis, risk curves, ROC curves, nomogram, and univariate and multivariate Cox analyses were used to evaluate the prognostic signature. In addition, TCGA-HNSCC subgroup, GSE65858 subgroup, and an external GSE41613 cohort were used as the validation groups to verify the gene prognostic signature.
Since the prognostic signature was developed based on the TICI, the correlation analysis of signature genes with immune-infiltrating cells and immune score was performed. The expression of immune inhibitor receptors (PD-L1, PD-1, CTLA-4, LAG3, HAVCR2, and TIGIT) in the high- and low-risk groups was also compared. Moreover, the Tumor IMmune Estimation Resource database (TIMER: https://cistrome.shinyapps.io/timer/) (Li et al., 2017) was used to investigate the association between prognostic genes of the signature and immune-infiltrating cells (CD8+T cells, CD4+T cells, B cells, macrophages, neutrophils, and dendritic cells).
Mutation and Prognostic Signature
The Masked Somatic Mutation data (VarScan) of HNSCC was downloaded from TCGA database and was processed using the maftools package of R (Mayakonda et al., 2018). The mutation characteristics in HNSCC were analyzed, and the correlation analysis between mutation and risk score was performed.
Gene Set Enrichment Analysis
GSEA (version GSEA 4.1.0) was performed to annotate the function and pathway enrichment of the prognostic signature.
Statistical Analysis
Perl was used for data processing. R (MathSoft, version 4.0.3) was used for plotting and statistical analysis. The packages used were as follows: limma, pheatmap, ggplot2, org.Hs.eg.db, clusterProfiler, VennDiagram, WGCNA, preprocessCore, estimate, enrichplot, survival, glmnet, survminer, survivalROC, beeswarm, and rms. Meta-analysis was performed to assess heterogeneity of different cohorts and to generate the hazard rate of the risk score of each dataset using the Stata software (Texas, U.S., StataIC 15).
The Mann–Whitney test was performed for continuous variables of two groups, and the Kruskal–Wallis test was performed for continuous variables of multiple groups (with the Bonferroni correction for pairwise comparisons among multiple groups). The log-rank test and Cox regression were used for survival analysis. All tests were two-sided, and for all statistical tests, a value of p < 0.05 was considered statistically significant unless otherwise specified.
Results
Establishment and Evaluation of TICI-Related Groups
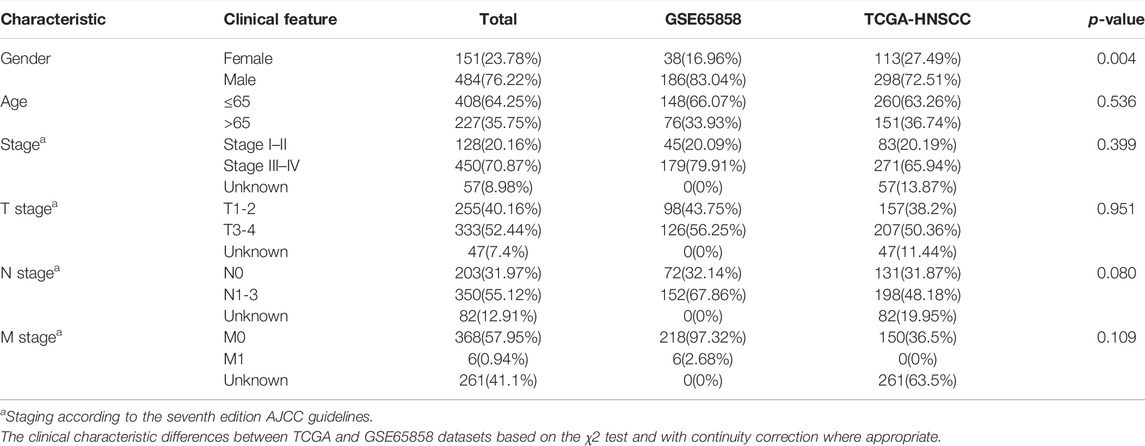
The immune cell infiltration profile was generated based on the transcriptomic data of TCGA cohort (n = 411) and GSE65858 cohort (n = 224). The clinical characteristics of these two cohorts are shown in Table 1. The patients were divided into two immune infiltration patterns using consensus clustering (Figure 2A). In our study, the cluster with high infiltration of CD8+T cells, activated memory CD4+T cells, activated NK cells, follicular helper T cells, memory B cells, naive B cells, plasma cells, and M1 and M2 macrophages was named the high tumor immune cell infiltration (TICI) group. On the other hand, the cluster with low infiltration of the aforementioned immune cells but with high infiltration of resting immune cells or inflammatory cells, such as resting memory CD4+T, resting NK cells, neutrophils, M0 macrophages, and mast cells, was named the low TICI group (Figure 2B). Kaplan–Meier analysis of these tumor immune-infiltrating cells indicated that high infiltration of activated CD4+T cells, CD8+T cells, follicular helper T cells, and naive B cells was related with favorable prognosis, while high infiltration of M0 macrophages, neutrophils, and mast cells was related with poor prognosis (Supplementary Figure S1). Perhaps not surprised, the high-ICI group was associated with an improved survival rate, and the low-TICI group was related with a poor survival rate (Supplementary Figure S2).
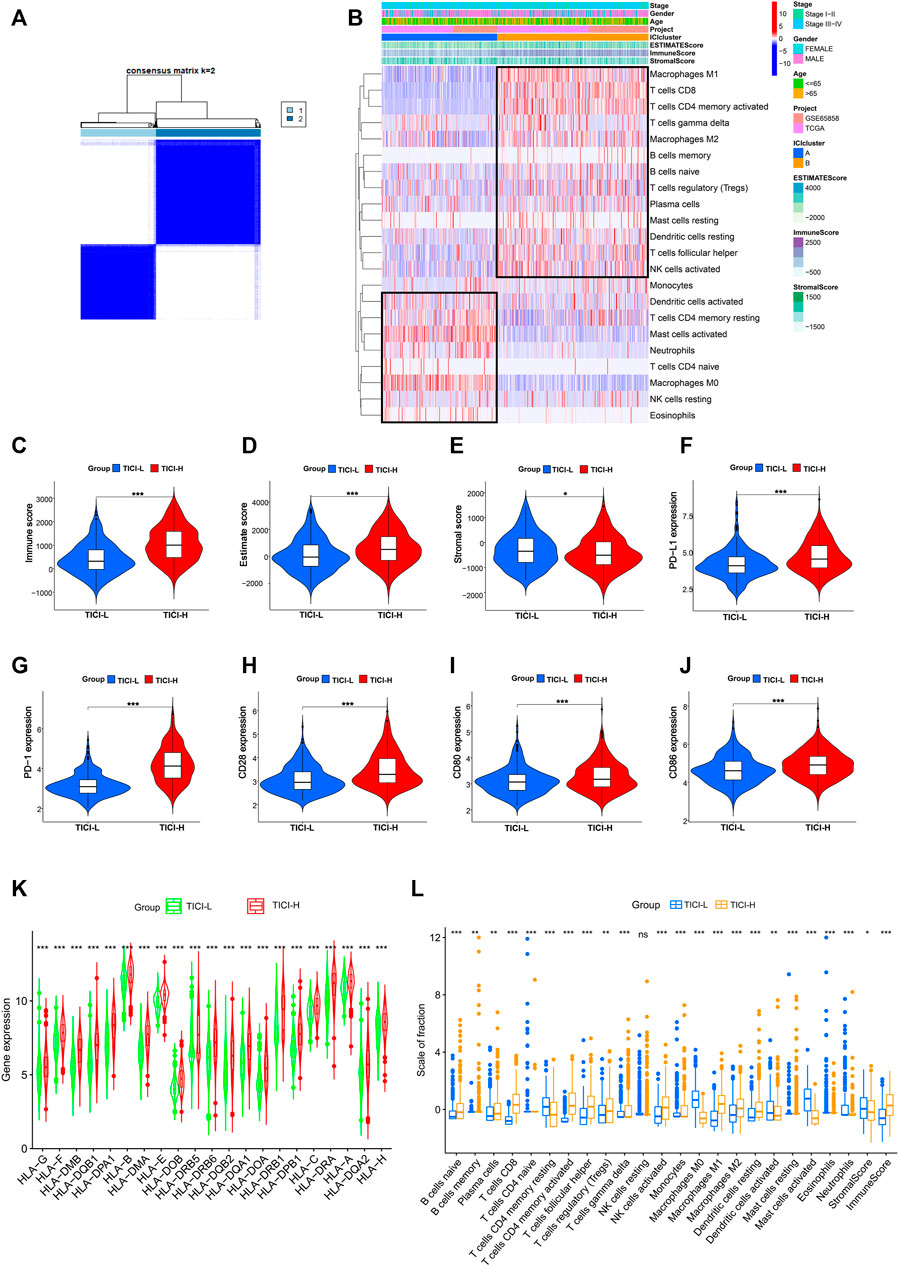
FIGURE 2. (A) Consensus clustering matrix for k = 2. (B) Heatmap of immune-infiltrating cells. (C–E) Immune score, estimate score, and stromal score in the high- and low-TICI groups. (F–J) Expression of PD-L1, PD-1, CD28, CD80, and CD86 in the high- and low-TICI groups. (K) Expression of HLA genes in the high- and low-TICI groups. (L) Immune-infiltrating cells in the high- and low-TICI groups.
Next, we explored the immune features of these two ICI-related groups. First, the estimate score and immune score were higher in the high-ICI group, while the stromal score was higher in the low-ICI group (Figures 2C–E). The expression of immune-related genes such as PD-L1, PD-1, CD80, CD28, CD86, and human leukocyte antigen (HLA) family genes was also significantly higher in the high-ICI group (Figures 2F–K). The infiltration of the immune cells between the two groups is shown in Figure 2L.
Taken together, high- and low-ICI groups were presented with distinct immune cell infiltration characteristics, different immune-related molecule expression, and were associated with different prognosis. Compared with the low-TICI group, the high-TICI group might have good immunoreactivity.
Weighted Gene Co-expression Network Analysis
In TCGA dataset, the black module (|r| = 0.4, p = 4e−16) and green–yellow module (|r| = 0.43, p = 6e−20) were highly positively related with high-TICI compared with the other modules and were chosen as the candidate modules because the black module had much more TICI-related genes than the green–yellow module and was finally chosen for subsequent analysis. Similarly, the turquoise module (|r| = 0.41, p = 3e−10) in the GSE65858 dataset highly relevant to high-TICI was selected for subsequent analysis (Figures 3A–D). Ultimately, a total of 408 overlapping genes from the black module in TCGA dataset and the turquoise module in the GSE65858 dataset were obtained and participated in subsequent identification of prognosis-related genes (Figure 3E).
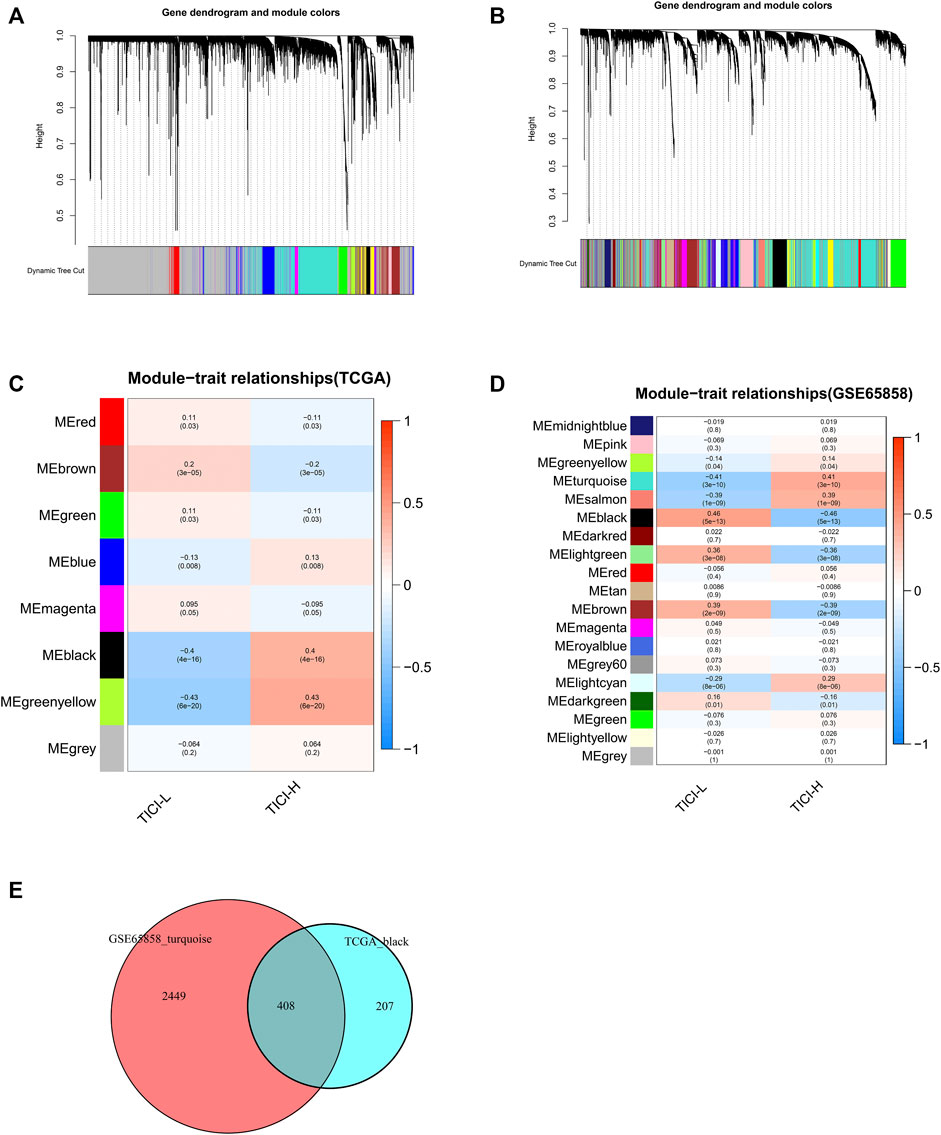
FIGURE 3. Identification of TICI-related co-expressed genes. (A,B) Clustering dendrograms of TCGA dataset (A) and GSE65858 dataset (B). (C,D) Correlation heatmaps of different modules and TICI in TCGA dataset (C) and GSE65858 dataset (D). (E) Identification of the overlapping co-expressed genes from the black module in TCGA dataset and the turquoise module in the GSE65858 dataset using VennDiagram software.
GO and KEGG Analysis
The expression of the 408 overlapping genes between high- and low-TICI groups is shown in Figure 4A. GO and KEGG analysis were performed to explore the biological characteristics of the 408 genes. For biological processes (BP), these genes mainly participated in T-cell activation, lymphocyte differentiation, leukocyte cell–cell adhesion, and lymphocyte and leukocyte proliferation. In terms of cellular components (CC), these genes were related to the MHC protein complex. The changes in molecular function (MF) showed that these genes were correlated with immune receptor activity, cytokine binding, MHC class II receptor activity, cytokine receptor activity, and MHC class II protein complex binding. The KEGG pathway analysis indicated that these genes were mainly enriched in signal pathways such as hematopoietic cell lineage, intestinal immune network for IgA production, cell adhesion molecules, and Th1, Th2, and Th17 cell differentiation (Figures 4B–E).
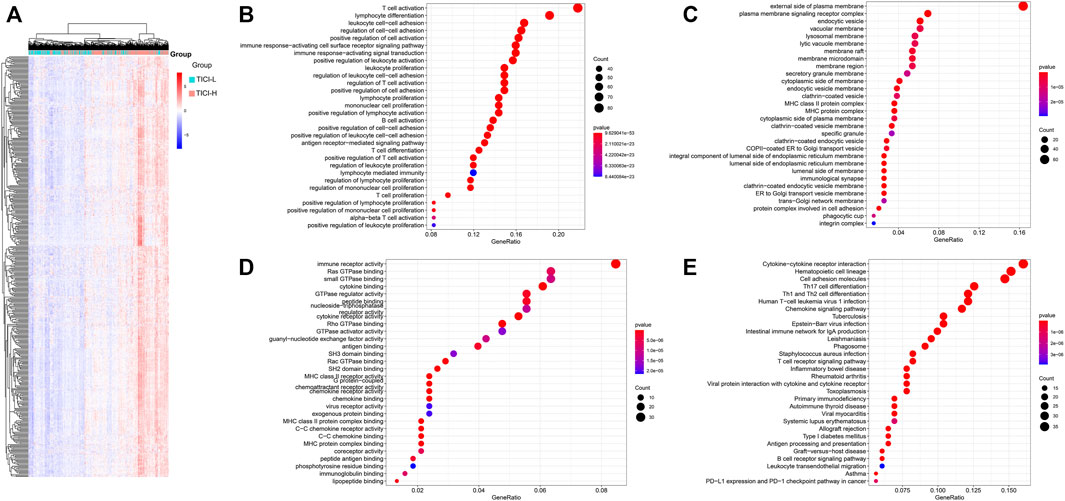
FIGURE 4. (A) Heatmap of the overlapping co-expressed genes; (B–E) GO and KEGG analysis for the overlapping co-expressed genes. BP (B), CC (C), MF (D), and KEGG pathway (E).
Evaluation and Validation of the 16-Gene Prognostic Signature
Using multivariate Cox analysis, we obtained the following risk formula:
Risk score = (P2RY8 ∗ 0.490331935) + (FLT3LG ∗ −0.363760832) + (GIMAP1 ∗ 0.387873078) + (CD79A ∗ −0.168052271) + (SLAMF6 ∗ 0.368179613) + (FGD3 ∗ −0.238932879) + (IKZF3 ∗ 0.193711011) + (FAM107A ∗ −0.263580347) + (MAP4K1 ∗ 0.373764051) + (GZMM ∗ −0.223385774) + (CCR7 ∗ −0.508653299) + (P2RY10 ∗ 0.321200005) + (XCR1 ∗ −0.277393854) + (NLRC3 ∗ −0.374350099) + (UBASH3A ∗ −0.454714574) + (ABCB1 ∗ −0.45779747).
Also, the multivariate Cox analysis of the 16 genes is shown in Figure 5A. Based on the risk formula, we calculated the risk score for each of the 635 HNSCC patients. According to the maximum value of the Youden index, we obtained the optimal cutoff value of the risk score, and the patients were divided into high- (n = 259) or low-risk group (n = 376) based on the cutoff value (Figure 5B). The Kaplan–Meier analysis showed that the low-risk group had significantly favorable prognosis compared with the high-risk group (Figure 5C). Moreover, the patients in the low-risk group also had better OS in different clinical subgroups (age (≤65 versus >65 years old), sex (male versus female), T stage (T1-2 versus T3-4), N stage (N0 versus N1-3), and pathological stage (stage I–II versus stage III–IV)) (Supplementary Figure S3). The AUC values were 0.712 for 1 year, 0.703 for 2 years, and 0.700 for 3 years (Supplementary Figure S4A). The risk score, the survival status, and the expression features of the 16 prognostic genes of the 635 HNSCC patients are shown in Figures 5D–F. In addition, we integrated age, gender, T stage, N stage, and risk score for prognosis analysis and drew an OS nomogram (Supplementary Figure S4B). The calibration curves further confirmed the prognostic value of the gene signature (Supplementary Figures S4C–E). Univariate Cox analysis indicated that the risk score (HR = 2.781, 95%CI: 2.132–3.626, p < 0.001) was closely related with the OS (Supplementary Figure S4F). When the clinical parameters (age, gender, pathology stage, T stage, and N stage) were included into the multivariate Cox regression analysis, we observed that the risk score (HR = 2.579, 95%CI = 1.953-3.404, p < 0.001) was an independent prognostic predictor (Supplementary Figure S4G).
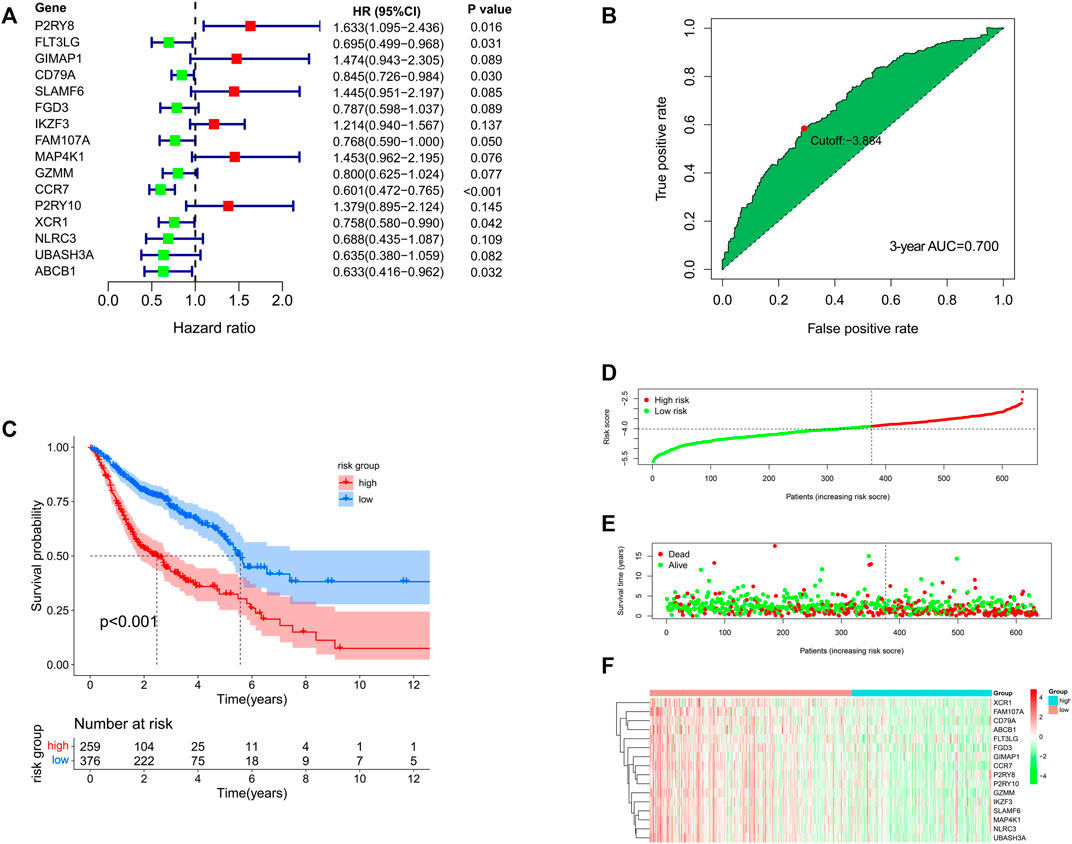
FIGURE 5. (A) Multivariate Cox analysis for the 16 genes in the prognostic signature. (B) Best cutoff value based on the ROC curve. (C) Kaplan–Meier analysis for the high- and low-risk groups. (D–F) Distribution of risk score, survival status, and the expression feature of the 16 prognostic genes of the 635 HNSCC patients.
In our study, TCGA subgroup, GSE65858 subgroup, and an independent GSE41613 dataset were used to further verify the prognostic signature. Perhaps not surprising, the OS of HNSCC patients in the low-risk group of TCGA cohort and GSE65858 cohort were significantly longer than that of the high-risk group (Supplementary Figures S5A,B). The 1-, 2-, and 3-year AUC values in TCGA cohort were 0.702, 0.701, and 0.703, respectively, and those in GSE65858 cohort were 0.737, 0.713, and 0.684, respectively (Supplementary Figures S5D,E). GSE41613 was an independent cohort composed of 97 HNSCC patients. According to the optimal cutoff value of the risk score, the patients in the GSE41613 cohort were assigned into a high- or low-risk group. Patients in the low-risk group had improved OS compared with the high-risk group (Supplementary Figure S5C). The 1-, 2- and 3-year AUC values of the GSE41613 cohort were 0.701, 0.600, and 0.567, respectively (Supplementary Figure S5F).
In order to confirm the predictive performance of these cohorts, meta-analysis was performed using the Stata software. Comparing the standardized mean difference (SMD) of these cohorts, we observed no obvious heterogeneity among TCGA cohort, GSE65858 cohort, the merger cohort (TCGA + GSE65858), or even GSE41613 cohort (p = 0.727) which indicated that these cohorts were comparable and the merger of TCGA cohort and GSE65858 cohort was reasonable (Supplementary Figure S5G). Considering that 1-, 2- and 3-year AUC values of the GSE41613 cohort were 0.701, 0.600, and 0.567, respectively, we performed multivariate Cox analysis on the HNSCC patients within 3-year OS. The result showed that the risk score was an independent risk factor with HR being 2.25 (95%CI: 1.81–3.34, p < 0.05) in TCGA cohort, HR being 3.12 (95%CI: 1.98–4.91, p < 0.05) in the GSE65858 cohort, HR being 2.63 (95%CI: 2.04–3.39, p < 0.05) in the merger cohort, HR being 1.80 (95%CI: 1.14–2.84, p < 0.05) in the GSE41613 cohort, and HR being 2.50 (95%CI: 2.11–2.97, p < 0.05) of the total combined effect (Supplementary Figure S5H).
Preliminary Exploration of the Prognostic Genes in the Prognostic Signature
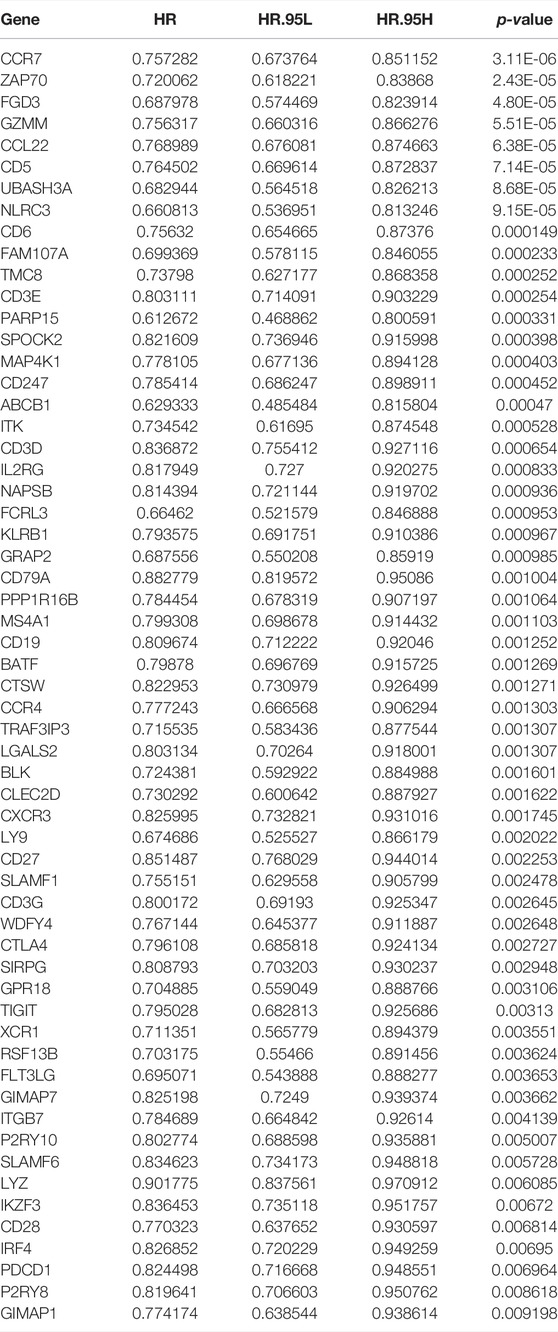
Next, the 408 overlapping genes were subjected into Kaplan–Meier analysis and univariate Cox analysis. A total of 59 prognosis-related genes were further identified (Table 2) and were introduced into multivariate Cox analysis. Finally, 16 prognosis-related genes (P2RY8, FLT3LG, GIMAP1, CD79A, SLAMF6, FGD3, IKZF3, FAM107A, MAP4K1, GZMM, CCR7, P2RY10, XCR1, NLRC3, UBASH3A, and ABCB1) were determined and participated in the construction of the prognostic signature. The Kaplan–Meier analysis of the 16 genes in the prognostic signature is shown in Supplementary Figure S6.
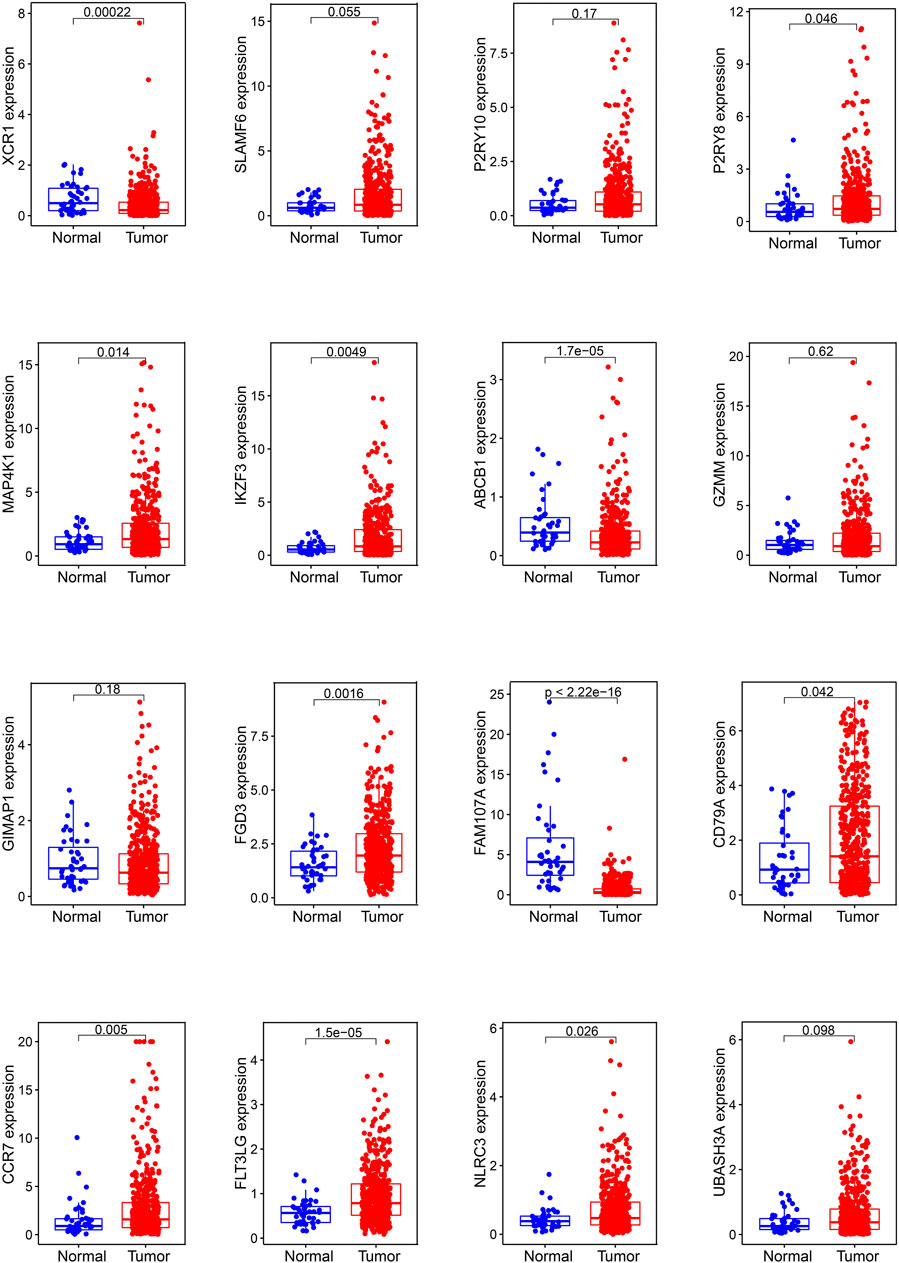
In mRNA expression levels, P2RY8, MAP4K1, IKZF3, FGD3, CD79A, CCR7, FLT3LG, and NLRC3 were highly expressed in HNSCC tissues. On the other hand, XCR1, ABCB1, and FAM107A were highly expressed in normal tissues (Figure 6). We further checked the protein levels of these prognostic genes between the HNSCC and normal tissues with the HPA database. Notably, we observed that the protein levels of XCR1, FGD3, and CD79A were moderately expressed in HNSCC tissues. The CCR7 protein level was highly expressed in HNSCC tissues, and the protein levels of P2RY10 and GIMAP1 were both moderately expressed in HNSCC and normal tissues (Figure 7).
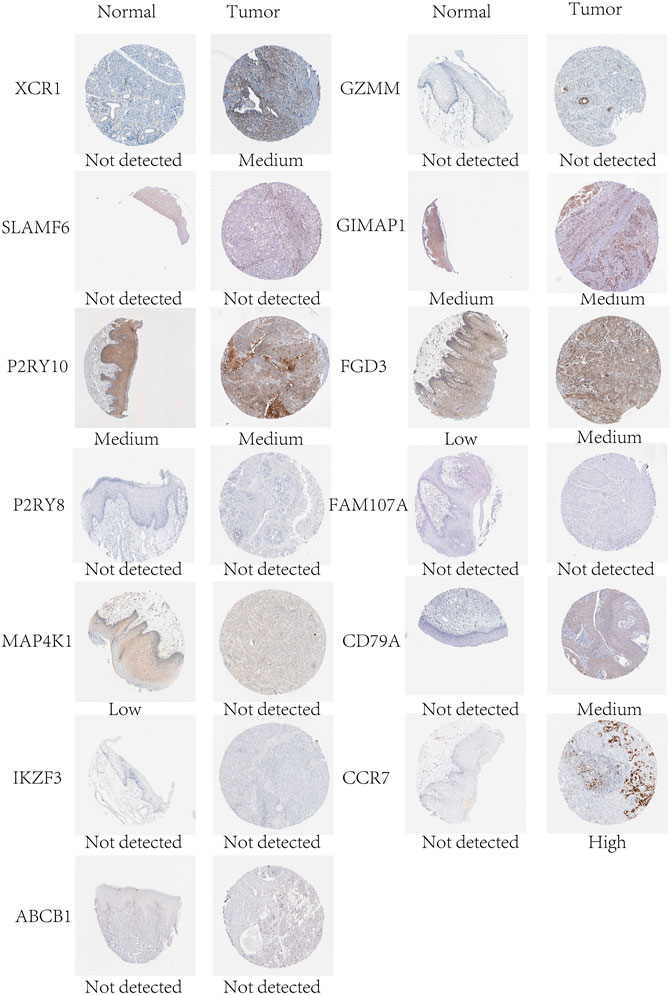
FIGURE 7. Protein expression levels of the genes of the prognostic signature in normal and HNSCC tissues in the HPA database.
Prognostic Signature and Immunity
Since the prognostic signature was developed based on TICI, we subsequently explored the potential relationship between the prognostic signature and immunity. Through correlation analysis between the prognostic genes in the gene signature and immune score, we observed that the 16 genes were all positively associated with the immune score (Supplementary Figure S7). The correlation analysis of the immune-infiltrating cells and risk score indicated that the infiltration of activated memory CD4+T cells, CD8+T cells, and follicular helper T cells and B cells was negatively related with the risk score, while the infiltration of M0 and M2 macrophages was positively related with the risk score (Supplementary Figure S8). Indeed, activated memory CD4+T cells, CD8+T cells, and follicular helper T cells and B cells had higher infiltration in the low-risk group, and M0 and M2 macrophages had higher infiltration in the high-risk group (Supplementary Figure S9A). Comparing the immune-related scores between the low- and high-risk groups, we found that the immune score and estimate score were higher in the low-risk group (Supplementary Figures S9B–D). The TIMER database was used to explore the relationship between the 16 prognostic genes and immune-infiltrating cells. As shown in Supplementary Figure S10, all the 16 genes (P2RY8, FLT3LG, GIMAP1, CD79A, SLAMF6, FGD3, IKZF3, FAM107A, MAP4K1, GZMM, CCR7, P2RY10, XCR1, NLRC3, UBASH3A, and ABCB1) were significantly associated with B cells, CD4+T cells, CD8+T cells, dendritic cells, neutrophils, and macrophages.
Notably, the prognostic signature could distinguish the expression of immune inhibitor receptors (PD-1, CTLA-4, LAG3, HAVCR2, and TIGIT) and HLA genes well. Compared with the high-risk group, the low-risk group had high expression of PD-1, CTLA-4, LAG3, TIGIT, HAVCR2, and HLA genes (Supplementary Figure S9E). Unfortunately, there was no statistical difference in PD-L1 gene expression between the high- and low-risk groups (Figures 8A–F).
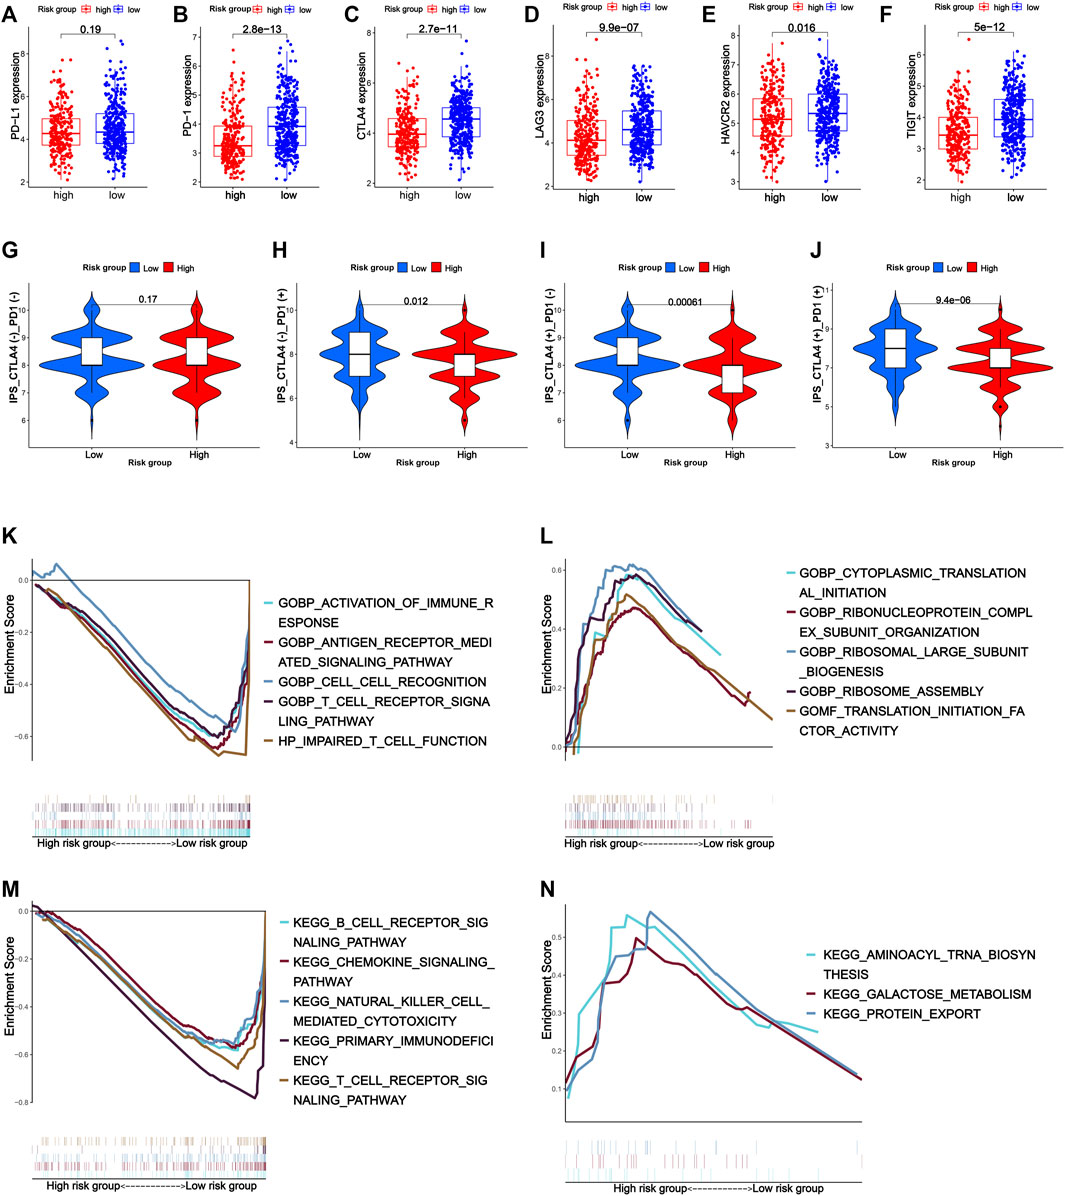
FIGURE 8. Expression of immune inhibitor receptors such as PD-L1 (A), PD-1 (B), CTLA-4 (C), LAG3 (D), HAVCR2 (E), and TIGIT (F) between the high- and low-risk groups. (G–J) Response to immune checkpoint inhibitors of the high- and low-risk groups. (K–N) Gene set enrichment analysis. (K) Top five GO terms in the low-risk group. (L) Top five GO terms in the high-risk group. (M) Top five KEGG pathways in the low-risk group. (N) Top three KEGG pathways in the high-risk group.
Considering the patients in the low-risk group had higher tumor immune cell infiltration and a higher expression of immune-related biomarkers, they were supposed to have better response to immunotherapy. As expected, the low-risk group had a higher IPS (immunophenoscore) of CTLA4 and PD-1, which reflected the percentages of the expression of certain immune genes on tumor-associated immune cells such as lymphocytes and macrophages and were biomarkers for good response to immune checkpoint inhibitor treatment, suggesting that the low-risk group might respond better to anti-PD-1 therapy, anti-CTLA-4 therapy, and anti-PD-1 combined with anti-CTLA-4 therapy (Figures 8G–J).
Gene Set Enrichment Analysis
GSEA was used to explore the function and pathway enrichment of the high- and low-risk groups. In general, the low-risk group was associated with more immune-related GO terms and KEGG pathways compared with the high-risk group. GO analysis showed that the low-risk group was mainly related with activation of immune response, antigen receptor-mediated signaling pathway, cell–cell recognition, T-cell receptor signaling pathway, and impaired T-cell function. KEGG analysis indicated that the low-risk group was active in immune-associated pathways such as B-cell receptor signaling pathway, chemokine signaling pathway, natural killer cell-mediated cytotoxicity signaling pathway, primary immunodeficiency signaling pathway, and T-cell receptor signaling pathway, while there was little immune-related GO term and KEGG pathway enriched in the high-risk group (Figures 8K–N).
Tumor Mutational Burden and Prognostic Signature
We downloaded the somatic mutation data of HNSCC patients from TCGA database and utilized the “maftools” package to visualize the mutation data. As illustrated in Figure 9, the top five mutated genes of HNSCC were TP53 (66%), TTN (35%), FAT1 (21%), CDKN2A (20%), and MUC16 (17%) (Figure 9A). Missense mutation, single-nucleotide polymorphism (SNP), and C > T were the most common mutation types in HNSCC (Figure 9B).
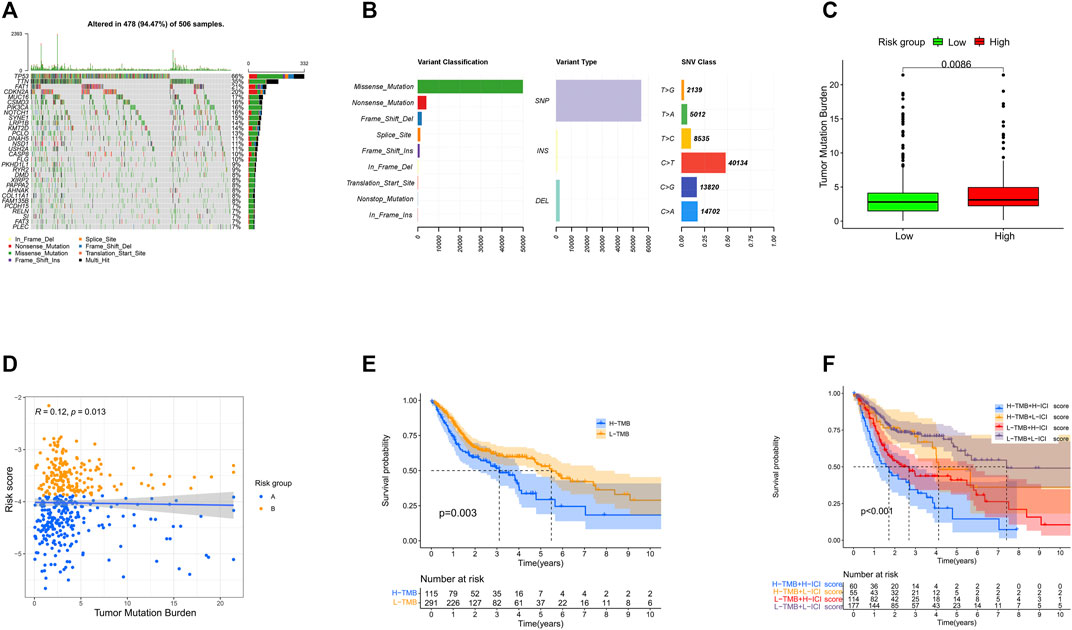
FIGURE 9. Landscape of the mutations in HNSCC. (A) Distribution of mutation types among the top 30 genes. (B) Variant classifications, variant types, and SNV classes. (C) Levels of tumor mutation burden in high- and low-risk groups. (D) Correlation between the risk score and tumor mutation burden. (E) Survival analysis of tumor burden mutation. (F) Survival analysis of tumor mutation burden combined with the risk score.
Then, we calculated the TMB (the total number of mutation events per million bases) of each HNSCC patient and explored the potential relationship of TMB and the prognostic signature. Interestingly, we found that the high-risk group had higher TMB, and there was a weak positive correlation between the TMB and risk score (Figures 9C,D). According to the optimal cutoff value (cutoff value being 4.2), the patients were classified into a high- (n = 115) or low-TMB (n = 291) group. The Kaplan–Meier analysis showed that the high-TMB group was associated with poorer prognosis (p = 0.003) (Figure 9E). Accordingly, the patients with a high TMB and high-risk score had the worst OS in our study (Figure 9F).
Discussion
In the past few years, immune checkpoint inhibitors have reshaped the landscape of the treatment of HNSCC. The combined positive score (CPS) of PD-L1 was so far the most effective predictive biomarker of response to immunotherapy in HNSCC, while the other biomarkers including tumor mutation burden and microsatellite instability have not been well established. Extensive evidence indicates that tumor microenvironment including stromal cells, fibroblasts, extra-endothelial cells, innate immune cells (macrophages, neutrophils, dendritic cells, innate lymphocytes, bone marrow–derived suppressor cells, and NK cells), and adaptive immune cells (T cells and B cells) may be useful targets for immunotherapy strategies and closely related to the host’s antitumor ability (Ngiow et al., 2015; Srinivasan et al., 2018). Due to the importance and complexity of tumor immune cell infiltration, we aimed to explore the potential relationship between different immune cell infiltration patterns, HNSCC patients’ prognosis, and immune heterogeneity and to identify prognosis-related DEGs by comparing the expression profiles of different infiltration patterns. Finally, we developed a TICI-based 16-gene prognostic signature.
First, we preliminarily explored the relationship between tumor immune-infiltrating cells and prognosis. It is well known that NK cells and CD8+T cells are the most promising targets in immunity therapy. NK cells directly induce tumor cell death by releasing perforins and granzymes, and cytotoxic CD8+T cells induce tumor cell death with the engaging of the major histocompatibility complex (MHC) with or without the help of Th cells (Cheng et al., 2013; Henning et al., 2018). Other important cells such as macrophages accumulate significantly in tumor microenvironment. M1 macrophages secrete pro-inflammatory cytokines and have antitumor properties, while M2 macrophages produce anti-inflammatory cytokines and exert pro-tumor properties (Xiao et al., 2020). In our study, immune-infiltrating T cells and B cells were associated with superior prognosis, while M0 macrophages, neutrophils, and mast cells were related with poor prognosis. Using consensus clustering, we obtained two immune cell infiltration patterns. The cluster with high infiltrating cells such as T cells, B cells, NK cells, and M1 macrophages was named the high-TICI group. On the other hand, the cluster with high infiltration of immune resting cells or inflammatory cells such as resting memory CD4+T, resting NK cells, M0 macrophages, neutrophils, and mast cells was named the low-TICI group. The heterogeneity of tumor immune cell infiltration was also a vital factor in determining the patients’ prognosis. Zeng et al. (2019) found that high tumor-infiltrating CD4+T cells, CD8+T cells, NK cells, and M1 macrophages were associated with favorable prognosis in gastric cancer. Just as the previous study, the high-TICI group with high infiltration of T cells, B cells, NK cells, and M1 macrophages was related to improved OS, and the low-TICI group with low infiltration of these cells was related to poor OS.
Except for difference in immune cell infiltration, the high-TICI and low-TICI groups had significant difference in immune score, estimate score, HLA gene, and T-cell activation-related receptor (PD-L1, PD-1, CD28, CD80, CD86) expression. In detail, the high-TICI group had higher immune score, estimate score, and higher expression of HLA genes and T-cell activation-related genes. Extensive studies showed that the expression of the immunosuppressive receptors negatively regulated T cells; however, contradictory to the aforementioned mechanism was that high immune cell infiltration, especially high T-cell infiltration, was accompanied by a high expression of immune inhibitor receptors. One possible explanation could be that the increased immune infiltrating cells triggered antitumor immunity and escaped the antitumor immunity; the tumors upregulated the expression of these immunosuppressive genes such as PD-L1 expression (Klümper et al., 2020; Liu et al., 2020). In turn, the immune-infiltrating cells were downregulated by immune inhibitor receptors (Juneja et al., 2017). Under these circumstances, treating with immune checkpoint inhibitors would bring the patients’ best response to immunotherapy. Thus, immune inhibitor genes and tumor immune cell infiltration used together to evaluate the response to immunotherapy could be more effective.
Using weighted gene co-expression network analysis, we acquired 408 TICI-related co-expressed genes. Different patterns of immune infiltration generated different gene expression characteristics. In our study, mRNAs related to the functions of T-cell activation, leukocyte proliferation, lymphocyte differentiation and proliferation, and MHC class II receptor activity were highly expressed in the high-TICI group, whereas they were low expressed in the low-TICI group. Similarly, mRNAs correlated with the signaling pathways of hematopoietic cell lineage, intestinal immune network for IgA production, cell adhesion molecules, and Th1, Th2, and Th17 cell differentiation were highly expressed in the high-TICI group and low expressed in the low-TICI group.
With multivariate Cox analysis, we developed a 16-gene prognostic signature. Almost all the 16 prognostic genes (P2RY8, P2RY10, FLT3LG, GIMAP1, CD79A, SLAMF6, FGD3, IKZF3, FAM107A, MAP4K1, GZMM, CCR7, XCR1, NLRC3, UBASH3A, and ABCB1) were immune-related. GZMM (granzyme) was an exogenous serine protease highly expressed in NK cells and cytotoxic lymphocytes. GZMM could induce different cell deaths by activating apoptosis-related enzyme systems. Wang et al. (2012) showed that the human NK cell line KHYG-1 with high GZMM expression showed great ability to kill tumor cells. CCR7 (C-C Motif Chemokine Receptor 7) was a protein-coding gene and its encoded protein was a member of the G protein–coupled receptor family. Itakura et al. (2013) proved that CCR7 played a unique role in regulating T-cell activation and controlling the migration of memory T cells to inflamed tissues. CCR7 expression was associated with better prognosis in lung cancers. P2RY8 (P2Y Receptor Family Member 8) was a Gα13-coupled receptor, which regulated the migration inhibition and growth of B cells. P2RY8 was frequently mutated in diffuse large B-cell lymphoma and Burkitt lymphoma (Lu et al., 2019; He et al., 2022). P2RY10 (P2Y Receptor Family Member 10) was also a G-protein-coupled receptor. P2RY10 could facilitate chemokine-induced CD4+T cell migration and was potentially involved in the immune response (Gurusamy et al., 2021). FLT3LG (Fms Related Receptor Tyrosine Kinase 3 Ligand) combined with FLT3 on dendritic cells to stimulate their differentiation and proliferation. In addition, FLT3LG was a biomarker that reflected the clinical response of oxaliplatin (Pol et al., 2020). GIMAP1 (GTPase, IMAP Family Member 1) was involved in the differentiation of Th cells and was essential for the development and survival of mature B and T lymphocytes (Saunders et al., 2010). CD79A was a B cell receptor; Tagliabue et al. (2020) found that high expression of CD79A was associated with significantly better prognosis of laryngeal cancer. SLAMF6 was an immune inhibitor receptor, and its overexpression led to the exhaustion and decreased proliferation ability of CD8+T cells (Yigit et al., 2019; Hajaj et al., 2020). FGD3 was a protein-coding gene, and Susini et al. (2021) found that high expression of FGD3 in breast cancer was associated with good disease-free survival and overall survival. Moreover, it was also a prognosis-related gene of head and neck squamous cell carcinoma, lung adenocarcinoma, cervical squamous cell carcinoma, bladder urothelial carcinoma, and sarcoma. IKZF3 was a specific transcription factor involved in regulating lymphocyte proliferation and differentiation. Highly expressed IKZF3 in T cells was related with improved OS in symptomatic stage III multiple myeloma patients treated with immunotherapy (Awwad et al., 2018). FAM107A (Family with sequence similarity 107, member A) was a candidate tumor suppressor gene. It was low expressed in laryngeal squamous cell carcinoma and participated in the occurrence of lung cancer (Zhou et al., 2020; Yan and Chen, 2021). MAP4K1 (Mitogen-Activated Protein Kinase Kinase Kinase Kinase 1) was involved in promoting T-cell failure in multiple cancers, while it was associated with favorable prognosis of muscle-invasive bladder cancer (van der Heijden et al., 2016). XCR1 was a chemokine receptor of the G protein-coupled receptor superfamily. A study showed that cross-presenting XCR1 dendritic cells had a specialized ability to initiate effector CD8+T cells and mediate antitumor responses. Therefore, XCR1 could be considered a target for cancer immunotherapy (Audsley et al., 2020). NLRC3 (NLR Family CARD Domain Containing 3) was negatively regulating the innate immune response. In addition, NLRC3 could attenuate PI3K-mTOR signaling pathways and inhibit colorectal cancer cell proliferation (Karki et al., 2016). UBASH3A (Ubiquitin-associated and SH3 containing A) was a negative regulator of T cells. Combined with CBL-B, UBASH3A could inhibit CD28-mediated signal transduction, thereby negatively regulating T-cell activation. UBASH3A also played an important role in autoimmunity (Ge et al., 2019). ABCB1 (ATP Binding Cassette Subfamily B Member 1) was shown to involve in multiple chemotherapeutic drug resistance (Zhou et al., 2019; Belisario et al., 2020; Luo et al., 2020).
Importantly, the prognostic signature constructed by the aforementioned 16 genes could distinguish HNSCC patients with favorable and poor prognosis, and it could even distinguish the prognosis of HNSCC patients with different clinical characteristics well. ROC curves and OS nomogram further confirmed the sensitivity and accuracy of the prognostic signature. In addition, two subgroups (TCGA-HNSCC cohort and GSE65858 cohort) and an independent dataset (GSE41613 cohort) achieved a similar prognostic significance.
In addition, tumor immune cell infiltration levels and immune inhibitor receptor expression were also significantly different in high- and low-risk groups. Specifically, the low-risk group had higher infiltration of activated memory CD4+T cells, CD8+T cells, and follicular helper T cells and B cells, and had higher expression of PD-1, CTLA-4, LAG3, TIGIT, and HAVCR2. CTLA-4, LAG3, TIGIT, and HAVCR2 had a synergistic effect with PD-L1 in negatively regulating T cells, adaptive, or innate immunity. Clinical studies have shown that dual blockade of PD-1 and CTLA-4/LAG3/TIGIT/HAVCR2 enhanced the proliferation and function of CD8+T cells and tumor-infiltrating lymphocytes as compared with single blockade and could provide survival benefit as compared with PD-L1 blockade alone for patients with PD-L1-positive cancers (Chauvin et al., 2015; Andrews et al., 2017; Chauvin and Zarour, 2020; Rodriguez-Abreu et al., 2020; Trüb et al., 2020). Since the prognostic signature distinguished the expression of these promising immunotherapeutic targets well, it might be able to reflect the response to immune checkpoint inhibitor treatment. Consistent with our guess, the low-risk group had a higher IPS of PD-L1, CTLA-4, and PD-L1-CTLA-4, which indicated that the low-risk group might respond better in anti-PD-L1 therapy, anti-CTLA-4 therapy, and anti-PD-L1 combined with anti-CTLA-4 therapy.
Accumulated studies have shown that high tumor mutational burden (TMB) is associated with better response to immune checkpoint inhibitor treatment. Subsequently, we further analyzed the mutational landscape of HNSCC. TP53 mutation is the most common, accounting for 66% of all mutation types in HNSCC and up to 75% in non-HPV-related HNSCC (Zhou et al., 2016; Klinakis and Rampias, 2020). TP53 is a tumor suppressor gene, which is mainly involved in mediating the cellular stress response after DNA damage and maintaining the stability of genetic material. Mutated TP53 is a proto-oncogene and could promote cell malignant transformation. Interestingly, the correlation between TP53 mutation, immunotherapy response, and patients’ prognosis was cancer-type dependent. Chen et al. (2019) found that non–small cell lung cancer (NSCLC) patients with high TMB levels, mainly TP53 mutation, benefited significantly from immune checkpoint inhibitor (Ozaki et al., 2020), while the immunotherapy response of patients with TP53 wild-type is better than that of TP53 mutation. Patients with TP53 mutation had poor OS with immune checkpoint inhibitor therapy in colon adenocarcinoma (COAD) and gastrointestinal tumors (GI) (Li et al., 2020). In HNSCC, TP53 mutations have been proven to be associated with decreased immune cell infiltration, low PD-L1 expression, and poor prognosis (Klinakis and Rampias, 2020; Li et al., 2020). Surprisingly, and perhaps reasonably, we found that the high-risk group had higher TMB, and there was a weak positive correlation between the TMB and risk score. In addition, high TMB was associated with poorer prognosis of HNSCC patients. Nevertheless, the exact mechanism of the TMB and HNSCC patients’ prognosis as well as the mechanism of TMB and immunotherapy response still needs to be further explored.
There are some advantages to our study. First of all, to our knowledge, this is the first study to develop a TICI-related prognostic signature composed of 16 genes for HNSCC. Second, our prognostic model is closely relevant to immune-related scores (IPS, immune score, and estimate score), the expression of immune inhibitor receptors (PD-1, CTLA-4, LAG3, TIGIT, HAVCR2), and immune-related pathways. These results, together with tumor mutation burden, might provide some helpful information for the development of new immunotherapeutic and prognostic biomarkers. Moreover, by comparing the 16 mRNAs and their protein expression levels of normal and tumor tissues from the public database, it might directly or indirectly suggest the role of these genes and proteins in the development of head and neck tumors. Finally, the 16-gene prognostic signature was validated in TCGA-HNSCC, GSE65858, and GSE41613 cohorts. However, in vivo and in vitro experiments are needed to further explore the mechanisms on how the 16 genes and prognostic signature impact immunity and prognosis of HNSCC.
Immunotherapy is the new pillar of antitumor treatment of HNSCC. It produces memory CD8+T cells, which have long-lasting protection and effectively prevent metastasis and recurrence. However, the biomarkers of immunotherapy are still being explored. It is believed that in the near future there will be a more complete immunotherapy system to better guide the immunotherapy and improve the prognosis of cancer patients.
Conclusion
In conclusion, this study developed a TICI-based 16-gene prognostic signature for HNSCC, and the 16 genes might be potential immunotherapeutic and prognostic biomarkers.
Data Availability Statement
The datasets presented in this study can be found in online repositories. The names of the repository/repositories and accession number(s) can be found in the article/Supplementary Material.
Author Contributions
Conceptualization: CZ, QW, YZ, and FZ; methodology: CZ, QW, YZ, and FZ; software: CZ and QW; validation: CZ and ZZ; formal analysis: CZ and QW; investigation: CZ and QW; resources: CZ and QW; data curation: CZ and QW; visualization: CZ and NY; writing—original draft preparation: CZ, QW, YZ, and FZ; writing—review and editing: CZ, QW, YZ, and FZ; supervision: CZ, QW, YZ, and FZ; and project administration: CZ, QW, YZ, and FZ. All authors have read and approved the published version of the final manuscript.
Funding
This study was supported by the National Natural Science Foundation of China (81472799).
Conflict of Interest
The authors declare that the research was conducted in the absence of any commercial or financial relationships that could be construed as a potential conflict of interest.
Publisher’s Note
All claims expressed in this article are solely those of the authors and do not necessarily represent those of their affiliated organizations, or those of the publisher, the editors, and the reviewers. Any product that may be evaluated in this article, or claim that may be made by its manufacturer, is not guaranteed or endorsed by the publisher.
Acknowledgments
We would like to acknowledge TCGA database and GEO database developed by the National Institutes of Health (NIH).
Supplementary Material
The Supplementary Material for this article can be found online at: https://www.frontiersin.org/articles/10.3389/fgene.2022.848841/full#supplementary-material
References
Andrews, L. P., Marciscano, A. E., Drake, C. G., and Vignali, D. A. A. (2017). LAG3 (CD223) as a Cancer Immunotherapy Target. Immunol. Rev. 276, 80–96. doi:10.1111/imr.12519
Audsley, K. M., McDonnell, A. M., and Waithman, J. (2020). Cross-Presenting XCR1(+) Dendritic Cells as Targets for Cancer Immunotherapy. Cells 9, 565. doi:10.3390/cells9030565
Awwad, M. H. S., Kriegsmann, K., Plaumann, J., Benn, M., Hillengass, J., Raab, M. S., et al. (2018). The Prognostic and Predictive Value of IKZF1 and IKZF3 Expression in T-Cells in Patients with Multiple Myeloma. Oncoimmunology 7, e1486356. doi:10.1080/2162402x.2018.1486356
Bauml, J., Seiwert, T. Y., Pfister, D. G., Worden, F., Liu, S. V., Gilbert, J., et al. (2017). Pembrolizumab for Platinum- and Cetuximab-Refractory Head and Neck Cancer: Results from a Single-Arm, Phase II Study. Jco 35, 1542–1549. doi:10.1200/jco.2016.70.1524
Belisario, D. C., Akman, M., Godel, M., Campani, V., Patrizio, M. P., Scotti, L., et al. (2020). ABCA1/ABCB1 Ratio Determines Chemo- and Immune-Sensitivity in Human Osteosarcoma. Cells 9, 647. doi:10.3390/cells9030647
Burtness, B., Harrington, K. J., Greil, R., Soulières, D., Tahara, M., de Castro, G., et al. (2019). Pembrolizumab Alone or with Chemotherapy versus Cetuximab with Chemotherapy for Recurrent or Metastatic Squamous Cell Carcinoma of the Head and Neck (KEYNOTE-048): a Randomised, Open-Label, Phase 3 Study. Lancet 394, 1915–1928. doi:10.1016/S0140-6736(19)32591-7
Castellsagué, X., Alemany, L., Quer, M., Halec, G., Quirós, B., Tous, S., et al. (2016). HPV Involvement in Head and Neck Cancers: Comprehensive Assessment of Biomarkers in 3680 Patients. JNCI.J 108, djv403. doi:10.1093/jnci/djv403
Chaturvedi, A. K., Engels, E. A., Pfeiffer, R. M., Hernandez, B. Y., Xiao, W., Kim, E., et al. (2011). Human Papillomavirus and Rising Oropharyngeal Cancer Incidence in the United States. Jco 29, 4294–4301. doi:10.1200/jco.2011.36.4596
Chauhan, S. S., Kaur, J., Kumar, M., Matta, A., Srivastava, G., Alyass, A., et al. (2015). Prediction of Recurrence-free Survival Using a Protein Expression-Based Risk Classifier for Head and Neck Cancer. Oncogenesis 4, e147. doi:10.1038/oncsis.2015.7
Chauvin, J.-M., Pagliano, O., Fourcade, J., Sun, Z., Wang, H., Sander, C., et al. (2015). TIGIT and PD-1 Impair Tumor Antigen-specific CD8(+) T Cells in Melanoma Patients. J. Clin. Invest. 125, 2046–2058. doi:10.1172/jci80445
Chauvin, J. M., and Zarour, H. M. (2020). TIGIT in Cancer Immunotherapy. J. Immunother. Cancer 8, e000957. doi:10.1136/jitc-2020-000957
Chen, D. S., and Mellman, I. (2017). Elements of Cancer Immunity and the Cancer-Immune Set point. Nature 541, 321–330. doi:10.1038/nature21349
Chen, Y., Chen, G., Li, J., Huang, Y.-Y., Li, Y., Lin, J., et al. (2019). Association of Tumor Protein P53 and Ataxia-Telangiectasia Mutated Comutation with Response to Immune Checkpoint Inhibitors and Mortality in Patients with Non-small Cell Lung Cancer. JAMA Netw. Open 2, e1911895. doi:10.1001/jamanetworkopen.2019.11895
Cheng, M., Chen, Y., Xiao, W., Sun, R., and Tian, Z. (2013). NK Cell-Based Immunotherapy for Malignant Diseases. Cell Mol Immunol 10, 230–252. doi:10.1038/cmi.2013.10
Dok, R., Bamps, M., Glorieux, M., Zhao, P., Sablina, A., and Nuyts, S. (2020). Radiosensitization Approaches for HPV‐positive and HPV‐negative Head and Neck Squamous Carcinomas. Int. J. Cancer 146, 1075–1085. doi:10.1002/ijc.32558
Fang, F., Xiao, W., and Tian, Z. (2017). NK Cell-Based Immunotherapy for Cancer. Semin. Immunol. 31, 37–54. doi:10.1016/j.smim.2017.07.009
Ferlay, J., Soerjomataram, I., Dikshit, R., Eser, S., Mathers, C., Rebelo, M., et al. (2015). Cancer Incidence and Mortality Worldwide: Sources, Methods and Major Patterns in GLOBOCAN 2012. Int. J. Cancer 136, E359–E386. doi:10.1002/ijc.29210
Ferris, R. L., Blumenschein, G., Fayette, J., Guigay, J., Colevas, A. D., Licitra, L., et al. (2016). Nivolumab for Recurrent Squamous-Cell Carcinoma of the Head and Neck. N. Engl. J. Med. 375, 1856–1867. doi:10.1056/nejmoa1602252
Ferris, R. L. (2015). Immunology and Immunotherapy of Head and Neck Cancer. Jco 33, 3293–3304. doi:10.1200/jco.2015.61.1509
Gajewski, T. F., Schreiber, H., and Fu, Y.-X. (2013). Innate and Adaptive Immune Cells in the Tumor Microenvironment. Nat. Immunol. 14, 1014–1022. doi:10.1038/ni.2703
Ge, Y., Paisie, T. K., Chen, S., and Concannon, P. (2019). UBASH3A Regulates the Synthesis and Dynamics of TCR-CD3 Complexes. J.I. 203, 2827–2836. doi:10.4049/jimmunol.1801338
Gurusamy, M., Tischner, D., Shao, J., Klatt, S., Zukunft, S., Bonnavion, R., et al. (2021). G-protein-coupled Receptor P2Y10 Facilitates Chemokine-Induced CD4 T Cell Migration through Autocrine/paracrine Mediators. Nat. Commun. 12, 6798. doi:10.1038/s41467-021-26882-9
Hajaj, E., Eisenberg, G., Klein, S., Frankenburg, S., Merims, S., Ben David, I., et al. (2020). SLAMF6 Deficiency Augments Tumor Killing and Skews toward an Effector Phenotype Revealing it as a Novel T Cell Checkpoint. Elife 9, e52539. doi:10.7554/eLife.52539
He, Y., Gallman, A. E., Xie, C., Shen, Q., Ma, J., Wolfreys, F. D., et al. (2022). P2RY8 Variants in Lupus Patients Uncover a Role for the Receptor in Immunological Tolerance. J. Exp. Med. 219, e20211004. doi:10.1084/jem.20211004
Henning, A. N., Roychoudhuri, R., and Restifo, N. P. (2018). Epigenetic Control of CD8(+) T Cell Differentiation. Nat. Rev. Immunol. 18, 340–356. doi:10.1038/nri.2017.146
Itakura, M., Terashima, Y., Shingyoji, M., Yokoi, S., Ohira, M., Kageyama, H., et al. (2013). High CC Chemokine Receptor 7 Expression Improves Postoperative Prognosis of Lung Adenocarcinoma Patients. Br. J. Cancer 109, 1100–1108. doi:10.1038/bjc.2013.440
Juneja, V. R., McGuire, K. A., Manguso, R. T., LaFleur, M. W., Collins, N., Haining, W. N., et al. (2017). PD-L1 on Tumor Cells Is Sufficient for Immune Evasion in Immunogenic Tumors and Inhibits CD8 T Cell Cytotoxicity. J. Exp. Med. 214, 895–904. doi:10.1084/jem.20160801
Karki, R., Man, S. M., Malireddi, R. K. S., Kesavardhana, S., Zhu, Q., Burton, A. R., et al. (2016). NLRC3 Is an Inhibitory Sensor of PI3K-mTOR Pathways in Cancer. Nature 540, 583–587. doi:10.1038/nature20597
Klinakis, A., and Rampias, T. (2020). TP53 Mutational Landscape of Metastatic Head and Neck Cancer Reveals Patterns of Mutation Selection. EBioMedicine 58, 102905. doi:10.1016/j.ebiom.2020.102905
Klümper, N., Ralser, D. J., Bawden, E. G., Landsberg, J., Zarbl, R., Kristiansen, G., et al. (2020). LAG3 (LAG-3, CD223) DNA Methylation Correlates with LAG3 Expression by Tumor and Immune Cells, Immune Cell Infiltration, and Overall Survival in clear Cell Renal Cell Carcinoma. J. Immunother. Cancer 8, e000552. doi:10.1136/jitc-2020-000552
Leek, J. T., Johnson, W. E., Parker, H. S., Jaffe, A. E., and Storey, J. D. (2012). The Sva Package for Removing Batch Effects and Other Unwanted Variation in High-Throughput Experiments. Bioinformatics 28, 882–883. doi:10.1093/bioinformatics/bts034
Li, L., Li, M., and Wang, X. (2020). Cancer Type-dependent Correlations between TP53 Mutations and Antitumor Immunity. DNA Repair 88, 102785. doi:10.1016/j.dnarep.2020.102785
Li, T., Fan, J., Wang, B., Traugh, N., Chen, Q., Liu, J. S., et al. (2017). TIMER: A Web Server for Comprehensive Analysis of Tumor-Infiltrating Immune Cells. Cancer Res. 77, e108–e110. doi:10.1158/0008-5472.can-17-0307
Liu, Z., Zhou, Q., Wang, Z., Zhang, H., Zeng, H., Huang, Q., et al. (2020). Intratumoral TIGIT(+) CD8(+) T-Cell Infiltration Determines Poor Prognosis and Immune Evasion in Patients with Muscle-Invasive Bladder Cancer. J. Immunother. Cancer 8, e000978. doi:10.1136/jitc-2020-000978
Lu, E., Wolfreys, F. D., Muppidi, J. R., Xu, Y., and Cyster, J. G. (2019). S-Geranylgeranyl-L-glutathione Is a Ligand for Human B Cell-Confinement Receptor P2RY8. Nature 567, 244–248. doi:10.1038/s41586-019-1003-z
Luke, J. J., Flaherty, K. T., Ribas, A., and Long, G. V. (2017). Targeted Agents and Immunotherapies: Optimizing Outcomes in Melanoma. Nat. Rev. Clin. Oncol. 14, 463–482. doi:10.1038/nrclinonc.2017.43
Luo, X., Teng, Q. X., Dong, J. Y., Yang, D. H., Wang, M., Dessie, W., et al. (2020). Antimicrobial Peptide Reverses ABCB1-Mediated Chemotherapeutic Drug Resistance. Front. Pharmacol. 11, 1208. doi:10.3389/fphar.2020.01208
Machiels, J.-P. H., Haddad, R. I., Fayette, J., Licitra, L. F., Tahara, M., Vermorken, J. B., et al. (2015). Afatinib versus Methotrexate as Second-Line Treatment in Patients with Recurrent or Metastatic Squamous-Cell Carcinoma of the Head and Neck Progressing on or after Platinum-Based Therapy (LUX-Head & Neck 1): an Open-Label, Randomised Phase 3 Trial. Lancet Oncol. 16, 583–594. doi:10.1016/s1470-2045(15)70124-5
Maimela, N. R., Liu, S., and Zhang, Y. (2019). Fates of CD8+ T Cells in Tumor Microenvironment. Comput. Struct. Biotechnol. J. 17, 1–13. doi:10.1016/j.csbj.2018.11.004
Mansfield, A. S., Każarnowicz, A., Karaseva, N., Sánchez, A., De Boer, R., Andric, Z., et al. (2020). Safety and Patient-Reported Outcomes of Atezolizumab, Carboplatin, and Etoposide in Extensive-Stage Small-Cell Lung Cancer (IMpower133): a Randomized Phase I/III Trial. Ann. Oncol. 31, 310–317. doi:10.1016/j.annonc.2019.10.021
Mayakonda, A., Lin, D.-C., Assenov, Y., Plass, C., and Koeffler, H. P. (2018). Maftools: Efficient and Comprehensive Analysis of Somatic Variants in Cancer. Genome Res. 28, 1747–1756. doi:10.1101/gr.239244.118
Migden, M. R., Rischin, D., Schmults, C. D., Guminski, A., Hauschild, A., Lewis, K. D., et al. (2018). PD-1 Blockade with Cemiplimab in Advanced Cutaneous Squamous-Cell Carcinoma. N. Engl. J. Med. 379, 341–351. doi:10.1056/nejmoa1805131
Newman, A. M., Liu, C. L., Green, M. R., Gentles, A. J., Feng, W., Xu, Y., et al. (2015). Robust Enumeration of Cell Subsets from Tissue Expression Profiles. Nat. Methods 12, 453–457. doi:10.1038/nmeth.3337
Ngiow, S. F., Young, A., Jacquelot, N., Yamazaki, T., Enot, D., Zitvogel, L., et al. (2015). A Threshold Level of Intratumor CD8+ T-Cell PD1 Expression Dictates Therapeutic Response to Anti-PD1. Cancer Res. 75, 3800–3811. doi:10.1158/0008-5472.can-15-1082
Ozaki, Y., Muto, S., Takagi, H., Watanabe, M., Inoue, T., Fukuhara, M., et al. (2020). Tumor Mutation burden and Immunological, Genomic, and Clinicopathological Factors as Biomarkers for Checkpoint Inhibitor Treatment of Patients with Non-small-cell Lung Cancer. Cancer Immunol. Immunother. 69, 127–134. doi:10.1007/s00262-019-02446-1
Paz-Ares, L., Ciuleanu, T.-E., Cobo, M., Schenker, M., Zurawski, B., Menezes, J., et al. (2021). First-line Nivolumab Plus Ipilimumab Combined with Two Cycles of Chemotherapy in Patients with Non-small-cell Lung Cancer (CheckMate 9LA): an International, Randomised, Open-Label, Phase 3 Trial. Lancet Oncol. 22, 198–211. doi:10.1016/s1470-2045(20)30641-0
Pol, J. G., Le Naour, J., and Kroemer, G. (2020). FLT3LG - a Biomarker Reflecting Clinical Responses to the Immunogenic Cell Death Inducer Oxaliplatin. Oncoimmunology 9, 1755214. doi:10.1080/2162402x.2020.1755214
Rodriguez-Abreu, D., Johnson, M. L., Hussein, M. A., Cobo, M., Jayantilal Patel, A., Milica Secen, N., et al. (2020). Primary Analysis of a Randomized, Double-Blind, Phase II Study of the Anti-TIGIT Antibody Tiragolumab (Tira) Plus Atezolizumab (Atezo) versus Placebo Plus Atezo as First-Line (1L) Treatment in Patients with PD-L1-Selected NSCLC (CITYSCAPE). J. Clin. Oncol. 38 (15_Suppl. l), 9503. doi:10.1200/jco.2020.38.15_suppl.9503
Sacco, A. G., and Cohen, E. E. (2015). Current Treatment Options for Recurrent or Metastatic Head and Neck Squamous Cell Carcinoma. Jco 33, 3305–3313. doi:10.1200/jco.2015.62.0963
Saito, T., Nishikawa, H., Wada, H., Nagano, Y., Sugiyama, D., Atarashi, K., et al. (2016). Two FOXP3(+)CD4(+) T Cell Subpopulations Distinctly Control the Prognosis of Colorectal Cancers. Nat. Med. 22, 679–684. doi:10.1038/nm.4086
Saunders, A., Webb, L. M. C., Janas, M. L., Hutchings, A., Pascall, J., Carter, C., et al. (2010). Putative GTPase GIMAP1 Is Critical for the Development of Mature B and T Lymphocytes. Blood 115, 3249–3257. doi:10.1182/blood-2009-08-237586
Schmid, P., Rugo, H. S., Adams, S., Schneeweiss, A., Barrios, C. H., Iwata, H., et al. (2020). Atezolizumab Plus Nab-Paclitaxel as First-Line Treatment for Unresectable, Locally Advanced or Metastatic Triple-Negative Breast Cancer (IMpassion130): Updated Efficacy Results from a Randomised, Double-Blind, Placebo-Controlled, Phase 3 Trial. Lancet Oncol. 21, 44–59. doi:10.1016/s1470-2045(19)30689-8
Srinivasan, P., Wu, X., Basu, M., Rossi, C., and Sandler, A. D. (2018). PD-L1 Checkpoint Inhibition and Anti-CTLA-4 Whole Tumor Cell Vaccination Counter Adaptive Immune Resistance: A Mouse Neuroblastoma Model that Mimics Human Disease. Plos Med. 15, e1002497. doi:10.1371/journal.pmed.1002497
Susini, T., Saccardin, G., Renda, I., Giani, M., Tartarotti, E., Nori, J., et al. (2021). Immunohistochemical Evaluation of FGD3 Expression: A New Strong Prognostic Factor in Invasive Breast Cancer. Cancers (Basel) 13, 3824. doi:10.3390/cancers13153824
Tagliabue, M., Maffini, F., Fumagalli, C., Gandini, S., Lepanto, D., Corso, F., et al. (2020). A Role for the Immune System in Advanced Laryngeal Cancer. Sci. Rep. 10, 18327. doi:10.1038/s41598-020-73747-0
Trüb, M., Uhlenbrock, F., Claus, C., Herzig, P., Thelen, M., Karanikas, V., et al. (2020). Fibroblast Activation Protein-Targeted-4-1bb Ligand Agonist Amplifies Effector Functions of Intratumoral T Cells in Human Cancer. J. Immunother. Cancer 8, e000238. doi:10.1136/jitc-2019-000238
Uhlen, M., Oksvold, P., Fagerberg, L., Lundberg, E., Jonasson, K., Forsberg, M., et al. (2010). Towards a Knowledge-Based Human Protein Atlas. Nat. Biotechnol. 28, 1248–1250. doi:10.1038/nbt1210-1248
van der Heijden, A. G., Mengual, L., Lozano, J. J., Ingelmo-Torres, M., Ribal, M. J., Fernández, P. L., et al. (2016). A Five-Gene Expression Signature to Predict Progression in T1G3 Bladder Cancer. Eur. J. Cancer 64, 127–136. doi:10.1016/j.ejca.2016.06.003
Wagner, G. P., Kin, K., and Lynch, V. J. (2012). Measurement of mRNA Abundance Using RNA-Seq Data: RPKM Measure Is Inconsistent Among Samples. Theor. Biosci. 131, 281–285. doi:10.1007/s12064-012-0162-3
Wang, S., Li, Y., Xing, C., Ding, C., Zhang, H., Chen, L., et al. (2020). Tumor Microenvironment in Chemoresistance, Metastasis and Immunotherapy of Pancreatic Cancer. Am. J. Cancer Res. 10, 1937–1953.
Wang, S., Xia, P., Shi, L., and Fan, Z. (2012). FADD Cleavage by NK Cell Granzyme M Enhances its Self-Association to Facilitate Procaspase-8 Recruitment for Auto-Processing Leading to Caspase cascade. Cell Death Differ 19, 605–615. doi:10.1038/cdd.2011.130
West, H., McCleod, M., Hussein, M., Morabito, A., Rittmeyer, A., Conter, H. J., et al. (2019). Atezolizumab in Combination with Carboplatin Plus Nab-Paclitaxel Chemotherapy Compared with Chemotherapy Alone as First-Line Treatment for Metastatic Non-squamous Non-small-cell Lung Cancer (IMpower130): a Multicentre, Randomised, Open-Label, Phase 3 Trial. Lancet Oncol. 20, 924–937. doi:10.1016/s1470-2045(19)30167-6
Wilkerson, M. D., and Hayes, D. N. (2010). ConsensusClusterPlus: a Class Discovery Tool with Confidence Assessments and Item Tracking. Bioinformatics 26, 1572–1573. doi:10.1093/bioinformatics/btq170
Xiao, H., Guo, Y., Li, B., Li, X., Wang, Y., Han, S., et al. (2020). M2-Like Tumor-Associated Macrophage-Targeted Codelivery of STAT6 Inhibitor and IKKβ siRNA Induces M2-To-M1 Repolarization for Cancer Immunotherapy with Low Immune Side Effects. ACS Cent. Sci. 6, 1208–1222. doi:10.1021/acscentsci.9b01235
Yan, D., and Chen, Y. (2021). Tumor Mutation burden (TMB)-associated Signature Constructed to Predict Survival of Lung Squamous Cell Carcinoma Patients. Sci. Rep. 11, 9020. doi:10.1038/s41598-021-88694-7
Yigit, B., Wang, N., Ten Hacken, E., Chen, S.-S., Bhan, A. K., Suarez-Fueyo, A., et al. (2019). SLAMF6 as a Regulator of Exhausted CD8(+) T Cells in Cancer. Cancer Immunol. Res. 7, 1485–1496. doi:10.1158/2326-6066.cir-18-0664
Yoshihara, K., Shahmoradgoli, M., Martínez, E., Vegesna, R., Kim, H., Torres-Garcia, W., et al. (2013). Inferring Tumour Purity and Stromal and Immune Cell Admixture from Expression Data. Nat. Commun. 4, 2612. doi:10.1038/ncomms3612
Zeng, D., Li, M., Zhou, R., Zhang, J., Sun, H., Shi, M., et al. (2019). Tumor Microenvironment Characterization in Gastric Cancer Identifies Prognostic and Immunotherapeutically Relevant Gene Signatures. Cancer Immunol. Res. 7, 737–750. doi:10.1158/2326-6066.cir-18-0436
Zhou, G., Liu, Z., and Myers, J. N. (2016). TP53Mutations in Head and Neck Squamous Cell Carcinoma and Their Impact on Disease Progression and Treatment Response. J. Cel. Biochem. 117, 2682–2692. doi:10.1002/jcb.25592
Zhou, H.-H., Chen, X., Cai, L.-Y., Nan, X.-W., Chen, J.-H., Chen, X.-X., et al. (2019). Erastin Reverses ABCB1-Mediated Docetaxel Resistance in Ovarian Cancer. Front. Oncol. 9, 1398. doi:10.3389/fonc.2019.01398
Keywords: head and neck squamous cell carcinoma, immune cell infiltration, prognosis, response to immunotherapy, immune inhibitor receptor
Citation: Zhu C, Wu Q, Yang N, Zheng Z, Zhou F and Zhou Y (2022) Immune Infiltration Characteristics and a Gene Prognostic Signature Associated With the Immune Infiltration in Head and Neck Squamous Cell Carcinoma. Front. Genet. 13:848841. doi: 10.3389/fgene.2022.848841
Received: 06 January 2022; Accepted: 04 April 2022;
Published: 02 May 2022.
Edited by:
Zhibin Lv, Sichuan University, ChinaCopyright © 2022 Zhu, Wu, Yang, Zheng, Zhou and Zhou. This is an open-access article distributed under the terms of the Creative Commons Attribution License (CC BY). The use, distribution or reproduction in other forums is permitted, provided the original author(s) and the copyright owner(s) are credited and that the original publication in this journal is cited, in accordance with accepted academic practice. No use, distribution or reproduction is permitted which does not comply with these terms.
*Correspondence: Fuxiang Zhou, aGFwcHl6aG91ZnhAc2luYS5jb20=; Yunfeng Zhou, eWZ6aG91d2h1QDE2My5jb20=
†These authors have contributed equally to this work
 Chunmei Zhu1†
 Qiuji Wu
 Yunfeng Zhou