 Yongfei Fan
 Yong Zhou1†
 Xinwei Li
- 1Department of Thoracic Surgery, The Affiliated Changzhou No. 2 People’s Hospital of Nanjing Medical University, Changzhou, China
- 2Heart and Lung Disease Laboratory, The Affiliated Changzhou No. 2 People’s Hospital of Nanjing Medical University, Changzhou, China
- 3Department of Gastroenterology, Affiliated Cancer Hospital of Bengbu Medical College, Bengbu, China
Background: Recent studies have demonstrated that creatine can promote tumor metastasis and has implications for immune cell function. SLC6A8 encodes a membrane protein that can transport creatine inside and outside the cell. However, there are currently no studies of SLC6A8 in lung adenocarcinoma (LUAD).
Methods: In this study, the expression of SLC6A8 in LUAD was analyzed using the Oncomine database, the Cancer Genome Atlas (TCGA) database, and immunohistochemical staining analysis. Survival analysis of patients with LUAD was performed using the cBioPortal and the Kaplan-Meier Plotter websites and clinical follow-up data. An analysis of the association between SLC6A8 and the tumor immune microenvironment (TIME) of LUAD was performed through the TISIDB database and estimation of stromal and immune cells in malignant tumor tissues using expression data (ESTIMATE) algorithm. Then, based on the curated list of SLC6A8-related immunomodulators, three genes (NT5E, CD40LG, CD80) were selected to construct SLC6A8-related immune signatures to further evaluate the immune aspect of LUAD prognosis.
Results: Our studies indicated that SLC6A8 was overexpressed in LUAD, and the high expression of SLC6A8 was associated with poor survival. Genetic alteration of SLC6A8 was also associated with a poorer prognosis. Furthermore, multivariate Cox analysis indicated that SLC6A8 could be used as an independent risk prognostic factor. Then, immune infiltration analysis indicated that SLC6A8 was also strongly associated with poor prognosis in the TIME of LUAD. A multivariate Cox proportional hazard model was then constructed, and was shown effective at identifying high-risk patients. Univariate and multivariate Cox analysis showed that the risk scoring of the model was an independent prognostic risk factor in LUAD.
Conclusion: SLC6A8 may serve as a biomarker for poor prognosis in LUAD.
Introduction
Lung cancer remains the world’s leading cancer-related cause of death (Siegel et al., 2021). Statistically, non-small cell lung cancer (NSCLC) accounts for 85% of newly diagnosed lung cancer, with lung adenocarcinoma (LUAD) being the most common subtype (Molina et al., 2008). Owing to the popularization of computed tomography (CT), some patients can be diagnosed early and as a result, the incidence and mortality rate of lung cancer has decreased (Oudkerk et al., 2021). However, the imaging specificity of CT is still poor, and even when nodules are confirmed, long-term follow-up is often advised instead of risking surgery (Cho et al., 2016; Lee et al., 2019). This leads to delays in treatment that may allow the cancer to develop. Therefore, it is essential to find biomarkers for early diagnosis and prognosis of lung cancer.
Tumorigenesis is dependent on the reprogramming of cellular metabolism as both direct and indirect consequences of oncogenic mutations (DeBerardinis et al., 2008; Loo et al., 2015; Pavlova and Thompson, 2016). A common feature of cancer cell metabolism is the ability to acquire nutrients from a nutrient-poor environment and to utilize these nutrients to both maintain viability and build new biomass (Loo et al., 2015). These nutrients are mainly glucose, fatty acids, and amino acids (Li and Zhang, 2016). The alterations in intracellular and extracellular metabolites that can accompany cancer-associated metabolic reprogramming have profound effects on gene expression, cellular differentiation, and the tumor microenvironment (Vander Heiden and DeBerardinis, 2017). One such metabolite is creatine, the metabolism of which has been recently shown to be associated with the progression of cancer. In hepatocellular carcinoma, creatine enters cells via cell membrane surface transport proteins to provide energy for metastatic survival (Loo et al., 2015). Creatine accumulation is also known to promote breast cancer cell survival and inhibit apoptosis by maintaining redox homeostasis in triple negative breast cancer (Li et al., 2021).
The creatine transporter solute carrier family 6 member 8 (SLC6A8) belongs to the subfamily of GABA transporters (GATs). This gene encodes a cell surface plasma membrane protein whose function is to transport creatine into and out of cells (Colas et al., 2020). Studies have shown that SLC6A8 is not only associated with tumor development, but is also involved in the tumor immune microenvironment (TIME). The use of SLC6A8 transporter inhibitors in colorectal cancer effectively inhibits creatine import, reduces intracellular phosphocreatine and adenosine triphosphate levels, and induces apoptosis in tumor cells (Kurth et al., 2021). In hepatocellular carcinoma, knockdown of SLC6A8 significantly induced apoptosis and suppressed the migration and invasion of Hep3B and Huh-7 cells (Yuan et al., 2020). In recent studies, it was also revealed that SLC6A8-mediated creatine uptake and accumulation reprograms macrophage polarization by modulating cytokine responses such as IFN-g and IL-4, thereby altering macrophage-mediated immune responses in vivo (Ji et al., 2019), which could also be used to modulate the anti-tumor response of CD8 T+ cells by affecting creatine uptake (Di Biase et al., 2019). However, there are few reports on SLC6A8 in lung cancer.
Given the associations between SLC6A8 and various cancers, there is the possibility that it may serve as a biomarker. In this study, we analyzed the prognostic characteristics and immunological role of SLC6A8 in LUAD. In doing so, we hope to identify whether it can be used as a tool for evaluating the prognosis of LUAD.
Methods and Materials
Acquisition of SLC6A8 Expression Profiles
The expression of SLC6A8 in pan-cancer was analyzed using the Oncomine database (https://www.oncomine.org/resource/login.html), the “Lung Cancer” section was selected for further analysis, followed by further filtering for its subtypes by datasets in the database. LUAD data (cancer = 535, normal = 59) was then downloaded from the Cancer Genome Atlas (TCGA) (https://www.cancer.gov/). We then conducted unpaired analysis of difference and paired analysis of difference for SLC6A8 in normal and tumor tissues using the “limma” package in the R program (version 4.1.0). Unpaired difference analysis was used to compare SCL6A8 expression levels in tumor tissues of 535 patients with paraneoplastic tissues of 59 patients, whereas paired difference analysis was used to compare SCL6A8 expression levels in tumor tissues of 59 patients with paired paraneoplastic tissues of 59 patients.
Construction of Tissue Microarrays
A tissue microarray (TMA) designated as TMA1 for the pre-experiment included 36 pairs of LUAD and paraneoplastic tissues from 16 female and 20 male patients. This was purchased from Superbiotek (Shanghai, China). The patients who contributed to TMA1 had an average age of 59.7 years [range: 34–81 years; stage: T1aN0M0 to T3N3M0 as per 2004 World Health Organization criteria (Travis et al., 2006)]. TMA1 was used to analyze paired differential analysis of SLC6A8 expression levels in tumor tissues of 36 patients and paired paraneoplastic tissues of 36 patients. A second TMA, TMA2, was constructed with 51 LUAD tissues and 10 normal paraneoplastic tissues obtained from patients who underwent surgical resection in the Department of Thoracic Surgery of Zhongshan Hospital, Fudan University from January 2005 to December 2005. Ten paraneoplastic tissues were obtained from 51 LUAD patients randomly selected from 10 different LAUD patients. Complete clinical information is available for all patients (14 female and 37 male) and the mean age of these patients was 57.12 years [range: 26–73 years; stage: Ia to IIIa as per the 2004 World Health Organization criteria (Travis et al., 2006)]. Clinical information follow-up records are also available for the period until July 2013. TMA2 was used to analyze unpaired differential analysis of SLC6A8 expression levels in tumor tissues of 51 patients and paraneoplastic tissues of 10 patients. Patients in both TMA1 and TMA2 had not received chemotherapy, radiotherapy, or biologic therapy before surgery.
Immunohistochemical Staining and Quantification Analysis
To detect the expression of SLC6A8 in LUAD, immunohistochemistry was performed using the standard indirect immunoperoxidase procedure. Paraffin specimens were cut into 4-µm thick slices, mounted on slides, baked, deparaffinized, and hydrated according to conventional methods. Two hundred milliliters of 3% H2O2 and 1 ml of NaN3 were used to inactivate the endogenous peroxidase activity, followed by antigen recovery performed with 10 mM sodium citrate buffer (pH 6.0). Slides were then incubated for 1 h at room temperature in 10 mM TBS with 4% normal rabbit serum (Proteintech, China) prior to incubation with primary antibody against SLC6A8 (1:50, 20299-1-AP, Proteintech, China) at 4°C overnight. Then, the slides were developed in secondary antibody (1:200, K5007, DAKO, China) for 35 min at 37°C. Finally, the slides were weakly re-stained with hematoxylin at 37°C, dehydrated, and covered with coverslips.
To quantify the expression of SLC6A8 protein in LUAD tissues, the slides were imaged with a microscope (Nikon Corporation; magnification). The images obtained were then converted to grayscale using ImageJ software (Schneider et al., 2012) by selecting “8-bit.” The “Uncalibrate OD” function was used to convert the grayscale values to optical density values. Using the “Set Measurement” module, we can set the area to be stained in the image. Next, the average optical density (AOD) was obtained by summing the optical density of the stained area over the stained area. Finally, paired difference analysis of AOD in tumor tissue and normal tissue in TMA1 was performed using GraphPad Prism software, while unpaired difference analysis was performed in TMA2.
Genetic Alteration of SLC6A8 in Lung Adenocarcinoma
Six datasets containing data from patients with LUAD (TCGA, Nature 2014; TCGA, Firehose Legacy; TCGA, PanCancer Atlas; MSKCC, Science 2015; Broad, Cell 2012; OncoSG, Nat Genet 2020) were selected to analyze the genetic alterations of SLC6A8 with the cBioPortal database (http://www.cbioportal.org/). The samples in the selected datasets were divided into altered (n = 57) and unaltered groups (n = 1466) for prognostic analysis via the Kaplan-Meier survival analysis method.
Prognostic Analysis of SLC6A8 in Lung Adenocarcinoma
To validate the potential of SLC6A8 as a survival biomarker, the Kaplan-Meier Plotter online database (https://kmplot.com/analysis/) was used to conduct survival analysis in the LUAD datasets. Based on the median value of gene expression, we divided SLC6A8 data (Affy ID: 202219_at) into a high-expression group and a low-expression group, and then plotted Overall Survival (OS) (n = 719; cut-off value = 203) and First Progression (FP) (n = 461; cut-off value = 196) curves using the database. In addition, GraphPad Prism was used to classify samples from TMA2 into high- and low-expression groups based on the median AOD value (0.760) and to compare the survival significance between the two groups. Finally, using the “multivariate Cox analysis” board in Kaplan-Meier Plotter online database, we searched for LUAD independent prognostic factors by taking SLC6A8, gender, smoking history, stage, and T-stage and N-stage with OS into analysis (n = 131). T-stage as “tumor size,” M-stage as “metastasis,” and N-stage as “nodes.”
Analysis of the Tumor Immune Microenvironment in Lung Adenocarcinoma
Firstly, we employed the R package Cell type Identification by Estimating Relative Subsets of RNA Transcripts (CIBERSORT; https://cibersort.stanford.edu/). This is a method to qualify and quantify 22 types of immune cells in the tissue, to visualize immune cell infiltration in LUAD, and to analyze the mRNA expression matrix of SLC6A8 (Newman et al., 2015) (cancer vs. normal = 511 vs. 58).
Next, the TISIDB (http://cis.hku.hk/TISIDB/index.php) website, an integrated repository portal for tumor-immune system interactions (Ru et al., 2019) (p-value <0.05), was used to analyze the correlation between SLC6A8 expression and immune cells in pan-cancer. Estimation of stromal and immune cells in malignant tumor tissues using expression data (ESTIMATE) was performed by using transcriptional profiles of cancer samples to infer the content of tumor cells as well as infiltrating immune and stromal cells, and using the “estimateScore” function to calculate tumor purity, immune cell score, and stromal cell score for all samples (Yoshihara et al., 2013; Becht et al., 2016). Then, to analyze the correlation between SLC6A8 expression and subtype typing, the immune subtypes in LUAD were divided into six categories and subject to the Kruskal–Wallis test. These categories were: C1 (wound healing, n = 83), C2 (IFN-gammadominan, n = 147), C3 (inflammatory, n = 179), C4 (lymphocyte depleted, n = 20), C5 (immune-logically quiet, n = 0) and C6 (TGF-b dominant, n = 28).
Finally, the Pearson correlation analysis was used to explore the correlation between SLC6A8 expression and a total of 64 immunomodulators, composed of immunoinhibitors and immunostimulators in LUAD in TCGA date. The Bonferroni-corrected threshold p-value was set at 0.0007 (0.05/64) considered statistically significant. The STRING website (https://www.string-db.org/online) was used to construct a network of protein interactions with the same set of immunomodulators associated with SLC6A8 expression. Gene Ontology (GO) functional annotation and Kyoto Encyclopedia of Genes and Genomes (KEGG) pathway enrichment analysis was also performed on these immunomodulators using the WebGestalt online tool (http://www.webgestalt.org/).
Construction of SLC6A8-Related Immune Signatures and Performance Evaluation
We used the Least Absolute Shrinkage and Selection Operator (LASSO) regression algorithm to select 44 immunomodulators associated with SLC6A8 expression by 10-fold cross-validation of the “glmnet” and “survival” packages for penalty parameters. Then, the screened immunomodulators from LASSO were subjected to stepwise multivariate Cox proportional hazard regression analysis to obtain the optimal candidates and construct an immune-related risk model. The formula for calculating the risk score was as follows:
Where “coefi” and “Xi” represent the coefficient and expression level of each of the SLC6A8-related immunomodulators, respectively. In order to verify the accuracy of the model, the TCGA data are randomly divided into testing (n = 246) and training sets (n = 248), and the model was first constructed from the data in the training set, followed by the validation of the model in the testing set. Patients with LUAD were classified into high-risk and low-risk groups based on the median score as the risk cut-off point. The survival curves of the two groups were plotted according to the Kaplan-Meier method using the “survival” and “survminer” R packages in R. The “survivalROC” package was used to perform ROC curve, and the Area Under Curve (AUC) values were obtained to evaluate the prognostic model’s reliability.
Construction of Nomogram Prognostic System
To further assess the practical clinical benefits of SLC6A8, the “rms” R package was used to build the nomogram scoring system. The nomogram scoring system develops scoring criteria based on the magnitude of the regression coefficients of all independent variables, giving each independent variable a score for each value level taken. A total score can then be calculated for each patient, and then these scores were used to assess the survival probability for each patient is calculated by a conversion function between the score and the probability of occurrence of the outcome (Becht et al., 2016). Finally, calibration curves were plotted to assess the accuracy of the model in predicting 1-, 3- and 5-years survival rates. If the model prediction curve coincides exactly with the reference line, the predicted value is equal to the actual value; if the model prediction curve is above the reference line, the predicted value is greater than the actual value; if the model prediction curve is below the reference line, the predicted value is lower than the actual value.
Statistical Analyses
We implemented all statistical analyses with R (version 4.1.0) and GraphPad Prism 9 (version 9.1.2). For quantitative data in the article data analysis, statistical significance of normally distributed variables was estimated using Student’s t-test, and non-normally distributed variables were analyzed using the Wilcoxon rank-sum test. The log-rank test was used to compare data between two groups, and the Kruskal–Wallis test was performed to compare data between more than two groups. p-values <0.05 were considered statistically significant, whereas in the immunomodulator correlation analysis, the Bonferroni-corrected threshold p-value was set at 0.0007 (0.05/64) was considered statistically significant.
Ethical Statement
This study was reviewed and approved by the Research Ethics Committee of The Affiliated Changzhou No. 2 People’s Hospital of Nanjing Medical University. All patients were properly briefed and voluntarily signed an informed consent form for the collection of clinical tissue samples. All specimens were processed and anonymized according to ethical and legal standards.
Results
Expression of SLC6A8 in Lung Cancer
Analysis from the Oncomine database revealed that SLC6A8 was highly expressed in a variety of cancers in which lung cancer is one of them (Figure 1A). Among the subtypes of lung cancer, the expression of SLC6A8 was higher in LUAD compared to normal tissue, according to the datasets of Stearman et al. (2005), Hou et al. (2010), Su et al. (2007). Based on the datasets of Bhattacharjee and Hou (Hou et al., 2010), SLC6A8 was also overexpressed in lung squamous carcinoma. Moreover, SLC6A8 was expressed at a high level in large cell lung cancer compared to normal tissue according to the dataset of Hou et al. (2010) (Table 1). Then, compared to normal tissues, it was demonstrated that SLC6A8 was overexpressed in LUAD in both unpaired differential analysis (Figure 1B) and paired differential analysis (Figure 1C) using data from TCGA (p-value<0.05). Finally, paired difference analysis of TMA1 immunohistochemical pre-experiment results showed that SLC6A8 was significantly higher in LUAD than in paraneoplastic tissue (p-value<0.05, Figures 1D–F). In addition, unpaired difference analysis in TMA2 exhibited the same results (p-value<0.05, Figures 1G–I). Altogether, SLC6A8 expression is elevated in lung cancer and its subtypes compared to normal tissues.
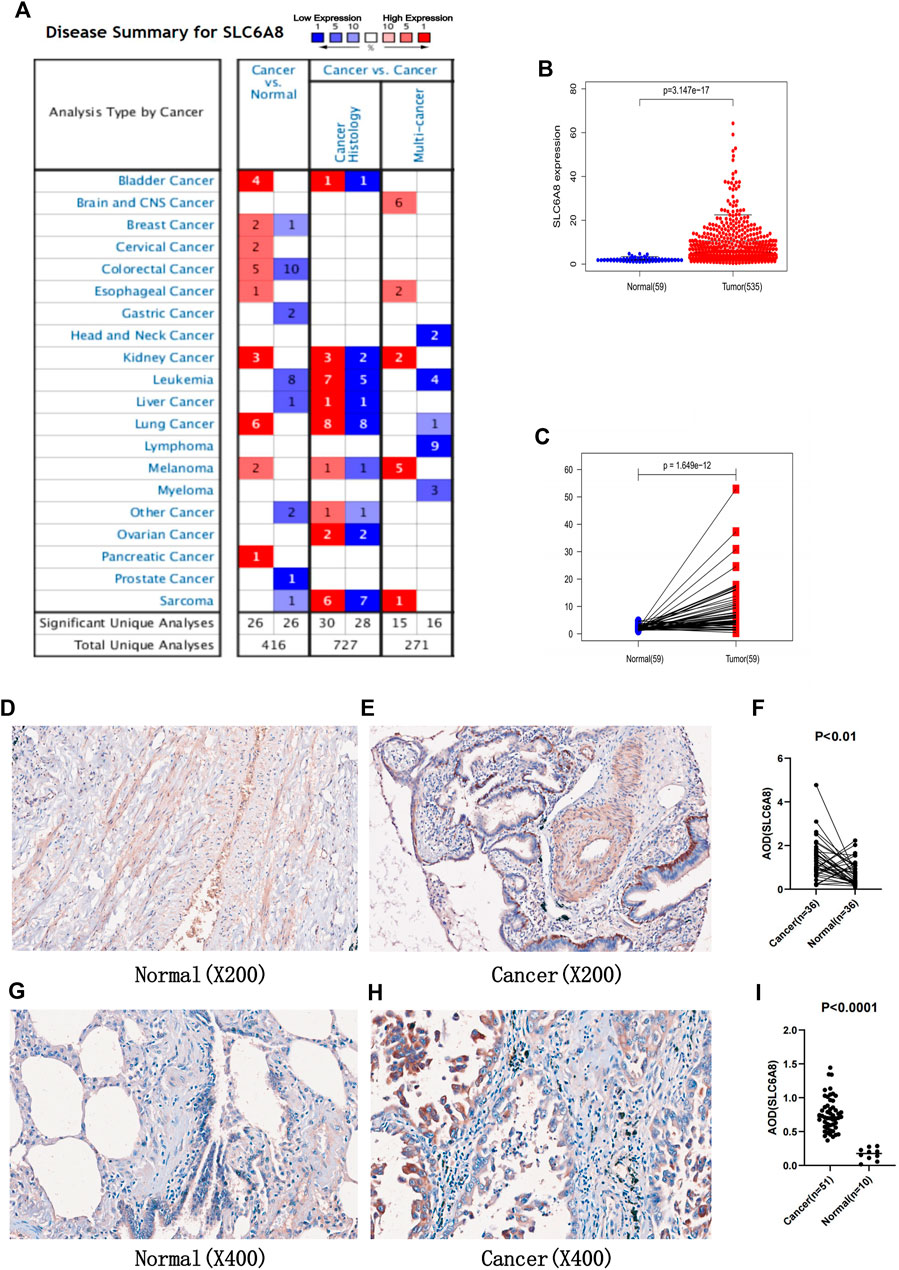
FIGURE 1. Expression of SLC6A8 in tumors (A) Exprssion of SLC6A8 in pan-cancer in the Oncomine database. Numbersrepresent the number of studies. Red represent high expression. while blue represents low exprssion (B) Unpaired differential analysis and (C) paired differential analysis of SLC6A8 in LUAD in the TCGA database. (F) Analysis of paired differences between (D) normal and (E) LUAD tissues in TMA1 immunohistochemical staining. (I) Analysis of unpaired diffences between (G) normal and (H) LUAD tissues in TMA2 immunohistochemical staining.
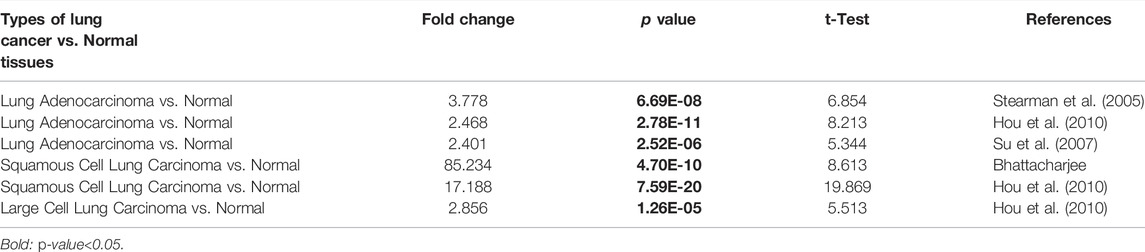
TABLE1. The expression of SLC6A8 in subtypes of lung cancer.
Genetic Alterations and Prognostic Analysis of SLC6A8 in Lung Adenocarcinoma
Gene alteration analysis revealed that 3% of the LUAD samples in the cBioPortal database were altered, mainly in the form of mutations and amplifications (Figures 2A,B). The samples in the database were divided into SLC6A8-altered and SLC6A8-unaltered groups, and the results indicated that the SLC6A8-altered group had a poorer prognosis (p-value<0.05, Figure 2C).
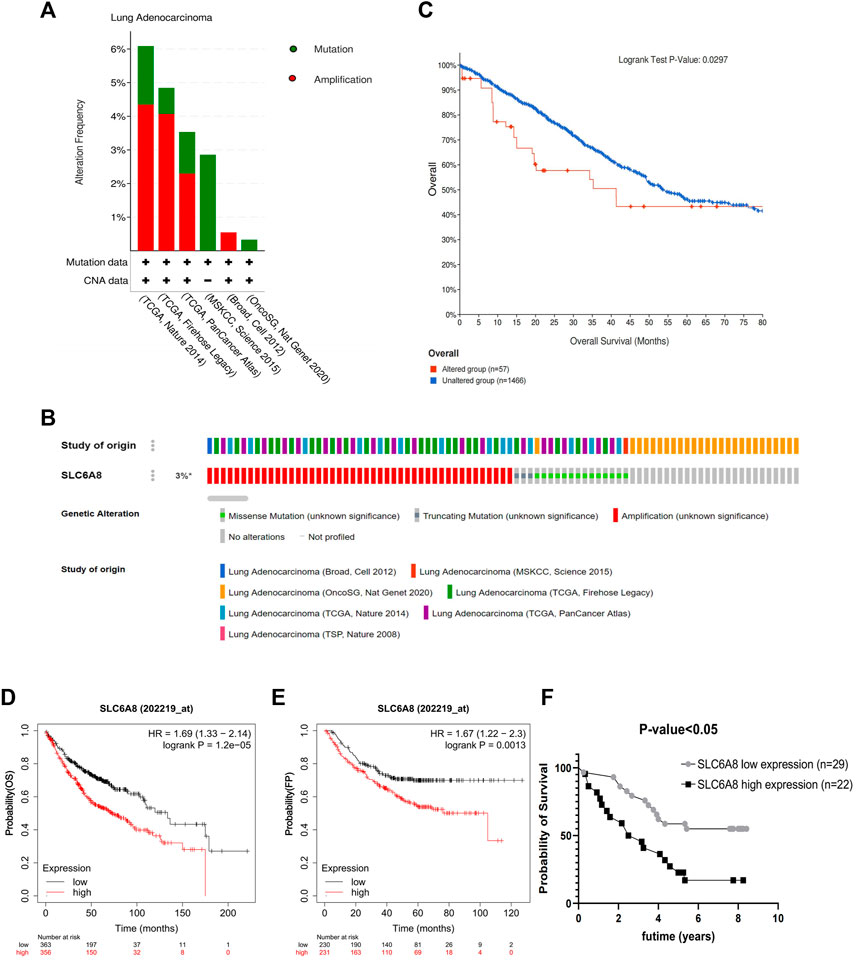
FIGURE 2. Genetic alteration and prognosis analysis of SLC6A8 in LUAD. (A,B) Genetic alteration analysis of SLC6A8 in LUAD In the eBioportal database. (C) Prognostic analysis of SLC6A8-altered group and SLC6A8-unaltered group in LUAD. Correlation of SLC6A8 in LUAD with (D) OS and (E) FP as per the results of the Kaplen_Meier plotter online website (F) Survival analysis of SLC6A8 expression in TMA2 clinical follow up data information.
Then, the samples were divided according to SLC6A8 expression into high- (OS: n = 356; FP: n = 231) and low- (OS: n = 363; FP: n = 230) expression groups according to the Kaplan-Meier Plotter survival analysis website. High SLC6A8 expression in LUAD was found to be associated with poor OS and FP (p-value<0.05, Figures 2D,E).
Next, integrating TMA2 data with collected survival data and divided into high- and low- expression groups according to the median value of AOD of TMA2 (0.760). Similar to the previous results, the high-expression group was significantly associated with poorer prognosis compared to the low-expression group (p-value<0.05, Figure 2F). Moreover, multivariate Cox analysis indicated that SLC6A8 and T-stage might be used as indicators of poor prognosis in LUAD independent of the clinical factors in table (p-value<0.05, Table 2). Therefore, we found that SLC6A8 in LUAD is generally associated with poor prognosis.
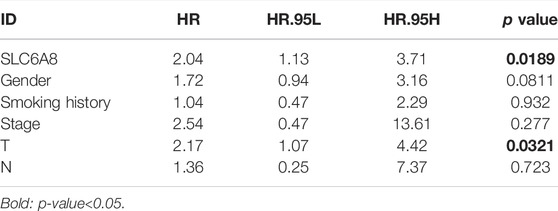
TABLE 2. Multivariate cox analysis of SLC6A8 and clinical factors in LUAD.
Tumor Immune Microenvironment Analysis in Lung Adenocarcinoma
Immune cell infiltration in LUAD was visualized using CIBERSORT (Figure 3A). Compared to normal tissue, the differential analysis of immune cell infiltration revealed that LUAD had increased infiltration of naïve B cells, plasma cells, regulatory T cells, and M0 macrophages. In contrast, there was decreased infiltration of CD4 memory and resting T cells, monocytes, resting dendritic cells, and resting and activated mast cells (Figure 3B). Correlation analysis among 22 immune cells identified that CD8 and activated CD4 memory T cells had the most significant positive correlation in LUAD, while the most significant negative correlation was found between plasma cells and M2 macrophages in LUAD (Figure 3C).
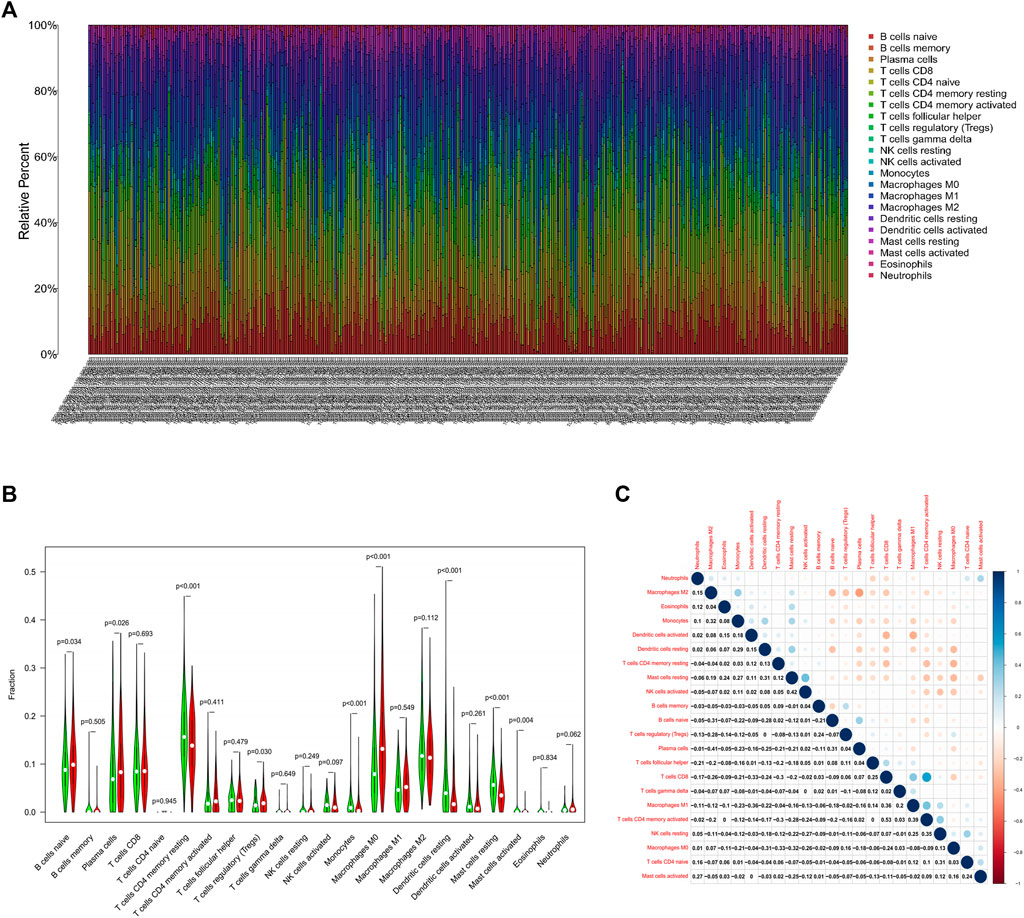
FIGURE 3. Analysis of the TIME in LUAD.(A) Visualization of immune cell infiltration in LUAD. X-axis represents the sample number of 535 patients in the TCGA database (Supplementary Material S1) (B) Differential analysis of infiltrated immune cells in LUAD tissues compared to normal tissues. (C) Correlation analysis of infiltrated immune cells iin LUAD.
Correlation Analysis of SLC6A8 and the Tumor Immune Microenvironment in Lung Adenocarcinoma
The TISIDB website analysis indicated that the immune cells associated with SLC6A8 expression were correlated with multiple cancers (Figure 4A). Then we focused on LUAD specifically and found that Act_CD8, Tem_CD8, Tem_CD4, Tfh, Th1, Th17, Act_B, Imm_B, NK, CD56dim, iDC, Macrophage, Eosinophil and Mast were significant correlation with SLC6A8 expression in LUAD, and most immune cells were negatively correlated with SLC6A8 expression (p-value<0.05, Figure 4B). Assessment of the TIME of LUAD in TCGA using the ESTIMATE algorithm also presented consistent results, with the SLC6A8 high-expression group showing significantly lower immune scores (Figure 4D) and stromal scores (Figure 4E) than the SLC6A8 low-expression group, while the tumor purity scores (Figure 4F) exhibited an opposite phenomenon.
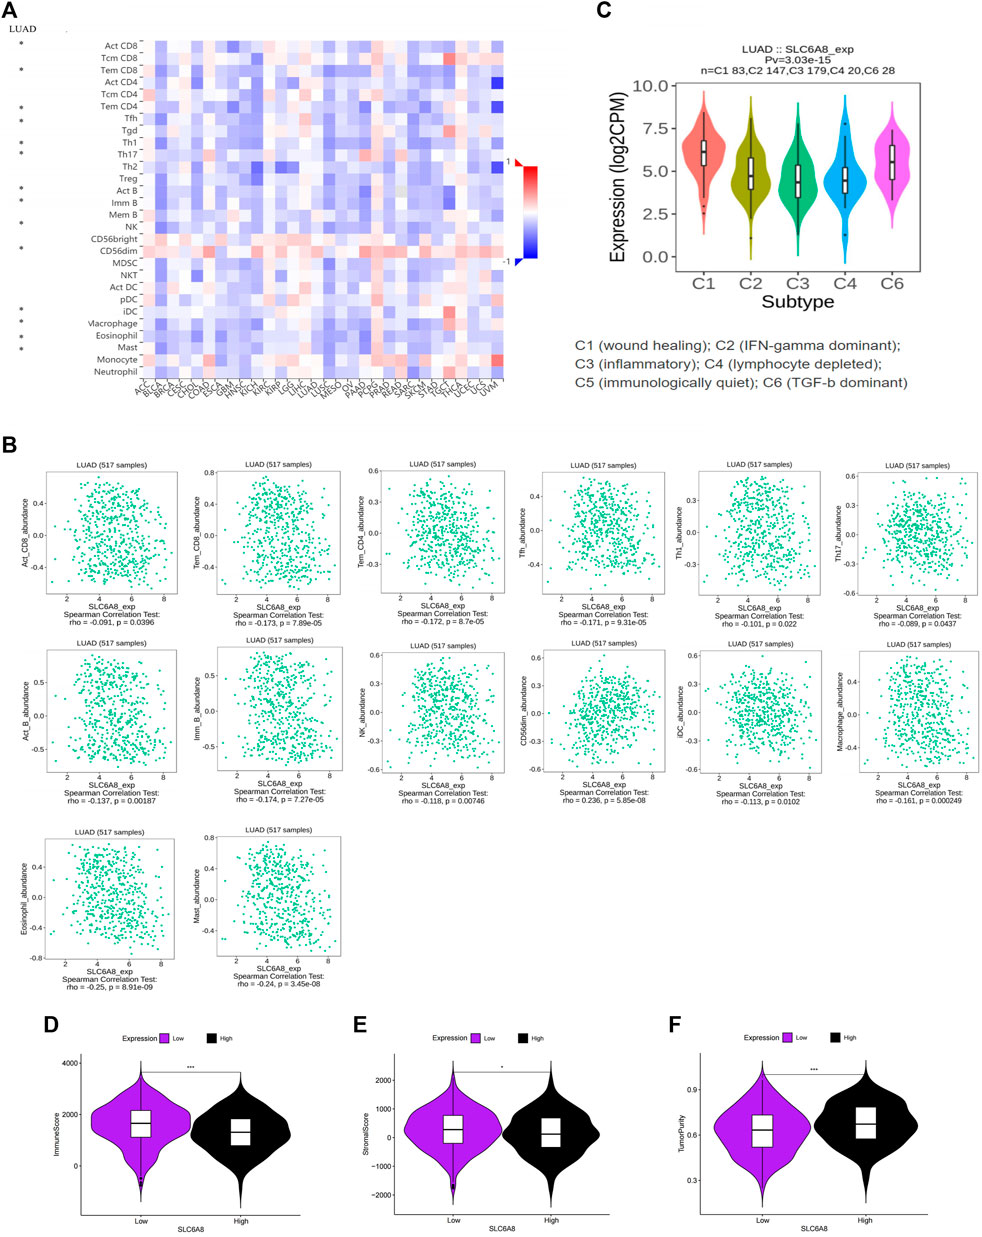
FIGURE 4. Association between SLC6A8 expression with immune cells in LUAD (A) Correlation analysis of SLC6A8 expression with cells in pan-cancer. (B) Correlation of SLC6A8 expression with immune cells in LUCAD. (C) Association between SLC6A8 expression and immune subtypes in LUAD. Calculated (D) immune cell score. (E) immune stroma score, and (F) tumor purity score in the LUAD immune microenvironment based on the ESTIMATE algorithm *:p-value<0.05; **:p-value<0.01; ***:p-value<0.001.
These results suggest that high SLC6A8 expression was associated with less immune cell infiltration, which further supports the results of our previous survival analysis from the immunological aspect. Furthermore, the correlation between SLC6A8 expression and immune cell subtypes (C1, C2, C3, C4, C6) was also found in LUAD, and further demonstrated that SLC6A8 expression was lower in the immune-related subtypes (C2, C3, C4; p-value<0.05; Figure 4C). In conclusion, a close relationship between SLC6A8 and the TIME in LUAD was found in this study.
Immunomodulators Associated With SLC6A8 Expression in Lung Adenocarcinoma
Pearson correlation analysis identifies 44 immunomodulators (ADORA2A, BTLA, CD160, CD96, CSF1R, CTLA4, HAVCR2, IL10, IL10RB, KDR, LAG3, PDCD1, PDCD1LG2, TIGIT, VTCN1, CD27, CD28, CD40LG, CD48, CD70, CD80, CD86, CXCL12, CXCR4, ENTPD1, ICOS, IL2RA, KLRC1, LTA, MICB, NT5E, TMIGD2, TNFRSF13B, TNFRSF14, TNFRSF17, TNFRSF18, TNFRSF4, TNFRSF8, TNFRSF9, TNFSF13, TNFSF13B, TNFSF4, ULBP1, KIR2DL1) in the TCGA database associated with SLC6A8 expression in LUAD (Table 3). Next, we performed the protein interaction network analysis of these 44 immunomodulators using the STRING website (https://cn.string-db.org/) and found strong interactions between these immunomodulators (Figure 5A). GO analysis revealed 44 SLC6A8-associated immunomodulators in biological processes mainly enriched in biological regulation and response to stimulation. In terms of cellular components, mainly located in the cell membrane and molecular functional aspects are mainly protein binding (Figure 5B). KEGG enrichment analysis indicated that these immunomodulators are mainly involved in the immune regulation of the body, such as intestinal immune network for lgA production, allograft rejection, T cell receptor signaling pathway, ect (Figures 5C,D). This therefore implies that SLC6A8 plays an essential role in the TIME of LUAD.
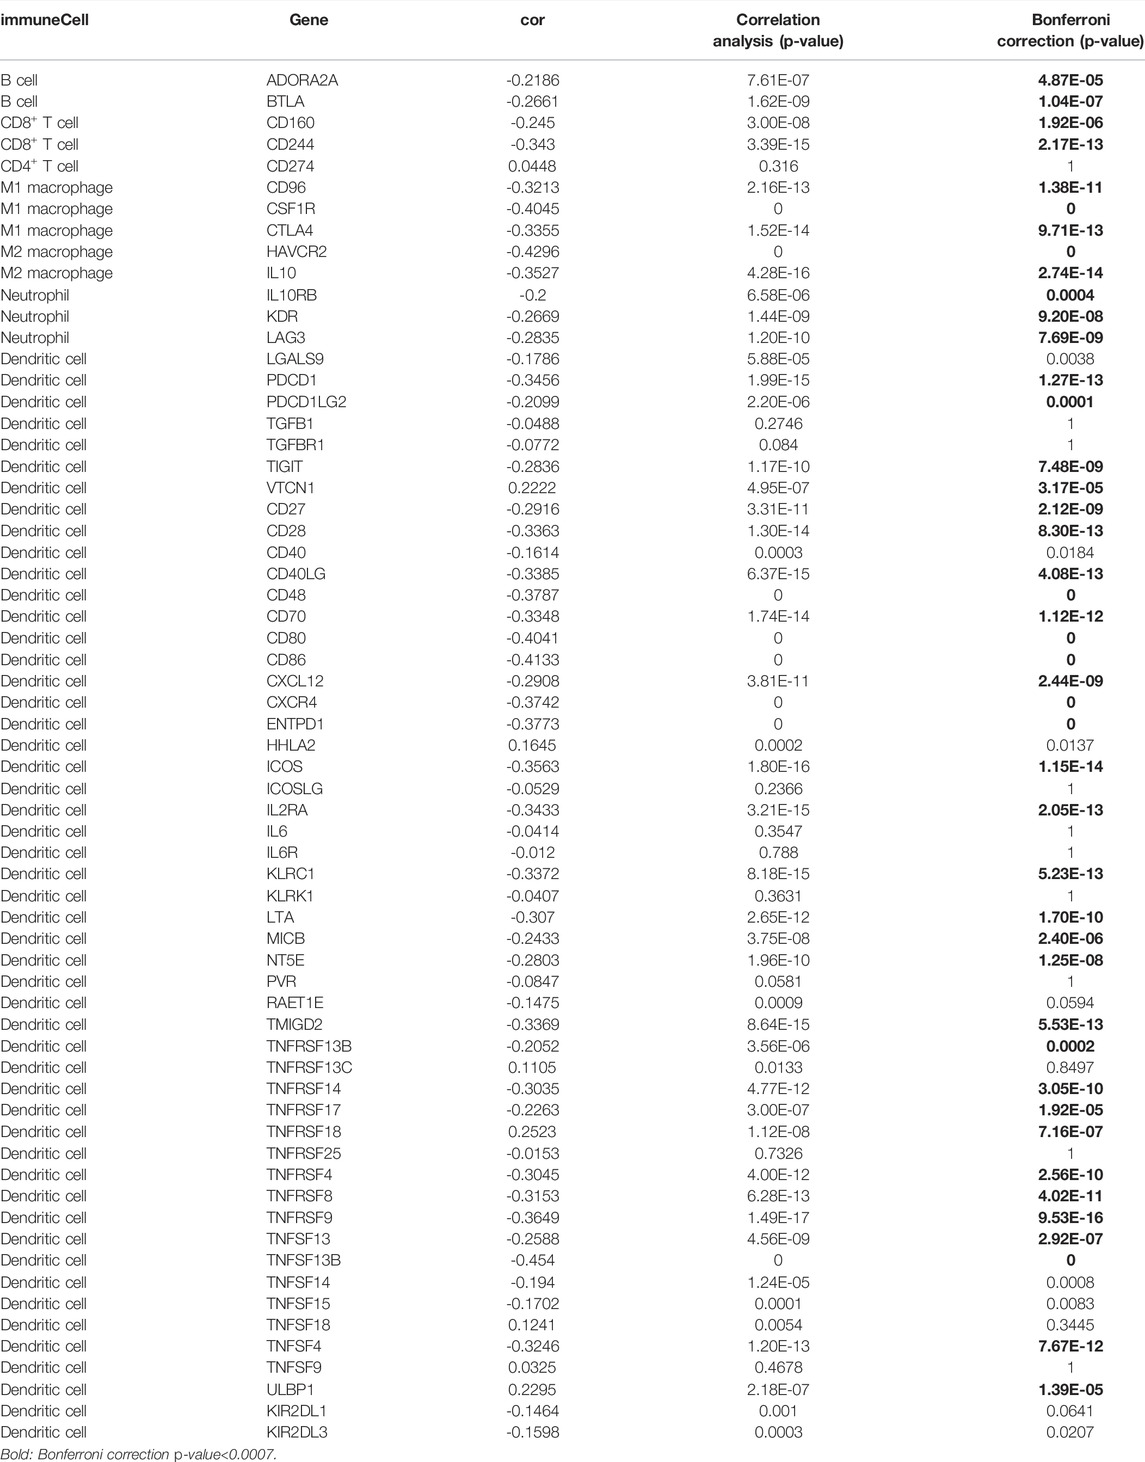
TABLE 3. The correlations between expression of SLC6A8 and immunomodulators in LUAD.
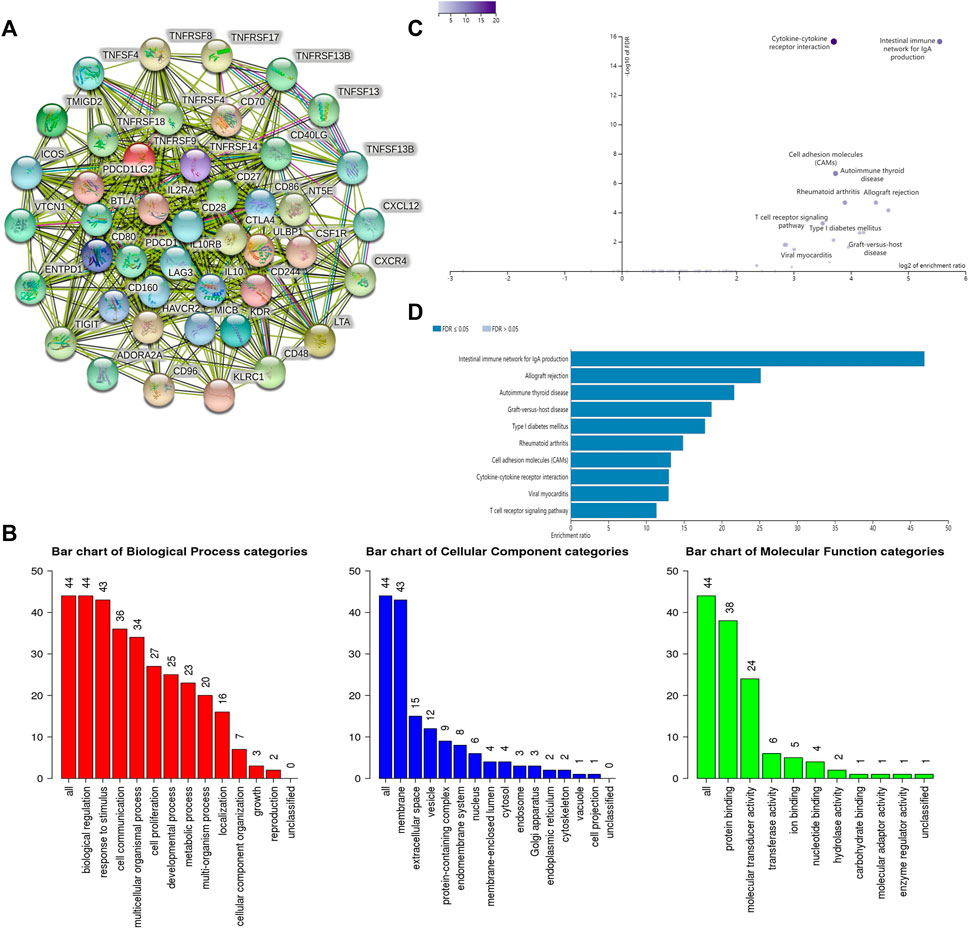
FIGURE 5. Analysis of SLC6A8-associated immunomodulators. (A) Protein interaction network of SLC6A8-associated immunomodulators inn LUAD as mapped using the STRING database.(B) GO and (C,D) KEGG analysis of SLC6A8- associated immunomodulators in LUAD using the WebGestalt website.
Establishment of Immune Signatures Based on Three SLC6A8-Associated Immunomodulators and Predictive Evaluation
Immunomodulators are an important component of the tumor immune microenvironment, and their alterations are closely related to patient prognosis (Mahoney et al., 2015). Based on the list of44 immunomodulators associated with SLC6A8 expression in the TIME of LUAD, we used LASSO regression and stepwise multivariate Cox proportional hazard regression analyses to screen for five candidate immunomodulators (NT5E, CD40LG, CD80) to construct a set of immune signatures (Figure 6A). There were the following computational formulas of the multivariate Cox proportional hazard model: risk core = (coefficient NT5E × Expression NT5E) + (coefficient CD40LG × Expression CD40LG) + (coefficient CD80 × Expression CD80).
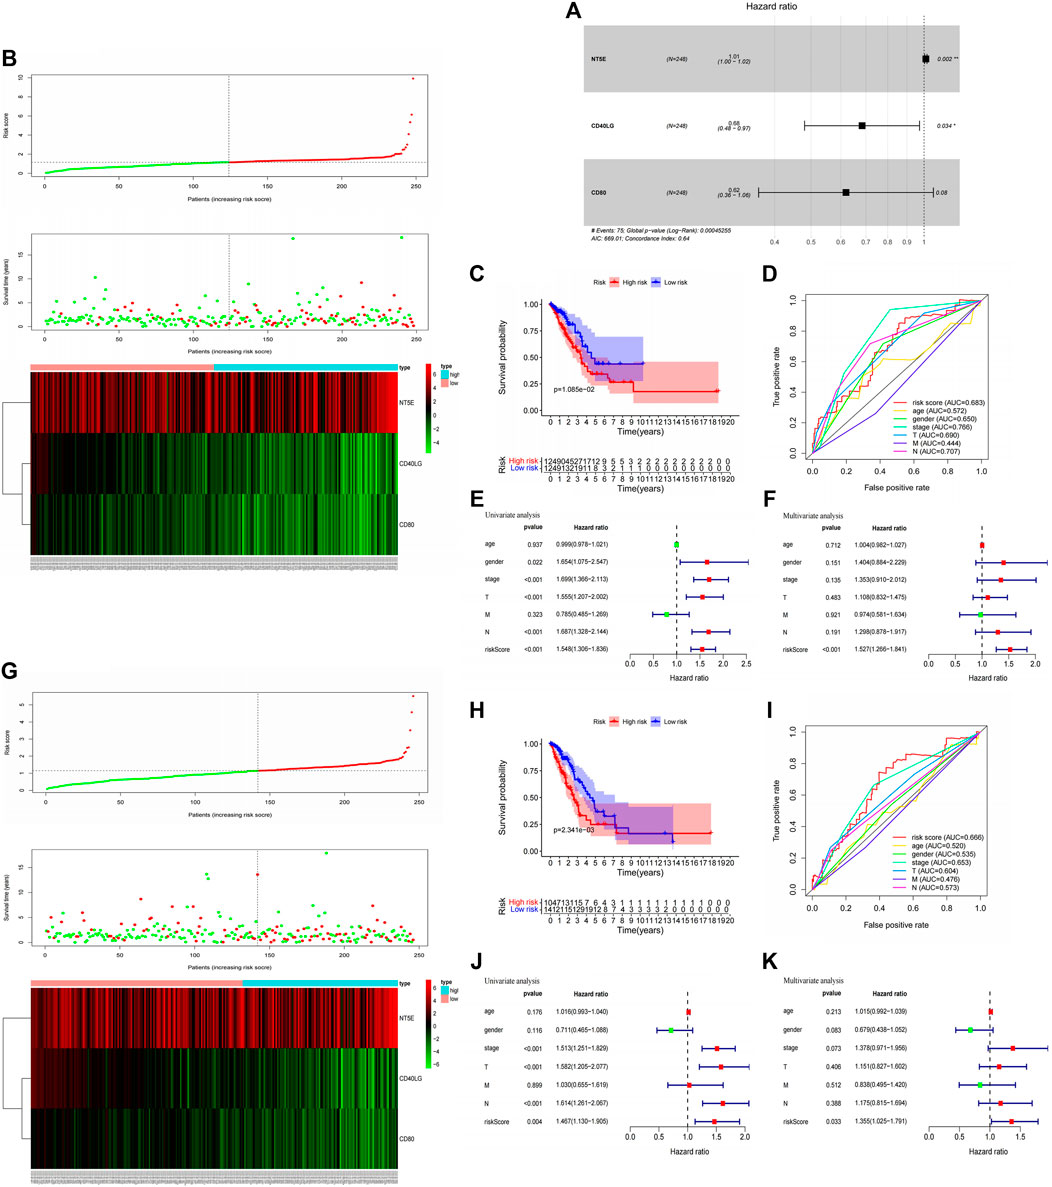
FIGURE 6. Construction immune signatures based on SLC6A8-associated immunomodulators and predictive evaluation. (A) Stepwise multivariate Cox Proportional hazard regression analyses to screen for three selected candidate immunomodulators (NT5E, CD40LG, CD80) to construct a set of immune signatures. Distribution of risk scores, survival statuses, and gene expression profiles for LUAD in (B) the training set and (G) testing set The x-axis of the heatmap represents the sample number of patients in the training set (Supplementary Material S2) and testing set (Supplementary Material S3) in the Cox risk proportional regression mode. Comparison of high - and low-risk groups based on model scoring using Kaplan-Meier survival analysis in (C) the training set and (H) testing set. Assesment of Cox risk regression model accuracy using ROC curves in (D) the training set and (I) testing set. Univariate and multivariate Cox analysis combining model scoring with clinical factors to identify independent prognostic indicators in (E,F) the training set and (J), (K) testing set.
The training set was divided into high- and low-risk groups based on the median value (1.151) of the risk scores calculated by the model. We found that patients with LUAD in the low-risk group had better survival outcomes than those in the high-risk group (p-value<0.05, Figures 6B,C). The AUC of the ROC curve for the multivariate Cox proportional hazard model is 0.683, indicating amoderate accuracy of the model’s risk prediction capability (Figure 6D). Finally, univariate and multivariate Cox analysis of the proportional hazard model’s risk scoring combined with clinical factors such as age, gender, and grade suggested that the model’s risk score could be used as a risk factor independent of these clinical factors (p-value<0.05, Figures 6E,F). In addition, we further validated the findings in the training set with the testing set analysis. Based on the median values (1.147) of the model risk scores, we can well classify the patient sample in the testing set into high- and low-risk groups, and the high-risk group survives significantly worse than the low-risk group (Figures 6G,H). The predictive ability of the testing set in the ROC curve evaluation revealed an AUC value of 0.666, which also predicts amoderate accuracy (Figure 6I). Moreover, univariate and multifactor Cox analyses showed that model risk scoring in the testing set could be used as an independent prognostic risk factor (Figures 6J,K). The model analysis thus shows that SLC6A8-related immune signatures are associated with poor prognosis, and the immune signatures have good survival predictive efficacy.
Constructing Nomogram Survival Prediction Program
To assess the practical clinical benefit of SLC6A8, we combined SLC6A8 expression with clinical factors (gender, age, stage, T-stage, N-stage and M-stage) to construct the nomogram survival prediction system to predict patient survival at 1-, 3-, and 5-year periods (Figure 7A). The red reference line in the nomogram indicates the best prognosis for the patient. In addition, we further plotted the calibration curves of the survival prediction curves and the results showed that the survival prediction curves for patients at 1-, 3-, and 5- years fluctuated slightly above and below the calibration curves, implying that the model’s predicted survival with a high degree of accuracy (Figure 7B).
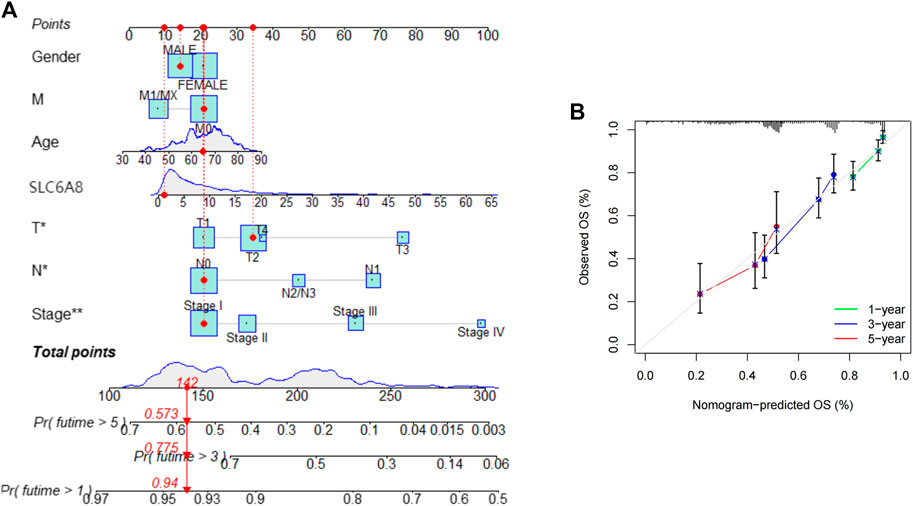
FIGURE 7. Assessing the practical clinical benifits of SLC6A8 (A) Construction of a nomogram survival prediction system including SLC6A8 expression and clinical factors. (B) Plotting calibration curves for nomogram 1-, 2- and 5- year survival prediction curves.
Discussion
Growing cancer incidence and mortality worldwide demands development of accurate biomarkers to perfect detection, diagnosis, prognostication, and monitoring (Costa-Pinheiro et al., 2015). Biomarkers of tumor diagnosis and prognosis are consistently a key area of interest for researchers. A wide range of biomarkers are now being proposed because they have shown superior biological benefits, such as cancer-derived exosomes (Kok and Yu, 2020) and extracellular vesicles (Urabe et al., 2020).
SLC6A8 has been reported to be closely associated with the development of cancer. In NSCLC, SLC6A8 may be involved in tumor progression through the Notch signaling pathway (Feng et al., 2021). In this study, we demonstrated that SLC6A8 was overexpressed in LUAD via open databases and immunohistochemistry. Survival analysis of data from the Kaplan-Meier Plotter database and clinical follow-up showed that the SLC6A8 high-expression group was associated with poor prognosis. Genetic alterations in SLC6A8 were also shown to be linked to worse prognosis. Moreover, multivariate Cox regression analysis indicated that SLC6A8 could be an independent risk prognostic factor for LUAD. Therefore, we consider that SLC6A8 may serve as a prognostic biomarker for LUAD.
The TIME comprises tumor cells, immune cells, mesenchymal cells, and extracellular components. Studies have demonstrated that these components play a crucial role in the effectiveness of anti-tumor immunity at the cellular and tissue level and the degree of immune cell infiltration influence patient prognosis (Li et al., 2016; Binnewies et al., 2018). Hegde et al. first classified three immune phenotypes according to the different characteristics of the TIME, namely “immune infiltrative,” “immune rejection,” and “immune desert” (Hegde et al., 2016). Survival analysis revealed that the phenotype of immune inflammation, characterized by adaptive immune cell infiltration and immune activation, survived better than the immune evasion and immune desert phenotypes (Zhang et al., 2020; Chong et al., 2021). In this study, we identified from the TISIDB database that the majority of immune cells associated with SLC6A8 expression in LUAD showed a significant negative correlation. We thus speculate that high expression of SLC6A8 in LUAD inhibits immune cell infiltration. Evaluation of the LUAD TIME by the ESTIMATE algorithm revealed that the immune cell score was significantly lower in the SLC6A8 high-expression group than in the SLC6A8 low-expression group, while the opposite phenomenon was observed in terms of tumor purity. In addition, the immune-related subtypes (C2, C3, and C4) in LUAD have lower expression of SLC6A8 compared to other subtypes. This further supports our speculation that SLC6A8 overexpression in LUAD TIME mediates poor immune prognosis.
Marker proteins, also called immunomodulators, on the surface of immune cells in the tumor microenvironment can regulate the TIME. These proteins are classified as immunostimulators and immunoinhibitors, and studies have shown that immunomodulators have a significant impact on patient prognosis (Mahoney et al., 2015). To take this into consideration as a part of our prognostic model, we constructed immune signatures based on SLC6A8-related 44 immunomodulators. According to the multivariate Cox proportional hazard model, it indicated that the groups deemed high-risk by the model were associated with poor prognosis, and the model has good prediction accuracy in the training and testing sets. Moreover, univariate and multivariate Cox analyses demonstrated that the model’s risk scoring was an independent risk factor for the prognosis of LUAD patients. This further demonstrates that SLC6A8 is associated with poor prognosis in the TIME of LUAD.
However, as most of our data comes from online databases, the veracity and applicability of the results is limited by data available these open databases. Clinical validation of the model is still necessary. Subsequent studies on the immune mechanism of SLC6A8 associated with LUAD would also be essential in proving its potential as a prognostic biomarker.
In summary, we performed Kaplan-Meier survival analysis with respect to SLC6A8 expression, multivariate Cox analysis from combining clinical factors, Kaplan-Meier survival analysis in genetic alterations, and immune prognostic analysis based on the TIME all suggest that SLC6A8 is associated with poor prognosis in LUAD. Therefore, SLC6A8 may act as a biomarker for prognosis in LUAD.
Data Availability Statement
The original contributions presented in the study are included in the article/Supplementary Material, further inquiries can be directed to the corresponding author.
Ethics Statement
The studies involving human participants were reviewed and approved by Changzhou No. 2 People's Hospital Medical Ethics Committee. The patients/participants provided their written informed consent to participate in this study.
Author Contributions
This study and manuscript were designed and written by YF and YZ. The experiments were completed by YF and ML. Data compilation was analyzed by ZG. XL was responsible for the literature search to improve the project and revise the manuscript. All authors reviewed the manuscript and approved the manuscript for publication.
Funding
This work is supported by “333 Project” of Jiangsu Province (Grant number: BRA2020157). 333 High-Level Talent Training Project (Grant number: 2022-2). Supported by Changzhou Sci &Tech Program (Grant number: CJ20210060)“Six One Project,”Research Projects of High-level Medical Personnel of Jiangsu Province (Grant number: LGY2019025). High-level Talent Selection and Training Project of the 16th Batch of“Six Talent Peak”in Jiangsu Province (Grant number: WSN-245). Medical Scientific Research Foundation of Jiangsu Commission of Health (Grant number: H2018083). Jiangsu Provincial Medical Youth Talent (Jiangsu Health Scientific Education 2017 no. 3). High-Level Medical Talents Training Project (Grant number: 2016CZBJ042).
Conflict of Interest
The authors declare that the research was conducted in the absence of any commercial or financial relationships that could be construed as a potential conflict of interest.
Publisher’s Note
All claims expressed in this article are solely those of the authors and do not necessarily represent those of their affiliated organizations, or those of the publisher, the editors and the reviewers. Any product that may be evaluated in this article, or claim that may be made by its manufacturer, is not guaranteed or endorsed by the publisher.
Acknowledgments
We would like to express our sincere appreciation for the platforms and datasets from TCGA, Oncomine, cBioPortal, Kaplan-Meier Plotter, CIBERSORT, ESTIMATE, TISIDB, STRING and WebGestalt open databases.
Supplementary Material
The Supplementary Material for this article can be found online at: https://www.frontiersin.org/articles/10.3389/fgene.2022.845373/full#supplementary-material
Abbreviations
AOD, average optical density; AUC, areas under curve; C-index, concordance index; CIBERSORT, cell type identification by estimating relative subsets of RNA transcripts; DFS, disease-free survival; ESTIMATE, estimation of stromal and immune cells in malignant tumor tissues using expression data; FP, first progression; LUAD, lung adenocarcinoma; GO, Gene Ontology; KEGG, kyoto encyclopedia of genes and genomes; LASSO, least absolute shrinkage and selection operator; TCGA, the cancer genome atlas; OS, overall survival; TMA, tissue microarray.
References
Becht, E., Giraldo, N. A., Lacroix, L., Buttard, B., Elarouci, N., Petitprez, F., et al. (2016). Estimating the Population Abundance of Tissue-Infiltrating Immune and Stromal Cell Populations Using Gene Expression. Genome Biol. 17 (1), 218. doi:10.1186/s13059-016-1070-5
Binnewies, M., Roberts, E. W., Kersten, K., Chan, V., Fearon, D. F., Merad, M., et al. (2018). Understanding the Tumor Immune Microenvironment (TIME) for Effective Therapy. Nat. Med. 24 (5), 541–550. doi:10.1038/s41591-018-0014-x
Cho, J., Kim, E. S., Kim, S. J., Lee, Y. J., Park, J. S., Cho, Y.-J., et al. (2016). Long-Term Follow-Up of Small Pulmonary Ground-Glass Nodules Stable for 3 years: Implications of the Proper Follow-Up Period and Risk Factors for Subsequent Growth. J. Thorac. Oncol. 11 (9), 1453–1459. doi:10.1016/j.jtho.2016.05.026
Chong, W., Shang, L., Liu, J., Fang, Z., Du, F., Wu, H., et al. (2021). m6A Regulator-Based Methylation Modification Patterns Characterized by Distinct Tumor Microenvironment Immune Profiles in Colon cancerA Regulator-Based Methylation Modification Patterns Characterized by Distinct Tumour Microenvironment Immune Profiles in Colon Cancer. Theranostics 11 (5), 2201–2217. doi:10.7150/thno.52717
Colas, C., Banci, G., Martini, R., and Ecker, G. F. (2020). Studies of Structural Determinants of Substrate Binding in the Creatine Transporter (CreaT, SLC6A8) Using Molecular Models. Sci. Rep. 10 (1), 6241. doi:10.1038/s41598-020-63189-z
Costa-Pinheiro, P., Montezuma, D., Henrique, R., and Jerónimo, C. (2015). Diagnostic and Prognostic Epigenetic Biomarkers in Cancer. Epigenomics 7 (6), 1003–1015. doi:10.2217/epi.15.56
DeBerardinis, R. J., Lum, J. J., Hatzivassiliou, G., and Thompson, C. B. (2008). The Biology of Cancer: Metabolic Reprogramming Fuels Cell Growth and Proliferation. Cell Metab. 7 (1), 11–20. doi:10.1016/j.cmet.2007.10.002
Di Biase, S., Ma, X., Wang, X., Yu, J., Wang, Y.-C., Smith, D. J., et al. (2019). Creatine Uptake Regulates CD8 T Cell Antitumor Immunity. J. Exp. Med. 216 (12), 2869–2882. doi:10.1084/jem.20182044
Feng, Y., Guo, X., and Tang, H. (2021). SLC6A8 Is Involved in the Progression of Non-small Cell Lung Cancer through the Notch Signaling Pathway. Ann. Transl. Med. 9 (3), 264. doi:10.21037/atm-20-5984
Hegde, P. S., Karanikas, V., and Evers, S. (2016). The where, the when, and the How of Immune Monitoring for Cancer Immunotherapies in the Era of Checkpoint Inhibition. Clin. Cancer Res. 22 (8), 1865–1874. doi:10.1158/1078-0432.ccr-15-1507
Hou, J., Aerts, J., den Hamer, B., van IJcken, W., den Bakker, M., Riegman, P., et al. (2010). Gene Expression-Based Classification of Non-small Cell Lung Carcinomas and Survival Prediction. PLoS One 5 (4), e10312. doi:10.1371/journal.pone.0010312
Ji, L., Zhao, X., Zhang, B., Kang, L., Song, W., Zhao, B., et al. (2019). Slc6a8-Mediated Creatine Uptake and Accumulation Reprogram Macrophage Polarization via Regulating Cytokine Responses. Immunity 51 (2), 272–284. doi:10.1016/j.immuni.2019.06.007
Kok, V. C., and Yu, C.-C. (2020). Cancer-Derived Exosomes: Their Role in Cancer Biology and Biomarker Development. Ijn 15, 8019–8036. doi:10.2147/ijn.s272378
Kurth, I., Yamaguchi, N., Andreu-Agullo, C., Tian, H. S., Sridhar, S., Takeda, S., et al. (2021). Therapeutic Targeting of SLC6A8 Creatine Transporter Suppresses Colon Cancer Progression and Modulates Human Creatine Levels. Sci. Adv. 7 (41), eabi7511. doi:10.1126/sciadv.abi7511
Lee, H. W., Jin, K.-N., Lee, J.-K., Kim, D. K., Chung, H. S., Heo, E. Y., et al. (2019). Long-Term Follow-Up of Ground-Glass Nodules after 5 Years of Stability. J. Thorac. Oncol. 14 (8), 1370–1377. doi:10.1016/j.jtho.2019.05.005
Li, B., Severson, E., Pignon, J.-C., Zhao, H., Li, T., Novak, J., et al. (2016). Comprehensive Analyses of Tumor Immunity: Implications for Cancer Immunotherapy. Genome Biol. 17 (1), 174. doi:10.1186/s13059-016-1028-7
Li, Q., Liu, M., Sun, Y., Jin, T., Zhu, P., Wan, X., et al. (2021). SLC6A8-mediated Intracellular Creatine Accumulation Enhances Hypoxic Breast Cancer Cell Survival via Ameliorating Oxidative Stress. J. Exp. Clin. Cancer Res. 40 (1), 168. doi:10.1186/s13046-021-01933-7
Li, Z., and Zhang, H. (2016). Reprogramming of Glucose, Fatty Acid and Amino Acid Metabolism for Cancer Progression. Cell. Mol. Life Sci. 73 (2), 377–392. doi:10.1007/s00018-015-2070-4
Loo, J. M., Scherl, A., Nguyen, A., Man, F. Y., Weinberg, E., Zeng, Z., et al. (2015). Extracellular Metabolic Energetics Can Promote Cancer Progression. Cell 160 (3), 393–406. doi:10.1016/j.cell.2014.12.018
Mahoney, K. M., Rennert, P. D., and Freeman, G. J. (2015). Combination Cancer Immunotherapy and New Immunomodulatory Targets. Nat. Rev. Drug Discov. 14 (8), 561–584. doi:10.1038/nrd4591
Molina, J. R., Yang, P., Cassivi, S. D., Schild, S. E., and Adjei, A. A. (2008). Non-small Cell Lung Cancer: Epidemiology, Risk Factors, Treatment, and Survivorship. Mayo Clin. Proc. 83 (5), 584–594. doi:10.1016/s0025-6196(11)60735-0
Newman, A. M., Liu, C. L., Green, M. R., Gentles, A. J., Feng, W., Xu, Y., et al. (2015). Robust Enumeration of Cell Subsets from Tissue Expression Profiles. Nat. Methods 12 (5), 453–457. doi:10.1038/nmeth.3337
Oudkerk, M., Liu, S., Heuvelmans, M. A., Walter, J. E., and Field, J. K. (2021). Lung Cancer LDCT Screening and Mortality Reduction - Evidence, Pitfalls and Future Perspectives. Nat. Rev. Clin. Oncol. 18 (3), 135–151. doi:10.1038/s41571-020-00432-6
Pavlova, N. N., and Thompson, C. B. (2016). The Emerging Hallmarks of Cancer Metabolism. Cell Metab. 23 (1), 27–47. doi:10.1016/j.cmet.2015.12.006
Ru, B., Wong, C. N., Tong, Y., Zhong, J. Y., Zhong, S. S. W., Wu, W. C., et al. (2019). TISIDB: an Integrated Repository Portal for Tumor-Immune System Interactions. Bioinformatics 35 (20), 4200–4202. doi:10.1093/bioinformatics/btz210
Schneider, C. A., Rasband, W. S., and Eliceiri, K. W. (2012). NIH Image to ImageJ: 25 Years of Image Analysis. Nat. Methods 9 (7), 671–675. doi:10.1038/nmeth.2089
Siegel, R. L., Miller, K. D., Fuchs, H. E., and Jemal, A. (2021). Cancer Statistics, 2021. CA A Cancer J. Clin. 71 (1), 7–33. doi:10.3322/caac.21654
Stearman, R. S., Dwyer-Nield, L., Zerbe, L., Blaine, S. A., Chan, Z., Bunn, P. A., et al. (2005). Analysis of Orthologous Gene Expression between Human Pulmonary Adenocarcinoma and a Carcinogen-Induced Murine Model. Am. J. Pathology 167 (6), 1763–1775. doi:10.1016/s0002-9440(10)61257-6
Su, L.-J., Chang, C.-W., Wu, Y.-C., Chen, K.-C., Lin, C.-J., Liang, S.-C., et al. (2007). Selection of DDX5 as a Novel Internal Control for Q-RT-PCR from Microarray Data Using a Block Bootstrap Re-sampling Scheme. BMC Genomics 8, 140. doi:10.1186/1471-2164-8-140
Travis, W. D., Garg, K., Franklin, W. A., Wistuba, I. I., Sabloff, B., Noguchi, M., et al. (2006). Bronchioloalveolar Carcinoma and Lung Adenocarcinoma: the Clinical Importance and Research Relevance of the 2004 World Health Organization Pathologic Criteria. J. Thorac. Oncol. 1, S13–S19. doi:10.1016/s1556-0864(15)30004-6
Urabe, F., Kosaka, N., Ito, K., Kimura, T., Egawa, S., and Ochiya, T. (2020). Extracellular Vesicles as Biomarkers and Therapeutic Targets for Cancer. Am. J. Physiology-Cell Physiology 318 (1), C29–c39. doi:10.1152/ajpcell.00280.2019
Vander Heiden, M. G., and DeBerardinis, R. J. (2017). Understanding the Intersections between Metabolism and Cancer Biology. Cell 168 (4), 657–669. doi:10.1016/j.cell.2016.12.039
Yoshihara, K., Shahmoradgoli, M., Martínez, E., Vegesna, R., Kim, H., Torres-Garcia, W., et al. (2013). Inferring Tumour Purity and Stromal and Immune Cell Admixture from Expression Data. Nat. Commun. 4, 2612. doi:10.1038/ncomms3612
Yuan, L., Wu, X. J., Li, W. C., Zhuo, C, Xu, Z, Tan, C, et al. (2020). SLC6A8 Knockdown Suppresses the Invasion and Migration of Human Hepatocellular Carcinoma Huh-7 and Hep3B Cells. Technol. Cancer Res. Treat. 19, 1533033820983029. doi:10.1177/1533033820983029
Zhang, B., Wu, Q., Li, B., Wang, D., Wang, L., and Zhou, Y. L. (2020). m6A Regulator-Mediated Methylation Modification Patterns and Tumor Microenvironment Infiltration Characterization in Gastric cancerA Regulator-Mediated Methylation Modification Patterns and Tumour Microenvironment Infiltration Characterization in Gastric Cancer. Mol. Cancer 19 (1), 53. doi:10.1186/s12943-020-01170-0
Keywords: SLC6A8, lung adenocarcinoma, prognosis, biomarker, immunomodulator
Citation: Fan Y, Zhou Y, Lou M, Gao Z, Li X and Yuan K (2022) SLC6A8 is a Potential Biomarker for Poor Prognosis in Lung Adenocarcinoma. Front. Genet. 13:845373. doi: 10.3389/fgene.2022.845373
Received: 29 December 2021; Accepted: 27 April 2022;
Published: 27 May 2022.
Edited by:
Chuan Lu, Aberystwyth University, United KingdomReviewed by:
Lucia Taja-Chayeb, National Institute of Cancerology (INCAN), MexicoKeiron O’Shea, Aberystwyth University, United Kingdom
Copyright © 2022 Fan, Zhou, Lou, Gao, Li and Yuan. This is an open-access article distributed under the terms of the Creative Commons Attribution License (CC BY). The use, distribution or reproduction in other forums is permitted, provided the original author(s) and the copyright owner(s) are credited and that the original publication in this journal is cited, in accordance with accepted academic practice. No use, distribution or reproduction is permitted which does not comply with these terms.
*Correspondence: Kai Yuan, eXVhbmthaTE5NzhAMTYzLmNvbQ==
†These authors have contributed equally to this work and share first authorship