 Yun Hu
 Hongjie Li1,2
 Jianhong Xia
 Chenhong Li
- 1Shanghai Universities Key Laboratory of Marine Animal Taxonomy and Evolution, Shanghai Ocean University, Shanghai, China
- 2Engineering Research Center of Environmental DNA and Ecological Water Health Assessment, Shanghai Ocean University, Shanghai, China
- 3Shanghai Natural History Museum, Branch of the Shanghai Science and Technology Museum, Shanghai, China
Odontobutis potamophilus is a popular food fish in China, distributed mainly in the middle and lower reaches of the Yangtze River, where it is a famous delicacy and a newly focused species for aquaculture. The wild populations of O. potamophilus are facing the problem of overfishing and habitat degradation. Therefore, it is very necessary to investigate and protect the wild populations of O. potamophilus. In this study, 72 fish were sampled from 18 different sites over its distribution range. Nuclear sequence data of 4,267 loci were collected using a gene-capture method. Phylogenetic reconstruction revealed that there were three major clades: Oujiang clade (OJ), Qiantang and lower Yangtze clade (QY), and middle Yangtze clade (MY). The discriminant analysis of principal components (DAPC) and a STRUCTURE analysis confirmed that there are three major groups within O. potamophilus. A fastsimcoal2 analysis corroborated the population history and suggested that there was discernible gene flow among these three groups, especially between QY and MY. Estimated pairwise FST suggested that Linhai (LH) and Shexian (SX) populations were the most divergent pair (FST = 0.7077). Taking the nucleotide diversity, population divergence, and admixture status altogether into consideration, we recommend that the LH, Gaoyou (GY) and Chaohu (CH) populations could be protected as the preferred resource for breeding projects. According to the results of genetic analyses, all populations of O. potamophilus should be protected due to low genetic diversity.
Introduction
Genus Odontobutis contains a group of freshwater sleepers endemic to China, Japan, and the Korea Peninsula (Wu, 2008). There are eight species within this genus, O. haifengensis, O. hikimius, O. interrupta, O. obscura, O. platycephala, O. potamophilus, O. sinensis, and O. yaluensis (Froese and Daniel, 2014). In China, the two most interested species are O. potamophilus and O. sinensis because of their high economic value, so most of the research was focused on the reproduction and breeding of these two species (Liu et al., 2008; Zhao et al., 2009). Li et al. (2017) compared the average weight and absolute fecundity between O. potamophilus and O. sinensis found from Jiangxi Province of China, and found that O. potamophilus was more suitable for artificial propagation and aquaculture development than O. sinensis.
Odontobutis potamophilus is an economically important fish endemic to China. It is mainly distributed in the middle and lower reaches of the Yangtze River, as well as the Huaihe River, the Qiantang River, and the Oujiang River basins (Wu, 2008). Odontobutis potamophilus is small carnivorous fish that lives at the bottom of lakes, rivers, and ditches. It prefers to inhabit shallow waters where sand, weeds, and gravel are mixed (Wu, 2008). This fish has high meat-to-body weight ratio (64.45%) (Hu et al., 2012), fine meat quality, and a delicious flavor, but its natural yield is low. Therefore, O. potamophilus has become an attractive species for aquaculture in recent years (Wang et al., 2016).
With the increasing market demand, the breeding population of O. potamophilus has been in short supply (Zhang et al., 2019). In addition to being caught directly for the market, wild O. potamophilus has also been caught for the cultivation of cultured parent fish (Zhang et al., 2012). Driven by the rising price (USD 25 per Kg); the fishing enthusiasm of fishermen is unprecedented (Zhang et al., 2012; Zhang et al., 2019). With the increasing pollution of natural waters, the living environment of O. potamophilus was deteriorating and the spawning environment was destroyed repeatedly (Zhu et al., 2014; Wang et al., 2018). As a result of many factors, the natural resources of O. potamophilus were increasingly exhausted and the populations declined seriously (Zhao and Sheng, 2011). In the 2017 IUCN Red List, O. potamophilus was rated as an information deficient (Data Deficient, DD) species (Osipova et al., 2017). Analyzing the population structure of O. potamophilus is the first step to conserver its wild genetic diversity. Wang et al. (2016) hybridized three different geographical populations of O. potamophilus collected from Jiande, Zhejiang Province, Dangtu, Anhui Province, and Taihu, Jiangsu Province. They found that the growth rate of F1 hybrids between different populations was all higher than self-propagated within the same population. Therefore, investigating the genetic diversity of different populations also can provide more favorable germplasm resources for aquaculture. There is an urgent need for the estimation of genetic resources of O. potamophilus.
At present, most genetic studies on O. potamophilus were based on mitochondrial loci (Xu et al., 2015; Zhang et al., 2019), but see Zhu et al. (2014) for developing microsatellite markers for this species and population study covering its partial distribution. They discribed the genetic diversity of O. potamophilus in five populaitons, and suggested that O. potamophilus in those areas can be used for breeding and conservation programs (Zhu et al., 2014). Hou et al. (2014) show that genetic diversity was low (overall Pi = 0.04028) in O. potamophilus, and there was a high degree of differentiation (average FST = 0.92911) among populations, absenting gene flow between populations. However, in the studies of Hou et al. (2014) and Zhu et al. (2014), not the whole distribution range of the species was covered. Some populations of O. potamophilus with low genetic diversity were found (Hou et al., 2014; Zhu et al., 2014). One of the reasons for low genetic diversity could be inbreeding. Low genetic diversity will cause serious ecological consequences, such as reducing the ability of the population to survive in a stressful or changing environment, and eventually extinction (Hughes et al., 2008). Therefore, it is necessary to protect O. potamophilus with low genetic diversity. Most populations of the O. potamophilus from different geographic regions have not expanded (Hou et al., 2014). It is important to use multiple nuclear gene loci to evaluate the genetic resource of O. potamophilus in its whole distribution range.
Various methods have been applied for collecting thousands of nuclear loci for population studies, such as genotyping-by-sequencing (GBS), restriction site associated DNA sequencing (RAD Sequencing) (Baird et al., 2008; Elshire et al., 2011). Another strategy of reduced representative sequencing is through gene capture. Jiang et al. (2019) developed a suite of 4.434 single-copy nuclear gene markers for ray-finned fishes. Those markers can be used to study both phylogenomics and population genomics of ray-finned fishes, and those have been successfully tested in Odontobutis species (Li et al., 2018; Jiang et al., 2019).
In this study, we collected 72 fish from 18 different sites of the Huaihe River, the Yangtze River, the Qiantang River, and the Oujiang River basins. We applied a target-gene enrichment approach (Li et al., 2013) and the next generation sequencing method to obtain a large amount of nuclear gene data, and carried out on estimation of the genetic diversity and population structure of O. potamophilus. The results of this research can provide a reference for the selective breeding programs of O. potamophilus with high genetic diversity or populations with low genetic diversity but unique in terms of genetic composition.
Materials and Methods
Sampling and DNA Extraction
A total of 72 O. potamophilus were collected from Meicheng (MC), Cixi (CX), Hangzhou (HZ), Huzhou (HU), Baoying (BY), Gaoyou (GY), Jingjiang (JJ), Guangfu (GF), Jiangba (JB), Shanghai (SH), Meizhu (MZ), Xingfu (XF), Shuiyang (SY), Chaohu (CH), Zhongmiao (ZM), Luan (LA), Shexian (SX), and Linhai (LH) of the Huaihe River, the Yangtze River, the Qiantang River, and the Oujiang River basins (Table 1; Figure 1). Two samples of O. yaluensis were used as outgroup. Most samples were collected before 2014 when the large-scale artificial breeding and stocking started, so they are a good representation of the wild populations. The fin clips and muscle samples were taken and fixed with 75% ethanol before being brought back to the laboratory and stored at 4°C. All experimental procedures involving fish were approved by the Animal Ethics Committee of Shanghai Ocean University, China. Ezup Column Animal Genomic DNA Purification Kit (Sangon, Shanghai, China) was used to extract DNA from the tissue samples. The concentration of purified DNA was determined by a NanoDrop 3300 Fluorospectrometer (Thermo Fisher Scientific. Wilmington, DE, United States) and visualized using agarose gel electrophoresis.
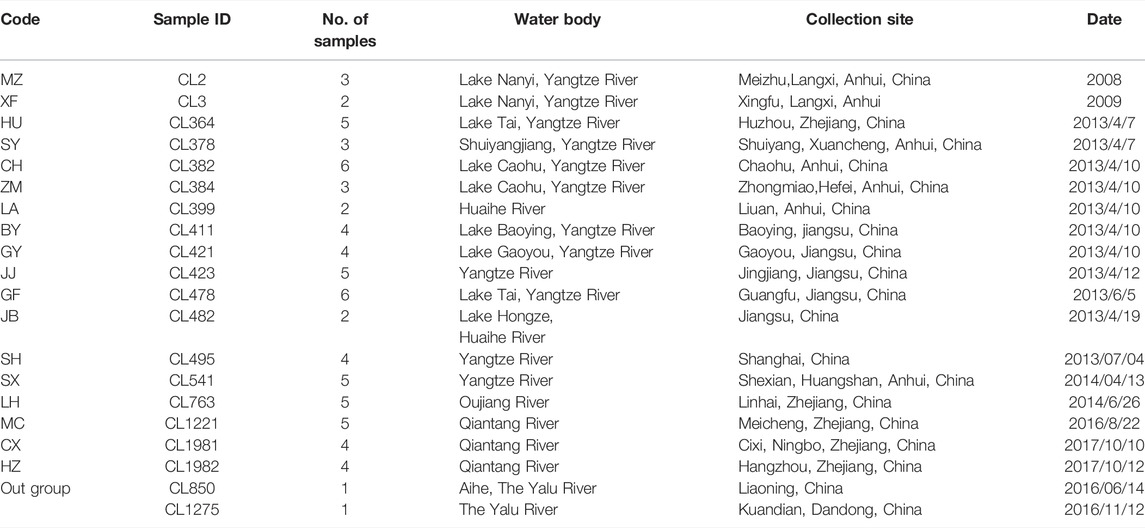
TABLE 1. Sampling sites and date of collection.
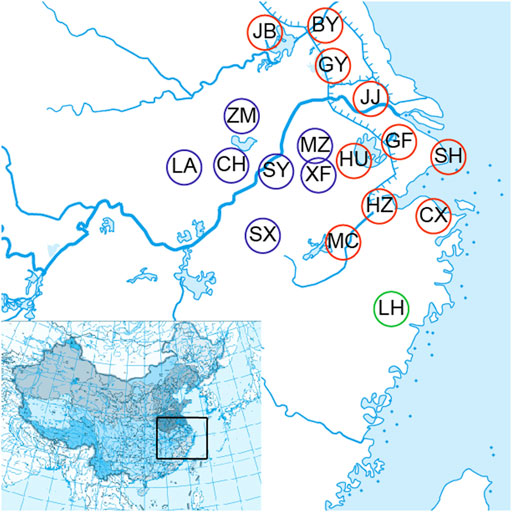
FIGURE 1. Eighteen sample collecting sites of the Odontobutis potamophilus including Meicheng (MC), Cixi (Cx), Hangzhou (Hz), Huzhou (HU), Baoying (by), Gaoyou (Gy), Jingjiang (JJ), Guangfu (GF), Jiangba (JB), Shanghai (SH), Meizhu (MZ), Xingfu (XF), Chaohu (CH), Shuyang (SY), Zhongmiao (ZM), Liu (LA), Shexian (SX), and Linhai (LH).
Library Construction, Gene Capture, and Sequencing
DNA was fragmented to ∼250 bp using a Covaris M220 focused ultrasonicator (Woburn, Massachusetts, United States). One µl of sheared DNA was used in agarose gel electrophoreses to check the size of sheared DNA fragments. The Illumina sequencing libraries were constructed using a modified library preparation method (Meyer and Kircher, 2010; Li et al., 2013). In the ligation step of library preparation, each sample was labeled by adding inline indices to reduce the potential risk of cross-contamination between samples in the subsequent gene capture steps. Inline indices are short 6 bp nucleotide fragments that are connected to the ends of Illumina sequencing primers. The DNA libraries were mixed equimolarly for the subsequent gene capture experiments.
According to the 4,434 single-copy nucleotide coding sequence markers of bony fish developed by Jiang et al. (2019), the RNA baits were redesigned and the area with extreme high read depth in the preliminary experiment was masked. These biotin-labeled RNA baits were synthesized based on the sequence of a freshwater goby, Rhinogobius giurinus. The baits’ length was 80 bp, covering the target sequences with 2X tiling. MYbaits RNA baits targeting the 4,434 loci were synthesized at Arbor Biosciences (Mycroarray, Ann Arbor, Michigan; cat#, 150901-Li-Goby).
Gene capture procedures were repeated twice followed Li et al. (2013). Briefly, sample libraries and baits were hybridized, and then the non-target fragments were washed off. The enriched libraries were amplified using IS4 and a P7 primer with an 8 bp DNA index following Meyer and Kircher (2010). After gene capture, the products were subjected to agarose gel electrophoreses for size selection, and products between 250 bp and 1,000 bp were cut and extracted. Gel extractions were sent to GENWIZ (Shanghai) for sequencing using an Illumina HiSeq platform.
Read Assembly
The raw Illumina data were distinguished by the 8 bp P7 barcodes and the 6 bp inline indices (Yuan et al., 2016). Trim_galore v0.4.1 (http://www.bioinformatics.babraham.ac.uk/projects/trim_galore/, accessed on 10 July 2021) and cutadapt v1.2.1 (Martin, 2011) was used with default parameters to trim the adaptor sequence and reads with low-quality scores (Q < 20). The data assembly process was followed by Yuan et al. (2016). The paralogous sequences were filtered according to Yuan et al. (2016), and only loci captured for more than 30% of all individuals were kept for subsequent analyses. Clustal Omega was used to batch align the DNA sequence based on amino acid codes (Sievers et al., 2011).
SNP Calling and Population Genetic Metrics
After aligning the assembled results and removing low-quality sequences, pick_taxa.pl was used to construct consensus sequences as a reference for SNP calling, and SNPs from coding regions were targeted (Yuan et al., 2016). The cleaned reads were mapped to consensus sequences using bwa v0.7.16a-r1181 (Li and Durbin, 2009). Samtools were used to convert the same files into binary BAM files (Li et al., 2009). Picard (http://broadinstitute.github.io/picard) was used to remove PCR repeats. GATK-3.4.0 (McKenna et al., 2010) was used to genotype the SNP loci. Thirty individuals of SH, JB, GY, BY, JJ, HU, and GF were selected for the Hardy Weinberg equilibrium test using VCFtools (Danecek et al., 2011), because our preliminary analysis suggested those would be a panmictic population. Loci that did not conform to Hardy Weinberg equilibrium were identified and removed from VCF files generated for all individuals (72 samples). SNPs were screened with the parameters including MAF> 0.05, max-missing set as 0.90, and min-meANDP set as 6 using VCFtools. Only one SNP with the least missing data and the highest quality score was retained for each locus to meet the linkage balance requirements of subsequent analyses. The optimal SNP sites of the populations were selected, and the mean pairwise population differentiation (FST), nucleotide diversity (pi), and mean genetic distance (Phi_st) were calculated in the Stacks program (Catchen et al., 2013). According to the FST values between the two populations, the existence and degree of differentiation between the two populations were inferred (Wright, 1968).
Population Clustering and Genetic Structure
The captured genes were concatenated for phylogenetic tree inference. The phylogenetic tree was constructed using the maximum likelihood method to reveal the relationship of 72 O. potamophilus with two O. yaluensis as outgroups. The ML tree was reconstructed using RAxMLv8.0.0 under the GTRGAMMA model with 1000 bootstraps (Stamatakis, 2014). Figtree v1.4.2 was used to visualize the results (http://tree.bio.ed.ac.uk/software/Figuretree/).
STRUCTURE v2.3.4 (Pritchard et al., 2000) was used to evaluate the population structure of the 72 individuals of O. potamophilus. The individuals were coded as 18 populations according to their geographical sampling sites. The STRUCTURE operating parameter was set to 20,000 for the length of the burn-in period, and 200,000 for the number of MCMC reps after burn-in. The analyses of k = 1–18 were repeated five times. The most likely K value was determined using Structure Harvester 0.6.93 (Earl, 2012).
The discriminant analysis of principal components (DAPC) was performed twice for each replication using R (Team, 2013) package adegenet version 2.1.1 (Jombart, 2008). The first time was used to evaluate the optimal number of PCs, and this value was used for the second analysis. The 72 individuals were divided into 18 groups by sampling sites for the cluster parameters. According to the number of PC lowest RMSE, the number of PCs chosen (≥1) was 10, and the number of distinct functions (≥1) was three. The scattering parameter was used for drawing.
History of Population Divergence
The results of cluster analysis showed that fish from the 18 sampling sites could be lumped into three major groups: The Oujiang clade (OJ), the Qiantang and lower Yangtze clade (QY), and the middle Yangtze clade (MY). We hypothesized four models for the evolutionary history of the three groups: model 1–3, either OJ, QY, or MY diverged first from the other two groups; model 4, the best model from the previous three but with migration allowed between different groups.
Different models were tested using fastsimcoal2 version 2.7 (Excoffier, 2011; Excoffier and Foll, 2011; Excoffier et al., 2021). Fastsimcoal2 can infer the population history by simulating historical events; it also can use the joint site frequency spectrum (JSFS) between populations as a summary statistics. Parameters include time, source, sink, migrants, new size, new growth rate, and migration matrix. The VCF file was converted into *.arp file using PGDSpider 2.1.1.5 (Lischer and Excoffier, 2012). The result of the Arp file was used as the input file for Alequin3.5 (Excoffier and Lischer, 2006) to calculate the site frequency spectrum (SFS). Based on the calculated SFS file (*.obs), different evolution scenarios were simulated in Fastsimcoal 2.7. Each model runs 100 independent point estimates, including 100 K coalescent simulation, and 30 ECM cycles (“-L 30”). The optimal JSFS observed by the model was compared with the Akaike information criterion (AIC). The conditional interval (CI) of the optimal model’s point estimation was performed at 10 runs per bootstrapped SFS.
Results
Next-Generation Sequencing Data
A total of 287,518,950 reads were generated, with an average of 3,993,319 reads per individual. A total of 223,207,564 reads were retained, after the adapter sequences and the low-quality sequence (Q < 20) were trimmed, with an average of 3,100,106 reads per individual. After excluding PCR duplicates, 77.63% of the trimmed data were retained. An average of 2,635 loci were enriched in each sample, with the highest of 3,571 loci captured in CL1221_2, and the lowest of 202 loci in CL 1981_5. There were 3,750 loci on average captured for the two outgroup samples (Supplementary Table S1). After manual examination of all loci of O. potamophilus and O. yaluensis, 4,267 genes (96.23% of 4434 genes) were enriched in more than 22 (>30%) individuals and used for phylogenetic reconstruction.
Genetic Diversity and Differentiation
There were 12,988 SNPs called in total, with an average of 4.9 SNPs per locus. There were 6,045 out of 7,105 variants passing filters and HWE test in the 30 individuals examined. Those 1,060 sites that did not pass the HWE test were removed from the variants in the whole dataset (72 samples), keeping 11,932 out of the 12,988 SNPs. At least one SNP was called for 472 loci after selecting one SNP from each locus to avoid linkage disequilibrium. The average nucleotide diversity (pi) of variant positions was 0.1250 with the highest 0.1846 for MC, and the lowest 0.0471 found in LH (Table 2). Populations with large genetic difference (FST > 0.25) accounted for 60.13%, medium degree of genetic difference (0.25 > FST > 0.15) accounted for 16.34%, and existed genetic difference (0.05 < FST < 0.15) accounted for 23.53%. LH, ZM, LA, and SX were the most divergent populations from the others. The maximum genetic divergence was found between LH and SX (FST = 0.7077), and the lowest genetic differentiation was between GF and HU (FST = 0.0492) (Table 3).
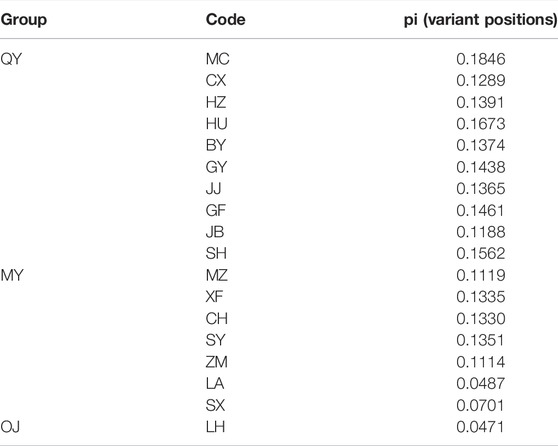
TABLE 2. The nucleotide diversity (pi) of Odontobutis potamophilus of each population, including variant positions and all positions.
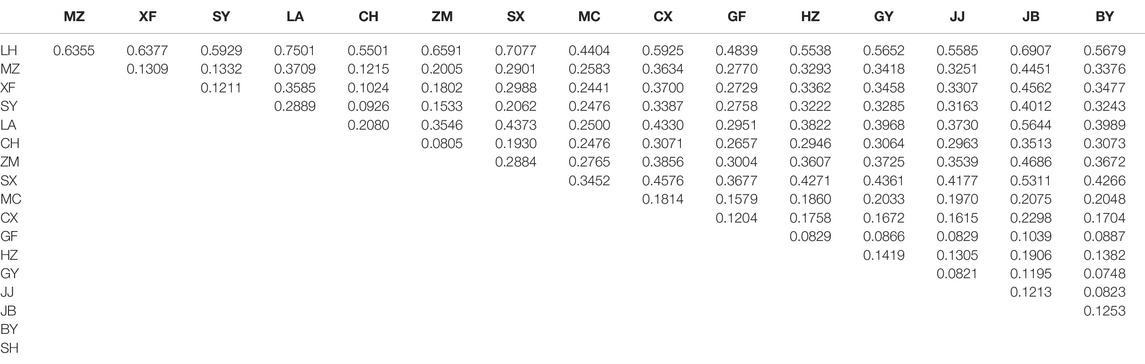
TABLE 3. Pairwise differences (FST) among populations.
Population Structure
The sampled sites can be divided into three groups (k = 3) (Supplementary Figure S1), including the Oujiang group (OJ, green), the Qiantang and lower Yangtze group (QY, red), and the middle Yangtze group (MY, blue) (Supplementary Table S2; Figure 2). Among the three groups, MC and CX populations had the most admixture individuals. These individuals were dominated by red loci, and green and blue loci only accounted for a small part. LH, GY, JB, and SX populations were highly independent, and they had almost no admixture with the other groups. Results of DAPC also showed that the populations of O. potamophilus can be divided into three groups (Figure 3). According to the results of the ML tree (Figure 4), the first clade split off was the Oujiang clade (OJ, green), and then the Qiantang and lower Yangtze clade (QY, red), and the middle Yangtze clade (MY, blue). This pattern cooperated with the results of STRUCTURE analysis and DAPC.
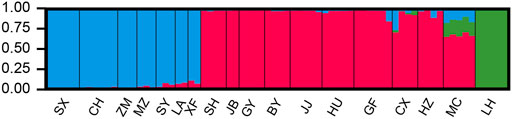
FIGURE 2. The results of STUCTURE analysis of Odontobutis potamophilus populations based on 472 SNP loci. Red denotes the Qiantang and lower Yangtze group (QY), blue denotes the middle Yangtze group (MY), and green denotes the Oujiang clade (OJ). Each individual is represented by a single bar. The different color on a single bar indicates admixture origin of the individual.
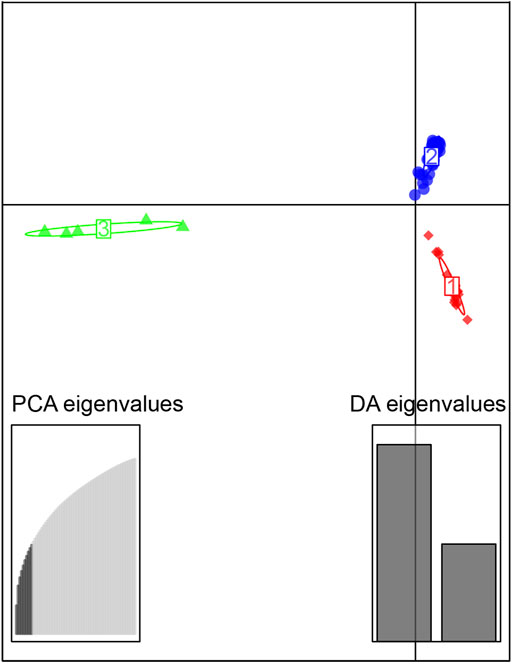
FIGURE 3. Scatterplot generated by the discriminant analysis of principal components (DAPC). The 72 individuals were divided into 3 clusters, red, the Qiantang and lower Yangtze group (QY), blue, the middle Yangtze group (MY), and green, the Oujiang group (OJ).
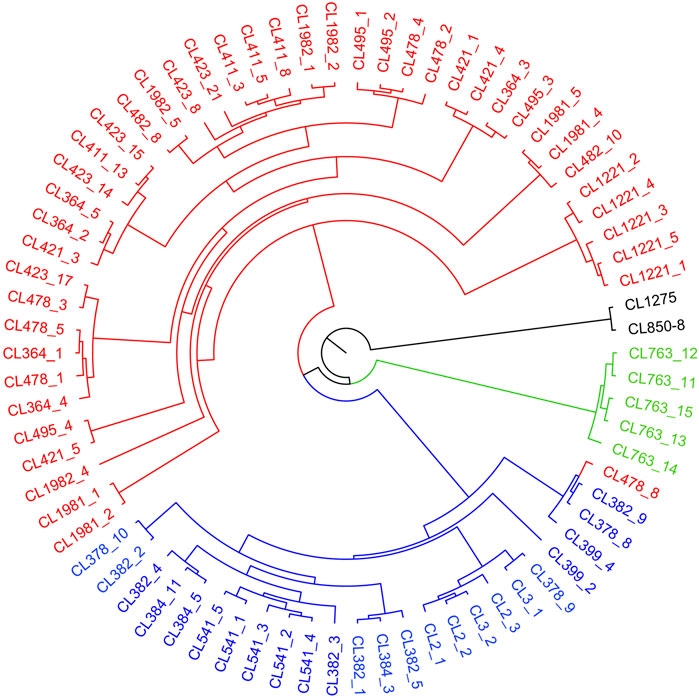
FIGURE 4. A maximum likelihood tree based on captured genes using RAxML under GTRGAMMAR mode with 1,000 bootstrap replicates. The tree consists four parts, including red QY clade (the Qiantang and lower Yangtze clade), blue MY clade (the middle Yangtze clade), green OJ clade (the Oujiang clade), and black outgroup clade.
Historical Population Dynamics of O. potamophilus
The bestlhoods file generated using fastsimcoal2 analyses has two types of likelihoods, including MaxObsLhood and MaxEstLhood. MaxObsLhood is the maximum possible value for the expected SFS to match the observed SFS. MaxEstLhood is the maximum likelihood estimated according to model parameters. The higher the model fit with the population history, the smaller the difference between MaxObsLhood and MaxEstLhood. The MaxObsLhood values of all four models were −155.92 (Table 4). Model 1 had the lowest MaxEstLhood (−222.96) while model 2 had the largest (−228.8) (Supplementary Figure S2). Therefore, the most suitable model among the first three models was model 1. Based on the genetic structure of model 1, the parameters of gene flow were added to formulate model 4. Model 4 had smaller a MaxObsLhood (−217.9) than model 1 (Table 4), and Model 4 also had the lowest AIC value (1013.46), so we chose model 4 as the best model to explain the population history of O. potamophilus (Table 4). According to model 4, the common ancestor A0 differentiated into OJ and A1, and then A1 differentiated into MY and QY clades (Figure 5). There was gene flow among all three clades, but MY and QY clades had higher gene flow. The gene flow between MY and QY clades was 100-fold larger than the gene flow between OJ and QY (or MY) (Figure 6).
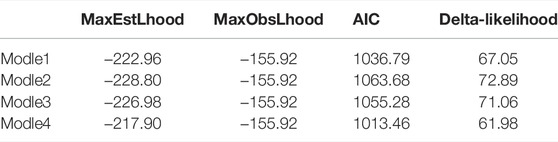
TABLE 4. Comparing different models of population divergence history of Odontobutis potamophilus based on site frequency spectrum (SFS).
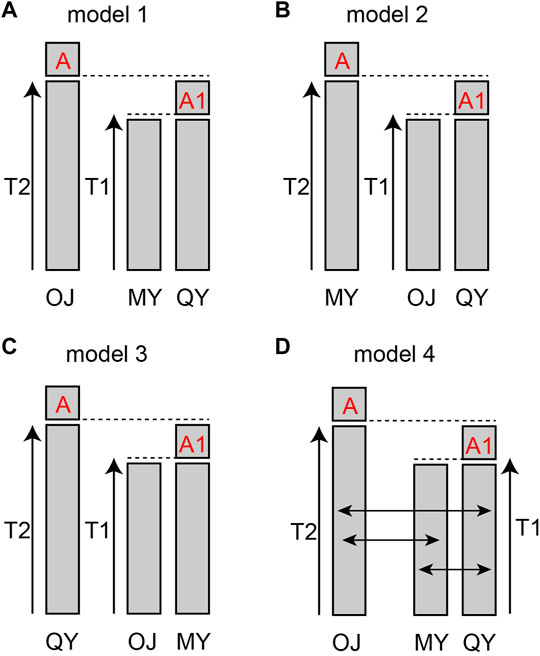
FIGURE 5. Models of population history of Odontobutis potamophilus. (A) OJ split off first, and the other two groups differentiated later from a common ancestor A0. (B) the first population diverged was MY. (C) the first population split off was QY. (D) the gene flow parameters added to model 1.
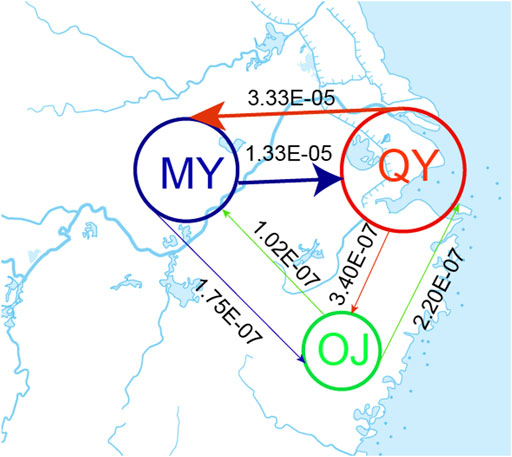
FIGURE 6. Estimated gene flow between adjacent clades. The number on the line showed the strength of gene flow. The Oujiang clade (OJ), the Qiantang and lower Yangtze clade (QY), and the middle Yangtze clade (MY).
Discussions
Genetic Diversity and Candidate Populations for Conservation
Genetic diversity plays an important role in the survival and adaptability of species and it is also considered a basis for genetic breeding and conservation (Frankham, 2005; King and Lively, 2012). This study provides a framework for the conservation of O. potamophilus. The higher the genetic diversity of the populations, the stronger the adaptability to environmental changes. Therefore, populations with high genetic diversity are more suitable as founder population for a breeding program to be protected. The principle of selecting parents is to select populations with high genetic diversity and no admixed individuals in each group as ideal parents. The higher the genetic diversity, the richer the genetic information carried by the species, which is conducive to the subsequent breeding of excellent varieties. On the basis of high genetic diversity, we selected populations from each group without hybridized individuals from the other two groups, so as to avoid carrying the same genetic information between the two populations as parents. Thus, maintaining and improving the good quality of the progenies of O. potamophilus.
In the OJ group, LH was the only population sampled, with a nucleotide diversity of 0.0471. Mean pairwise population differentiation (FST) is an indicator to measure genetic differences between populations. The maximum value of FST was 0.7077 between LH and SX, indicating the greatest genetic difference between the two populations. In fact, the FST values between LH and all other populations were greater than 0.25, suggesting that LH is a unique genetic resource and breeding material. Therefore, LH should be protected for breeding programs, but more sites in the Oujiang River basin should be surveyed to examine the genetic diversity of O. potamophilus within the Oujiang River system. In the MY group, the population with the highest nucleotide diversity was SY (pi = 0.1351). However, many admixed individuals were observed in the SY population, so we should not use it for breeding programs. We suggest that the CH population, which had the second high nucleotide diversity (pi = 0.1330) but with no admixed individuals could be used for breeding projects. In the QY group, the population with the highest nucleotide diversity was MC (pi = 0.1846) but many admixed individuals were found in this population, so we suggest the GY (pi = 0.1438) population as the representative population due to the higher pi value and no admixed individuals. Taking the parameters of nucleotide diversity, FST, and admixture status all into consideration, we suggest that LH, GY, and CH populations should be protected. Those populations could be the preferred resource as founder populations for breeding projects, representing the OJ, QY, and MY groups, respectively.
Conservation is urgently needed in some populations, such as LA (Pi = 0.0487) and SX (Pi = 0.0701), due to their low genetic diversity compared to other populations. In these populations with low genetic diversity, the loss of individuals may lead to a decrease in the ability of the population to adapt to long-term environmental changes. Therefore, populations with low genetic diversity also should be protected, for example, by banning illegal fishing, to prevent anthropogenic destruction of the ecological environment, and creating a favorable habitat environment to maintain the wild populations of O. potamophilus.
Population Structure and History
Odontobutis potamophilus is distributed in the Huaihe River, the Yangtze River, the Qiantang River, and the Oujiang River basins; however, how many divergent groups of O. potamophilus in these river systems have not been identified previously. The results of ML tree, DAPC, and STRUCTURE analyses unequivocally supported the division of O. potamophilus into three groups. The first differentiated group (OJ) was a clade of samples collected from the Oujiang River at Linhai, Zhejiang Province. Compared with other water systems, the Oujiang River is located in the southernmost part of the distribution range, so OJ population can be regarded as an independent population and it is crucial to protect the population of O. potamophilus in Oujiang. The other populations were divided into two groups, with Lake Tai as the boundary. The QY group is located to the east of Lake Tai, which is composed of populations from the Huaihe River, the Qiantang River, and lower Yangtze River. To the west of Lake Tai is MY group, which is composed of populations from the middle Yangtze River in Anhui Province. A similar pattern was also reported in previous research (Li, 2015). Most lakes in the middle and lower reaches of the Yangtze River dried up during the glacial periods due to the decline of sea level (Yang et al., 2000). The decline of sea level might lead to the isolation of the QY group in coastal shelters from the MY group. Lake Tai formed at about 3.7 Ka after the rise of sea level (Hong, 1991). During this period, Lake Tai might become a hybrid zone of QY and MY. The patterns of species differentiation and hybridization around Lake Tai also were found in other fishes, such as Coilia nasus (Cheng et al., 2019).
STRUCTURE results revealed that many populations of MY and QY had gene flow between groups. The geographical locations of these two groups are different sections of the Yangtze River. After the sea level rise, the previously isolated lakes were connected to the Yangtze. Therefore, individuals with admixed alleles of MY and QY were found in populations around Lake Tai, such as SY, XF, and GF. The individuals of LH (OJ group) had little gene flow with QY groups, probably because the Oujiang River has no direct connections with the Qiantang River or the Yangtze River. There were possibly few river capture events between the Oujiang River and the Qiantang River, therefore, a few individuals from MC and CX (the Qiantang River) showed admixture genotype with some alleles from the LH population (Figure 2).
Sample CL478-8 was collected from GF, which belongs to the QY group but clustered with individuals of the MY group in the phylogenetic tree (Figure 4). We speculate that CL478-8 was a hybrid between QY and MY. Moreover, the result of population history dynamics is consistent with the STRUCTURE results, that gene flow between MY and QY was the highest. We suggested that O. potamophilus should be divided into three management units, that is, the group to the east of Lake Tai, the group to the west of Lake Tai, and the Oujiang group.
Perspectives on Selective Breeding of O. potamophilus
If the volume of farmed O. potamophilus can meet consumer demand, the quantities of wild O. potamophilus caught can be reduced. Although artificial breeding of O. potamophilus has been successful, there is yet no selected strain for aquaculture. Nonetheless, within-species crossing produced obvious heterosis in O. potamophilus (Wang et al., 2016), so there is high potential for selective breeding of O. potamophilus. A famous example of breeding based on within-species crossing and subsequent selection is the “GIFT tilapia”. The successful breeding of GIFT tilapia indicates that the high genetic diversity of founder populations can improve the genetic gain of breeding (Ponzoni et al., 2005). We argue that a similar strategy can be applied to the selective breeding of O. potamophilus, that is, a founder population can be formulated by crossing LH, GY, and CH, the representative populations of the three groups to increase the background diversity of the founder population; and, then subsequent selection can be carried out on it. Meanwhile, the wild populations of the three groups should be conserved separately to keep the wild diversity of this fish.
Conclusion
In this study, we found that O. potamophilus could be divided into three major groups. Based on the nucleotide diversity, pairwise population differentiation, and admixture status of the populations analyzed, we recommended three candidates for the founder population and a strategy for selective breeding for O. potamophilus. All of the O. potamophilus populations should be considered for conservation to preserve their genetic diversity.
Data Availability Statement
The datasets presented in this study can be found in online repositories. The names of the repository/repositories and accession number(s) can be found below: https://www.ncbi.nlm.nih.gov/, PRJNA792327.
Ethics Statement
The animal study was reviewed and approved by the Animal Ethics Committee of Shanghai Ocean University, China.
Author Contributions
JX, CL, and YH conceived the research plan. YH and HL did experiments and analyzed data. JX, CL, HL, and YH wrote the draft. All authors edited and approved the final version of the manuscript.
Funding
This work was supported by the Science and Technology Commission of Shanghai Municipality (19050501900) to CL and the Ministry of Science and Technology of the People’s Republic of China (No. 2015FY110200) to JX.
Conflict of Interest
The authors declare that the research was conducted in the absence of any commercial or financial relationships that could be construed as a potential conflict of interest.
Publisher’s Note
All claims expressed in this article are solely those of the authors and do not necessarily represent those of their affiliated organizations, or those of the publisher, the editors, and the reviewers. Any product that may be evaluated in this article, or claim that may be made by its manufacturer, is not guaranteed or endorsed by the publisher.
Acknowledgments
We are grateful to Zhizhi Liu, Jingyan Li, Ting Kuang, Qiang Li, Xin Zheng, and Peiyin Yang for helping with sample collection. We also thank the reviewers for their comments that helped in improving the quality of this article.
Supplementary Material
The Supplementary Material for this article can be found online at: https://www.frontiersin.org/articles/10.3389/fgene.2022.843848/full#supplementary-material
References
Baird, N. A., Etter, P. D., Atwood, T. S., Currey, M. C., Shiver, A. L., Lewis, Z. A., et al. (2008). Rapid SNP Discovery and Genetic Mapping Using Sequenced RAD Markers. PLoS One 3, e3376. doi:10.1371/journal.pone.0003376
Catchen, J., Hohenlohe, P. A., Bassham, S., Amores, A., and Cresko, W. A. (2013). Stacks: an Analysis Tool Set for Population Genomics. Mol. Ecol. 22, 3124–3140. doi:10.1111/mec.12354
Cheng, F., Wang, Q., Maisano Delser, P., and Li, C. (2019). Multiple Freshwater Invasions of the Tapertail Anchovy (Clupeiformes: Engraulidae) of the Yangtze River. Ecol. Evol. 9, 12202–12215. doi:10.1002/ece3.5708
Danecek, P., Auton, A., Abecasis, G., Albers, C. A., Banks, E., Depristo, M. A., et al. (2011). Genomes Project AnalysisThe Variant Call Format and VCFtools. Bioinformatics 27, 2156–2158. doi:10.1093/bioinformatics/btr330
Earl, D. A., and vonHoldt, B. M. (2012). STRUCTURE HARVESTER: a Website and Program for Visualizing STRUCTURE Output and Implementing the Evanno Method. Conserv. Genet. Resour. 4, 359–361. doi:10.1007/s12686-011-9548-7
Elshire, R. J., Glaubitz, J. C., Sun, Q., Poland, J. A., Kawamoto, K., Buckler, E. S., et al. (2011). A Robust, Simple Genotyping-By-Sequencing (GBS) Approach for High Diversity Species. PLoS One 6, e19379. doi:10.1371/journal.pone.0019379
Excoffier, L. (2011). A Continuous-Time Coalescent Simulator of Genomic Diversity under Arbitrarily Complex Evolutionary Scenarios.
Excoffier, L., and Foll, M. (2011). Fastsimcoal: a Continuous-Time Coalescent Simulator of Genomic Diversity under Arbitrarily Complex Evolutionary Scenarios. Bioinformatics 27, 1332–1334. doi:10.1093/bioinformatics/btr124
Excoffier, L., and Lischer, H. (2006). An Integrated Software Package for Population Genetics Data analysisComputational and Molecular Population Genetics Lab (CMPG). Switzerland: Institute of Zoology, University of Berne.
Frankham, R. (2005). Genetics and Extinction. Biol. Conserv. 126, 131–140. doi:10.1016/j.biocon.2005.05.002
Froese, R., and Pauly, D. (Editors) (202). FishBase. World Wide Web Electronic Publication. www.fishbase.org version (02/2022).
Hou, X., Zhu, F., Yin, S., Zhang, L., Hu, Y., Wang, Y., et al. (2014). Genetic Diversity ofOdontobutis Potamophilafrom Different Geographic Populations Inferred from mtDNA Control Region. Mitochondrial DNA 25, 400–406. doi:10.3109/19401736.2013.803084
Hu, Y., Zhu, X., Yin, S., and Zhu, F. (2012). Analysis of Flesh Content and Muscle Nutritional Components of Odontobutis Potamophila. Jiangsu Agric. Sci. 40, 290–293.
Hughes, A. R., Inouye, B. D., Johnson, M. T. J., Underwood, N., and Vellend, M. (2008). Ecological Consequences of Genetic Diversity. Ecol. Lett. 11, 609–623. doi:10.1111/j.1461-0248.2008.01179.x
Jiang, J., Yuan, H., Zheng, X., Wang, Q., Kuang, T., Li, J., et al. (2019). Gene Markers for Exon Capture and Phylogenomics in Ray‐finned Fishes. Ecol. Evol. 9, 3973–3983. doi:10.1002/ece3.5026
Jombart, T. (2008). Adegenet: a R Package for the Multivariate Analysis of Genetic Markers. Bioinformatics 24, 1403–1405. doi:10.1093/bioinformatics/btn129
King, K. C., and Lively, C. M. (2012). Does Genetic Diversity Limit Disease Spread in Natural Host Populations? Heredity 109, 199–203. doi:10.1038/hdy.2012.33
Li, C., Hofreiter, M., Straube, N., Corrigan, S., and Naylor, G. J. P. (2013). Capturing Protein-Coding Genes across Highly Divergent Species. Biotechniques 54, 321–326. doi:10.2144/000114039
Li, H., and Durbin, R. (2009). Fast and Accurate Short Read Alignment with Burrows-Wheeler Transform. bioinformatics 25, 1754–1760. doi:10.1093/bioinformatics/btp324
Li, H., Handsaker, B., Wysoker, A., Fennell, T., Ruan, J., Homer, N., et al. (2009). The Sequence Alignment/map Format and SAMtools. Bioinformatics 25, 2078–2079. doi:10.1093/bioinformatics/btp352
Li, H., He, Y., Jiang, J., Liu, Z., and Li, C. (2018). Molecular Systematics and Phylogenetic Analysis of the Asian Endemic Freshwater Sleepers (Gobiiformes: Odontobutidae). Mol. Phylogenetics Evol. 121, 1–11. doi:10.1016/j.ympev.2017.12.026
Li, Y., Qiu, W., Wang, H., and Zhu, S. (2017). Morphylogical Characters and Reproductional Study on Odontobutis Species from Jiangxi Province. Jiangxi Fish. Sci. Technol., 7–9.
Lischer, H. E. L., and Excoffier, L. (2012). PGDSpider: an Automated Data Conversion Tool for Connecting Population Genetics and Genomics Programs. Bioinformatics 28, 298–299. doi:10.1093/bioinformatics/btr642
Liu, M., Hu, X.-C., Han, Q., and Luo, Y. (2008). Variation of the Proteinic Enzymes Activities during the Embryonic and Larval Development of Odontobutis Potamophila. Freshw. Fish. 38, 39–41.
Martin, M. (2011). Cutadapt Removes Adapter Sequences from High-Throughput Sequencing Reads. EMBnet J. 17, 10–12. doi:10.14806/ej.17.1.200
Mckenna, A., Hanna, M., Banks, E., Sivachenko, A., Cibulskis, K., Kernytsky, A., et al. (2010). The Genome Analysis Toolkit: a MapReduce Framework for Analyzing Next-Generation DNA Sequencing Data. Genome Res. 20, 1297–1303. doi:10.1101/gr.107524.110
Meyer, M., and Kircher, M. (2010). Illumina Sequencing Library Preparation for Highly Multiplexed Target Capture and Sequencing. Cold Spring Harb. Protoc. 2010, pdb. prot5448. doi:10.1101/pdb.prot5448
Osipova, E., Shadie, P., Zwahlen, C., Osti, M., Shi, Y., Kormos, C., et al. (2017). IUCN World Heritage Outlook 2: A Conservation Assessment of All Natural World Heritage Sites, 92. Gland, Switzerland: IUCN, Gland.
Ponzoni, R. W., Hamzah, A., Tan, S., and Kamaruzzaman, N. (2005). Genetic Parameters and Response to Selection for Live Weight in the GIFT Strain of Nile tilapia (Oreochromis niloticus). Aquaculture 247, 203–210. doi:10.1016/j.aquaculture.2005.02.020
Pritchard, J. K., Stephens, M., and Donnelly, P. (2000). Inference of Population Structure Using Multilocus Genotype Data. Genetics 155, 945–959. doi:10.1093/genetics/155.2.945
Sievers, F., Wilm, A., Dineen, D., Gibson, T. J., Karplus, K., Li, W., et al. (2011). Fast, Scalable Generation of High‐quality Protein Multiple Sequence Alignments Using Clustal Omega. Mol. Syst. Biol. 7, 539. doi:10.1038/msb.2011.75
Stamatakis, A. (2014). RAxML Version 8: a Tool for Phylogenetic Analysis and Post-analysis of Large Phylogenies. Bioinformatics 30, 1312–1313. doi:10.1093/bioinformatics/btu033
Wang, P., Ding, Y., Yu, X., Jia, X., Zhang, G., Yin, S., et al. (2016). Growth Trait and Genetic Diversity in the F1 Progeny of Dark Sleeper Odontobutis Potamophila from Three Different Populations. Fish. Sci. 35, 528–534.
Wang, P., Zhao, C., Chen, S., Yin, S., Wang, Q., Li, Z., et al. (2018). Parentage Identification of Odontobutis Potamophlia Based on Microsatellite DNA Markers. J. Genet. 97, 563–568. doi:10.1007/s12041-018-0933-9
Wright, S. (1968). “Evolution and the Genetics of Populations,” in Genetic and Biometric Foundations (Chicago, IL: Univ. of Chicago Press), 1.
Wu, H., Zhong, J., Chen, I. S., Chong, D., Ni, Y., Shen, G., et al. (2008). Fauna Sinica: Ostichthyes. Perciformes. Gobioidei. V. Beijing, China: Science Press.
Xu, Y., Zhong, L., Li, X., Zhu, X., Wang, C., and Shi, Y. (2015). Genetic Variation Analysis of Odontobutis Potamophila from Five Lakes Based on Mitochondrial DNA Cyt B. J. Lake Sci. 27, 693–699.
Yang, D., Li, X., and Zhang, Z. (2000). Lake Evolution along Middle-Lower Reaches of the Yangtze River. J. Lake Sci. 12, 232–238.
Yuan, H., Jiang, J., Jiménez, F. A., Hoberg, E. P., Cook, J. A., Galbreath, K. E., et al. (2016). Target Gene Enrichment in the Cyclophyllidean Cestodes, the Most Diverse Group of Tapeworms. Mol. Ecol. Resour. 16, 1095–1106. doi:10.1111/1755-0998.12532
Zhang, G., Shi, Y., Zhang, H., Lu, G., and Qiao, Y. (2012). The Techniques of Raising Odontobutis Potamophila 1. Biology and Marketing Potentials. Fish. Sci. Technol. Inf. 39, 123–127.
Zhang, Y., Ling, J., Duan, G., Hu, Y., Pan, T., Zhou, H., et al. (2019). Genetic Diversity and Population Structure Analyses of Odontobutis Potamophila from Different Geographic Populations in Anhui Province. J. Anhui Agric. Univ. 46, 383–388.
Zhao, J., and Sheng, J. (2011). Experiments on Artificial Breeding and Seed Rearing of Odontobutis Potamophila. Fish. Sci. Technol. Inf. 38, 118–120.
Zhao, X.-Q., Chen, L.-Q., Gu, Z.-M., Li, E.-C., and Yao, Q. (2009). Effects of Starvation on Ovarian Development in Female Odontobutis Potamophila during Over-wintering Period. J. Fish. China 33, 70–77.
Keywords: Odontobutis potamophilus, population structure, conservation, genetic diversity, gene capture, genetic resource
Citation: Hu Y, Li H, Xia J and Li C (2022) Population Structure, Genetic Diversity, and Conservation Strategies of a Commercially Important Sleeper Fish, Odontobutis potamophilus (Gobiiformes: Odontobutidae) Based on Gene-Capture Data. Front. Genet. 13:843848. doi: 10.3389/fgene.2022.843848
Received: 27 December 2021; Accepted: 21 April 2022;
Published: 24 May 2022.
Edited by:
Narongrit Muangmai, Kasetsart University, ThailandReviewed by:
Sofia Priyadarsani Das, Central Institute of Freshwater Aquaculture (ICAR), IndiaAgus Nuryanto, Jenderal Soedirman University, Indonesia
Copyright © 2022 Hu, Li, Xia and Li. This is an open-access article distributed under the terms of the Creative Commons Attribution License (CC BY). The use, distribution or reproduction in other forums is permitted, provided the original author(s) and the copyright owner(s) are credited and that the original publication in this journal is cited, in accordance with accepted academic practice. No use, distribution or reproduction is permitted which does not comply with these terms.
*Correspondence: Jianhong Xia, c25obWljaHRoQGhvdG1haWwuY29t; Chenhong Li, Y2hsaUBzaG91LmVkdS5jbg==